Hydrogen peroxide as a natural tracer of mixingin surface layers
Norman M. Scully1, *, Warwick F. Vincent1, David R.S. Lean2, Sally MacIntyre3
1 Département de biologie & Centre d’études nordiques, Université Laval, Sainte-Foy, Québec,G1K 7P4 Canada
2 Department of Biology, University of Ottawa, P.O. Box 450, Station A, Ottawa, Ontario,K1N 6N5 Canada
3 Marine Science Institute, UCSB, Santa Barbara, California, 93106 USA
Key words: H2O2, tracer, mixing, lakes, eddy diffusion coefficient, UV.
ABSTRACT
Vertical eddy diffusion coefficients (Kz) were estimated for the epilimnion of lakes using hydrogenperoxide (H2O2) as a natural, photochemically produced tracer. Modelled profiles of H2O2 pro-duction were combined with observed profiles from the photochemically active region and thewaters below in which H2O2 had penetrated to calculate Kz values for the epilimnion of Lakes Erieand Ontario, and for two bays in a small lake in Ontario, Canada (Jacks Lake). Kz values in bothLake Erie and Lake Ontario were 10–5 to 10–2 m2 s–1 during our study period. Values of Kz fromJacks Lake reflected the prevailing wind conditions but also varied with site. In a wide (3 km) baywith relatively clear water, Kz values ranged from 10–5 m2 s–1 during calm periods to 10–4 m2 s–1
during windy periods. The Kz values were lower in the smaller bay with higher concentrations ofdissolved humic material, increasing from 10–6 m2 s–1 during calm periods to 10–4 m2 s–1 duringwind-induced mixing. The differences in Kz, as determined by this photochemical tracer, a func-tion of lake surface area and wind speed support the applicability of H2O2 in quantifying verticalmixing in the surface layer of small and large lakes.
Introduction
Microstructure temperature profiles have revealed that mixing patterns in lakes aremore complex than depicted in the traditional limnological literature (Spigel andImberger, 1987). The epilimnion of lakes can no longer be considered a homo-genous layer of uniform mixing but rather a composite of many sublayers that varyin thickness and mixing velocities (Imberger and Spigel, 1987; MacIntyre, 1993).This heterogeneity can play an important role in controlling light exposure andnutrient cycling. The residence time of plankton within each sublayer will influencetheir growth and physiological responses (Vincent, 1990; Frenette et al., 1996) in-
Aquat.sci.60 (1998) 169–1861015-1621/98/020169-18 $ 1.50+0.20/0© Birkhäuser Verlag, Basel, 1998 Aquatic Sciences
* Corresponding author.

cluding for instance damage-repair responses to solar UV radiation (Prézelin et al.,1991; Milot-Roy and Vincent, 1994). The estimation of the mixing of particles at the surface of lakes is therefore critical and can be determined through calculationof a vertical eddy diffusion coefficient (Kz) in units of m2 s–1 with the equation; F = –Kz (dS/dZ) where F is the flux of S and (dS/dZ) the concentration gradient.Thus once the Kz is known, the flux and residence time of dissolved substances (e.g.,nutrients, oxygen) and small particulates (e.g., bacterioplankton, small celledphytoplankton) can be estimated for the various sublayers of lakes.
A variety of methods are available to measure turbulent diffusion in naturalwaters but each has logistic and interpretational difficulties. Temperature gradientsin the water column obtained through fine structure temperature profiles in combi-nation with the measurement of heat balance terms is a traditional approachtowards determining lake-wide Kz values (Jassby and Powell, 1975). However, hori-zontal advection can cause significant changes in the vertical heat distribution andcan result in misleading estimates of vertical exchange rates unless sampling is lake-wide (Jellison and Melack, 1993).
High resolution microstructure temperature profiles (vertical resolution of mm)can provide valuable information on mixing processes in lakes (Imberger and Pat-terson, 1990; MacIntyre, 1993) and an instantaneous depiction of the turbulencefield. However limnologists are generally more interested in determining verticalmovement over longer time scales. Lakewide average values of eddy diffusivitiescould be calculated from a time-series of microstructure profiles but the necessarysampling intensity over time and space may be logistically difficult and expensive.
Acoustic techniques have been used to measure turbulence (Menemenlis, 1994;Farmer et al., 1987). Since turbulent eddies cause fluctuations in the refractive indexfor sound, they can be detected using acoustical instrument arrays. In general such techniques are more applicable to oceans where the density fluctuations aregreater.
Chemical tracers have been used in many studies of vertical mixing (Spigel andImberger, 1987; Maiss et al., 1994; Wüest et al., 1996). Wüest et al. (1996) for exam-ple compared vertical diffusivities derived from microstructure measurements andtracer diffusivities determined from the vertical movement of sulfur hexafluoride(SF6) in the hypolimnion of a Swiss lake. The values obtained from the two methodswere within a factor of two. Tracers such as SF6 provide reliable estimates of Kz butrequire that the tracer to be followed over substantial depth and time scales.
Hydrogen peroxide has a number of properties which make it a potentiallyattractive choice as a tracer for lake and ocean mixing. It is produced near the sur-face at a rate predicted from measured variables (UV irradiance, quantum yield,dark decay rates; Scully et al., 1995) and its subsequent redistribution through thewater column could provide a measure of vertical mixing. When UV radiation isabsorbed by dissolved organic carbon (DOC), photochemical reactions may resultin part of the energy reducing dissolved ground state O2 into superoxide (O2
–).Superoxide may then disproportionate to the metastable chemical species hydrogenperoxide (H2O2) (Cooper et al., 1989a). H2O2 has a relatively long half-life (4–20 h;Cooper et al., 1994) unlike other photochemically produced reactive oxygen species(e.g., t1/2 = 3 ms for singlet oxygen; Hoigné et al., 1989; Hoigné, 1990). Since the timescale for mixing processes in the diurnal mixed layer is approximately 0.5 to 30 h
170 Scully et al.

(Imberger, 1985), photochemically produced H2O2 has the appropriate kinetics ofproduction and loss to be useful as a natural hydrodynamic tracer.
Although several authors have identified the potential value of using measuredconcentrations of hydrogen peroxide as a tracer (Johnson et al., 1986; Cooper et al.,1994; Miller 1994; Scully and Vincent, 1997), no studies to date have used [H2O2] ina quantitative manner to determine mixing rates in natural waters. Sikorski andZika, (1993a, b) modelled the distribution of [H2O2] in the Caribbean Sea. Howeverthey used chemical and physical parameters to reconstruct [H2O2] profiles ratherthan use [H2O2] as a quantitative guide to mixing rates. In this study we developeda method to estimate epilimnetic eddy diffusivities using H2O2. We obtained pro-files of [H2O2] from four North American lake sites that differed greatly in windexposure and with contrasting mixed layer characteristics. The two sites were on theLaurentian Great Lakes and two were from bays in a small lake. The H2O2 deriveddiffusivities were calculated using a budget approach from the flux of H2O2 betweenthe photochemically active region and the underlying waters.
Materials and methods
Study sites
Experiments were conducted in four contrasting environments (Figs. 1 and 2). TheLake Ontario Station 403 (43°36′N / 78°13′W) was in the exposed (fetch >200 km)
H2O2 as a tracer of mixing 171
Figure 1. Lake study areas and sampling sites
mid-lake region far from inshore influences. Likewise the Lake Erie Station 84(41°56′N/81°39′W) was in the middle of the Central Basin. These stations were characterized by low DOC and mesotrophic concentrations of chlorophyll a (CHLa)(Table 1).
Jacks Lake (44°41′N/78°02′W) is a small lake located on the edge of the Canadian Shield 100 km north of Lake Ontario that is distinguished by several dif-ferent bays having different optical properties. Brookes Bay is a sheltered colouredembayment (7.6 mg DOC L–1) whereas Sharpes Bay is a larger less coloured (5.6 mgDOC L–1) bay with a twofold greater fetch. Lake Ontario and Lake Erie containmuch lower DOC (<3 mg DOC L–1, Table 1). These locations were also used by
172 Scully et al.
Figure 2. Jacks Lake, and sampling sites (Sharpes and Brookes Bay)
Table 1. Limnological characteristics of the study sites. Dissolved organic carbon (DOC) and chlo-rophyll a (CHLa) concentrations are for the near-surface waters. ZUVA is the depth of 10% of sur-face UV-A radiation (380 nm).
Sites Lake Erie Lake Ontario Sharpes Bay Brookes Bay
Area (km2) 25,657 19,000 5.1 0.85Fetch (km) 375 275 3.0 1.5DOC (mg L–1) 2.10 2.60 5.60 7.60CHLa (µg L–1) 1.1 1.5 1.4 2.8ZUVA (m) 7.94 5.23 0.75 0.43

Cooper et al. (1989b), Cooper et al. (1994) and Scully et al. (1995) in their previousstudies of H2O2 dynamics. A comprehensive bathymetry of Jacks Lake is providedby Rowan et al. (1995).
Temperature profiling
Temperature profiles at 0.5 m intervals were obtained in Lakes Ontario and Erieusing a Seabird CTD profiler. Temperature profiles were determined at 1 m inter-vals in Sharpes and Brookes Bay using a YSI temperature-oxygen meter.
H2O2 profiling
At the Lake Ontario station, during a 48-h period on August 4 and 5 1993, concen-trations of hydrogen peroxide were measured every 3 hours at 10 depths throughthe mixing zone. Similarly, the Lake Erie station was sampled from July 12 to 13,1994 (Scully et al., 1995). The Lake Ontario and Lake Erie stations were sampled atmost times at depths of 0.5, 1, 15, 20, 25 m and every 2.5 m from 2.5 to 12.5 m fromthe CSS Limnos with 6-L Niskin bottles mounted on a rosette.
During the period of June 23 to 25 1993, a 72-h diel experiment was conductedat the Brookes Bay and Sharpes Bay sites in Jacks Lake (Scully et al., 1995). Lakewaters were sampled every 3 h at a central station in each bay using a 6-L Van-Dornbottle. There was a 30 min difference in sampling times between the two sites.
Hydrogen peroxide concentration was determined using the horseradish per-oxidase (HRP) scopoletin method by measuring the enzyme mediated loss of fluorescence for scopoletin (Cooper et al., 1988; Scully et al., 1995). For this analy-sis, 20 ml aliquots of lakewater were transferred to a cuvette and placed in a TurnerDesigns Fluorometer equipped with a near-UV lamp with a 365 nm excitation filter(Corning C/S 7-60) and a 490 nm emission filter (Turner 2A and 65A). The samplewas then injected with 100 mL of 0.5 M phosphate buffer (pH 7.0) and 40 mL of0.0096 g L–1 scopoletin and the fluorescence then measured. Then 20 mL of a 0.01 Mphosphate buffered 4 g L–1 HRP solution containing 2 mM phenol was added andthe sample fluorescence read again after 0.5 min. Calibration curves were obtainedthrough standard additions for each of the waters. Sample concentrations were cal-culated from the slope of the change in fluorescence as a function of the [H2O2](Scully et al., 1995). The slope of the calibration curves varied between waters butwere linear across the measured concentration range. The samples were analyzed intriplicate, with a coefficient of variation (CV) that was typically less than 5%.
Surface [H2O2] were integrated to give areal estimates (mg m–2) for two strata inthe surface mixed layer of each lake: the photochemically active region and theunderlying stratum that extended down to the seasonal thermocline. The photo-chemically active region was defined as the depth stratum where the bulk (99%) ofthe total water column H2O2 is produced. The production rate for this stratum wasdetermined by integrating from the surface to the sampling depth nearest the 1% ofsurface H2O2 production; this can also be approximated using the depth of 10% ofsurface 380 nm radiation at solar noon (N. Scully, unpublished). The depth limit ofthe seasonal mixed layer (i.e. depth of the seasonal or “parent” thermocline) was
H2O2 as a tracer of mixing 173

estimated from temperature profiles at the time of sampling as 15 m for Lake Erie,10 m for Lake Ontario, 5 m for Sharpes Bay and 3 m for Brookes Bay. The lowerlimit of the photochemically active region (and upper depth limit for the secondstratum) was estimated from H2O2 production profiles as 7.5 m for Lake Erie, 5 mfor Lake Ontario, 1 m for Sharpes Bay and 0.6 m for Brookes Bay.
Spectral irradiance
Spectral irradiance (280–400 nm every 2 nm) was measured from 6 to 21 h every 15 min using an OL 752 Optronics scanning spectroradiometer (Scully et al., 1995).Subsurface measurements were also made so that attenuation coefficients could becalculated every 2 nm from 280 to 400 nm (Scully and Lean, 1994; Scully et al.,1995).
Modelled H2O2 profiles
Modelled depth profiles of H2O2 were determined by multiplying wavelength spe-cific quantum yields (fAl) from Scully et al. (1996) by the total number of photonsabsorbed at that wavelength over a specific depth range Dz. These values were thenintegrated over the UV region (280–400 nm) and corrected for decay using thein situ H2O2 decay constants obtained from Scully et al. (1995). The CV for [H2O2]analysis for both fAl and decay constant determination were typically less than 5%.
In situ dark decay constants for H2O2 were calculated from the slope of the natu-ral logarithm of the nighttime areal concentration over time (Cooper et al., 1994;Scully et al., 1995). These H2O2 decay constants were then applied to calculatedecay corrected net areal production by subtracting H2O2 lost through decay pro-cesses. These values were 0.032, 0.040, 0.041, 0.126 h–1 for Lake Erie, Sharpes Bay,Lake Ontario and Brookes Bay respectively and were assumed not to vary withdepth. fAl values were determined for each lake water, with the exception of LakeErie for which Lake Ontario data were used. At wavelengths 300, 340, 360 and 400 nm fAl values were 3.8, 1.5, 0.39, and 0.56 ¥ 10–4 for Lake Ontario, 1.9, 0.42, 0.39and 0.14 ¥ 10–4 for Sharpes Bay and 2.8, 1.6, 0.97 and 0.12 ¥ 10–4 for Brookes Bay(Scully et al. 1996). Apparent quantum yield values every 2 nm were obtainedthrough interpolation from the slope of the relationship of the natural logarithm of fAl over wavelength.
At any depth z, the spectral irradiance (El) is given by:
El(z) = Eol exp(–klz) (eqn. 1)
It is assumed that the production of H2O2 is proportional to the absorbed pho-tons – ∂El (z)/∂z per unit depth-scale at wavelength l. Multiplying this value byquantum yield (fAl) and summing the wavelengths which dominate production(280–400 nm) gives an estimate of H2O2 production at depth z:
(d [H2O2]/dt)z = –∑ fAl ∂/∂z El (z) = ∑ fAl · kl · El (z) (eqn. 2)l l
174 Scully et al.
where:
(d[H2O2]/dt)z = modelled production at depth z (mmol m–3 s–1) fAl = apparent quantum yield at a specific wavelength l (Scully
et al., 1996)Eol = surface photon flux at a specific wavelength l (mmol m–2 s–1)
(Scully et al., 1995).Eol exp(–kl z) = photon flux at depth z at a specific wavelength l (mmol m-2 s-1).
Modelled production values were then vertically integrated and expressed as arealvalues (Pm, mmol m–2 s–1) for the photochemically active region.
Eddy diffusivity calculations
Epilimnetic eddy diffusion coefficients (Kz) for H2O2 were estimated using a onedimensional model at the four sites throughout the day for the photochemicallyactive region and the underlying stratum within the mixed zone. Modelled arealproduction of hydrogen peroxide was combined with observed areal production tocalculate Kz values for two consecutive days in Lakes Erie and Ontario and for threedays in Sharpes and Brookes Bay in Jacks Lake. The Kz values determined here arefor the surface mixed layer (the turbulent exchange between the photochemicallyactive region and the underlying water) and are represented by depths of 15, 10, 5and 3 m for Lake Erie, Lake Ontario, Sharpes Bay and Brookes Bay respectively.Observed net areal production (Po, mmol m–2 s–1) was determined by (Ct–Co)/∆twhere Ct is the areal concentration at sampling time (mmol m–2), Co areal concen-tration at sunrise (H2O2 carry over from the previous day’s production) (mmol m–2)and ∆t is the difference in time (s) between sunrise and the sampling time.
The surface mixed layer areal flux of H2O2 (F, in mmol m–2 s–1) was determinedby subtracting the observed net areal production rate (Po, mmol m-2 s-1) from the modelled net areal production (Pm, mmol m–2 s–1) in the photochemically activeregion.
F = Pm1 – Po1 (eqn. 3)
Where the subscript 1 refers to the photochemically active region. The flux of H2O2
was then divided by the mean concentration gradient within the photochemicallyactive depth and the waters below (∆ [H2O2]/D). Thus the calculation of Kz valuescan be represented by the equation:
F = –Kz (D[H2O2]/D) (eqn. 4)
where
Kz = epilimnetic eddy diffusion coefficient (m2 s–1) D[H2O2] = Difference in concentration between mean [H2O2] in the photo-
chemical zone and the mean [H2O2] in the underlying stratum of the epilimnion (mmol m–3).
D = Z2 – Z1, center of underlying stratum, center of the epilimnion layer 1 (m).
H2O2 as a tracer of mixing 175

The Kz values calculated here are integrated averages over time (i.e. from dawn tosampling time) and depth (i.e. the upper mixed layer (UML)) (e.g. for a D of 7.5 m,over a time interval of 6–21 h, a F of 25 mmol m–2 h–1 and an average concen-tration at 21 h of 100 and 70 mmol m–3 for the photochemically active region (depthof 7.5 m) and the underlying waters respectively, the Kz value would equal1.75 ¥ 10–3 m2 s–1). The propagation of random uncorrelated errors in measured andmodelled H2O2 production values was determined (Bevington, 1969; Jassby andPowell, 1975), assuming a CV of 7.5% for fAl, the H2O2 decay constants and Eol,and 5% for measured [H2O2] values (N. Scully, unpublished). These error termswere then propagated through the calculations leading to the Kz estimates. Thiserror analysis thus provides an overall or integrated estimate of Kz calculation error.Since in this study only single samples with depth were obtained at each depth theestimated [H2O2] sampling error was determined from a separate experiment.[H2O2] were sampled in triplicate at three sites every three hours from 9 to 18 h ina small lake (~ 0.04 km2, max. depth 2.0 m) on the eastern shore of Hudson Bay(Lake Kayouk, details in Scully and Vincent, 1997). For twelve sets of triplicates theCV averaged 2.8%.
Results
Day 1 of the Jacks Lake study was generally calm and sunny with an average windspeed of 1.2 m s–1 between 11 and 17 h. Temperature profiles on this date show thata near-surface, diurnal thermocline had formed by 14 h at both sites. In Sharpes Bay there was a decline in water temperature between 1 and 2 m (20.0 to 18.9 °C),with a similar temperature gradient in Brookes Bay situated between 0.5 and 1 m(Fig. 3 and 4). These near-surface buoyancy gradients were accompanied by gra-dients in [H2O2], indicating slow rates of mixing from the surface photochemicallyactive region to lower depths within the water column. Wind speed increased on days 2 and 3, which led to a more muted diurnal thermocline and subsurfacegradients in [H2O2] in the afternoon (Fig. 3 and 4).
The UML was deeper in lakes Erie and Ontario than in Jacks Lake, the tempe-rature steps and the variations in [H2O2] indicate that mixing in the UML was notuniform in intensity (Fig. 5). For instance, temperature profiles in Lake Ontariowere generally isothermal down to 8 m but [H2O2] varied in the UML and decreasedwith depth in the first 10 m of the water column. Both sampling days were sunny, with average wind speeds of 8.3 m s–1 for day 1 and 5.8 m s–1 for day 2.
In Lake Erie there was considerable day-to-day variation in thermal structure.The temperature profile on day 1 at 21 h was weakly stratified down to 10 m,whereas by the end of the next day a diurnal thermocline was present at 5 m. [H2O2]profiles demonstrated a similar trend (Fig. 6). On day 1 at 21 h, [H2O2] was found at > 40 mmol m–3 down to 15 m whereas on day 2 at 21 h concentrations > 40 mmol m–3 were limited to the first 10 m (Fig. 6). Meteorological conditions onboth days of the Lake Erie study were similar with mostly sunny conditions andwind speeds of 6.4 – 8.6 m s–1 at 18 h on day 1 and 3.9 – 6.1 m s–1 at 18 h on day 2.
Eddy diffusion coefficients calculated from the [H2O2] profiles varied over timeand between sites (Tables 2 and 3). The Lake Ontario and Lake Erie Kz values were
176 Scully et al.

H2O2 as a tracer of mixing 177
Figure 3. Time series of [H2O2] and temperature profiles for Brookes Bay on day 1 (A and D), day 2 (B and E) and day 3 (C and F). Each successive profile is offset by 60 mmol m–3 [H2O2] or 2 °C. Times for the profiles are as follows; (●●): 8 h, (■■): 11 h, (▲▲): 14 h, (▼▼) 17 h and (◆◆): 20 h
Figure 4. Time series of [H2O2] and temperature profiles for Sharpes Bay. Times, days and offsetfor the profiles are as in Figure 3

178 Scully et al.
Figure 5. [H2O2] (●) and temperature profiles (solid line) for Lake Ontario on day one at 12 h (A)and day 2 at 9 h (B)
Figure 6. [H2O2] (●) and temperature profiles (solid line) for Lake Erie on day 1 at 18 h (A) and21 h (B) and day 2 at 18 h (C) and 21 h (D)
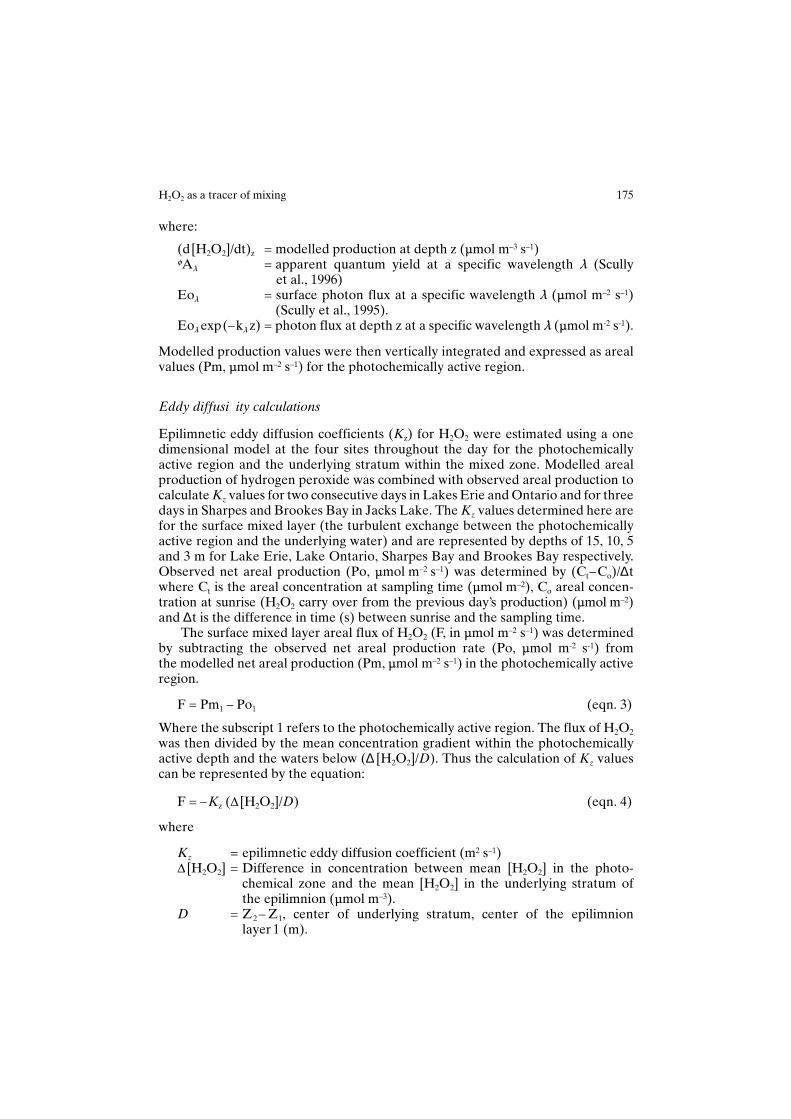
significantly higher (10–4 to 10–3 m2 s–1) than in Sharpes Bay (10–5 to 10–4 m2 s–1) andin Brookes Bay (10–6 to 10–4 m2 s–1). The propagation of error analysis indicated thatthese values were subject to analytical and calculation variance giving coefficientsof variation of 5–28% (Tables 2 and 3). There seemed to be no discernable patternbetween sites or over time in the reliability of the Kz estimates.
The [H2O2] and temperature profiles in Jacks Lake indicate that greater windinduced surface mixing on days 2 and 3 resulted in increased transport of H2O2
down through the water column of both bays. Daily solar irradiance was similar onall three days (Scully et al., 1995). Differences in Kz values between the two bays fol-lowed the expected trend given their differences in size and light absorbing quali-ties (Table 1). Kz values of the larger, more transparent Sharpes Bay were higher onall three days than the smaller more highly coloured Brookes Bay (Fig. 7). The lackof wind stress on day 1 of the Jacks Lake study was likely responsible for the low Kz
values of 4.4 × 10⁻⁵ and 5.0 × 10⁻⁶ m2 s–1 at the 17 h time interval for Sharpes andBrookes Bay respectively (Fig. 7). Kz values at the 14 h time interval in Sharpes andBrookes Bay were highest on day 3 at 5.1 × 10⁻⁴ and 4.7 × 10⁻⁵ m2 s–1.
H2O2 as a tracer of mixing 179
Table 2. Vertical eddy diffusivity values (Kz) for Brookes Bay (3 m) and Sharpes Bay (5 m). Stan-dard deviations (given in parentheses) were calculated by propagation of errors.
Kz (10–5 m2 s–1)
Day 1
Time 8 h 11 h 14 h 17 h 20 hSharpes Bay 11 (± 0.8) 4.2 (± 0.3) 8.5 (±0.6) 4.4 (± 0.3) 2.0 (± 0.3)Brookes Bay 3.0 (± 0.2) 3.4 (± 0.9) 1.6 (± 0.2) 0.5 (± 0.04) 2.6 (± 0.2)
Day 2Sharpes Bay 15 (± 1.1) 1.3 (± 0.09) 21 (± 1.5) 5.1 (± 0.4) 23 (± 1.6)Brookes Bay 15 (± 1.1) 1.2 (± 0.1) 4.8 (± 0.3) 2.5 (± 0.2) 1.0 (± 0.07)
Day 3Sharpes Bay 3.2 (± 0.2) 0.7 (± 0.1) 51 (± 3.6) 20 (± 1.4) 19 (± 1.3)Brookes Bay 5.7 (± 0.6) 1.2 (± 0.09) 4.7 (± 0.03) 0.8 (± 0.06) 2.9 (± 0.2)
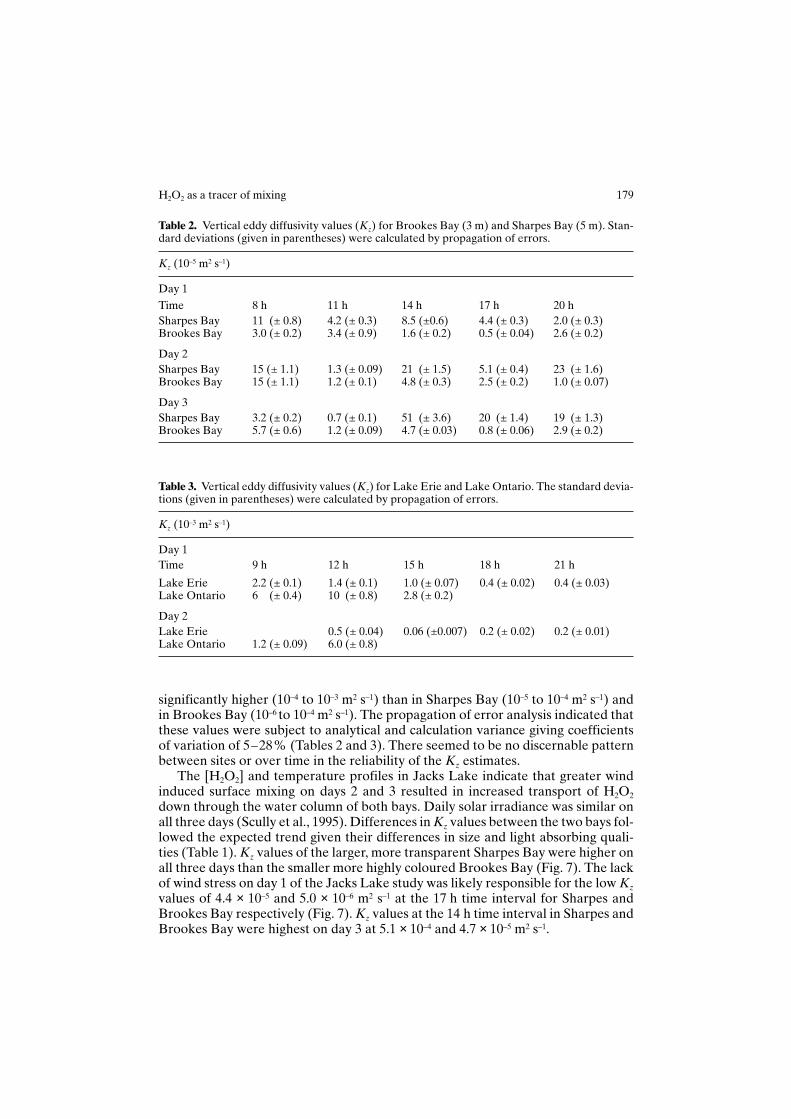
Table 3. Vertical eddy diffusivity values (Kz) for Lake Erie and Lake Ontario. The standard devia-tions (given in parentheses) were calculated by propagation of errors.
Kz (10–3 m2 s–1)
Day 1Time 9 h 12 h 15 h 18 h 21 h
Lake Erie 2.2 (± 0.1) 1.4 (± 0.1) 1.0 (± 0.07) 0.4 (± 0.02) 0.4 (± 0.03)Lake Ontario 6 (± 0.4) 10 (± 0.8) 2.8 (± 0.2)
Day 2Lake Erie 0.5 (± 0.04) 0.06 (±0.007) 0.2 (± 0.02) 0.2 (± 0.01)Lake Ontario 1.2 (± 0.09) 6.0 (± 0.8)

180 Scully et al.
Figure 7. Eddy diffusivity values (Kz in m2 s–1) at time intervals 8, 11, 14, 17 and 20 h for days 1, 2and 3 for the surface waters of Brookes Bay (▼▼) and Sharpes Bay (▲). The lines (Brookes Bay(solid line), Sharpes Bay (broken line)), represent linear regression fits through the Kz values. Thethin solid line represents wind speed (m s–1)
Figure 8. Brookes Bay (A) modelled profiles of H2O2 on day 1 for the time interval of 5 h to 17 hand observed [H2O2] (mmol m–3) (– ● –) at 17 h. Lake Erie (B) modelled profiles on day 2 for thetime interval of 6 h to 21 h and observed [H2O2] (mmol m–3) – ● –) at 21 h. The modelled profileshave been corrected for decay

Kz values in Lake Ontario ranged from 1.2 × 10⁻³ to 1.0 × 10⁻² m2 s–1, with littledifference between days (Table 3). In Lake Erie, Kz values were on the order of 10–3 m2 s–1 on day 1, but dropped an order of magnitude for the same time intervalon day 2, consistent with the increased thermal structure on the second day.
The greater mixing in large lakes is demonstrated by the disparity between where H2O2 is produced in the water column and where it is observed. Profiles ofH2O2 production in Brookes Bay were similar to measured profiles of [H2O2], whereas in Lake Erie the two profiles differed substantially (Fig. 8). This latter difference is the result of turbulent mixing redistributing H2O2 from the region ofphotoproduction, but is also influenced by carryover from the previous day.
Discussion
The photochemical product H2O2 can provide a tracer of mixing processes in thesurface mixed layer of lakes at timescales of 2–20 h. The use of H2O2 is likely to bea more sensitive guide to mixing than a heat-balance approach which can only beapplied to estimating Kz where heat balance is well-defined, and given the accuracyand resolution of most temperature sensors used in limnology, is only accurate whenlong term averaging is done. As a photochemical reaction product produced at thevery surface of a lake, H2O2 offers an attractive alternative to artificial tracers (i.e.dyes).
Our comparisons between sites demonstrate the over-riding importance of lakesize (fetch) to mixing. Highest values were recorded in the windswept open watersof the Laurentian Great Lakes. Kz values determined in Sharpes Bay were up to 40 times higher than those determined concurrently in the much smaller BrookesBay. Differences in water clarity also influenced these results. Brookes Bay is more coloured than Sharpes Bay and therefore subject to a greater near surfaceabsorption of solar radiation. Although wind speed may have been somewhat reduced in the more sheltered Brookes Bay, both bays were subject to identicalsolar exposure.
An important factor relevant to small lakes is advection, for example that asso-ciated with differential heating and cooling (Spigel and Imberger, 1987). The Kz
values obtained in Sharpes Bay and Brookes Bay may be influenced by horizontaladvection and therefore cannot be solely attributed to vertical transport processes.The generally high Kz values in the early morning in both Sharpes Bay and Brookes Bay is likely caused by heat loss and possibly enhanced differential mixingprocesses (Imberger and Patterson, 1990; MacIntyre and Melack, 1995).
Differences in H2O2 decay rates between the sites can result in significant dif-ferences in turnover of H2O2 and hence steady state concentrations of hydrogenperoxide. The decay of H2O2 in aquatic ecosystems is thought to be primarily bio-logically mediated (Cooper et al., 1994) however more recent studies have indicatedthat abiotic processes may also play a significant role in H2O2 decay (Herrmann,1996). Cooper et al. (1994) found that the decay rate of H2O2 in lakewater was posi-tively correlated with bacterial numbers whereas Herrmann (1996) found dystro-phic lakewaters with low bacterial numbers to have high H2O2 decay rates. In thepresent study, variability in biological activity and DOC concentration between
H2O2 as a tracer of mixing 181

sites seemed to play a significant role in the turnover of H2O2. The carryover ofH2O2 (concentration at sunrise) in dystrophic Brookes Bay with a relatively highdecay rate, for example, was almost negligible; this contrasted with oligotrophicLake Erie (low microbial biomass) where carryover was higher. Irrespective of thedominent decay mechanism at work, evaluating carryover at each site is thereforean important step in determining Kz values by way of H2O2.
Estimates of H2O2 production may be confounded by atmospheric inputs. Rain-water is known to contain high [H2O2] (0.1 to 100 mmol L–1) (Zuo and Hoigné, 1992)and can significantly augment the surface [H2O2] in aquatic ecosystems (Cooper etal., 1987). However there was no significant rainfall or atmospheric depositiondetected during each of the studies. The fetch of a lake seemed to play a more pro-minent role in determining mixing patterns in Lake Ontario and Lake Erie. Mixingwas more intense in Lakes Ontario and Erie than in Jacks Lake. Kz values in LakeOntario reached 1.0 × 10⁻² m2 s–1 and 2.2 ¥ 10–3 m2 s–1 for Lake Erie. These obser-vations are supported by other studies where lake fetch and water clarity were shown to have an effect on stratification and mixing processes (Mazumder and Taylor, 1994; Beletsky et al., 1994; Murthy et al., 1994; Fee et al., 1996). Fee et al.,(1996) for example found water transparency, which is controlled by DOC concen-tration, to significantly affect the depth of the epilimnion in small Canadian Shieldlakes.
As an independent check on the Kz values from this study we applied the empi-rical relationship of that has been derived by Davies (1986) for mixed layer diffusivities in the ocean as a function of wind speed (W in m s–1):
Kz = 3 ¥ 10–4 W3 (eqn. 6)
This gave Kz values from 2.0 × 10⁻² to 4.1 × 10⁻¹ m2 s–1 for Lake Erie and Ontario andfrom 8.7 × 10⁻⁵ to 1.3 × 10⁻² m2 s–1 for Sharpes and Brookes Bay which overlap withthe H2O2 estimates at the higher end of their range. The wind speed derived Kz
values are likely to be over-estimates in fetch limited lake basins and the overlap atthe appropriate end of each range lends some support to the H2O2 approach.
Kz values derived from H2O2 calculated in this study are also consistent withvalues from the literature. MacIntyre (1993), with the use of temperature-gradientmicrostructure profiles, determined Kz values in the diurnal surface layer for a shallow eutrophic lake in Western Australia. The Kz values from that study rangedfrom 10–5 to 10–3 m2 s–1 during periods of active mixing near the surface and 10–7 to10–4 m2 s–1 within the diurnal thermocline during periods of stratification. The Kz
values for Sharpes and Brookes Bay fell within this range. Although the Kz valuesdetermined here are single values integrated over depth and time, few data exist fordiurnal surface layers and the application of H2O2 as a measure of mixing in thisuppermost layer of lakes may be especially useful.
Lake Ontario and Lake Erie Kz values (10–4 to 10–2 m2 s–1) were similar to Kz
values reported in the literature for large lakes (10–3 to 10–2 m2 s–1 in Boyce, 1974).Similar values for Lake Ontario of 5 × 10⁻³ m2 s–1 were obtained earlier by Platzman(1963) and MacIntyre and Melack (1995) obtained values of 2 × 10⁻³ m2 s–1 at the sur-face of the southern basin of Lake Biwa, Japan. These comparisons all indicate thatthe H2O2-derived Kz values are of a reasonable order of magnitude, however the
182 Scully et al.

approach would benefit from a direct, concurrent inter-calibration with other tech-niques such as microstructure temperature profiling.
Comparable agreement between diffusivities based on H2O2 and heat is not tobe expected because of differences in some of the processes involved. H2O2-derivedestimates are likely to provide a more useful, time-integrated estimate for certaintypes of limnological calculations, such as algal residence times. For example, the Kz
values as determined here can be used to estimate residence times of neutrallybuoyant phytoplankton and hence determine the amount of visible and UV radia-tion which these organisms are exposed to on a daily basis. The average residencetime of a passive particle in the depth region from the surface (Z = 0) to the depthof the seasonal thermocline (Zm) could be approximated as T ~ 2 (Zm
2 /Kz) where Tis the time scale of a complete overturn from the surface to the bottom of Zm and tothe surface again (hence the factor of 2). This would give values of 6 to 55 h in theGreat Lakes and 7 to >500 h in Jacks Lake.
Kz values calculated in this study are averaged over several hours and can beused to quantify short term variability of mixing. Biologists interested in quantify-ing the role of environmental factors such as UV radiation in aquatic ecosystems aregenerally interested in processes taking place on time-scales of hours or days, andmixing rates in the diurnal thermocline region of the water column are especiallyimportant in this regard (Vincent et al., 1984; Milot-Roy and Vincent, 1994). Kz
values can be determined for periods of time when UV radiation is expected to haveits greatest impact. For example, Kz values calculated for the time interval of 11 –17 h for Brookes Bay on the generally windy day 3 was higher at 2.1 ¥ 10–5 m2 s–1 thanon day 1 (3.8 ¥ 10–6 m2 s–1) with significantly reduced wind speeds. These values canthus be used to estimate the residence time of phytoplankton and hence the solarUV radiation flux to which they are exposed.
The data presented in this study provide strong support for the use of photo-chemical products such as H2O2 as natural tracers for mixing in aquatic ecosystems.Improvements to the model presented here could also be incorporated throughanalytical and methodological fine-tuning. Given the general heterogeneity ofmixing within the water column of lakes, information has been excluded since theKz values determined here are integrations for the mixing zone. More precisely,they are estimates of diffusivity across the interface between the photochemicalregion and the underlying stratum down to the seasonal thermocline. They will there-fore be underestimates for strata within the surface mixing layer (Imberger 1994)where mixing rates are high and overestimates for the subsurface mixing layerwhich together with the diurnal thermocline comprise the UML. The use of a con-tinuous [H2O2] analysis system would improve the resolution of the data obtainedwhen conducting [H2O2] profiling. Hydrogen peroxide measures could be taken atshorter depth intervals thereby allowing the determination of Kz values at discretedepth intervals through the water column. Also, a verification of model [H2O2]profiling parameters, such as the role of depth in affecting in situ H2O2 decay ratesis required. Hypsographic corrections will need to be made in mixed layers where there are major horizontal changes in bathymetry.
Since UV spectral irradiance data is both difficult and expensive to obtain and isessential in calculating production curves, these data could be determined by incu-bating quartz tubes with depth and measuring the production rates of H2O2. Pro-
H2O2 as a tracer of mixing 183
duction curves of H2O2 obtained through the spectral irradiance model for LakeErie and Brookes Bay were similar to H2O2 production profiles obtained from theincubation of the lakewaters in quartz tubes with depth (N. Scully, unpublished).The in situ measure of H2O2 production in incubated quartz tubes could serve as asimple inexpensive alternative to the spectral irradiance model for the determina-tion of H2O2 production with depth.
ACKNOWLEDGMENTS
We thank the crew of the CSS Limnos for their assistance during the sampling cruise on Lakes Erieand Ontario, and A. Ferguson for assistance in sampling Jacks Lake. We also thank A. Wüest andthree anonymous reviewers for helpful comments. Financial support was provided by researchfunds from Environment Canada’s Green Plan Initiative to determine aquatic impacts of increas-ed UV-B radiation resulting from stratospheric ozone depletion; the Natural Sciences andEngineering Research Council (Canada); Fonds pour la Formation de Chercheurs et l’Aide à laRecherche (Québec, Canada); a Canada-US Environment Canada Fulbright scholarship to NMS;and a National Science Foundation grant to SM (DEB93-17986).
REFERENCES
Beletsky, N.N., Filatov and R.A. Ibraev, 1994. Hydrodynamics of Lakes Ladoga and Onega. WaterPoll. Res. J. Canada 29(2/3) :365–384.
Bevington, P.R., 1969. Data reduction and error analysis for the physical sciences. McGraw-Hill 73 pp.
Boyce, F.M., 1974. Some aspects of great lake physics of importance to biological and chemicalprocesses. J. Fish. Res. Board Can. 31:689–730.
Cooper, W.J., R.G. Zika and E.S. Saltzman, 1987. The contribution of rainwater to variability insurface ocean hydrogen peroxide. J. Geophys. Res. 92:2970–2980.
Cooper, W.J., R.G. Zika, R.G. Petasne and J.M.C. Plane, 1988. Photochemical formation of H2O2
in natural waters exposed to sunlight. Environ. Sci. Technol. 22:1156–1160.Cooper, W.J., R.G. Zika, R.G. Petasne and A.M. Fischer, 1989a. Sunlight-induced photo-
chemistry of humic substances in natural waters: Major reactive species, In Aquatic humic substances: Influences on the fate and treatment of pollutants. Adv. Chem. Ser. 219. ACS pp. 333–362.
Cooper, W.J., D.R.S. Lean and J. Carey, 1989b. Spatial and temporal patterns of hydrogen per-oxide in lake waters. Can. J. Fish. Aquat. Sci. 46:1227–1231.
Cooper, W.J., C. Shao, D.R.S. Lean, A.S. Gordon and F.E. Scully, 1994. Factors affecting the dis-tribution of H2O2 in surface waters, Environmental chemistry of lakes and reservoirs. Adv.Chem. Ser. 237. ACS pp. 393–422.
Davies, A.M., 1986. Application of a spectral model to the calculation of wind drift currents in anidealized stratified sea. Continental Shelf Research 5:579–610.
Farmer, D.M., S.F. Clifford and J.A. Verral., 1987. Scintillation structure of a turbulent tidal flow.J. Geophys. Res. 92:5369–5382.
Fee, E.J., R.E. Hecky, S.E. Kasian and D.R. Cruikshank, 1996. Effects of lake size, water clarityand climatic variability on mixing depths in Canadian Shield lakes. Limnol. Oceanogr. 41:912–920.
Frenette, J.J., W.F. Vincent, L. Legendre and T. Nagata, 1996. Size dependent changes inphyto-plankton C and N uptake in the dynamic mixed layer of Lake Biwa. J. Plankton Res. 18:371–391.
Herrmann, R., 1996. The daily changing pattern of hydrogen peroxide in New Zealand surfacewaters. Environmental Toxicology and Chemistry 15:652–662.
Hoigné, J., B.C. Faust, W. Haag, F. Scully and R. Zepp, 1989, Aquatic humic substances sourcesand sinks of photochemically produced transient reactants, In Aquatic humic substances:Influences on the fate and treatment of pollutants. Adv. Chem. Ser. 219. ACS pp. 363–381.
184 Scully et al.

Hoigné, J., 1990. Formulation and calibration of environmental reaction kinetics; oxidations byaqueous photooxidents as an example. In Aquatic Chemical Kinetics. Edited by WernerStumm. John Wiley and Sons, Inc, pp. 43–70.
Imberger, J., 1985. Thermal characteristics of standing waters: an illustration of dynamical proces-ses. Hydrobiologia 125:7–29.
Imberger, J. and R.H. Spigel, 1987. Circulation and mixing in Lake Rotongaio and Lake Okarounder conditions of light to moderate winds: preliminary results. N. Z. J. of Marine and Fresh-water Research 21:361–377.
Imberger, J. and J.C. Pattterson, 1990. Physical limnology. Adv. Appl. Mechan. 27:303–473.Imberger, J., 1994. Transport processes in lakes: A review. Pages 99–193 in R. Margalef, ed.,
Limnology Now: A Paradigm of Planetary Problems, Elsevier Science.Jassby, A. and T. Powell, 1975. Vertical patterns of eddy diffusion during stratification in Castle
Lake, California. Limnol. Oceanogr. 20:530–543.Jellison, R. and J.M. Melack, 1993. Algal photosynthetic activity and its response to meromixis in
hypersaline Mono Lake, California. Limnol. Oceanogr. 38(4):8818–837. Johnson, K.S., S.W., Willason, D.A., Wiesenburg S.E. Lohrenz and R.A. Arnone, 1989. Hydro-
gen peroxide in the western Mediterranean Sea: a tracer for vertical advection. Deep–SeaResearch. 26:241–254.
MacIntyre S., 1993. Vertical mixing in a shallow, eutrophic lake: Possible consequences for the lightclimate of phytoplankton. Limnol. Oceangr. 38:798–817.
MacIntyre, S. and J.M. Melack, 1995. Vertical and horizontal transport in lakes: linking littoral,benthic, and pelagic habitats. J. N. Am. Benthol. Soc. 14(4):599–615.
Mazumder, A.M. and W.D. Taylor, 1994. Thermal structure of lakes varying in size and water cla-rity. Limnol. Oceanogr. 39:968–976.
Maiss M., J. Ilmberger and O. Münnich, 1994. Vertical mixing in Überlingersee (Lake Constance)traced by SF6 and heat. Aquat. Sci. 56:329–347.
Menemenlis D., 1994. Line-averaged measurement of velocity fine structure in the ocean usingacoustical reciprocal transmission. Int. J. Remote Sensing 215:267–281.
Miller, W.L., 1994. Recent advances in the photochemistry of natural dissolved organic matter. InAquatic and surface photochemistry. G.R. Helz et al. [eds], Lewis pub. pp. 111–127.
Milot-Roy, V. and W.F. Vincent, 1994. UV radiation effects on photosynthesis: The importance ofnear-surface thermoclines in a subarctic lake. Arch. Hydrobiol. Beih. Ergebn. Limnol. 43:171–184.
Murthy, C.R., N.N. Filatov, D.V. Pozdnyakov, J. Sarkkula and W.M. Schertzer, 1994. Physical lim-nology and water quality modelling of large lake systems. Water Poll. Res. J. Canada 29(2/3):313–pp.
Platzman, G.W., 1963. The dynamic prediction of wind tides on Lake Erie. Meteorol. Monogr. 4(26): 44p.
Prézelin, B.B., M.M. Tilzner, O. Schofield and C. Haese, 1991. The control of the production process of phytoplankton by the physical structure of the aquatic environment with specialreference to its optical properties. Aquat. Sci. 53:136–186.
Rowan, D.J., J.B. Rasmussen and J.K. Kalff, 1995. Optimal allocation of sampling effort in lakesediment studies. Can. J. Fish. Aquat. Sci. 52:2146–2158.
Scully, N.M. and D.R.S. Lean, 1994. The attenuation of ultraviolet radiation in temperate lakes.Arch. Hydrobiol. Beih. Ergebn. Limnol. 43:135–144.
Scully, N.M., D.R.S. Lean, D.J., McQueen and W.J. Cooper, 1995. Photochemical formation ofhydrogen peroxide in lakes: effects of dissolved organic carbon and ultraviolet radiation. Can.J. Fish. Aquat. Sci. 52:2675–2681.
Scully, N.M., D.R.S. Lean, D.J., McQueen and W.J. Cooper, 1996. Hydrogen peroxide formation:The interaction of ultraviolet radiation and dissolved organic carbon in lake waters along a43–75°N gradient. Limnol. Oceanogr. 41:540–548.
Scully, N.M. and W.F. Vincent, 1997. Hydrogen peroxide: a natural tracer of stratification andmixing processes in subarctic lakes. Arch. Hydrobiol. 139:1–15.
Sikorski, R. J. and R. G. Zika, 1993a. Modeling mixed-layer photochemistry of H2O2: optical andchemical modeling of production. J. Geophys. Res. 98:2315–2328.
Sikorski, R.J. and R.G. Zika, 1993b. Modeling mixed-layer photochemistry of H2O2: physical andchemical modeling of distribution. J. Geophys. Res. 98:2329–2340.
H2O2 as a tracer of mixing 185

Spigel, R.H. and J. Imberger, 1987. Mixing processes relevant to phytoplankton dynamics in lakes.N.Z.J. Marine and Freshwater Res. 21:361–377.
Vincent, W.F., P.J. Neale and P.J. Richerson, 1984. Photoinhibition: algal responses to bright lightduring diel stratification and mixing in a tropical alpine lake. J. Phycol. 20:201–211.
Vincent, W.F. and S. Roy, 1993. Solar ultraviolet-B radiation and aquatic primary production:damage, protection, and recovery. Environ. Rev. 1 :1–12.
Vincent, W.F., 1990. The dynamic coupling between photosynthesis and light in the phytoplanktonenvironment. Int. Ver. Theor. Angew. Limnol. Verh. 24:25–37.
Wüest A., D.C. van Senden, J. Imberger, G. Piepke and M. Gloor, 1996. Comparison of diapycnaldiffusivity measured by tracer and microstructure techniques. Dynamics of Atmospheres andOceans. 24:27–39.
Zuo, Y. and J. Hoigné, 1992. Formation of hydrogen peroxide and depletion of oxalic acid inatmospheric water by photolysis of iron(III)-oxalato complexes. Environ. Sci. Technol. 26:1014–1022.
Received 16 December 1996;revised manuscript accepted 23 December 1997.
186 Scully et al.
Recommended