Theoretical and Applied Genetics 42, 346-- 350 (I 972) | by Springer-Verlag 1972
Hybrid Prediction in Maize. Genetical Effects and Environmental Variations*
E. OTTAVIANO and M. SARI GORLA
Ist i tuto di Genetica, UniversitA di Milano (Italy)
Summary. This paper proposes a method for predicting the performance of multiple cross hybrids on the basis of single cross information, taking into account the specific interaction of the genotypes with the environment.
In the prediction model the genetical constants are those used for combining ability analysis, while genotype-environ- mental interaction terms are defined as linear regression of the genotypical effects on environmental variables.
The model was tested by considering the variations arising from the effects of population density ; therefore the me- thod was applied in a situation in which the problem was to select the best hybrid-population density combinations.
The results obtained show that the model is suitable to represent phenotypical response across densities. However, the material used was not the most suitable to emphasize the improvement of the predictive power of the
function when genotype-environmental parameters are considered.
Introduct ion Predicting the performance of all hybrid combi-
nations between a number of inbred lines is a prac- tical problem that arises because the number of these combinations usually exceeds the practical limits of field evaluation.
Many methods of prediction have been proposed and some of them are currently used (Jenkins, 1934; Eberhart, t964; Eberhart and Gardner, t966; Hin- kelmann, 1968). In general, theoretical values of all hybrid crosses are estimated on the basis of infor- mation obtained from a limited number of genotypes. The relative predictive power of these methods has been assessed and it has been shown that it varies according to the main genetical effects contributing to the differences between hybrids (Eberhart, t964; Ottaviano et al. t970). However, the results obtained using the different methods did not always agree sufficiently with the observed values. This means that certain factors not considered in the prediction formulas play an important role in determining the variation in the phenotypical values. These factors are epistasis, genotype-environmental interaction and sampling error (Eberhart et al. t964; Eberhart and Hallauer, t968).
The contribution of epistasis to the differences between observed and expected values can be reduced by including in the model parameters for this factor (Eberhart and Gardner, 1966), but the variation resulting from genotype-environmental interaction cannot easily be predicted.
A way of dealing with this problem is suggested by the observations of many authors who found that a significant proportion of genotype-environmental
* This work was supported by a grant from the Con- siglio Nazionale delle Ricerche (70.10298.06.115.140).
interactions variance can be linearly related to the mean effects of the environment or to some other environmental indexes (Yates and Cochran, t938; Finlay and Wilkinson, 1963; Eberbart and Russell, 1966; Ottaviano and Conti, t968). Furthermore, it has been shown that the genotype-environmental effects can be partitioned according to the genetical parameters considered in the model (Bucio Alanis, t966; Bucio Alanis and Hill, 1966; Perkins and Jinks, t968, a and b; Bucio Alanis et al. t969; Jinks and Perkins, t 970).
In the present work we have extended this approach to hybrid performance prediction, adopting the genetical model used for combining ability ana- lysis. Plant spacing was used as the environmental variable, and the method proposed was applied to predict the performance of hybrid crosses in relation to plant spacing and to select the hybrid-plant spacing combinations which maximize yield.
Material and Methods The 21 single crosses from all combinations between
seven inbred lines of maize were the material used for this experiment. The parental lines, W23, W22, W374R, B2, OH-41, 38--11 and 33--16, will here be referred to as 1, 2, 3, 4, 5, 6 and 7, respectively.
Four different plant density levels were considered: 4, 6, 8 and 10 plants per mL The field lay-out was a split-plot with two replications in which plant densities were the whole plots. Each plot contained 42 sub-plots, two for each hybrid. These sub-units consisted of three rows of ten plants ; the distance between rows was 80 cm, while that between the plants in the rows was varied so as to provide the four population densities. Hybrids within plots and plant densities within replications were completely randomized. The experiment was carried out in two successive years (I 969 and 1970) at Vimodrone, Mi- lano. Ears of five plants in the central row of each sub-plot were harvested and artificially dried to uniform moisture. The characters measured were ear weight per plant (gms) and weight of 50 kernels (gins).
Vol. 4 2, No. 8 H y b r i d P r e d i c t i o n in Maize 347
Statistics
The mean value of k k ' single cross hybrid at the i *h level of plant density can be expressed by the following mathematical model:
Y( ,~ ' ) i = # + Gl~h' + e i + l(kk,)i
where/~ is the mean of all hybrids over all population rates; Gk e is the genotypic effect of kk' hybrid, k = - 1 , 2 . . . . . n ; ei is the mean effect of the i th population rate i ----- 1, 2 , . . . p ; l(kk')i is the effect of interaction between the i th population rate with the k k' hybrid.
According to the model used for combining ability analysis of a set of diallel crosses including F~'s only (Griffing 1956), the genotypic effects can be parti- tioned as follows:
G~, = gk + g~' + Skk,.
Where gk is the general effect of the line k, and sk~, the specific effect tha t occurs when the line k is mated with line k'. Assuming a model with fixed effects we have ~ g ~ = ~sa~, = 0. If the value
k k Y/~')i, referring to single plants or to units with the same number of plants, is a linear function of the environmental factor considered (X = number of plants per m ~) it follows tha t :
e~ = b (X~ -- X) + ~ and
G~'/~ = (b~, - -b) �9 (X~ -- X) + ~(~,}~
b is the regression coefficient of hybrid means on plant density and bk~, the coefficient of regression applied to the hybrid k k ' ; di and d(~,)i are the devi- ation from regression at i *~ population rate.
According to the genetical model adopted for G ~ , , the coefficient of regression b~, can be part i t ioned as follows :
b~, = b + bq. + b~k ' + b,k~.,.
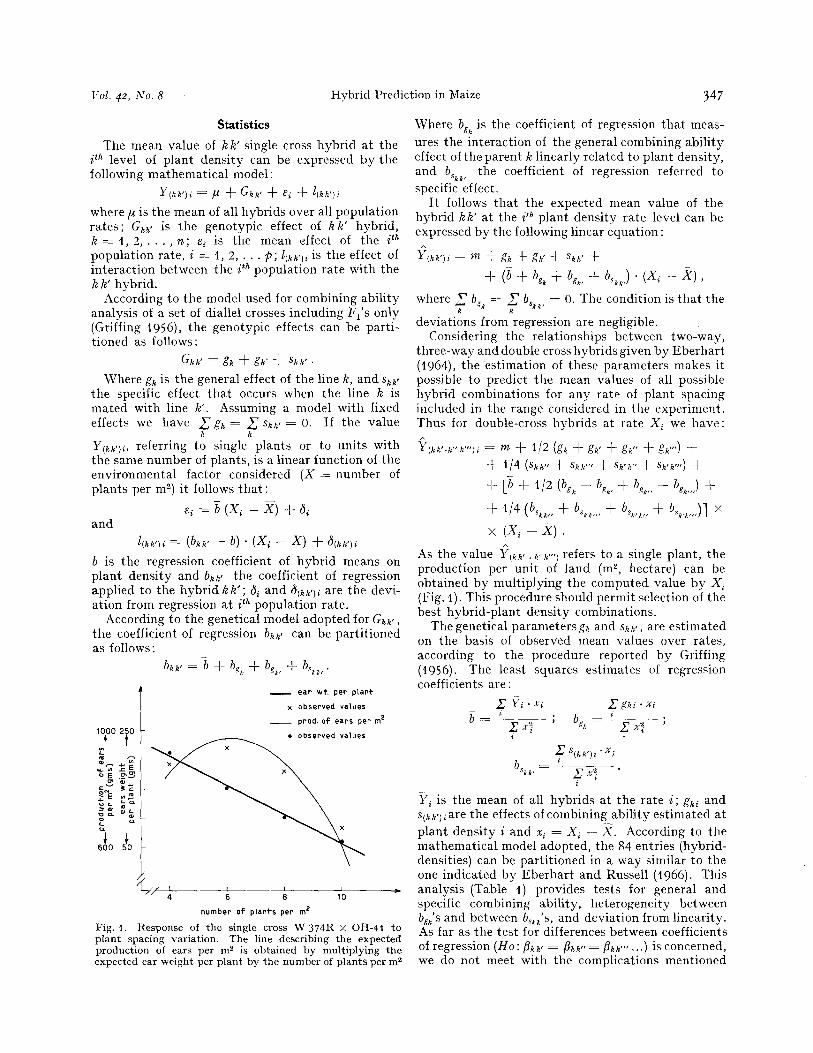
ear wt. pee planf
x observed values
_ _ prod. of ears per m z
1000 250 ~ �9 observed values
E ._~ c~
0!o
I [ I ; :b 7 / / / 4 6 8 1
number o f plant-s per m ~
Fig. I. Response of the single cross W 374R • O H - 4 t to plant spacing variation. The line describing the expected production of ears per m 2 is obtained by multiplying the expected ear weight per p lant by the number of plants per m ~
Where bg k is the coefficient of regression that meas- ures the interaction of the general combining ability effect of the parent k linearly related to plant density, and bs~.k ' the coefficient of regression referred to specific effect.
I t follows that the expected mean value of the hybrid kk" at the i th plant density rate level can be expressed by the following linear equation"
A
YIkk')i = m + gk + gk' + sk~' +
+ (b + bg~ + G , + bs~,,) �9 ( X , - X ) ,
where k2 ~ bg~. =: ~ bsk~, = 0. The condition is tha t the
deviations from regression are negligible. Considering the relationships between two-way,
three-way and double cross hybrids given by Eberhar t (1964), the estimation of these parameters makes it possible to predict the mean values of all possible hybrid combinations for any rate of plant spacing included in the range considered in the experiment. Thus for double-cross hybrids at rate X i we have"
A
Y(~k'.h"k"')i = m @ 1/2 (gk @ gk' + gk" + g~'") +
+ 1/4 (sk~,, + s~k,,, + Sk, k" + Sk'k"') +
+ [b + t/2 (b~k + b~, + ~ , , + bg~,,,) +
+ t/4 (bskk,, + b,,~,,, + bs,,~,, + b~,~,,,)] X
x (X~ - X ) .
As the value Yck~'. k" k'") refers to a single plant, the production per unit of land (m 2, hectare) can be obtained by multiplying the computed value by X, (Fig. 1). This procedure should permit selection of the best hybrid-plant density combinations.
The genetical parameters gk and sk~,, are est imated on the basis of observed mean values over rates, according to the procedure reported b y Griffing (1956). The least squares estimates of regression coefficients are :
Y i �9 xi ~ gki �9 Xi
- - ': ; bg~ = ~- "
i S ( k k , ) i " X i
i
Yi is the mean of all hybrids at the rate i; gk~ and slkk,~are the effects of combining ability est imated at plant density i and x i = X i - - X . According to the mathematical model adopted, the 84 entries (hybrid- densities) can be part i t ioned in a way similar to the one indicated by Eberhar t and Russell (1966). This analysis (Table 1) provides tests for general and specific combining ability, heterogeneity between bgk'S and between bs~'s , and deviation from linearity. As far as the test for differences between coefficients of regression (Ho : flk~' = flk~" = flk~'" . . . ) is concerned, we do not meet with the complications mentioned

348 E. Ottaviano and M. Sari Gorla: Theoret. AppL Genetics
Table 1. A nalysis of variance of 7 • 7 F~ diallel set grown at four population densities
Items d.f. Mean square
ear weight 50-kernels wt.
(1) Population_density 3 335447.81"* 229.2609 n's" regression (b) 1 938030.66"* " 653.1030* deviations 2 34156.38"* 17.3395 n's" Error (a) 6 2035.31 51.0180
(2) Crosses 20 3231.96"* 43.0124"* g. c. a. (g~) 6 8540.43** 122.1055"* s. c. a. (sk~,) t4 956.91" 9.1154"*
(1) x (2) 60 742.78* 3.4994** regression (bi~,) 20 912.96* 7.6348"* deviations 40 657.70 n's' 1.43t8 n's"
(1) • g. c . a . 18 918.17" 7.1858"* regression (bgk) 6 1218.50" 18.2046"* deviations t2 862.50 ms" 1.6763 n's"
(1) • s. c . a . 42 640.62 n ' s " 1.9195" regression (bskk,) t4 782.01 n ' s " 3.t049"* deviations 28 569.92 n's" t .3268 n's' Error (b) 324 488.57 1.4536
R2(I *, gk, skk,, b) 0.8988 0.8608
R2(P, gk, sk~,, b, bgk, bskk,) 0.9148 0.9477
n.s . : P2> 0.05; *: P < 0.05; **: P < 0 . 0 1 ; R 2 is the coefficient of determination.
b y the a u t h o r s a b o v e because t he e n v i r o n m e n t a l v a r i a b l e (p lant dens i ty ) i s no t r e l a t ed to t he obser- va t ions .
R e s u l t s
S u b - p l o t means f rom equa l n u m b e r s of p l a n t s were the d a t a used for the ana lys i s . The t o t a l va r i ance was p a r t i t i o n e d accord- ing to t he fac to rs of v a r i a t i o n consi- de red in t he e x p e r i m e n t , i .e., year , repl i - ca t ions , crosses a n d p l a n t dens i t ies . This c o m b i n e d ana lys i s d id no t r evea l a n y s ign i f ican t i n t e r a c t i o n wi th r e g a r d to yea r , t he re fo re t he resu l t s r e p o r t e d in Tab le t r e l a t e d on ly to t he i t ems of gene t i ca l effects a n d p l a n t dens i ty . The m e a n di f ferences b e t w e e n dens i t i es are h igh ly s ign i f i can t a n d t h e t r e n d of th i s v a r i a - t i on shows a s l ight d e v i a t i o n f l om a s t r a i g h t l ine when ear weight is consi- dered . The di f ferences b e t w e e n crosses accoun t for gene ra l (gk) and specif ic com- b in ing a b i l i t y (s~k,). The s igni f icance of g e n o t y p e - - d e n s i t y i n t e r a c t i o n (! • i nd i ca t e s t h a t t he response t r e n d of b o t h c h a r a c t e r s is no t the same for al l h y b r i d s .
Regress ion ana lys i s of th is c o m p o n e n t shows t h a t th i s i n t e r a c t i o n is m a i n l y a t t r i b u t a b l e to h e t e r o g e n e i t y b e t w e e n bk~,'s. This means t h a t t he per for -
mance of each h y b r i d across t he r ange of p l a n t den- s i t ies can be r e p r e s e n t e d b y a l inear func t ion in which the v a r i a t i o n r e l a t i n g to p l a n t spac ing is expres sed
Table 2. Estimates of combining ability (gk, skk,) and regression parameters ~, be k, bsk~,) for 5o-kernels weight
2 3 4 5 6 7
skk, 0.438 --0.04t bskk , 1 --0.208 0.t06 dev. M.S. 0.241 0.4t 5
skk, 0.774 bskk , 2 --0.127 dev. M.S. 0.068
Sk k" bskk, dev. M. S.
Sk k'
bskl,, dev. M. S.
Skk' bs~k, dev. M. S.
skk, bsk k, dev. M. S.
Sk k' bsk ~, dev. M. S.
m = 11.672 = --0.623
0.644 0.311 --0.936 --0.415 gl --1.72t 0.059 0.t36 --0.09t --0.002 bg t 0.067 0.396 2.527 0.395 1.400 dev. 0.794
--0.050 --0.919 --0.526 0.284 g2 --0.496 --0.202 0.315 0.1t3 0.108 bg2 --0.001
0.235 t .2 t8 0.170 0.614 dev. 1.266
--0.639 --0.099 0.572 --0.567 g3 1.253 0.260 --0.139 - -0 . t89 0.089 bg3 0.212 0.3t4 0.976 0.672 0.031 dev. 0.623
--0.999 0.514 0.529 g4 --1.455 --0.203 0.261 - -o . t74 bg, - -0 . I62
4.742* 0.304 1.267 dev. 1.120
0.957 0.749 --o.o91 --o.o18
0.595 0.885
--0.580 --0.003
1.076
g5 O.374 bg~ --O.376 dev. 3.765
g6 1.146 bg, O.234 dev. 0.660
g7 0.900 bg, 0.025 dev. 1.829
*: P < 0.05; m = mean of all observations.
|1"ol. 42, NO. 8 Hybrid Prediction in Maize 349
by the regression b~, (X~ -- ~7). The remaining part of the analysis shows the partitioning of this inter- action according to the genetical model adopted. The items (t) • g. c. a. and (1) • s. c. a. refer to the interaction of the general and specific combining ability effects, respectively, with rates of plant den- sity. The regression analysis of these components shows different behaviour for the two characters considered. Variance due to the differences between bg~'s and between b~k, are both significant when 50-kernels weight is considered, but for ear weight the inclusion of bskk,'S in the model does not bring about a significant reduction of the residual va- riances. All items referring to deviations from linear regression were not significant.
The least squares estimates of combining ability effects and regression coefficients for 50-kernels weight are shown in Table 2. For each regression coefficient the deviations from linearity mean squares are reported; in only one case were these variances significant when tested with the residual.
These results indicate that the complete model is required for predictive purposes when kernel weight is considered, but for the other character only bg k coefficients need be used to estimate the genotype- density interaction.
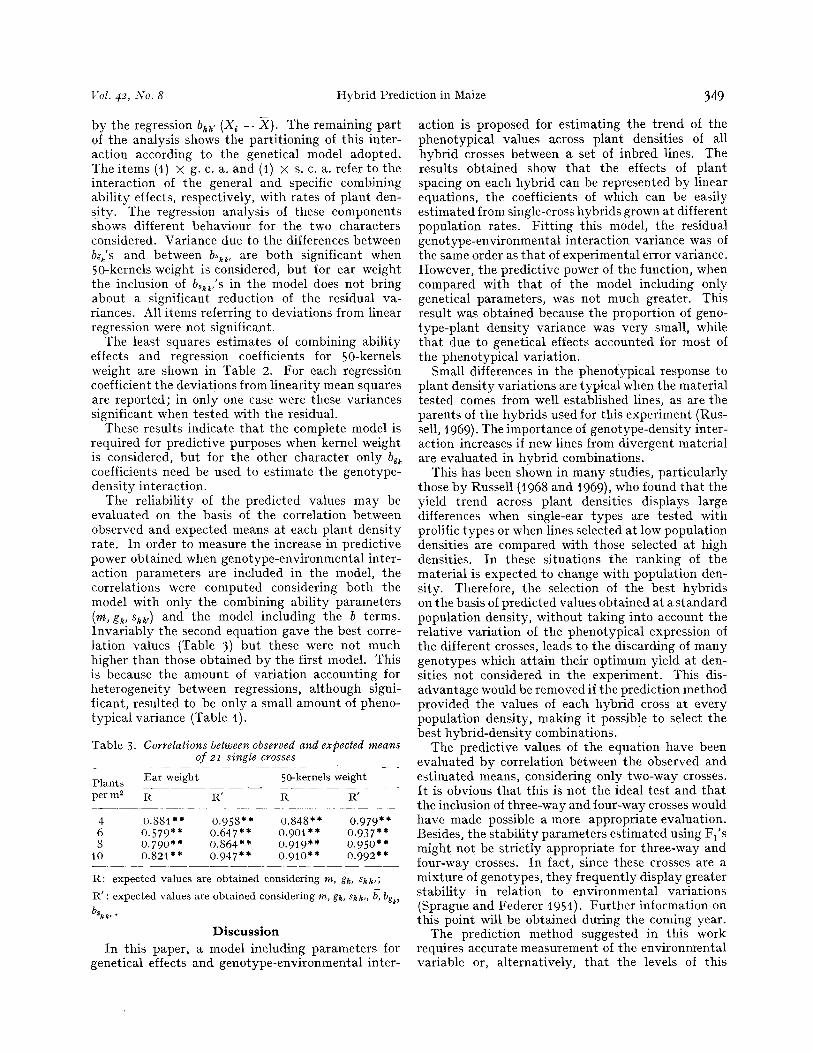
The reliability of the predicted values may be evaluated on the basis of the correlation between observed and expected means at each plant density rate. In order to measure the increase in predictive power obtained when genotype-environmental inter- action parameters are included in the model, the correlations were computed considering both the model with only the combining ability parameters (m, g~, s~,) and the model including the b terms. Invariably the second equation gave the best corre- lation values (Table 3) but these were not much higher than those obtained by the first model. This is because the amount of variation accounting for heterogeneity between regressions, although signi- ficant, resulted to be only a small amount of pheno- typical variance (Table 1).
Table 3. Correlations between observed and expected means o f 2 1 single c r o s s e s
Plants Ear weight 50-kernels weight
per m 2 R R' R R'
4 O.881 ** 0.958** 0.848** 0.979** 6 0.579** 0.647** 0.901"* 0.937** S 0.790** 0.864** 0.919"* 0.950**
10 0.821"* 0.947** 0.910"* 0.992**
IR: expected values are obtained considering m, gl~, skl~,;
R' : expected values are obtained considering m, g/~, skn,, b,, bg~,
bSkk ~ �9
D i s c u s s i o n In this paper, a model including parameters for
genetical effects and genotype-environmental inter-
action is proposed for estimating the trend of the phenotypical values across plant densities of all hybrid crosses between a set of inbred lines. The results obtained show that the effects of plant spacing on each hybrid can be represented by linear equations, the coefficients of which can be easily estimated from single-cross hybrids grown at different population rates. Fitting this model, the residual genotype-environmental interaction variance was of the same order as that of experimental error variance. However, the predictive power of the function, when compared with that of the model including only genetical parameters, was not much greater. This result was obtained because the proportion of geno- type-plant density variance was very small, while that due to genetical effects accounted for most of the phenotypical variation.
Small differences in the phenotypical response to plant density variations are typical when the material tested comes from well established lines, as are the parents of the hybrids used for this experiment (Rus- sell, 1969). The importance of genotype-density inter- action increases if new lines from divergent material are evaluated in hybrid combinations.
This has been shown in many studies, particularly those by Russell (1968 and 1969), who found that the yield trend across plant densities displays large differences when single-ear types are tested with prolific types or when lines selected at low population densities are compared with those selected at high densities. In these situations the ranking of the material is expected to change with population den- sity. Therefore, the selection of the best hybrids on the basis of predicted values obtained at a standard population density, without taking into account the relative variation of the phenotypical expression of the different crosses, leads to the discarding of many genotypes which attain their optimum yield at den- sities not considered in the experiment. This dis- advantage would be removed if the prediction method provided the values of each hybrid cross at every population density, making it possib!e to select the best hybrid-density combinations.
The predictive values of the equation have been evaluated by correlation between the observed and estimated means, considering only two-way crosses. It is obvious that this is not the ideal test and that the inclusion of three-way and four-way crosses would have made possible a more appropriate evaluation. Besides, the stability parameters estimated using Fl's might not be strictly appropriate for three-way and four-way crosses. In fact, since these crosses are a mixture of genotypes, they frequently display greater stability in relation to environmental variations (Sprague and Federer 1951). Further information on this point will be obtained during the coming year.
The prediction method suggested in this work requires accurate measurement of the environmental variable or, alternatively, that the levels of this
350 E. Ot taviano and M. Sari Gorla:
va r i ab l e be f ixed a pr ior i . I t c anno t be d i r e c t l y app l i ed when dea l ing wi th g e n o t y p e - i n t e r a c t i o n effects a r i s ing f rom the c o n c o m i t a n t ac t ion of m a n y e n v i r o n m e n t a l fac tors . This is the case, for example , w i th di f ferences be tween loca t ions in ra infa l l , the n a t u r e of the soil, t e m p e r a t u r e va r i a t i o ns and so on. In these s i tua t ions , for the regress ion ana lys i s of the g e n o t y p e - e n v i r o n m e n t a l i n t e r ac t i on , i t is p r o p o s e d to re la te the p h e n o t y p i c a l v a r i a t i o n s to an env i ron - m e n t a l i n d e x o b t a i n e d as t he m e a n of al l the va r i e t i e s cons ide red in the t r i a l ( E b e r h a r t and Rus- sell, 1966) or as the mean of a s amp le of va r i e t i e s cons ide red as s t a n d a r d (Bucio Alan i s and Hil l , t 966; Bucio Alan i s et al. t969 ; J i n k s and Perk ins , 1970). This second a p p r o a c h is more a p p r o p r i a t e for the s t a t i s t i c a l a s s u m p t i o n s on which the regress ion a n a l y - sis is ba sed ( F r e e m a n and Perk ins , t 9 7 t ) .
F o r h y b r i d p red ic t ion , the b io logica l a s say of e n v i r o n m e n t a l effects m a y be p e r f o r m e d b y t a k i n g as a s t a n d a r d a sample of all poss ible crosses where the ma in gene t i ca l effects are e q u a l l y r ep resen ted . This g roup of g e n o t y p e s can be o b t a i n e d in d i f fe ren t w a y s : o n e , sugges ted b y E b e r h a r t and G a r d n e r (t966) and b y H i n k e l m a n n (t968), uses i nco mple t e b lock des igns to select a b a l a n c e d s amp le of f o u r - w a y crosses. The inc lus ion of these f o u r - w a y crosses in the t r i a l w i th al l Fa 's m a k e s i t poss ib le for the pre- d i c t ive mode l to t a k e in to accoun t c o n s t a n t s for a d d i t i v e ep i s tas i s effects.
L i t e r a t u r e
1. Bucio Alanis, L.: Environmental and genotype- environmental components of variabil i ty. Inbred lines. Heredi ty ~1, 387--397 (1966). -- 2. Bucio Alanis, L., Hill, J. : Environmental and genotype-environmental com- ponents of variabil i ty. II . Heterozygotes. Heredi ty 21, 399--405 (1966). -- 3. Bucio Alanis, L., Perkins, M., Jinks, J. L. : Environmental and genotype-environmental components of variabil i ty. V. Segregating generations. Heredi ty 24, 115--127 (1969). -- 4. Eberhart , S . A . : Theoretical relations among single three way and double cross hybrids. Biometrics 20, 522--539 (1964). -- 5.
Hybr id Prediction in Maize
Eberhart , S .A. , Gardner, C.O. : A general model for genetic effects. Biometrics 22, 864--881 (1966). -- 6. Eberhart , S, A., Hallauer, A . R . : Genetic effects for yield in single, three-way and double-cross maize hybrids. Crop Sci. 8, 177--179 (1968). -- 7. Eberhart , S .A . , Russell, W . A . : Stabi l i ty parameters for comparing varieties. Crop Sci. 6, 36--40 (1966). -- 8. Eberhart , S. A., Russell, W. A., Penny, L. H.: Double cross hybrid pre- diction in maize when epistasis is present. Crop Sci. 4, 363--366 (1964). -- 9. Freeman, G. H., Perkins, J . M . : Environmental and genotype-environmental components of variabil i ty. VII I . Relations between genotypes grown in different environments and measure of these environ- ments. Heredi ty 26, 15--23 (1971). -- t0. Finlay, K. W., Wilkinson, C. N. : The analysis of adapta t ion in plant breeding programme. Aust. J. Agric. Res. 14, 742--754 (1963). -- t 1. Griffing, B. :Concept of general and specific combining abi l i ty in relation to diallel crossing systems. Aust. J. of Biol. Sci. 9, 463--493 (1956). -- 12. Hinkel- mann, K.: Par t ia l tetra-allel crosses. Theor. and Appl. Genetics 38, 85--89 (1968). -- 13. Jenkins, M.T . : Methods of estimating the performance of double crosses in corn. J. Amer. Soc. Agronomy 26, 199--204 (1934). -- 14. Jinks, J .L . , Perkins, J . M . : Environmental and genotype-environmental components of variabil i ty. VII . Simultaneous prediction across environments and gene- rations. Heredi ty 25, 419--429 (1970). -- 15. Ottaviano, E., Conti, S. : StabilitS. Ienotipica in mais in relazione al grado d ' investimento. Maydica XIII, t 13-- 128 (1968). -- t0. Ottaviano, E., Conti, S., Sari Gorla, M.: Metodi per la valutazione preventiva di ibridi di mais. Genetica Agraria XXlV, 348--361 (1970). -- 17. Perkins, J .M. , Jinks, J. L. : Environmental and genotype-environmental components of variabil i ty. I I I . Multiple lines and crosses. Heredi ty 23 , 339--356 (1968a). -- 18. Perkins, J .M. , Jinks, J. L. : Environmental and genotype -environmental components of variabil i ty. IV. Non linear interactions for multiple inbred lines. Heredi ty 23, 5 2 5 - 535 (1968 b). - - 19. Russell, W . A . : Testcrosses of one and two-ear types of corn belt maize inbreds. I. Performance of four p lant s tand densities. Crop Sci. 8, 244--247 (1968). -- 20. Russell, W. A. : Hybr id performance of maize inbred lines selected by testcross performance in low and high p lant densities. Crop Sci. 9, 185--188 (1969). -- 21. Sprague, G. F., Federer, ~AT. T. : A comparison of variance components in corn yield trials. II . Error, year • va- riety, location • variety, and var ie ty components. Agron. J. 43, 535-541 (1951). - 22. Yates, F., Cochran, W. G. : The analysis of groups of experiments. J. Agric. Sci. 28, 556--568 (1938).
Received February 29, 1972
Communicated by W. Seyffert
E. Ot taviano M. Sari Gorla I s t i tu to di Genetica Universit~ di Milano Via Celoria I 0 Milano (Italy)
Recommended