www.harriswilliams.com
Harris Williams & Co. Ltd is a private limited company incorporated under English law having its registered office at 5th Floor, 6 St. Andrew Street, London EC4A 3AE, UK, registered withthe Registrar of Companies for England and Wales under company number 7078852. Directors: Mr. Christopher Williams, Mr. Ned Valentine, Mr. Paul Poggi and Mr. Thierry Monjauze,authorised and regulated by the Financial Conduct Authority.
Harris Williams & Co. Ltd Niederlassung Frankfurt (German branch) is registered in the Commercial Register (Handelsregister) of the Local Court (Amtsgericht) of Frankfurt am Main,Germany, under registration number HRB 96687, having its business address at Bockenheimer Landstrasse 33-35, 60325 Frankfurt am Main, Germany. Permanent Representative(Ständiger Vertreter) of the Branch Niederlassung: Mr. Jeffery H. Perkins.
EUROPEAN TECHNOLOGY
0
INDUSTRY UPDATE │ AUGUST 2015
PAGE |
www.harriswilliams.comwww.harriswilliams.de
RECENT DEVELOPMENTS
1
COMPANY SPECIFIC NEWS
Fidelity National Information Services has agreed to acquire SunGard, the US-based provider of software and outsourced business process solutions for the financial, public sector and education industries, valuing the business at $9.1bn
The Carlyle Group and GIC have agreed to acquire Veritas, Symatec’s US-based information management unit of Symantec engaged in data availability software development, valuing the business unit at $8.0bn
The consortium of automotive companies, including AUDI, BMW and Daimler, have agreed to acquire HERE, the US-based provider of location intelligence and location-based services, from Nokia, valuing the business at €2.8bn
Liberty Interactive Corporation has agreed to acquire zulily, the US-based online flash sale retailer, valuing the businesses at $2.0bn
Digital Bridge and Stonepeak Infrastructure Partners, along with the management of ExteNet Systems, the US-based provider of network infrastructure solutions for wireless service providers, have acquired the company from existing investors, valuing the business at c.$1bn
Zegona has agreed to acquire Telecable de Asturias, the Spain-based provider of cable broadcasting and telecommunication services, from The Carlyle Group and Liberbank, valuing the business at €640m
Infor has agreed to acquire GT Nexus, the US-based provider of a cloud-based supply chain collaboration platform, from Warburg Pincus and ABN AMRO Private Equity, valuing the business at $675m
CDW Corporation has acquired the remaining 65% of Kelway, the UK-based provider of information technology services and solutions, from Core Capital Partners, valuing the business at $511m
Stroeer Out-of-Home Media has agreed to acquire t-online.de and InteractiveMedia, the Germany-based providers of broadband internet access, digital entertainment communication services and operator of an online portal for marketing digital media, from Deutsche Telekom, valuing the businesses at c.€300m
Palamon Capital Partners and Corsair Capital along with the management team of Currencies Direct, the UK-based provider of foreign exchange and international payment solutions, have agreed to acquire the company in a management buyout, from Azibo Group, valuing the business at over £200m
Adidas has acquired runtastic, the Austria-based mobile sport and fitness tracking application developer, from Axel Springer, valuing the business at €220m
Great Hill Partners along with the management of Reward Gateway, the UK-based provider of employee engagement software, have agreed to acquire the company from Inflexion Private Equity, valuing the business at £140m
Progressive Digital Media Group has agreed to acquire the DatamonitorFinancial, Datamonitor Consumer, MarketLine and Verdict businesses of InformaGroup, the UK-based provider of information for the academic, professional and business communities, valuing the business at £25m
Unibet Group has agreed to acquire iGame, the Malta-based gambling operator focused on the Nordics and Central Europe offering online casino, poker and sports betting through seven local brands, valuing the business at €59m with an additional potential earn-out of up to €20m
EUROPEAN TECHNOLOGY
INDUSTRY UPDATE │ AUGUST 2015
CONTENTS
RECENT DEVELOPMENTS
PUBLIC MARKET TRADING
SOFTWARE
IT SERVICES
COMMUNICATIONS
INTERNET AND DIGITAL MEDIA
TMT GROUP OVERVIEW
Our Technology, Media & Telecom (TMT) Group is dedicated to providing superior merger & acquisition and capital markets advisory services to market leading companies. Our extensive industry knowledge and transaction leadership experience spans the software, digital media, IT services and communications sectors. Our professionals in London, Boston and San Francisco have global relationships with leading technology companies and financial investors. Thoughtful advice, deep experience and technology expertise, creativity and attention to detail from our senior technology bankers have resulted in a track record of consistently exceeding our clients' expectations.
CONTACTS
EUROPE
Thierry MonjauzeManaging [email protected]+44 (0) 20 7518 8901
Jonathan OrganVice [email protected]+44 (0) 20 7518 8909
UNITED STATES
Jeff BistrongManaging [email protected]+1 (617) 482-7501
Michael WilkinsManaging [email protected]+1 (415) 288-4260
Sam HendlerManaging [email protected]+1 (617) 654-2117
PAGE |
(10%)
(8%)
(6%)
(4%)
(2%)
0%
2%
4%
6%
8%
10%
22 Jul 29 Jul 05 Aug 12 Aug 19 Aug
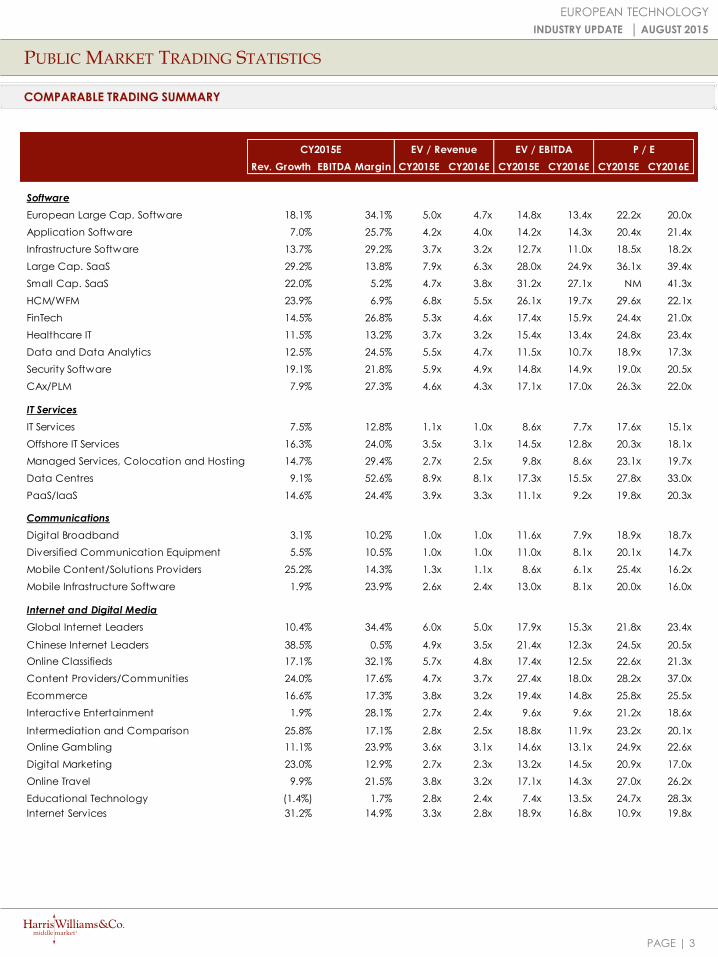
Communications DJ Stoxx 600 Technology
Internet and Digital Media IT Services
Software Nasdaq Composite
(20%)
(15%)
(10%)
(5%)
0%
5%
10%
15%
20%
25%
Aug 2014 Nov 2014 Feb 2015 May 2015
Communications DJ Stoxx 600 Technology
Internet and Digital Media IT Services
Nasdaq Composite Software
European businesses will spend €190bn on the adoption of business technology (technologies that help firms win, serve, and retain customers) in 2015, representing 28% of total technology purchases according to Forrester Research
A new report from Juniper Research forecasts strong adoption for 5G, with service revenues set to exceed €59.5 billion by 2025, compared to just €92m during the technology's first year of commercial services in 2020, representing a CAGR of 124%
By the end of 2015, an estimated 163.3m people across Western Europe will have access to a tablet and use it at least once per month, representing an increase of 11.2% compared to 2014, according to eMarketer’s latest research
The Internet of Things market in Central and Eastern Europe, the Middle East, and Africa (CEMA) is expected to expand 22% in 2015, reaching €12.8bn in total value, according to a new forecast from IDC
Revenue generated through ad-based music streaming is set to exceed €902m in 2017, up from €710m in 2015, representing a CAGR of 12.7%, according to Juniper Research
According to Gartner’s latest forecast, the worldwide IT Services market grew 3.8% in 2015 reaching nearly $914bn in 2015, growing 3.8% year on year. With outsourcing contributing more than half of market growth in constant currency, the market will reach $1.1bn in 2019
INDUSTRY TRENDS
RECENT DEVELOPMENTS
2
EUROPEAN TECHNOLOGY
INDUSTRY UPDATE │ AUGUST 2015
LAST TWELVE MONTHS
Stock Performance
LAST 30 DAYS
PUBLIC MARKET TRADING STATISTICS
Source: Various industry news outlets
1.4%
(0.6%)
(7.1%)
(3.4%)
(3.9%)
(5.2%)
10.9%
10.6%
7.4%
4.6%
0.3%
(15.7%)
PAGE |
PUBLIC MARKET TRADING STATISTICS
3
EUROPEAN TECHNOLOGY
INDUSTRY UPDATE │ AUGUST 2015
COMPARABLE TRADING SUMMARY
Rev. Growth EBITDA Margin CY2015E CY2016E CY2015E CY2016E CY2015E CY2016E
Software
European Large Cap. Software 18.1% 34.1% 5.0x 4.7x 14.8x 13.4x 22.2x 20.0x
Application Software 7.0% 25.7% 4.2x 4.0x 14.2x 14.3x 20.4x 21.4x
Infrastructure Software 13.7% 29.2% 3.7x 3.2x 12.7x 11.0x 18.5x 18.2x
Large Cap. SaaS 29.2% 13.8% 7.9x 6.3x 28.0x 24.9x 36.1x 39.4x
Small Cap. SaaS 22.0% 5.2% 4.7x 3.8x 31.2x 27.1x NM 41.3x
HCM/WFM 23.9% 6.9% 6.8x 5.5x 26.1x 19.7x 29.6x 22.1x
FinTech 14.5% 26.8% 5.3x 4.6x 17.4x 15.9x 24.4x 21.0x
Healthcare IT 11.5% 13.2% 3.7x 3.2x 15.4x 13.4x 24.8x 23.4x
Data and Data Analytics 12.5% 24.5% 5.5x 4.7x 11.5x 10.7x 18.9x 17.3x
Security Software 19.1% 21.8% 5.9x 4.9x 14.8x 14.9x 19.0x 20.5x
CAx/PLM 7.9% 27.3% 4.6x 4.3x 17.1x 17.0x 26.3x 22.0x
IT Services
IT Services 7.5% 12.8% 1.1x 1.0x 8.6x 7.7x 17.6x 15.1x
Offshore IT Services 16.3% 24.0% 3.5x 3.1x 14.5x 12.8x 20.3x 18.1x
Managed Services, Colocation and Hosting 14.7% 29.4% 2.7x 2.5x 9.8x 8.6x 23.1x 19.7x
Data Centres 9.1% 52.6% 8.9x 8.1x 17.3x 15.5x 27.8x 33.0x
PaaS/IaaS 14.6% 24.4% 3.9x 3.3x 11.1x 9.2x 19.8x 20.3x
Communications
Digital Broadband 3.1% 10.2% 1.0x 1.0x 11.6x 7.9x 18.9x 18.7x
Diversified Communication Equipment 5.5% 10.5% 1.0x 1.0x 11.0x 8.1x 20.1x 14.7x
Mobile Content/Solutions Providers 25.2% 14.3% 1.3x 1.1x 8.6x 6.1x 25.4x 16.2x
Mobile Infrastructure Software 1.9% 23.9% 2.6x 2.4x 13.0x 8.1x 20.0x 16.0x
Internet and Digital Media
Global Internet Leaders 10.4% 34.4% 6.0x 5.0x 17.9x 15.3x 21.8x 23.4x
Chinese Internet Leaders 38.5% 0.5% 4.9x 3.5x 21.4x 12.3x 24.5x 20.5x
Online Classifieds 17.1% 32.1% 5.7x 4.8x 17.4x 12.5x 22.6x 21.3x
Content Providers/Communities 24.0% 17.6% 4.7x 3.7x 27.4x 18.0x 28.2x 37.0x
Ecommerce 16.6% 17.3% 3.8x 3.2x 19.4x 14.8x 25.8x 25.5x
Interactive Entertainment 1.9% 28.1% 2.7x 2.4x 9.6x 9.6x 21.2x 18.6x
Intermediation and Comparison 25.8% 17.1% 2.8x 2.5x 18.8x 11.9x 23.2x 20.1x
Online Gambling 11.1% 23.9% 3.6x 3.1x 14.6x 13.1x 24.9x 22.6x
Digital Marketing 23.0% 12.9% 2.7x 2.3x 13.2x 14.5x 20.9x 17.0x
Online Travel 9.9% 21.5% 3.8x 3.2x 17.1x 14.3x 27.0x 26.2x
Educational Technology (1.4%) 1.7% 2.8x 2.4x 7.4x 13.5x 24.7x 28.3x
Internet Services 31.2% 14.9% 3.3x 2.8x 18.9x 16.8x 10.9x 19.8x
P / EEV / Revenue EV / EBITDACY2015E
PAGE |
(15%)
(10%)
(5%)
0%
5%
10%
15%
22 Jul 29 Jul 05 Aug 12 Aug 19 Aug
Application Software CAx/PLM Data and Data Analytics European Large Cap. Software
Fintech HCM/WFM Healthcare IT Infrastructure Software
Large Cap. SaaS Security Software Small Cap. SaaS
SOFTWARE
4
EUROPEAN TECHNOLOGY
INDUSTRY UPDATE │ AUGUST 2015
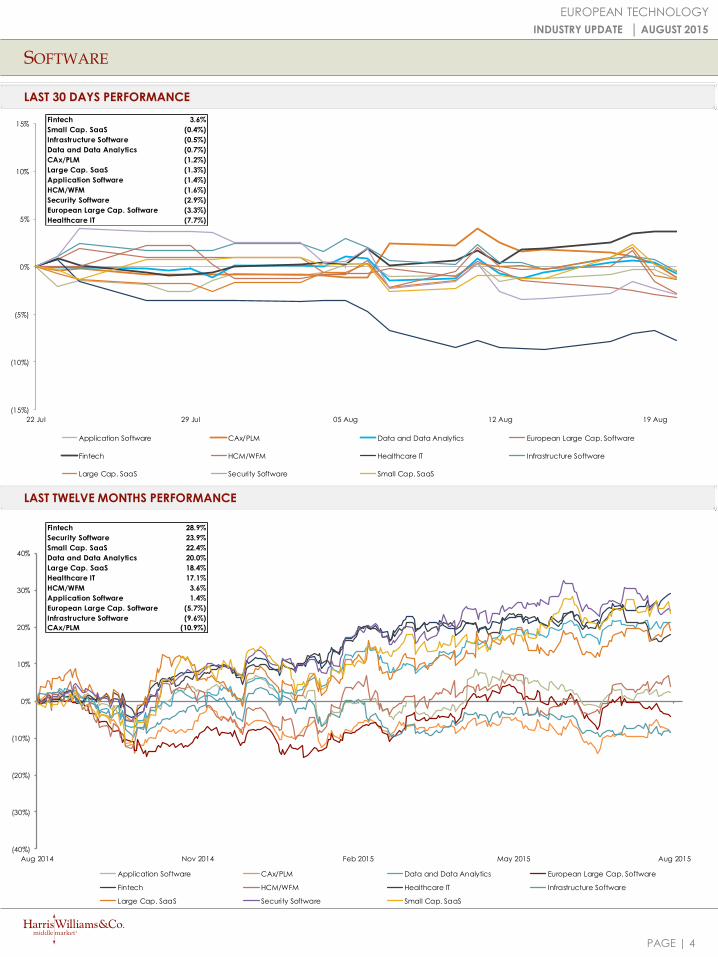
LAST 30 DAYS PERFORMANCE
LAST TWELVE MONTHS PERFORMANCE
(40%)
(30%)
(20%)
(10%)
0%
10%
20%
30%
40%
Aug 2014 Nov 2014 Feb 2015 May 2015 Aug 2015
Application Software CAx/PLM Data and Data Analytics European Large Cap. Software
Fintech HCM/WFM Healthcare IT Infrastructure Software
Large Cap. SaaS Security Software Small Cap. SaaS
Fintech 28.9%
Security Software 23.9%
Small Cap. SaaS 22.4%
Data and Data Analytics 20.0%
Large Cap. SaaS 18.4%
Healthcare IT 17.1%
HCM/WFM 3.6%
Application Software 1.4%
European Large Cap. Software (5.7%)
Infrastructure Software (9.6%)
CAx/PLM (10.9%)
Fintech 3.6%
Small Cap. SaaS (0.4%)
Infrastructure Software (0.5%)
Data and Data Analytics (0.7%)
CAx/PLM (1.2%)
Large Cap. SaaS (1.3%)
Application Software (1.4%)
HCM/WFM (1.6%)
Security Software (2.9%)
European Large Cap. Software (3.3%)
Healthcare IT (7.7%)
PAGE |
SOFTWARE
5
EUROPEAN TECHNOLOGY
INDUSTRY UPDATE │ AUGUST 2015
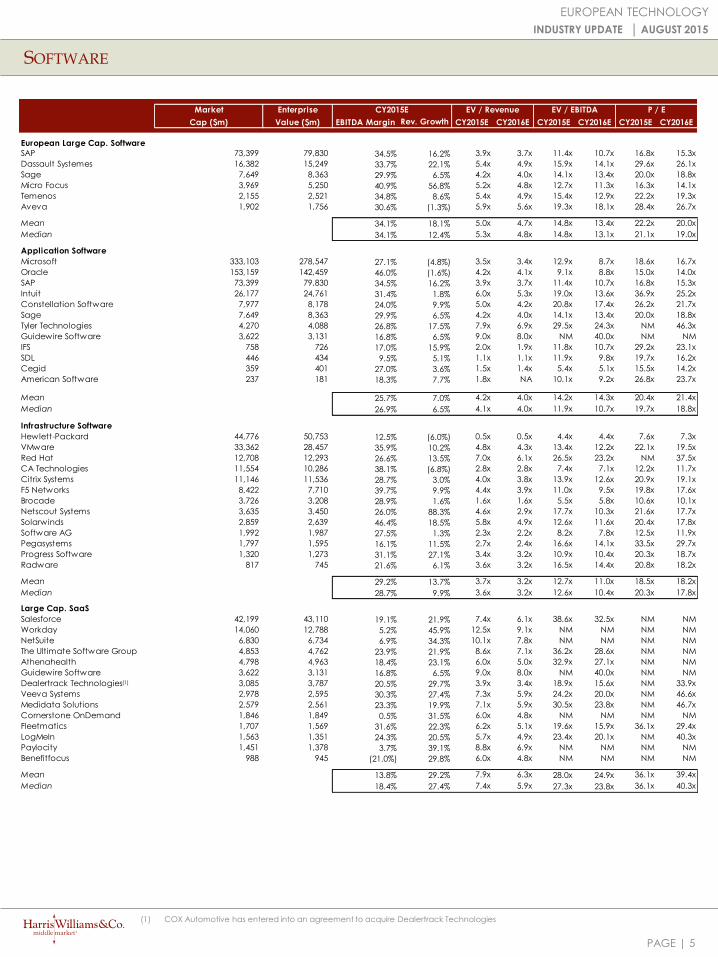
Market Enterprise CY2015E
Cap ($m) Value ($m) EBITDA Margin Rev. Growth CY2015E CY2016E CY2015E CY2016E CY2015E CY2016E
European Large Cap. Software
SAP 73,399 79,830 34.5% 16.2% 3.9x 3.7x 11.4x 10.7x 16.8x 15.3x
Dassault Systemes 16,382 15,249 33.7% 22.1% 5.4x 4.9x 15.9x 14.1x 29.6x 26.1x
Sage 7,649 8,363 29.9% 6.5% 4.2x 4.0x 14.1x 13.4x 20.0x 18.8x
Micro Focus 3,969 5,250 40.9% 56.8% 5.2x 4.8x 12.7x 11.3x 16.3x 14.1x
Temenos 2,155 2,521 34.8% 8.6% 5.4x 4.9x 15.4x 12.9x 22.2x 19.3x
Aveva 1,902 1,756 30.6% (1.3%) 5.9x 5.6x 19.3x 18.1x 28.4x 26.7x
Mean 34.1% 18.1% 5.0x 4.7x 14.8x 13.4x 22.2x 20.0x
Median 34.1% 12.4% 5.3x 4.8x 14.8x 13.1x 21.1x 19.0x
Application Software
Microsoft 333,103 278,547 27.1% (4.8%) 3.5x 3.4x 12.9x 8.7x 18.6x 16.7x
Oracle 153,159 142,459 46.0% (1.6%) 4.2x 4.1x 9.1x 8.8x 15.0x 14.0x
SAP 73,399 79,830 34.5% 16.2% 3.9x 3.7x 11.4x 10.7x 16.8x 15.3x
Intuit 26,177 24,761 31.4% 1.8% 6.0x 5.3x 19.0x 13.6x 36.9x 25.2x
Constellation Software 7,977 8,178 24.0% 9.9% 5.0x 4.2x 20.8x 17.4x 26.2x 21.7x
Sage 7,649 8,363 29.9% 6.5% 4.2x 4.0x 14.1x 13.4x 20.0x 18.8x
Tyler Technologies 4,270 4,088 26.8% 17.5% 7.9x 6.9x 29.5x 24.3x NM 46.3x
Guidewire Software 3,622 3,131 16.8% 6.5% 9.0x 8.0x NM 40.0x NM NM
IFS 758 726 17.0% 15.9% 2.0x 1.9x 11.8x 10.7x 29.2x 23.1x
SDL 446 434 9.5% 5.1% 1.1x 1.1x 11.9x 9.8x 19.7x 16.2x
Cegid 359 401 27.0% 3.6% 1.5x 1.4x 5.4x 5.1x 15.5x 14.2x
American Software 237 181 18.3% 7.7% 1.8x NA 10.1x 9.2x 26.8x 23.7x
Mean 25.7% 7.0% 4.2x 4.0x 14.2x 14.3x 20.4x 21.4x
Median 26.9% 6.5% 4.1x 4.0x 11.9x 10.7x 19.7x 18.8x
Infrastructure Software
Hewlett-Packard 44,776 50,753 12.5% (6.0%) 0.5x 0.5x 4.4x 4.4x 7.6x 7.3x
VMware 33,362 28,457 35.9% 10.2% 4.8x 4.3x 13.4x 12.2x 22.1x 19.5x
Red Hat 12,708 12,293 26.6% 13.5% 7.0x 6.1x 26.5x 23.2x NM 37.5x
CA Technologies 11,554 10,286 38.1% (6.8%) 2.8x 2.8x 7.4x 7.1x 12.2x 11.7x
Citrix Systems 11,146 11,536 28.7% 3.0% 4.0x 3.8x 13.9x 12.6x 20.9x 19.1x
F5 Networks 8,422 7,710 39.7% 9.9% 4.4x 3.9x 11.0x 9.5x 19.8x 17.6x
Brocade 3,726 3,208 28.9% 1.6% 1.6x 1.6x 5.5x 5.8x 10.6x 10.1x
Netscout Systems 3,635 3,450 26.0% 88.3% 4.6x 2.9x 17.7x 10.3x 21.6x 17.7x
Solarwinds 2,859 2,639 46.4% 18.5% 5.8x 4.9x 12.6x 11.6x 20.4x 17.8x
Software AG 1,992 1,987 27.5% 1.3% 2.3x 2.2x 8.2x 7.8x 12.5x 11.9x
Pegasystems 1,797 1,595 16.1% 11.5% 2.7x 2.4x 16.6x 14.1x 33.5x 29.7x
Progress Software 1,320 1,273 31.1% 27.1% 3.4x 3.2x 10.9x 10.4x 20.3x 18.7x
Radware 817 745 21.6% 6.1% 3.6x 3.2x 16.5x 14.4x 20.8x 18.2x
Mean 29.2% 13.7% 3.7x 3.2x 12.7x 11.0x 18.5x 18.2x
Median 28.7% 9.9% 3.6x 3.2x 12.6x 10.4x 20.3x 17.8x
Large Cap. SaaS
Salesforce 42,199 43,110 19.1% 21.9% 7.4x 6.1x 38.6x 32.5x NM NM
Workday 14,060 12,788 5.2% 45.9% 12.5x 9.1x NM NM NM NM
NetSuite 6,830 6,734 6.9% 34.3% 10.1x 7.8x NM NM NM NM
The Ultimate Software Group 4,853 4,762 23.9% 21.9% 8.6x 7.1x 36.2x 28.6x NM NM
Athenahealth 4,798 4,963 18.4% 23.1% 6.0x 5.0x 32.9x 27.1x NM NM
Guidewire Software 3,622 3,131 16.8% 6.5% 9.0x 8.0x NM 40.0x NM NM
Dealertrack Technologies 3,085 3,787 20.5% 29.7% 3.9x 3.4x 18.9x 15.6x NM 33.9x
Veeva Systems 2,978 2,595 30.3% 27.4% 7.3x 5.9x 24.2x 20.0x NM 46.6x
Medidata Solutions 2,579 2,561 23.3% 19.9% 7.1x 5.9x 30.5x 23.8x NM 46.7x
Cornerstone OnDemand 1,846 1,849 0.5% 31.5% 6.0x 4.8x NM NM NM NM
Fleetmatics 1,707 1,569 31.6% 22.3% 6.2x 5.1x 19.6x 15.9x 36.1x 29.4x
LogMeIn 1,563 1,351 24.3% 20.5% 5.7x 4.9x 23.4x 20.1x NM 40.3x
Paylocity 1,451 1,378 3.7% 39.1% 8.8x 6.9x NM NM NM NM
Benefitfocus 988 945 (21.0%) 29.8% 6.0x 4.8x NM NM NM NM
Mean 13.8% 29.2% 7.9x 6.3x 28.0x 24.9x 36.1x 39.4x
Median 18.4% 27.4% 7.4x 5.9x 27.3x 23.8x 36.1x 40.3x
EV / Revenue EV / EBITDA P / E
(1) COX Automotive has entered into an agreement to acquire Dealertrack Technologies
(1)
PAGE |
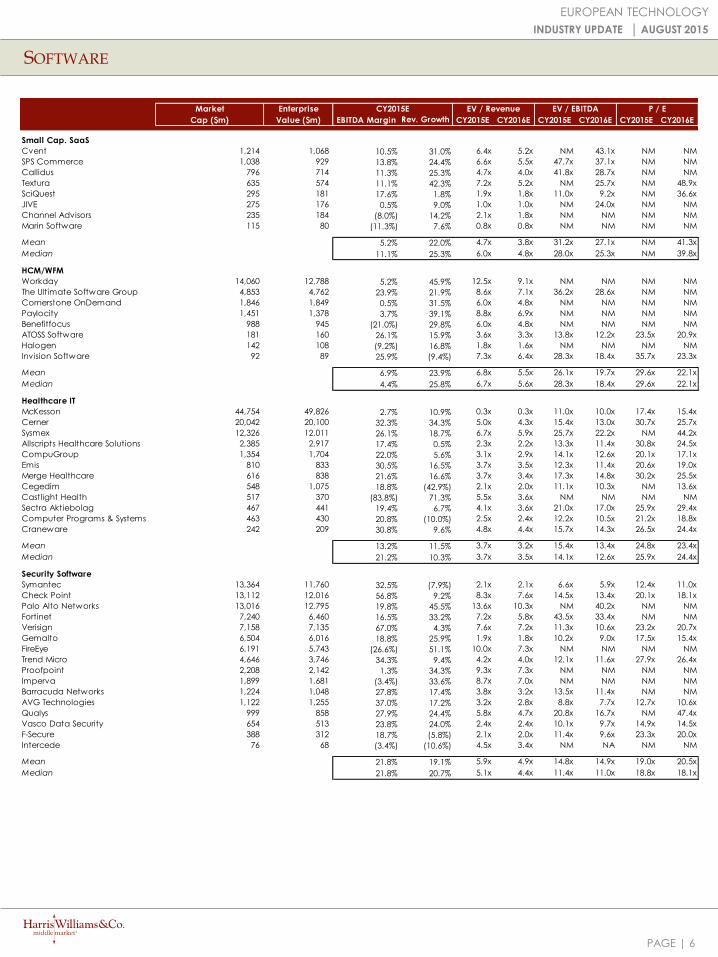
Market Enterprise CY2015E
Cap ($m) Value ($m) EBITDA Margin Rev. Growth CY2015E CY2016E CY2015E CY2016E CY2015E CY2016E
Small Cap. SaaS
Cvent 1,214 1,068 10.5% 31.0% 6.4x 5.2x NM 43.1x NM NM
SPS Commerce 1,038 929 13.8% 24.4% 6.6x 5.5x 47.7x 37.1x NM NM
Callidus 796 714 11.3% 25.3% 4.7x 4.0x 41.8x 28.7x NM NM
Textura 635 574 11.1% 42.3% 7.2x 5.2x NM 25.7x NM 48.9x
SciQuest 295 181 17.6% 1.8% 1.9x 1.8x 11.0x 9.2x NM 36.6x
JIVE 275 176 0.5% 9.0% 1.0x 1.0x NM 24.0x NM NM
Channel Advisors 235 184 (8.0%) 14.2% 2.1x 1.8x NM NM NM NM
Marin Software 115 80 (11.3%) 7.6% 0.8x 0.8x NM NM NM NM
Mean 5.2% 22.0% 4.7x 3.8x 31.2x 27.1x NM 41.3x
Median 11.1% 25.3% 6.0x 4.8x 28.0x 25.3x NM 39.8x
HCM/WFM
Workday 14,060 12,788 5.2% 45.9% 12.5x 9.1x NM NM NM NM
The Ultimate Software Group 4,853 4,762 23.9% 21.9% 8.6x 7.1x 36.2x 28.6x NM NM
Cornerstone OnDemand 1,846 1,849 0.5% 31.5% 6.0x 4.8x NM NM NM NM
Paylocity 1,451 1,378 3.7% 39.1% 8.8x 6.9x NM NM NM NM
Benefitfocus 988 945 (21.0%) 29.8% 6.0x 4.8x NM NM NM NM
ATOSS Software 181 160 26.1% 15.9% 3.6x 3.3x 13.8x 12.2x 23.5x 20.9x
Halogen 142 108 (9.2%) 16.8% 1.8x 1.6x NM NM NM NM
Invision Software 92 89 25.9% (9.4%) 7.3x 6.4x 28.3x 18.4x 35.7x 23.3x
Mean 6.9% 23.9% 6.8x 5.5x 26.1x 19.7x 29.6x 22.1x
Median 4.4% 25.8% 6.7x 5.6x 28.3x 18.4x 29.6x 22.1x
Healthcare IT
McKesson 44,754 49,826 2.7% 10.9% 0.3x 0.3x 11.0x 10.0x 17.4x 15.4x
Cerner 20,042 20,100 32.3% 34.3% 5.0x 4.3x 15.4x 13.0x 30.7x 25.7x
Sysmex 12,326 12,011 26.1% 18.7% 6.7x 5.9x 25.7x 22.2x NM 44.2x
Allscripts Healthcare Solutions 2,385 2,917 17.4% 0.5% 2.3x 2.2x 13.3x 11.4x 30.8x 24.5x
CompuGroup 1,354 1,704 22.0% 5.6% 3.1x 2.9x 14.1x 12.6x 20.1x 17.1x
Emis 810 833 30.5% 16.5% 3.7x 3.5x 12.3x 11.4x 20.6x 19.0x
Merge Healthcare 616 838 21.6% 16.6% 3.7x 3.4x 17.3x 14.8x 30.2x 25.5x
Cegedim 548 1,075 18.8% (42.9%) 2.1x 2.0x 11.1x 10.3x NM 13.6x
Castlight Health 517 370 (83.8%) 71.3% 5.5x 3.6x NM NM NM NM
Sectra Aktiebolag 467 441 19.4% 6.7% 4.1x 3.6x 21.0x 17.0x 25.9x 29.4x
Computer Programs & Systems 463 430 20.8% (10.0%) 2.5x 2.4x 12.2x 10.5x 21.2x 18.8x
Craneware 242 209 30.8% 9.6% 4.8x 4.4x 15.7x 14.3x 26.5x 24.4x
Mean 13.2% 11.5% 3.7x 3.2x 15.4x 13.4x 24.8x 23.4x
Median 21.2% 10.3% 3.7x 3.5x 14.1x 12.6x 25.9x 24.4x
Security Software
Symantec 13,364 11,760 32.5% (7.9%) 2.1x 2.1x 6.6x 5.9x 12.4x 11.0x
Check Point 13,112 12,016 56.8% 9.2% 8.3x 7.6x 14.5x 13.4x 20.1x 18.1x
Palo Alto Networks 13,016 12,795 19.8% 45.5% 13.6x 10.3x NM 40.2x NM NM
Fortinet 7,240 6,460 16.5% 33.2% 7.2x 5.8x 43.5x 33.4x NM NM
Verisign 7,158 7,135 67.0% 4.3% 7.6x 7.2x 11.3x 10.6x 23.2x 20.7x
Gemalto 6,504 6,016 18.8% 25.9% 1.9x 1.8x 10.2x 9.0x 17.5x 15.4x
FireEye 6,191 5,743 (26.6%) 51.1% 10.0x 7.3x NM NM NM NM
Trend Micro 4,646 3,746 34.3% 9.4% 4.2x 4.0x 12.1x 11.6x 27.9x 26.4x
Proofpoint 2,208 2,142 1.3% 34.3% 9.3x 7.3x NM NM NM NM
Imperva 1,899 1,681 (3.4%) 33.6% 8.7x 7.0x NM NM NM NM
Barracuda Networks 1,224 1,048 27.8% 17.4% 3.8x 3.2x 13.5x 11.4x NM NM
AVG Technologies 1,122 1,255 37.0% 17.2% 3.2x 2.8x 8.8x 7.7x 12.7x 10.6x
Qualys 999 858 27.9% 24.4% 5.8x 4.7x 20.8x 16.7x NM 47.4x
Vasco Data Security 654 513 23.8% 24.0% 2.4x 2.4x 10.1x 9.7x 14.9x 14.5x
F-Secure 388 312 18.7% (5.8%) 2.1x 2.0x 11.4x 9.6x 23.3x 20.0x
Intercede 76 68 (3.4%) (10.6%) 4.5x 3.4x NM NA NM NM
Mean 21.8% 19.1% 5.9x 4.9x 14.8x 14.9x 19.0x 20.5x
Median 21.8% 20.7% 5.1x 4.4x 11.4x 11.0x 18.8x 18.1x
P / EEV / Revenue EV / EBITDA
SOFTWARE
6
EUROPEAN TECHNOLOGY
INDUSTRY UPDATE │ AUGUST 2015
PAGE |
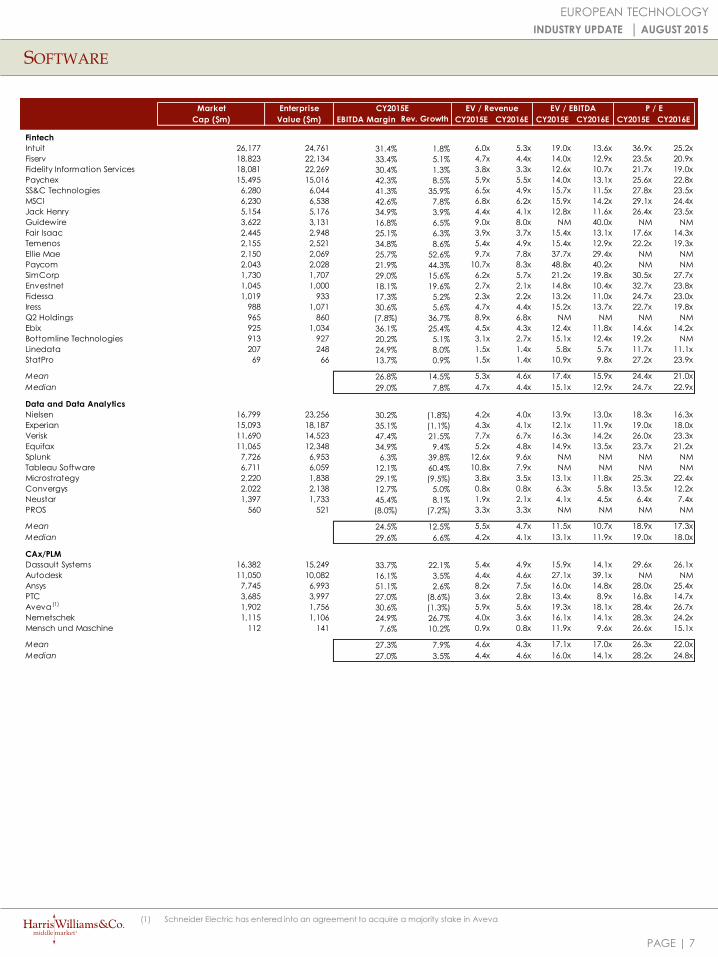
Market Enterprise CY2015E
Cap ($m) Value ($m) EBITDA Margin Rev. Growth CY2015E CY2016E CY2015E CY2016E CY2015E CY2016E
Fintech
Intuit 26,177 24,761 31.4% 1.8% 6.0x 5.3x 19.0x 13.6x 36.9x 25.2x
Fiserv 18,823 22,134 33.4% 5.1% 4.7x 4.4x 14.0x 12.9x 23.5x 20.9x
Fidelity Information Services 18,081 22,269 30.4% 1.3% 3.8x 3.3x 12.6x 10.7x 21.7x 19.0x
Paychex 15,495 15,016 42.3% 8.5% 5.9x 5.5x 14.0x 13.1x 25.6x 22.8x
SS&C Technologies 6,280 6,044 41.3% 35.9% 6.5x 4.9x 15.7x 11.5x 27.8x 23.5x
MSCI 6,230 6,538 42.6% 7.8% 6.8x 6.2x 15.9x 14.2x 29.1x 24.4x
Jack Henry 5,154 5,176 34.9% 3.9% 4.4x 4.1x 12.8x 11.6x 26.4x 23.5x
Guidewire 3,622 3,131 16.8% 6.5% 9.0x 8.0x NM 40.0x NM NM
Fair Isaac 2,445 2,948 25.1% 6.3% 3.9x 3.7x 15.4x 13.1x 17.6x 14.3x
Temenos 2,155 2,521 34.8% 8.6% 5.4x 4.9x 15.4x 12.9x 22.2x 19.3x
Ellie Mae 2,150 2,069 25.7% 52.6% 9.7x 7.8x 37.7x 29.4x NM NM
Paycom 2,043 2,028 21.9% 44.3% 10.7x 8.3x 48.8x 40.2x NM NM
SimCorp 1,730 1,707 29.0% 15.6% 6.2x 5.7x 21.2x 19.8x 30.5x 27.7x
Envestnet 1,045 1,000 18.1% 19.6% 2.7x 2.1x 14.8x 10.4x 32.7x 23.8x
Fidessa 1,019 933 17.3% 5.2% 2.3x 2.2x 13.2x 11.0x 24.7x 23.0x
Iress 988 1,071 30.6% 5.6% 4.7x 4.4x 15.2x 13.7x 22.7x 19.8x
Q2 Holdings 965 860 (7.8%) 36.7% 8.9x 6.8x NM NM NM NM
Ebix 925 1,034 36.1% 25.4% 4.5x 4.3x 12.4x 11.8x 14.6x 14.2x
Bottomline Technologies 913 927 20.2% 5.1% 3.1x 2.7x 15.1x 12.4x 19.2x NM
Linedata 207 248 24.9% 8.0% 1.5x 1.4x 5.8x 5.7x 11.7x 11.1x
StatPro 69 66 13.7% 0.9% 1.5x 1.4x 10.9x 9.8x 27.2x 23.9x
Mean 26.8% 14.5% 5.3x 4.6x 17.4x 15.9x 24.4x 21.0x
Median 29.0% 7.8% 4.7x 4.4x 15.1x 12.9x 24.7x 22.9x
Data and Data Analytics
Nielsen 16,799 23,256 30.2% (1.8%) 4.2x 4.0x 13.9x 13.0x 18.3x 16.3x
Experian 15,093 18,187 35.1% (1.1%) 4.3x 4.1x 12.1x 11.9x 19.0x 18.0x
Verisk 11,690 14,523 47.4% 21.5% 7.7x 6.7x 16.3x 14.2x 26.0x 23.3x
Equifax 11,065 12,348 34.9% 9.4% 5.2x 4.8x 14.9x 13.5x 23.7x 21.2x
Splunk 7,726 6,953 6.3% 39.8% 12.6x 9.6x NM NM NM NM
Tableau Software 6,711 6,059 12.1% 60.4% 10.8x 7.9x NM NM NM NM
Microstrategy 2,220 1,838 29.1% (9.5%) 3.8x 3.5x 13.1x 11.8x 25.3x 22.4x
Convergys 2,022 2,138 12.7% 5.0% 0.8x 0.8x 6.3x 5.8x 13.5x 12.2x
Neustar 1,397 1,733 45.4% 8.1% 1.9x 2.1x 4.1x 4.5x 6.4x 7.4x
PROS 560 521 (8.0%) (7.2%) 3.3x 3.3x NM NM NM NM
Mean 24.5% 12.5% 5.5x 4.7x 11.5x 10.7x 18.9x 17.3x
Median 29.6% 6.6% 4.2x 4.1x 13.1x 11.9x 19.0x 18.0x
CAx/PLM
Dassault Systems 16,382 15,249 33.7% 22.1% 5.4x 4.9x 15.9x 14.1x 29.6x 26.1x
Autodesk 11,050 10,082 16.1% 3.5% 4.4x 4.6x 27.1x 39.1x NM NM
Ansys 7,745 6,993 51.1% 2.6% 8.2x 7.5x 16.0x 14.8x 28.0x 25.4x
PTC 3,685 3,997 27.0% (8.6%) 3.6x 2.8x 13.4x 8.9x 16.8x 14.7x
Aveva 1,902 1,756 30.6% (1.3%) 5.9x 5.6x 19.3x 18.1x 28.4x 26.7x
Nemetschek 1,115 1,106 24.9% 26.7% 4.0x 3.6x 16.1x 14.1x 28.3x 24.2x
Mensch und Maschine 112 141 7.6% 10.2% 0.9x 0.8x 11.9x 9.6x 26.6x 15.1x
Mean 27.3% 7.9% 4.6x 4.3x 17.1x 17.0x 26.3x 22.0x
Median 27.0% 3.5% 4.4x 4.6x 16.0x 14.1x 28.2x 24.8x
EV / Revenue EV / EBITDA P / E
SOFTWARE
7
EUROPEAN TECHNOLOGY
INDUSTRY UPDATE │ AUGUST 2015
(1) Schneider Electric has entered into an agreement to acquire a majority stake in Aveva
(1)
PAGE |
(20%)
(10%)
0%
10%
20%
30%
40%
50%
Aug 2014 Nov 2014 Feb 2015 May 2015 Aug 2015
Data Centres IT Services Managed Services, Colocation and Hosting Offshore IT Services PaaS/IaaS
(8%)
(6%)
(4%)
(2%)
0%
2%
4%
6%
8%
22 Jul 29 Jul 05 Aug 12 Aug 19 Aug
Data Centres IT Services Managed Services, Colocation and Hosting Offshore IT Services PaaS/IaaS
IT SERVICES
8
EUROPEAN TECHNOLOGY
INDUSTRY UPDATE │ AUGUST 2015
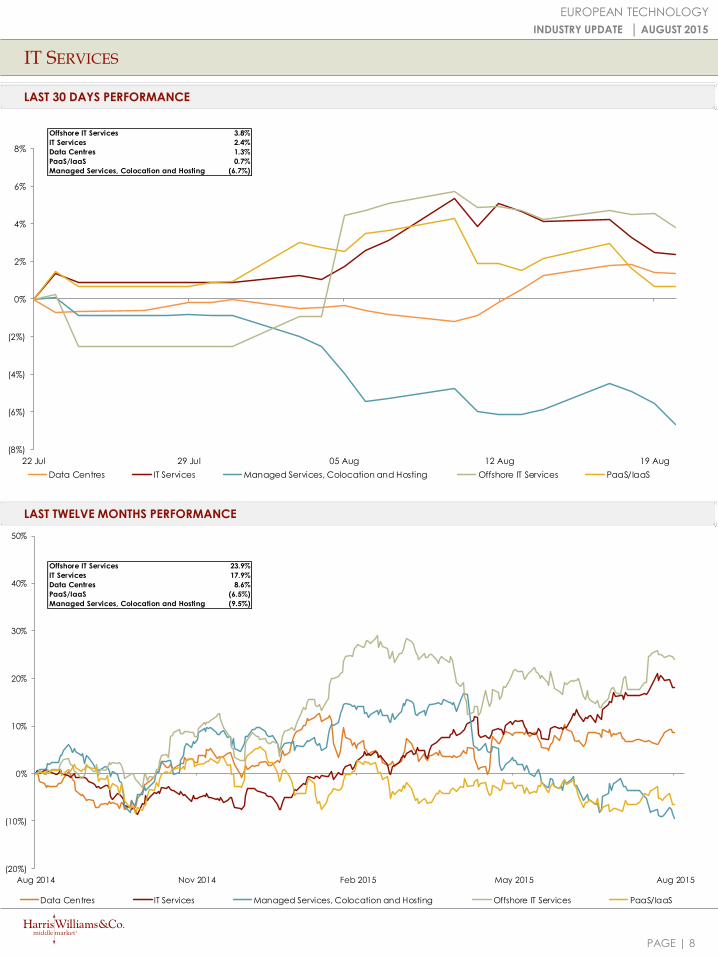
LAST 30 DAYS PERFORMANCE
LAST TWELVE MONTHS PERFORMANCE
Offshore IT Services 3.8%
IT Services 2.4%
Data Centres 1.3%
PaaS/IaaS 0.7%
Managed Services, Colocation and Hosting (6.7%)
Offshore IT Services 23.9%
IT Services 17.9%
Data Centres 8.6%
PaaS/IaaS (6.5%)
Managed Services, Colocation and Hosting (9.5%)
PAGE |
0
Market Enterprise CY2015E
Cap ($m) Value ($m) EBITDA Margin Rev. Growth CY2015E CY2016E CY2015E CY2016E CY2015E CY2016E
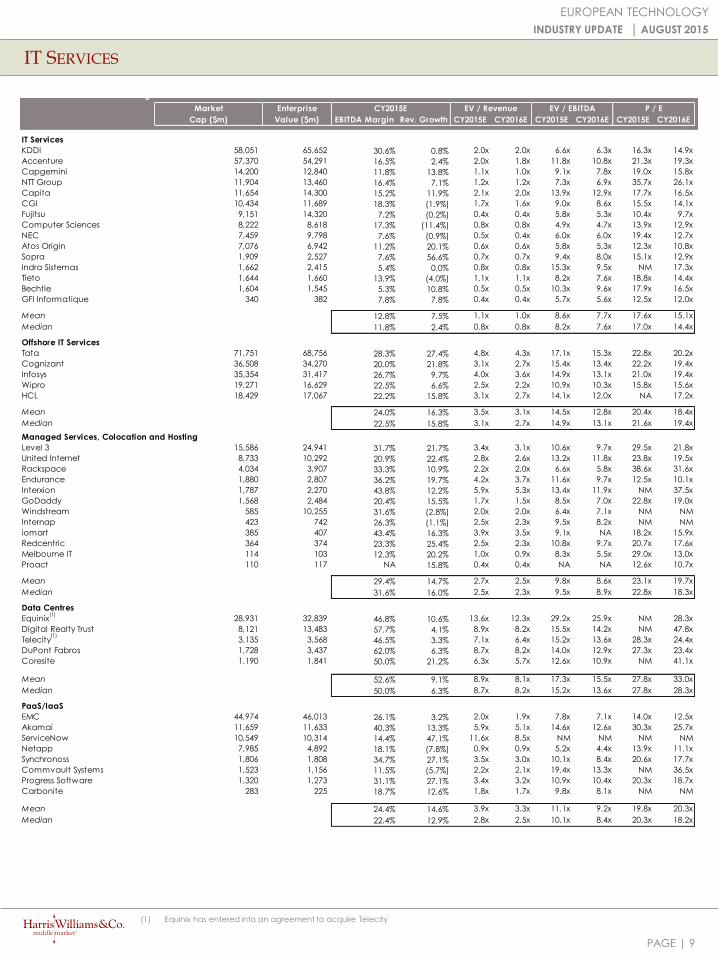
IT Services
KDDI 58,051 65,652 30.6% 0.8% 2.0x 2.0x 6.6x 6.3x 16.3x 14.9x
Accenture 57,370 54,291 16.5% 2.4% 2.0x 1.8x 11.8x 10.8x 21.3x 19.3x
Capgemini 14,200 12,840 11.8% 13.8% 1.1x 1.0x 9.1x 7.8x 19.0x 15.8x
NTT Group 11,904 13,460 16.4% 7.1% 1.2x 1.2x 7.3x 6.9x 35.7x 26.1x
Capita 11,654 14,300 15.2% 11.9% 2.1x 2.0x 13.9x 12.9x 17.7x 16.5x
CGI 10,434 11,689 18.3% (1.9%) 1.7x 1.6x 9.0x 8.6x 15.5x 14.1x
Fujitsu 9,151 14,320 7.2% (0.2%) 0.4x 0.4x 5.8x 5.3x 10.4x 9.7x
Computer Sciences 8,222 8,618 17.3% (11.4%) 0.8x 0.8x 4.9x 4.7x 13.9x 12.9x
NEC 7,459 9,798 7.6% (0.9%) 0.5x 0.4x 6.0x 6.0x 19.4x 12.7x
Atos Origin 7,076 6,942 11.2% 20.1% 0.6x 0.6x 5.8x 5.3x 12.3x 10.8x
Sopra 1,909 2,527 7.6% 56.6% 0.7x 0.7x 9.4x 8.0x 15.1x 12.9x
Indra Sistemas 1,662 2,415 5.4% 0.0% 0.8x 0.8x 15.3x 9.5x NM 17.3x
Tieto 1,644 1,660 13.9% (4.0%) 1.1x 1.1x 8.2x 7.6x 18.8x 14.4x
Bechtle 1,604 1,545 5.3% 10.8% 0.5x 0.5x 10.3x 9.6x 17.9x 16.5x
GFI Informatique 340 382 7.8% 7.8% 0.4x 0.4x 5.7x 5.6x 12.5x 12.0x
Mean 12.8% 7.5% 1.1x 1.0x 8.6x 7.7x 17.6x 15.1x
Median 11.8% 2.4% 0.8x 0.8x 8.2x 7.6x 17.0x 14.4x
Offshore IT Services
Tata 71,751 68,756 28.3% 27.4% 4.8x 4.3x 17.1x 15.3x 22.8x 20.2x
Cognizant 36,508 34,270 20.0% 21.8% 3.1x 2.7x 15.4x 13.4x 22.2x 19.4x
Infosys 35,354 31,417 26.7% 9.7% 4.0x 3.6x 14.9x 13.1x 21.0x 19.4x
Wipro 19,271 16,629 22.5% 6.6% 2.5x 2.2x 10.9x 10.3x 15.8x 15.6x
HCL 18,429 17,067 22.2% 15.8% 3.1x 2.7x 14.1x 12.0x NA 17.2x
Mean 24.0% 16.3% 3.5x 3.1x 14.5x 12.8x 20.4x 18.4x
Median 22.5% 15.8% 3.1x 2.7x 14.9x 13.1x 21.6x 19.4x
Managed Services, Colocation and Hosting
Level 3 15,586 24,941 31.7% 21.7% 3.4x 3.1x 10.6x 9.7x 29.5x 21.8x
United Internet 8,733 10,292 20.9% 22.4% 2.8x 2.6x 13.2x 11.8x 23.8x 19.5x
Rackspace 4,034 3,907 33.3% 10.9% 2.2x 2.0x 6.6x 5.8x 38.6x 31.6x
Endurance 1,880 2,807 36.2% 19.7% 4.2x 3.7x 11.6x 9.7x 12.5x 10.1x
Interxion 1,787 2,270 43.8% 12.2% 5.9x 5.3x 13.4x 11.9x NM 37.5x
GoDaddy 1,568 2,484 20.4% 15.5% 1.7x 1.5x 8.5x 7.0x 22.8x 19.0x
Windstream 585 10,255 31.6% (2.8%) 2.0x 2.0x 6.4x 7.1x NM NM
Internap 423 742 26.3% (1.1%) 2.5x 2.3x 9.5x 8.2x NM NM
iomart 385 407 43.4% 16.3% 3.9x 3.5x 9.1x NA 18.2x 15.9x
Redcentric 364 374 23.3% 25.4% 2.5x 2.3x 10.8x 9.7x 20.7x 17.6x
Melbourne IT 114 103 12.3% 20.2% 1.0x 0.9x 8.3x 5.5x 29.0x 13.0x
Proact 110 117 NA 15.8% 0.4x 0.4x NA NA 12.6x 10.7x
Mean 29.4% 14.7% 2.7x 2.5x 9.8x 8.6x 23.1x 19.7x
Median 31.6% 16.0% 2.5x 2.3x 9.5x 8.9x 22.8x 18.3x
Data Centres
Equinix 28,931 32,839 46.8% 10.6% 13.6x 12.3x 29.2x 25.9x NM 28.3x
Digital Realty Trust 8,121 13,483 57.7% 4.1% 8.9x 8.2x 15.5x 14.2x NM 47.8x
Telecity 3,135 3,568 46.5% 3.3% 7.1x 6.4x 15.2x 13.6x 28.3x 24.4x
DuPont Fabros 1,728 3,437 62.0% 6.3% 8.7x 8.2x 14.0x 12.9x 27.3x 23.4x
Coresite 1,190 1,841 50.0% 21.2% 6.3x 5.7x 12.6x 10.9x NM 41.1x
Mean 52.6% 9.1% 8.9x 8.1x 17.3x 15.5x 27.8x 33.0x
Median 50.0% 6.3% 8.7x 8.2x 15.2x 13.6x 27.8x 28.3x
PaaS/IaaS
EMC 44,974 46,013 26.1% 3.2% 2.0x 1.9x 7.8x 7.1x 14.0x 12.5x
Akamai 11,659 11,633 40.3% 13.3% 5.9x 5.1x 14.6x 12.6x 30.3x 25.7x
ServiceNow 10,549 10,314 14.4% 47.1% 11.6x 8.5x NM NM NM NM
Netapp 7,985 4,892 18.1% (7.8%) 0.9x 0.9x 5.2x 4.4x 13.9x 11.1x
Synchronoss 1,806 1,808 34.7% 27.1% 3.5x 3.0x 10.1x 8.4x 20.6x 17.7x
Commvault Systems 1,523 1,156 11.5% (5.7%) 2.2x 2.1x 19.4x 13.3x NM 36.5x
Progress Software 1,320 1,273 31.1% 27.1% 3.4x 3.2x 10.9x 10.4x 20.3x 18.7x
Carbonite 283 225 18.7% 12.6% 1.8x 1.7x 9.8x 8.1x NM NM
Mean 24.4% 14.6% 3.9x 3.3x 11.1x 9.2x 19.8x 20.3x
Median 22.4% 12.9% 2.8x 2.5x 10.1x 8.4x 20.3x 18.2x
EV / Revenue P / EEV / EBITDA
IT SERVICES
9
EUROPEAN TECHNOLOGY
INDUSTRY UPDATE │ AUGUST 2015
(1) Equinix has entered into an agreement to acquire Telecity
(1)
(1)
PAGE |
(50%)
(40%)
(30%)
(20%)
(10%)
0%
10%
20%
30%
Aug 2014 Nov 2014 Feb 2015 May 2015 Aug 2015
Digital Broadband Diversified Communication Equipment Mobile Content / Solutions Providers Mobile Infrastructure Software
COMMUNICATIONS
10
EUROPEAN TECHNOLOGY
INDUSTRY UPDATE │ AUGUST 2015
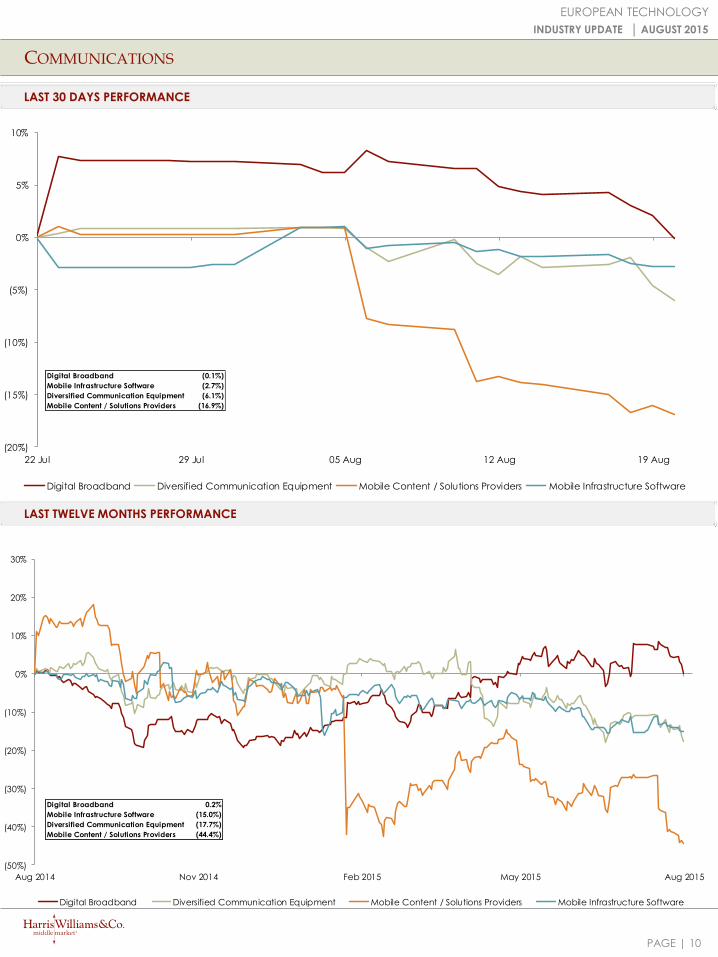
LAST 30 DAYS PERFORMANCE
LAST TWELVE MONTHS PERFORMANCE
Digital Broadband 0.2%
Mobile Infrastructure Software (15.0%)
Diversified Communication Equipment (17.7%)
Mobile Content / Solutions Providers (44.4%)
(20%)
(15%)
(10%)
(5%)
0%
5%
10%
22 Jul 29 Jul 05 Aug 12 Aug 19 Aug
Digital Broadband Diversified Communication Equipment Mobile Content / Solutions Providers Mobile Infrastructure Software
Digital Broadband (0.1%)
Mobile Infrastructure Software (2.7%)
Diversified Communication Equipment (6.1%)
Mobile Content / Solutions Providers (16.9%)
PAGE |
Market Enterprise CY2015E
Cap ($m) Value ($m) EBITDA Margin Rev. Growth CY2015E CY2016E CY2015E CY2016E CY2015E CY2016E
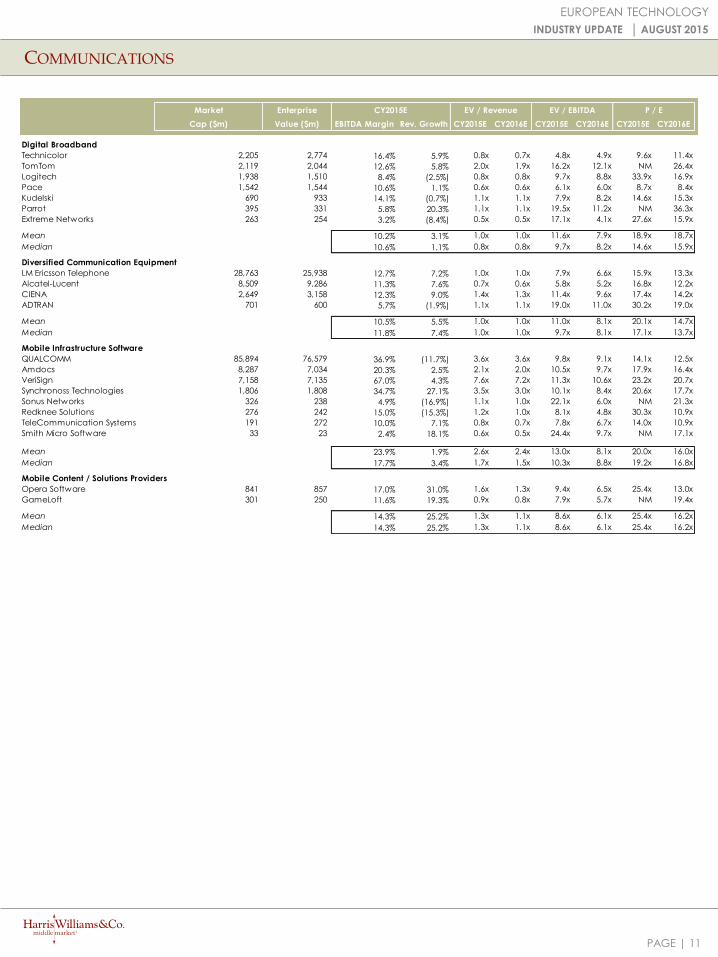
Digital Broadband
Technicolor 2,205 2,774 16.4% 5.9% 0.8x 0.7x 4.8x 4.9x 9.6x 11.4x
TomTom 2,119 2,044 12.6% 5.8% 2.0x 1.9x 16.2x 12.1x NM 26.4x
Logitech 1,938 1,510 8.4% (2.5%) 0.8x 0.8x 9.7x 8.8x 33.9x 16.9x
Pace 1,542 1,544 10.6% 1.1% 0.6x 0.6x 6.1x 6.0x 8.7x 8.4x
Kudelski 690 933 14.1% (0.7%) 1.1x 1.1x 7.9x 8.2x 14.6x 15.3x
Parrot 395 331 5.8% 20.3% 1.1x 1.1x 19.5x 11.2x NM 36.3x
Extreme Networks 263 254 3.2% (8.4%) 0.5x 0.5x 17.1x 4.1x 27.6x 15.9x
Mean 10.2% 3.1% 1.0x 1.0x 11.6x 7.9x 18.9x 18.7x
Median 10.6% 1.1% 0.8x 0.8x 9.7x 8.2x 14.6x 15.9x
Diversified Communication Equipment
LM Ericsson Telephone 28,763 25,938 12.7% 7.2% 1.0x 1.0x 7.9x 6.6x 15.9x 13.3x
Alcatel-Lucent 8,509 9,286 11.3% 7.6% 0.7x 0.6x 5.8x 5.2x 16.8x 12.2x
CIENA 2,649 3,158 12.3% 9.0% 1.4x 1.3x 11.4x 9.6x 17.4x 14.2x
ADTRAN 701 600 5.7% (1.9%) 1.1x 1.1x 19.0x 11.0x 30.2x 19.0x
Mean 10.5% 5.5% 1.0x 1.0x 11.0x 8.1x 20.1x 14.7x
Median 11.8% 7.4% 1.0x 1.0x 9.7x 8.1x 17.1x 13.7x
Mobile Infrastructure Software
QUALCOMM 85,894 76,579 36.9% (11.7%) 3.6x 3.6x 9.8x 9.1x 14.1x 12.5x
Amdocs 8,287 7,034 20.3% 2.5% 2.1x 2.0x 10.5x 9.7x 17.9x 16.4x
VeriSign 7,158 7,135 67.0% 4.3% 7.6x 7.2x 11.3x 10.6x 23.2x 20.7x
Synchronoss Technologies 1,806 1,808 34.7% 27.1% 3.5x 3.0x 10.1x 8.4x 20.6x 17.7x
Sonus Networks 326 238 4.9% (16.9%) 1.1x 1.0x 22.1x 6.0x NM 21.3x
Redknee Solutions 276 242 15.0% (15.3%) 1.2x 1.0x 8.1x 4.8x 30.3x 10.9x
TeleCommunication Systems 191 272 10.0% 7.1% 0.8x 0.7x 7.8x 6.7x 14.0x 10.9x
Smith Micro Software 33 23 2.4% 18.1% 0.6x 0.5x 24.4x 9.7x NM 17.1x
Mean 23.9% 1.9% 2.6x 2.4x 13.0x 8.1x 20.0x 16.0x
Median 17.7% 3.4% 1.7x 1.5x 10.3x 8.8x 19.2x 16.8x
Mobile Content / Solutions Providers
Opera Software 841 857 17.0% 31.0% 1.6x 1.3x 9.4x 6.5x 25.4x 13.0x
GameLoft 301 250 11.6% 19.3% 0.9x 0.8x 7.9x 5.7x NM 19.4x
Mean 14.3% 25.2% 1.3x 1.1x 8.6x 6.1x 25.4x 16.2x
Median 14.3% 25.2% 1.3x 1.1x 8.6x 6.1x 25.4x 16.2x
EV / EBITDA P / EEV / Revenue
COMMUNICATIONS
11
EUROPEAN TECHNOLOGY
INDUSTRY UPDATE │ AUGUST 2015
PAGE |
(40%)
(20%)
0%
20%
40%
60%
Aug 2014 Nov 2014 Feb 2015 May 2015 Aug 2015
Chinese Internet Leaders Content Providers / Communities Digital Marketing eCommerce
Global Internet Leaders Interactive Entertainment Intermediation and Comparison Online Classifieds
Online Travel Online Gambling Internet Services Educational Technology
INTERNET AND DIGITAL MEDIA
12
EUROPEAN TECHNOLOGY
INDUSTRY UPDATE │ AUGUST 2015
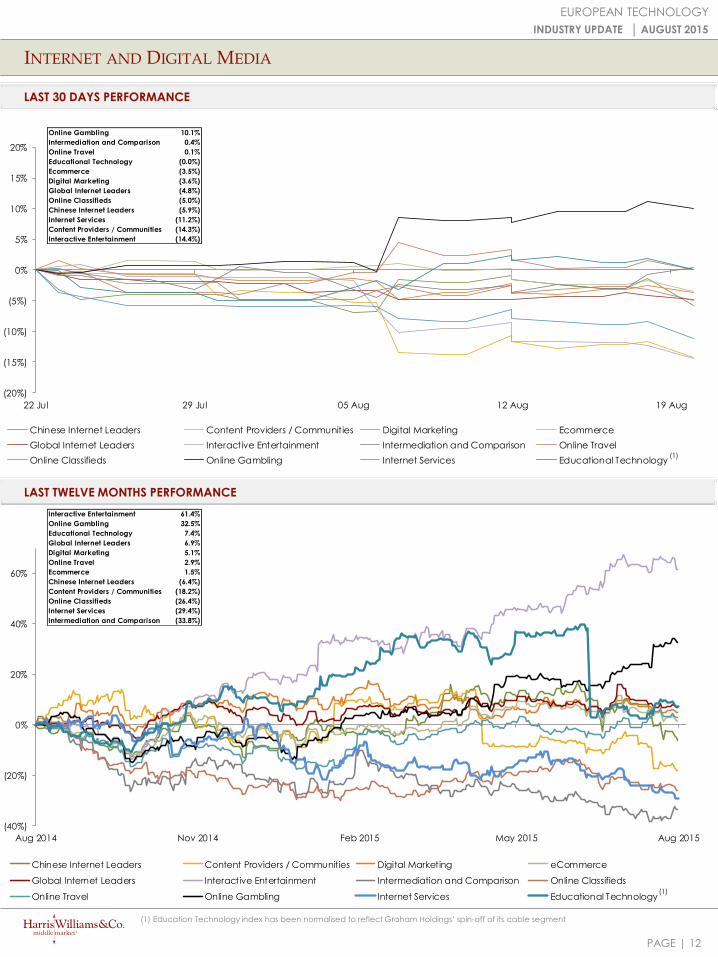
LAST 30 DAYS PERFORMANCE
LAST TWELVE MONTHS PERFORMANCE
(20%)
(15%)
(10%)
(5%)
0%
5%
10%
15%
20%
22 Jul 29 Jul 05 Aug 12 Aug 19 Aug
Chinese Internet Leaders Content Providers / Communities Digital Marketing Ecommerce
Global Internet Leaders Interactive Entertainment Intermediation and Comparison Online Travel
Online Classifieds Online Gambling Internet Services Educational Technology
Online Gambling 10.1%
Intermediation and Comparison 0.4%
Online Travel 0.1%
Educational Technology (0.0%)
Ecommerce (3.5%)
Digital Marketing (3.6%)
Global Internet Leaders (4.8%)
Online Classifieds (5.0%)
Chinese Internet Leaders (5.9%)
Internet Services (11.2%)
Content Providers / Communities (14.3%)
Interactive Entertainment (14.4%)
Interactive Entertainment 61.4%
Online Gambling 32.5%
Educational Technology 7.4%
Global Internet Leaders 6.9%
Digital Marketing 5.1%
Online Travel 2.9%
Ecommerce 1.5%
Chinese Internet Leaders (6.4%)
Content Providers / Communities (18.2%)
Online Classifieds (26.4%)
Internet Services (29.4%)
Intermediation and Comparison (33.8%)
(1)
(1)
(1) Education Technology index has been normalised to reflect Graham Holdings’ spin-off of its cable segment
PAGE |
Market Enterprise CY2015E
Cap ($m) Value ($m) EBITDA Margin Rev. Growth CY2015E CY2016E CY2015E CY2016E CY2015E CY2016E
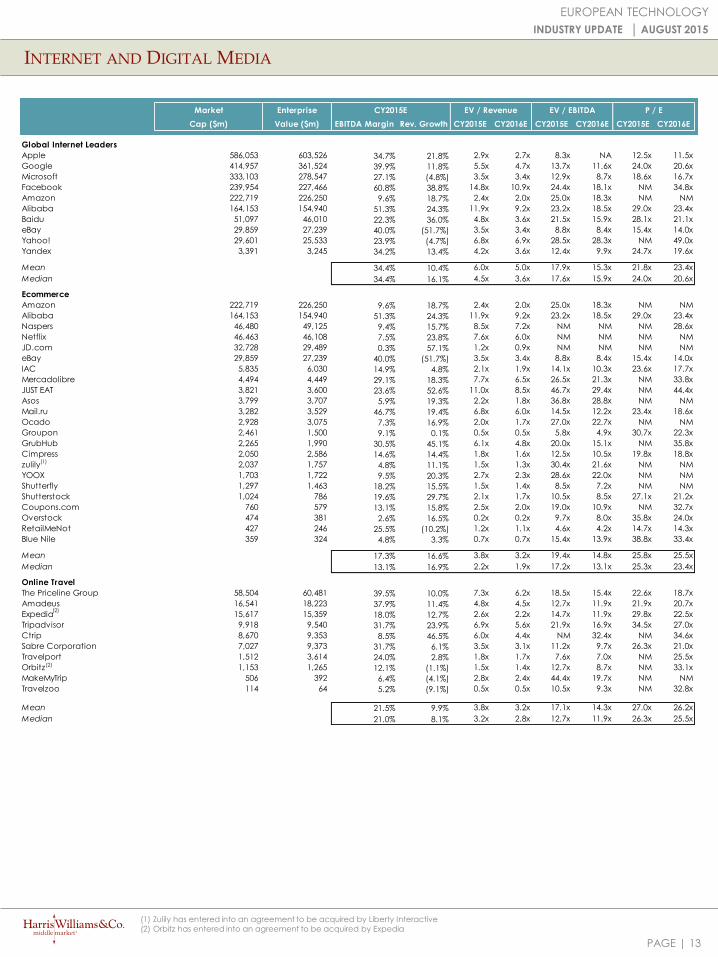
Global Internet Leaders
Apple 586,053 603,526 34.7% 21.8% 2.9x 2.7x 8.3x NA 12.5x 11.5x
Google 414,957 361,524 39.9% 11.8% 5.5x 4.7x 13.7x 11.6x 24.0x 20.6x
Microsoft 333,103 278,547 27.1% (4.8%) 3.5x 3.4x 12.9x 8.7x 18.6x 16.7x
Facebook 239,954 227,466 60.8% 38.8% 14.8x 10.9x 24.4x 18.1x NM 34.8x
Amazon 222,719 226,250 9.6% 18.7% 2.4x 2.0x 25.0x 18.3x NM NM
Alibaba 164,153 154,940 51.3% 24.3% 11.9x 9.2x 23.2x 18.5x 29.0x 23.4x
Baidu 51,097 46,010 22.3% 36.0% 4.8x 3.6x 21.5x 15.9x 28.1x 21.1x
eBay 29,859 27,239 40.0% (51.7%) 3.5x 3.4x 8.8x 8.4x 15.4x 14.0x
Yahoo! 29,601 25,533 23.9% (4.7%) 6.8x 6.9x 28.5x 28.3x NM 49.0x
Yandex 3,391 3,245 34.2% 13.4% 4.2x 3.6x 12.4x 9.9x 24.7x 19.6x
Mean 34.4% 10.4% 6.0x 5.0x 17.9x 15.3x 21.8x 23.4x
Median 34.4% 16.1% 4.5x 3.6x 17.6x 15.9x 24.0x 20.6x
Ecommerce
Amazon 222,719 226,250 9.6% 18.7% 2.4x 2.0x 25.0x 18.3x NM NM
Alibaba 164,153 154,940 51.3% 24.3% 11.9x 9.2x 23.2x 18.5x 29.0x 23.4x
Naspers 46,480 49,125 9.4% 15.7% 8.5x 7.2x NM NM NM 28.6x
Netflix 46,463 46,108 7.5% 23.8% 7.6x 6.0x NM NM NM NM
JD.com 32,728 29,489 0.3% 57.1% 1.2x 0.9x NM NM NM NM
eBay 29,859 27,239 40.0% (51.7%) 3.5x 3.4x 8.8x 8.4x 15.4x 14.0x
IAC 5,835 6,030 14.9% 4.8% 2.1x 1.9x 14.1x 10.3x 23.6x 17.7x
Mercadolibre 4,494 4,449 29.1% 18.3% 7.7x 6.5x 26.5x 21.3x NM 33.8x
JUST EAT 3,821 3,600 23.6% 52.6% 11.0x 8.5x 46.7x 29.4x NM 44.4x
Asos 3,799 3,707 5.9% 19.3% 2.2x 1.8x 36.8x 28.8x NM NM
Mail.ru 3,282 3,529 46.7% 19.4% 6.8x 6.0x 14.5x 12.2x 23.4x 18.6x
Ocado 2,928 3,075 7.3% 16.9% 2.0x 1.7x 27.0x 22.7x NM NM
Groupon 2,461 1,500 9.1% 0.1% 0.5x 0.5x 5.8x 4.9x 30.7x 22.3x
GrubHub 2,265 1,990 30.5% 45.1% 6.1x 4.8x 20.0x 15.1x NM 35.8x
Cimpress 2,050 2,586 14.6% 14.4% 1.8x 1.6x 12.5x 10.5x 19.8x 18.8x
zulily 2,037 1,757 4.8% 11.1% 1.5x 1.3x 30.4x 21.6x NM NM
YOOX 1,703 1,722 9.5% 20.3% 2.7x 2.3x 28.6x 22.0x NM NM
Shutterfly 1,297 1,463 18.2% 15.5% 1.5x 1.4x 8.5x 7.2x NM NM
Shutterstock 1,024 786 19.6% 29.7% 2.1x 1.7x 10.5x 8.5x 27.1x 21.2x
Coupons.com 760 579 13.1% 15.8% 2.5x 2.0x 19.0x 10.9x NM 32.7x
Overstock 474 381 2.6% 16.5% 0.2x 0.2x 9.7x 8.0x 35.8x 24.0x
RetailMeNot 427 246 25.5% (10.2%) 1.2x 1.1x 4.6x 4.2x 14.7x 14.3x
Blue Nile 359 324 4.8% 3.3% 0.7x 0.7x 15.4x 13.9x 38.8x 33.4x
Mean 17.3% 16.6% 3.8x 3.2x 19.4x 14.8x 25.8x 25.5x
Median 13.1% 16.9% 2.2x 1.9x 17.2x 13.1x 25.3x 23.4x
Online Travel
The Priceline Group 58,504 60,481 39.5% 10.0% 7.3x 6.2x 18.5x 15.4x 22.6x 18.7x
Amadeus 16,541 18,223 37.9% 11.4% 4.8x 4.5x 12.7x 11.9x 21.9x 20.7x
Expedia 15,617 15,359 18.0% 12.7% 2.6x 2.2x 14.7x 11.9x 29.8x 22.5x
Tripadvisor 9,918 9,540 31.7% 23.9% 6.9x 5.6x 21.9x 16.9x 34.5x 27.0x
Ctrip 8,670 9,353 8.5% 46.5% 6.0x 4.4x NM 32.4x NM 34.6x
Sabre Corporation 7,027 9,373 31.7% 6.1% 3.5x 3.1x 11.2x 9.7x 26.3x 21.0x
Travelport 1,512 3,614 24.0% 2.8% 1.8x 1.7x 7.6x 7.0x NM 25.5x
Orbitz 1,153 1,265 12.1% (1.1%) 1.5x 1.4x 12.7x 8.7x NM 33.1x
MakeMyTrip 506 392 6.4% (4.1%) 2.8x 2.4x 44.4x 19.7x NM NM
Travelzoo 114 64 5.2% (9.1%) 0.5x 0.5x 10.5x 9.3x NM 32.8x
Mean 21.5% 9.9% 3.8x 3.2x 17.1x 14.3x 27.0x 26.2x
Median 21.0% 8.1% 3.2x 2.8x 12.7x 11.9x 26.3x 25.5x
P / EEV / EBITDAEV / Revenue
INTERNET AND DIGITAL MEDIA
13
EUROPEAN TECHNOLOGY
INDUSTRY UPDATE │ AUGUST 2015
(1) Zulily has entered into an agreement to be acquired by Liberty Interactive
(2) Orbitz has entered into an agreement to be acquired by Expedia
(2)
(2)
(1)
PAGE |
INTERNET AND DIGITAL MEDIA
14
EUROPEAN TECHNOLOGY
INDUSTRY UPDATE │ AUGUST 2015
Market Enterprise CY2015E
Cap ($m) Value ($m) EBITDA Margin Rev. Growth CY2015E CY2016E CY2015E CY2016E CY2015E CY2016E
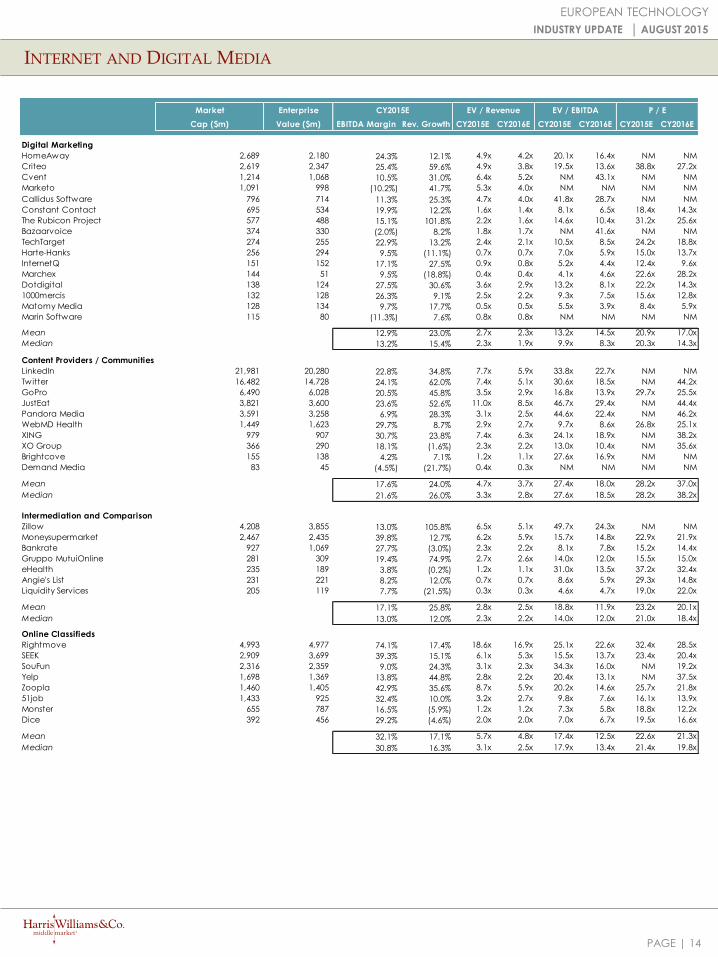
Digital Marketing
HomeAway 2,689 2,180 24.3% 12.1% 4.9x 4.2x 20.1x 16.4x NM NM
Criteo 2,619 2,347 25.4% 59.6% 4.9x 3.8x 19.5x 13.6x 38.8x 27.2x
Cvent 1,214 1,068 10.5% 31.0% 6.4x 5.2x NM 43.1x NM NM
Marketo 1,091 998 (10.2%) 41.7% 5.3x 4.0x NM NM NM NM
Callidus Software 796 714 11.3% 25.3% 4.7x 4.0x 41.8x 28.7x NM NM
Constant Contact 695 534 19.9% 12.2% 1.6x 1.4x 8.1x 6.5x 18.4x 14.3x
The Rubicon Project 577 488 15.1% 101.8% 2.2x 1.6x 14.6x 10.4x 31.2x 25.6x
Bazaarvoice 374 330 (2.0%) 8.2% 1.8x 1.7x NM 41.6x NM NM
TechTarget 274 255 22.9% 13.2% 2.4x 2.1x 10.5x 8.5x 24.2x 18.8x
Harte-Hanks 256 294 9.5% (11.1%) 0.7x 0.7x 7.0x 5.9x 15.0x 13.7x
InternetQ 151 152 17.1% 27.5% 0.9x 0.8x 5.2x 4.4x 12.4x 9.6x
Marchex 144 51 9.5% (18.8%) 0.4x 0.4x 4.1x 4.6x 22.6x 28.2x
Dotdigital 138 124 27.5% 30.6% 3.6x 2.9x 13.2x 8.1x 22.2x 14.3x
1000mercis 132 128 26.3% 9.1% 2.5x 2.2x 9.3x 7.5x 15.6x 12.8x
Matomy Media 128 134 9.7% 17.7% 0.5x 0.5x 5.5x 3.9x 8.4x 5.9x
Marin Software 115 80 (11.3%) 7.6% 0.8x 0.8x NM NM NM NM
Mean 12.9% 23.0% 2.7x 2.3x 13.2x 14.5x 20.9x 17.0x
Median 13.2% 15.4% 2.3x 1.9x 9.9x 8.3x 20.3x 14.3x
Content Providers / Communities
LinkedIn 21,981 20,280 22.8% 34.8% 7.7x 5.9x 33.8x 22.7x NM NM
Twitter 16,482 14,728 24.1% 62.0% 7.4x 5.1x 30.6x 18.5x NM 44.2x
GoPro 6,490 6,028 20.5% 45.8% 3.5x 2.9x 16.8x 13.9x 29.7x 25.5x
JustEat 3,821 3,600 23.6% 52.6% 11.0x 8.5x 46.7x 29.4x NM 44.4x
Pandora Media 3,591 3,258 6.9% 28.3% 3.1x 2.5x 44.6x 22.4x NM 46.2x
WebMD Health 1,449 1,623 29.7% 8.7% 2.9x 2.7x 9.7x 8.6x 26.8x 25.1x
XING 979 907 30.7% 23.8% 7.4x 6.3x 24.1x 18.9x NM 38.2x
XO Group 366 290 18.1% (1.6%) 2.3x 2.2x 13.0x 10.4x NM 35.6x
Brightcove 155 138 4.2% 7.1% 1.2x 1.1x 27.6x 16.9x NM NM
Demand Media 83 45 (4.5%) (21.7%) 0.4x 0.3x NM NM NM NM
Mean 17.6% 24.0% 4.7x 3.7x 27.4x 18.0x 28.2x 37.0x
Median 21.6% 26.0% 3.3x 2.8x 27.6x 18.5x 28.2x 38.2x
Intermediation and Comparison
Zillow 4,208 3,855 13.0% 105.8% 6.5x 5.1x 49.7x 24.3x NM NM
Moneysupermarket 2,467 2,435 39.8% 12.7% 6.2x 5.9x 15.7x 14.8x 22.9x 21.9x
Bankrate 927 1,069 27.7% (3.0%) 2.3x 2.2x 8.1x 7.8x 15.2x 14.4x
Gruppo MutuiOnline 281 309 19.4% 74.9% 2.7x 2.6x 14.0x 12.0x 15.5x 15.0x
eHealth 235 189 3.8% (0.2%) 1.2x 1.1x 31.0x 13.5x 37.2x 32.4x
Angie's List 231 221 8.2% 12.0% 0.7x 0.7x 8.6x 5.9x 29.3x 14.8x
Liquidity Services 205 119 7.7% (21.5%) 0.3x 0.3x 4.6x 4.7x 19.0x 22.0x
Mean 17.1% 25.8% 2.8x 2.5x 18.8x 11.9x 23.2x 20.1x
Median 13.0% 12.0% 2.3x 2.2x 14.0x 12.0x 21.0x 18.4x
Online Classifieds
Rightmove 4,993 4,977 74.1% 17.4% 18.6x 16.9x 25.1x 22.6x 32.4x 28.5x
SEEK 2,909 3,699 39.3% 15.1% 6.1x 5.3x 15.5x 13.7x 23.4x 20.4x
SouFun 2,316 2,359 9.0% 24.3% 3.1x 2.3x 34.3x 16.0x NM 19.2x
Yelp 1,698 1,369 13.8% 44.8% 2.8x 2.2x 20.4x 13.1x NM 37.5x
Zoopla 1,460 1,405 42.9% 35.6% 8.7x 5.9x 20.2x 14.6x 25.7x 21.8x
51job 1,433 925 32.4% 10.0% 3.2x 2.7x 9.8x 7.6x 16.1x 13.9x
Monster 655 787 16.5% (5.9%) 1.2x 1.2x 7.3x 5.8x 18.8x 12.2x
Dice 392 456 29.2% (4.6%) 2.0x 2.0x 7.0x 6.7x 19.5x 16.6x
Mean 32.1% 17.1% 5.7x 4.8x 17.4x 12.5x 22.6x 21.3x
Median 30.8% 16.3% 3.1x 2.5x 17.9x 13.4x 21.4x 19.8x
P / EEV / Revenue EV / EBITDA
PAGE |
Market Enterprise CY2015E
Cap ($m) Value ($m) EBITDA Margin Rev. Growth CY2015E CY2016E CY2015E CY2016E CY2015E CY2016E
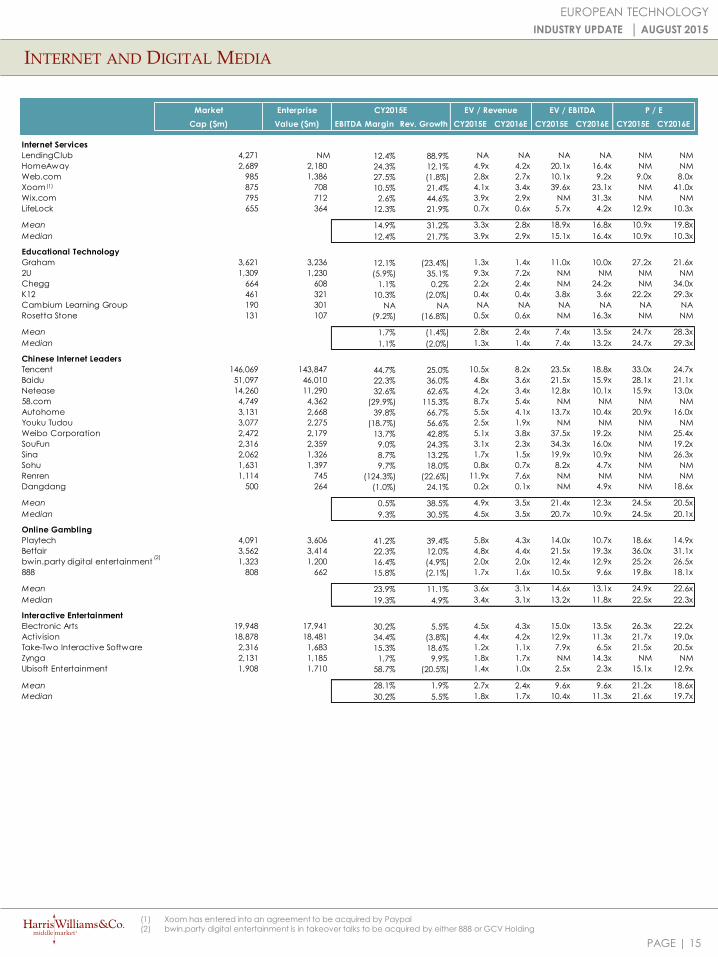
Internet Services
LendingClub 4,271 NM 12.4% 88.9% NA NA NA NA NM NM
HomeAway 2,689 2,180 24.3% 12.1% 4.9x 4.2x 20.1x 16.4x NM NM
Web.com 985 1,386 27.5% (1.8%) 2.8x 2.7x 10.1x 9.2x 9.0x 8.0x
Xoom 875 708 10.5% 21.4% 4.1x 3.4x 39.6x 23.1x NM 41.0x
Wix.com 795 712 2.6% 44.6% 3.9x 2.9x NM 31.3x NM NM
LifeLock 655 364 12.3% 21.9% 0.7x 0.6x 5.7x 4.2x 12.9x 10.3x
Mean 14.9% 31.2% 3.3x 2.8x 18.9x 16.8x 10.9x 19.8x
Median 12.4% 21.7% 3.9x 2.9x 15.1x 16.4x 10.9x 10.3x
Educational Technology
Graham 3,621 3,236 12.1% (23.4%) 1.3x 1.4x 11.0x 10.0x 27.2x 21.6x
2U 1,309 1,230 (5.9%) 35.1% 9.3x 7.2x NM NM NM NM
Chegg 664 608 1.1% 0.2% 2.2x 2.4x NM 24.2x NM 34.0x
K12 461 321 10.3% (2.0%) 0.4x 0.4x 3.8x 3.6x 22.2x 29.3x
Cambium Learning Group 190 301 NA NA NA NA NA NA NA NA
Rosetta Stone 131 107 (9.2%) (16.8%) 0.5x 0.6x NM 16.3x NM NM
Mean 1.7% (1.4%) 2.8x 2.4x 7.4x 13.5x 24.7x 28.3x
Median 1.1% (2.0%) 1.3x 1.4x 7.4x 13.2x 24.7x 29.3x
Chinese Internet Leaders
Tencent 146,069 143,847 44.7% 25.0% 10.5x 8.2x 23.5x 18.8x 33.0x 24.7x
Baidu 51,097 46,010 22.3% 36.0% 4.8x 3.6x 21.5x 15.9x 28.1x 21.1x
Netease 14,260 11,290 32.6% 62.6% 4.2x 3.4x 12.8x 10.1x 15.9x 13.0x
58.com 4,749 4,362 (29.9%) 115.3% 8.7x 5.4x NM NM NM NM
Autohome 3,131 2,668 39.8% 66.7% 5.5x 4.1x 13.7x 10.4x 20.9x 16.0x
Youku Tudou 3,077 2,275 (18.7%) 56.6% 2.5x 1.9x NM NM NM NM
Weibo Corporation 2,472 2,179 13.7% 42.8% 5.1x 3.8x 37.5x 19.2x NM 25.4x
SouFun 2,316 2,359 9.0% 24.3% 3.1x 2.3x 34.3x 16.0x NM 19.2x
Sina 2,062 1,326 8.7% 13.2% 1.7x 1.5x 19.9x 10.9x NM 26.3x
Sohu 1,631 1,397 9.7% 18.0% 0.8x 0.7x 8.2x 4.7x NM NM
Renren 1,114 745 (124.3%) (22.6%) 11.9x 7.6x NM NM NM NM
Dangdang 500 264 (1.0%) 24.1% 0.2x 0.1x NM 4.9x NM 18.6x
Mean 0.5% 38.5% 4.9x 3.5x 21.4x 12.3x 24.5x 20.5x
Median 9.3% 30.5% 4.5x 3.5x 20.7x 10.9x 24.5x 20.1x
Online Gambling
Playtech 4,091 3,606 41.2% 39.4% 5.8x 4.3x 14.0x 10.7x 18.6x 14.9x
Betfair 3,562 3,414 22.3% 12.0% 4.8x 4.4x 21.5x 19.3x 36.0x 31.1x
bwin.party digital entertainment 1,323 1,200 16.4% (4.9%) 2.0x 2.0x 12.4x 12.9x 25.2x 26.5x
888 808 662 15.8% (2.1%) 1.7x 1.6x 10.5x 9.6x 19.8x 18.1x
Mean 23.9% 11.1% 3.6x 3.1x 14.6x 13.1x 24.9x 22.6x
Median 19.3% 4.9% 3.4x 3.1x 13.2x 11.8x 22.5x 22.3x
Interactive Entertainment
Electronic Arts 19,948 17,941 30.2% 5.5% 4.5x 4.3x 15.0x 13.5x 26.3x 22.2x
Activision 18,878 18,481 34.4% (3.8%) 4.4x 4.2x 12.9x 11.3x 21.7x 19.0x
Take-Two Interactive Software 2,316 1,683 15.3% 18.6% 1.2x 1.1x 7.9x 6.5x 21.5x 20.5x
Zynga 2,131 1,185 1.7% 9.9% 1.8x 1.7x NM 14.3x NM NM
Ubisoft Entertainment 1,908 1,710 58.7% (20.5%) 1.4x 1.0x 2.5x 2.3x 15.1x 12.9x
Mean 28.1% 1.9% 2.7x 2.4x 9.6x 9.6x 21.2x 18.6x
Median 30.2% 5.5% 1.8x 1.7x 10.4x 11.3x 21.6x 19.7x
P / EEV / Revenue EV / EBITDA
INTERNET AND DIGITAL MEDIA
15
EUROPEAN TECHNOLOGY
INDUSTRY UPDATE │ AUGUST 2015
(1)
(1) Xoom has entered into an agreement to be acquired by Paypal
(2) bwin.party digital entertainment is in takeover talks to be acquired by either 888 or GCV Holding
(2)

Energy, Power& Infrastructure
IndustrialsHealthcare & Life Sciences
Transportation & Logistics
Aerospace, Defense & Government
Services
Business Services
Building Products & Materials
Technology, Media & Telecom
Specialty Distribution
Consumer
PAGE |
HARRIS WILLIAMS & CO. OFFICE LOCATIONS
UNITED STATES EUROPE
BostonTwo International Place24th FloorBoston, Massachusetts 02110Phone: +1 (617) 482-7501Fax: +1 (617) 482-7503
Cleveland1900 East 9th Street20th FloorCleveland, Ohio 44114Phone: +1 (216) 689-2400Fax: +1 (216) 689-2401
Minneapolis222 South 9th StreetSuite 3350Minneapolis, Minnesota 55402Phone: +1 (612) 359-2700Fax: +1 (612) 359-2701
Richmond (Headquarters)1001 Haxall Point9th FloorRichmond, Virginia 23219Phone: +1 (804) 648-0072Fax: +1 (804) 648-0073
San Francisco575 Market Street31st FloorSan Francisco, California 94105, USAPhone: +1 (415) 288-4260Fax: +1 (415) 288-4269
FrankfurtBockenheimer Landstrasse 33-3560325 FrankfurtGermanyPhone: +49 069 3650638 00Fax: +49 069 3650638 01
London63 Brook StreetLondon W1K 4HS, EnglandPhone: +44 (0) 20 7518 8900Fax: +44 (0) 20 7526 2187
NETWORK OFFICES
Beijing
Hong Kong
Mumbai
New Delhi
Shanghai
Technology, Media & Telecom
16
EUROPEAN TECHNOLOGY
INDUSTRY UPDATE │ AUGUST 2015
Harris Williams & Co. has a broad range of industry expertise, which creates powerful opportunities.Our clients benefit from our deep-sector experience, integrated industry intelligence andcollaboration across the firm, and our commitment to learning what makes them unique. For moreinformation, visit our website at www.harriswilliams.com/industries
OUR FIRM

PAGE |
HARRIS WILLIAMS & CO.
Capital IQ as of 20th August 2015, broker reports and various industry news outlets
17
SOURCES
EUROPEAN TECHNOLOGY
INDUSTRY UPDATE │ AUGUST 2015
Harris Williams & Co. (www.harriswilliams.com and www.harriswilliams.de) is a preeminent middle market investment bank focused on the advisory needs of clients worldwide. The firm has deep industry knowledge, global transaction expertise, and an unwavering commitment to excellence. Harris Williams & Co. provides sell-side and acquisition advisory, restructuring advisory, board advisory, private placements, and capital markets advisory services.
Harris Williams & Co. Ltd is a private limited company incorporated under English law having its registered office at 5th Floor, 6 St. Andrew Street, London EC4A 3AE, UK, registered with the Registrar of Companies for England and Wales under company number 7078852. Directors: Mr. Christopher Williams, Mr. Ned Valentine, Mr. Paul Poggi and Mr. Thierry Monjauze, authorised and regulated by the Financial Conduct Authority.
Harris Williams & Co. Ltd Niederlassung Frankfurt (German branch) is registered in the Commercial Register (Handelsregister) of the Local Court (Amtsgericht) of Frankfurt am Main, Germany, under registration number HRB 96687, having its business address at Bockenheimer Landstrasse 33-35, 60325 Frankfurt am Main, Germany. Permanent Representative (Ständiger Vertreter) of the Branch Niederlassung: Mr. Jeffery H. Perkins.
THIS REPORT MAY CONTAIN REFERENCES TO REGISTERED TRADEMARKS, SERVICE MARKS AND COPYRIGHTS OWNED BY THIRD-PARTY INFORMATION PROVIDERS. NONE OF THE THIRD PARTY INFORMATION PROVIDERS IS ENDORSING THE OFFERING OF, AND SHALL NOT IN ANY WAY BE DEEMED AN ISSUER OR UNDERWRITER OF, THE SECURITIES, FINANCIAL INSTRUMENTS OR OTHER INVESTMENTS DISCUSSED IN THIS REPORT AND SHALL NOT HAVE ANY LIABILITY OR RESPONSIBILITY FOR ANY STATEMENTS MADE IN THE REPORT OR FOR ANY FINANCIAL STATEMENTS, FINANCIAL PROJECTIONS OR OTHER FINANCIAL INFORMATION CONTAINED OR ATTACHED AS AN EXHIBIT TO THE REPORT. FOR MORE INFORMATION ABOUT THE MATERIALS PROVIDED BY SUCH THIRD PARTIES, PLEASE CONTACT US AT +44 (0) 20 7518 8900.
The information and views contained in this report were prepared by Harris Williams & Co. Ltd (“Harris Williams”). It is not a research report, as such term is defined by applicable law and regulations, and is provided for informational purposes only. It is not to be construed as an offer to buy or sell or a solicitation of an offer to buy or sell any financial instruments or to participate in any particular trading strategy. The information contained herein is believed by Harris Williams to be reliable but Harris Williams makes no representation as to the accuracy or completeness of such information.
Harris Williams and/or its affiliates may be market makers or specialists in, act as advisers or lenders to, have positions in and effect transactions in securities of companies mentioned herein and also may provide, may have provided, or may seek to provide investment banking services for those companies. In addition, Harris Williams and/or its affiliates or their respective officers, directors and employees may hold long or short positions in the securities, options thereon or other related financial products of companies discussed herein. Opinions, estimates and projections in this report constitute Harris Williams’ judgment and are subject to change without notice. The financial instruments discussed in this report may not be suitable for all investors and investors must make their own investment decisions using their own independent advisors as they believe necessary and based upon their specific financial situations and investment objectives. Also, past performance is not necessarily indicative of future results. No part of this material may be copied or duplicated in any form or by any means, or redistributed, without Harris Williams’ prior written consent.
Copyright© 2015 Harris Williams & Co., all rights reserved.
DISCLOSURES
Recommended