Howard McDonaldChief Executive Officer
October 2004

Portfolio of Leading Apparel Brands

Portfolio Performance
Sales $620mPeter Alexander
2%
Jacqui E12%
Portmans17%
Urban Brands3%
Just Jeans39%
Jay Jays27%
Casual
Womens
686 Stores
NSW / ACT213
VIC / TAS152
QLD / NT118
SA 44
WA 56
NZ 103

Brand Map –Affordable Fast Fashion
Fashion +
Fashion -
Price - Price +
Surf Shops
DepartmentStores
DiscountDepartment
StoresDiscountSpecialtyChains

0
50
100
150
200
1997 1998 1999 2000 2001 2002 2003 2004F 2005F
Sale
s ($
m)
0255075100125150175200
Store No.'s
Stores Sales
Driving Jay Jays Growth
35 year old CustomerDiscountDenim
Targeting of Youth MarketSplit DemographicsWeekday versus WeekendGood Fun, Great Value
18 year old CustomerNew Brand Qualities– Irreverent / CoolProgressive Store Fit-out
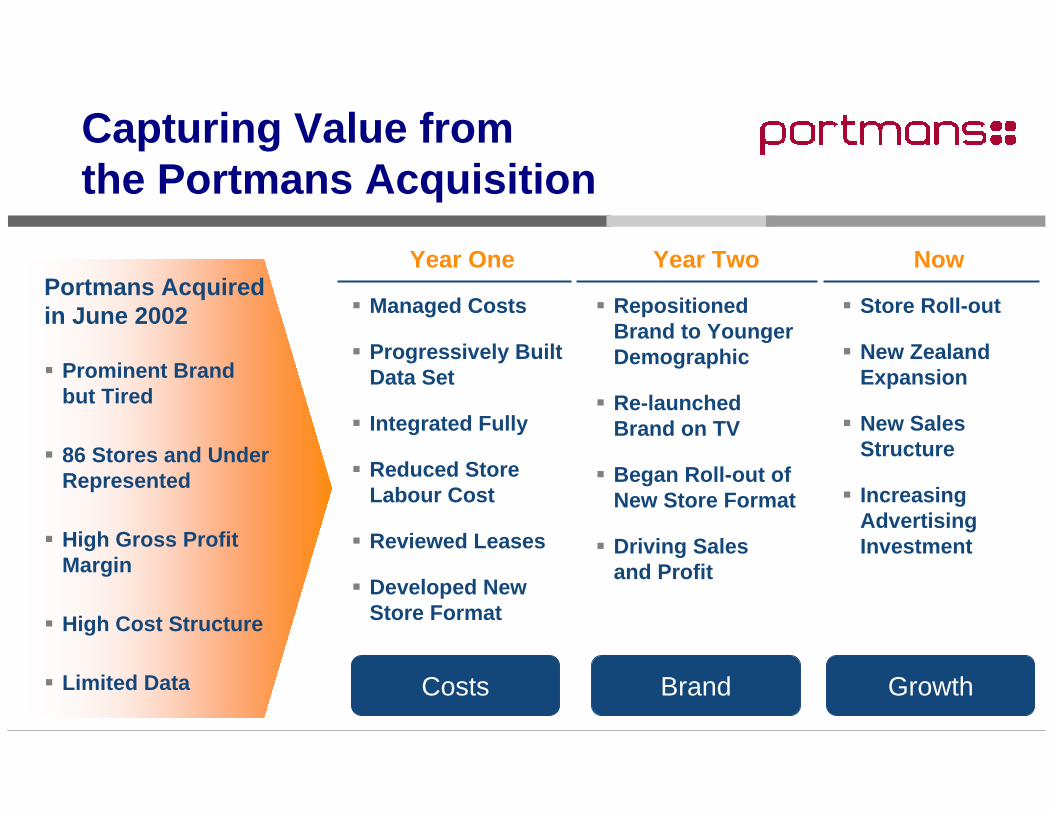
Capturing Value from the Portmans Acquisition
Prominent Brand but Tired
86 Stores and Under Represented
High Gross Profit Margin
High Cost Structure
Limited Data
Portmans Acquired in June 2002
Year One Year Two
Managed Costs
Progressively Built Data Set
Integrated Fully
Reduced Store Labour Cost
Reviewed Leases
Developed New Store Format
Repositioned Brand to Younger Demographic
Re-launched Brand on TV
Began Roll-out of New Store Format
Driving Sales and Profit
Now
Store Roll-out
New Zealand Expansion
New Sales Structure
Increasing Advertising Investment
Costs Brand Growth
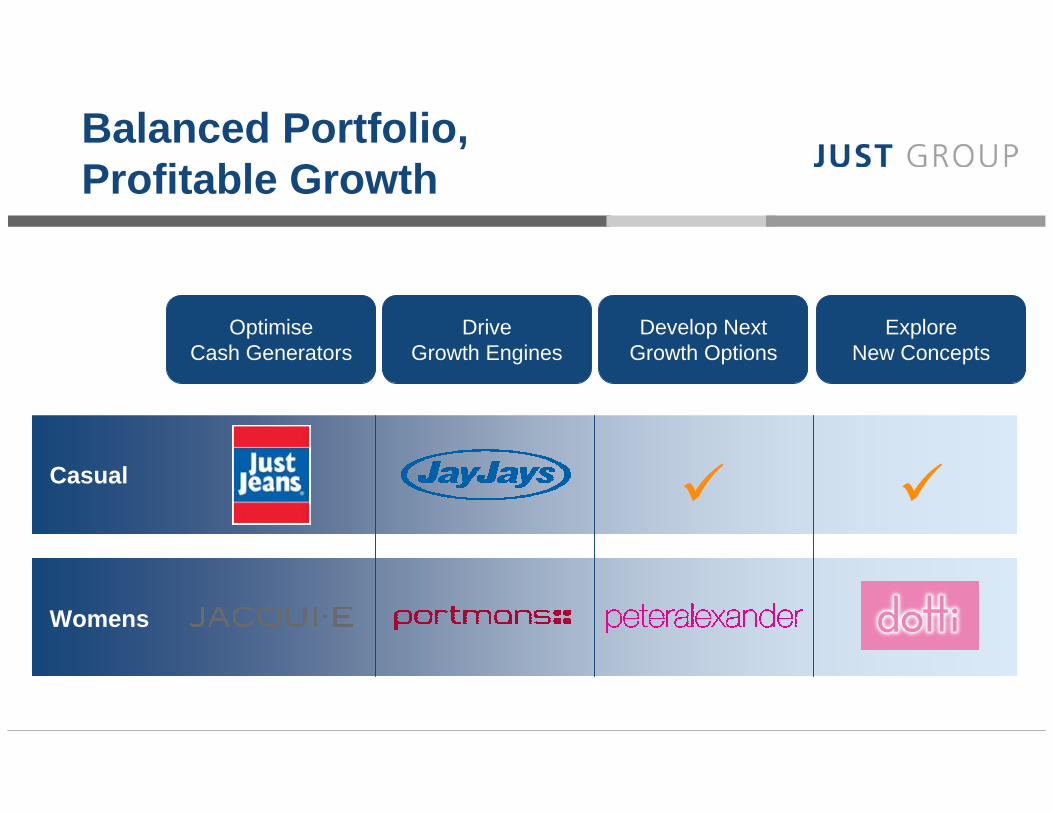
Balanced Portfolio, Profitable Growth
Casual
Womens
OptimiseCash Generators
DriveGrowth Engines
Develop NextGrowth Options
ExploreNew Concepts

Supply Chain Speed is Critical
2 Weeks 4-6 Weeks 4-6 Weeks
Range Reviews
PatternMaking &
Placement
Development
Fabric Production
Garment Production
Shipping
12-14 Weeksto DC
OffshoreRe-order Cycle
LocalRe-make Cycle
2-4 Weeks
2-3 Weeks
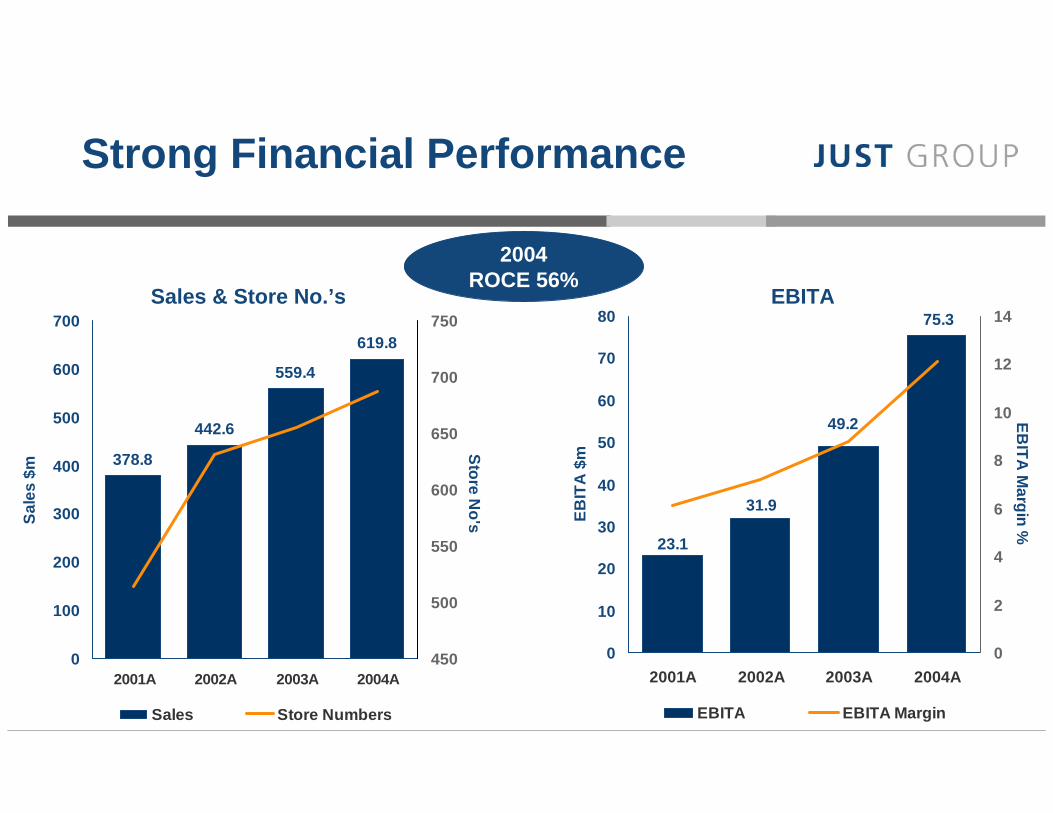
2004ROCE 56%
Strong Financial Performance
378.8
442.6
559.4
619.8
0
100
200
300
400
500
600
700
2001A 2002A 2003A 2004A
Sale
s $m
450
500
550
600
650
700
750
Store No's
Sales Store Numbers
Sales & Store No.’s
23.1
31.9
49.2
75.3
0
10
20
30
40
50
60
70
80
2001A 2002A 2003A 2004A
EBIT
A $
m
0
2
4
6
8
10
12
14
EBITA
Margin %
EBITA EBITA Margin
EBITA
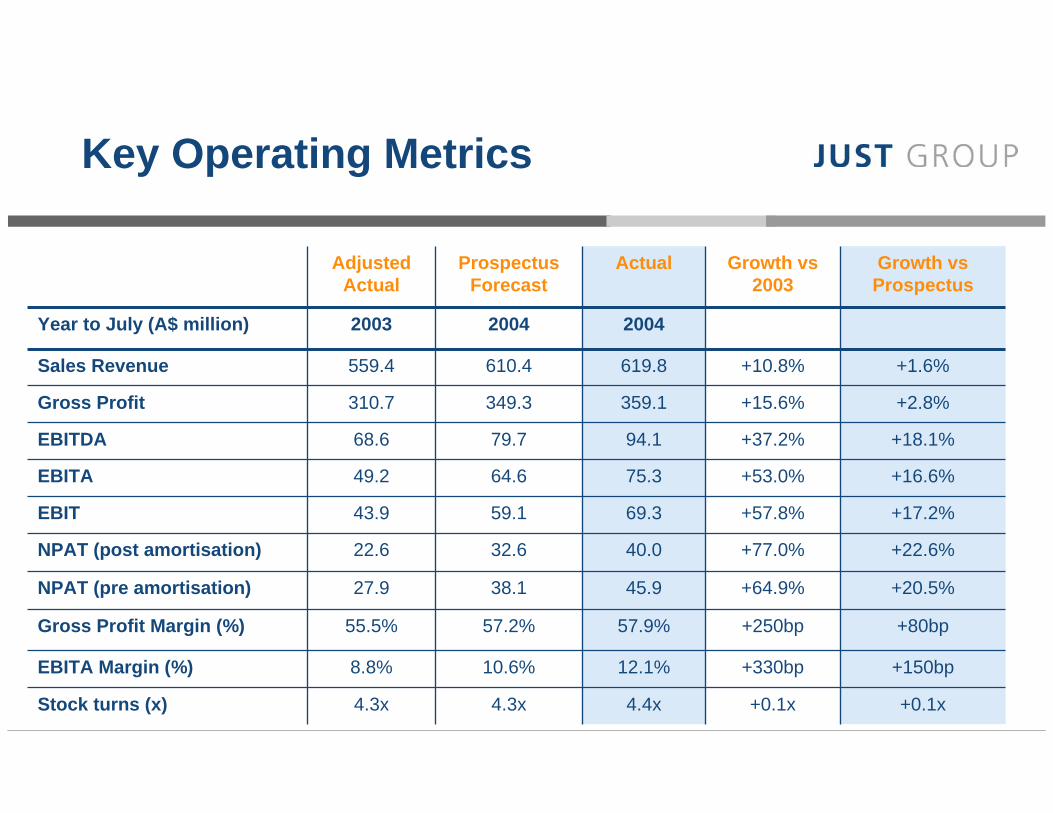
Key Operating Metrics
+22.6%+77.0%40.032.622.6NPAT (post amortisation)
ActualProspectus Forecast
+0.1x
+150bp
+80bp
+20.5%
+17.2%
+16.6%
+18.1%
+2.8%
+1.6%
Growth vsProspectus
+330bp12.1%10.6%8.8%EBITA Margin (%)
Growth vs2003
Adjusted Actual
+0.1x
+250bp
+64.9%
+57.8%
+53.0%
+37.2%
+15.6%
+10.8%
4.4x4.3x4.3xStock turns (x)
57.9%57.2%55.5%Gross Profit Margin (%)
45.938.127.9NPAT (pre amortisation)
69.359.143.9EBIT
75.364.649.2EBITA
94.179.768.6EBITDA
359.1349.3310.7Gross Profit
619.8610.4559.4Sales Revenue
200420042003Year to July (A$ million)

Recommended