AdvbyDegreesindd c1 552010 22920 PM
Advancing by Degrees
AP
RIL
2
01
0
HI
GH
ER
E
DU
CA
IT
ON
A Framework for Increasing College Completion
2 IHELP | THE EDUCATION TRUST | ADVANCING BY DEGREES | APRIL 2010
AdvbyDegreesindd c2 552010 22927 PM
Higher education leaders need to understand
what really drives student success Tracking
six-year graduation and annual retention
rates isnrsquot enough By monitoring a set
of milestones and on-track indicatorsmdash
measurable educational achievements
and academic and enrollment patternsmdash
institutional leaders can learn which groups of
students are making progress and which are
notmdashand why Data college offi cials gather in
this process can inform changes in policies or
practices and help struggling students get the
help they need
copy Copyright 2010 Institute for Higher Education Leadership amp Policy and The Education Trust All rights reserved
AdvbyDegreesindd 1 552010 22927 PM
Advancing by Degrees A Framework for Increasing College Completion
B Y J E R E M Y O F F E N S T E I N C O L L E E N M O O R E A N D N A N C Y S H U L O C K
The United States is becoming less globally
competitive as other nations move aggressively
to educate their populations To lead the world
once again in educational attainmentmdashPresident
Obamarsquos goal by 2020mdashmore Americans will need to enter
college But our biggest challenge isnrsquot college going it is
college completion
Low-income students and students of colormdasha large
and growing populationmdashcomplete college at especially
low rates At many institutions though graduation rates
are not high for any group of students
Around the country higher education leaders who want
to help increase the number of graduates in their comshy
munities and states are all asking the same questions To
improve student success where should we focus And how
will we know if what we do is working
bull At one major state university system leaders are
concerned that black and Latino students are earnshy
ing bachelorrsquos degrees at far lower rates than white
and Asian students They find the extensive research
literature about student success more overwhelming
than helpful Moreover their budget has just been
cut and they have to be sure that the steps they take
address the root of the problem Where should they
start
bull At a large community college system leaders know
that most students never advance to the point of
passing a college-level mathematics course and thus
never earn a college degree System leaders have
observed how certain ldquoboutiquerdquo programs have
helped students succeed in math but they cannot
afford to offer these programs to all students What
changes in institutional practice or policy would help
eliminate barriers to success and give students the
best chance of passing college-level math
Experience has taught us that the answers to these quesshy
tions often lie buried in the reams of data that most colshy
leges routinely produce but rarely analyze Drawing on our
analyses of data from two large postsecondary systems this
report aims to help system and campus leaders use their
data to (1) deepen their understanding of what really aids
student success and (2) produce a set of timely ldquoon trackrdquo
indicators that can rapidly gauge the impact of efforts to
produce change
Timely indicators are hugely important if institutional
leaders are to know whether things are on track or off
track mdashbefore itrsquos too late Monitoring six-year graduation
rates in other words doesnrsquot come close to being good
enough Neither does simply monitoring annual retention
rates because there is so much more that can help leaders
understand whatrsquos going right or wrong on the road to colshy
lege success
Wersquove provided some examples of how to analyze instishy
tutional data and create more useful indicators by drawing
on data sets from one public university system and one
large community college system The answers you get may
vary somewhat from these for some things may be more
(or less) important in certain types of institutions or for
certain types of students
Regardless of the circumstances however there are
two things institutional leaders should never do as they
learn more about the students who donrsquot succeed They
shouldnrsquot lower standards and they shouldnrsquot excuse low
graduation rates for some groups of students because
ldquostudents like theserdquo supposedly cannot be expected to
graduate at higher rates
Jeremy Offenstein is a research analyst Colleen Moore is a research specialist and Nancy Shulock is director of the Institute for Higher Education Leadership amp Policy in Sacramento Calif
IHELP | THE EDUCATION TRUST | ADV ANCING BY DEGREES | APRIL 2010 1
AdvbyDegreesindd 2 552010 22927 PM
WHAT THE RESEARCH SHOWS Although students surely must be held accountable for
doing their part to prepare for and succeed in college
most institutional leaders know that their colleges could
work a lot better for todayrsquos students Fortunately the
research literature is encouraging in this regard Much is
known about factors that lead to student academic progshy
ress and degree completion And much of this is within
the power of institutions to affect
Available research tells us a lot about what matters in
efforts to improve student success Although each study
approaches the issue a little differently most point in the
same general direction And the findings about what matshy
ters hold up across different groups of students entering at
very different levels of preparation
Remediation Many students enroll in college academically unprepared
for college-level work This makes the need for remediashy
tion a major barrier for students and suggests the successshy
ful completion of remediation as a possible indicator of
momentum Some students who need extra help do not
enroll in the appropriate remedial courses which comshy
plicates efforts to evaluate the effectiveness of specifi c
remedial programs Some research has found that students
who successfully complete remedial coursework have
persistence and success rates similar to those who start
directly in college-level courses while other studies fi nd
little evidence that remediation improves rates of success
A number of researchers have found that students who
enroll in remedial coursework immediately upon entering
college have better outcomes than those who delay needed
remediation
Gateway Courses Research in both two-year and four-year colleges points
to the importance of enrolling in and completing college-
level math early in a studentrsquos college career Some studies
also suggest that early completion of science courses can
serve as an indicator of likely success The importance of
college-level English courses as an indicator is not as clear
Some studies find a positive relationship between comshy
pleting college-level English early and degree completion
other studies show no effect
Credit Accumulation and Academic Behaviors Research points to the importance of early accumulashy
tion of credits as a means of creating momentum toward
degree completion Research on students in both two-year
and four-year institutions indicates that earning fewer than
a particular number of college-level credits in the fi rst year
(typically 20 to 30) is negatively related to completion
Accumulating additional credits during summer terms
is associated with increasing the likelihood of degree
completion This may reflect an impact of summer school
attendance per se or the fact that summer provides an
opportunity for students to make up for low credits in
an earlier term or to retake failed courses There are also
patterns of enrollment that make it difficult to accumulate
credits most notably part-time attendance and stopping
out both of which are consistently found to reduce the
likelihood of retention and degree completion
Studies also have found that students who withdraw
from a substantial share of courses (with common meashy
sures being 10 percent or 20 percent) reduce their chances
of degree completion This holds true for students in
two-year and four-year institutions alike And in commushy
nity colleges research on the impact of registering late for
classes has generally concluded that late registrants have
higher course-withdrawal rates lower grade-point averages
(GPA) and lower retention rates
Academic performance in college usually measured as
GPA provides another important indicator of progress
Indeed studies find substantial increases in the chance
of retention and degree completion with every one-grade
increase in college GPA after controlling for high school
preparation and other factors Other research has emphashy
sized the importance of the trend in a studentrsquos GPA
Students with rising GPAs over some number of terms are
more likely to earn a degree than students with GPAs that
either remain constant or decline over time
A FRAMEWORK FOR IMPROVING AND MONITORING STUDENT SUCCESS Institutional leaders who want to do more than monitor
year-to-year retention rates and six-year graduation rates
may find it helpful to think about things this way
bull Milestones are measurable educational achieveshy
ments that students reach along the path to degree
completion
bull On-track indicators are measurable academic and
enrollment patterns that if followed give students a
IHELP | THE EDUCATION TRUST | ADV ANCING BY DEGREES | APRIL 2010 2
AdvbyDegreesindd 3 552010 22927 PM
good chance of reaching key milestones and earning
a degree
By monitoring on-track indicators institutional leaders
can better understand not only which milestones students
are failing to reach but why they are not reaching them
This knowledge can help leaders design interventions or
policy changes to increase student success Continued
monitoring of on-track indicators relative to milestones
can help leaders gauge the impact of interventions
The framework is intended to help leaders understand
the problem of insufficient graduation rates diagnose the
reasons behind the problem and target their responses
accordingly The indicators can form the foundation for an
early warning system that can help identify students who
are struggling and get them the advice and help they need
Our purposes here however are different to help leaders
within an institution look beyond individual students to
see general patterns among large groups of students and to
use those data to reflect on policies or practices that need
attention These data in turn can become a means for
measuring the impact of changes in policy and practice
As we show in the subsequent analyses of data from
two large postsecondary systems the framework can be
applied as follows
bull Obtain institutional data with student-level transhy
script data
bull Analyze student achievement of various milestones
by subgroup to identify places where progress stalls
bull Investigate these stall-spots by using on-track indicashy
tors to learn which students are not following sucshy
cessful enrollment patterns where they are stalling
Table 1 Potential Milestones and On-Track Indicators
and what they are doing instead
bull Explore the relationships between current instishy
tutional policies and practices and the patterns
revealed in the analysis
bull Decide on interventionsmdashthat is changes in policy
andor practicemdashand agree on the most critical on-
track indicators to measure in order to monitor the
impact of any changes implemented
Table 1 displays the two key components of the
framework derived from a comprehensive review of the
literature on postsecondary student success1 The research
points to milestones or measureable intermediate outshy
comes that vary by institutional type For example for
students beginning their study in a community college
transferring to a university represents a milestone on the
pathway to earning a bachelorrsquos degree (The degree of
progress it represents depends on whether the student
transfers after completing all lower division requirements
or some lesser amount of transferable coursework) For
students beginning in a university completing general
education coursework would be a milestone achievement
The research also points to ldquoon-track indicatorsrdquo related
to three categories of student academic patterns
1 Remediationmdashthe importance of addressing any
remedial needs immediately on enrollment
2 Gateway coursesmdashthe benefit of early enrollment in
and completion of certain gateway courses
3 Credit accumulation and related academic behavshy
iorsmdashthe importance of building academic momenshy
tum through academic behaviors that lead to the
timely earning of college credits
Milestones On-Track Indicators
bull Return for subsequent terms (retention) bull Complete needed remediation bull Begin college-level coursework in math and English bull Earn one year of college-level credits bull Complete general education coursework bull Complete a community-college transfer curriculum bull Transfer from community college to a university
- after completing transfer curriculum - without completing transfer curriculum
bull Complete a certificate or degree
Remediation
bull Begin remedial coursework in first term if needed Gateway Courses
bull Complete college-level math andor English in the first or second year bull Complete a college-success course or other first-year experience program Credit Accumulation and Related Academic Behaviors
bull Complete high percentage of courses attempted (low rate of course dropping andor failure)
bull Complete 20-30 credits in the first year bull Earn summer credits bull Enroll full time bull Enroll continuously without stop-outs bull Register on time for courses bull Maintain adequate grade-point average
IHELP | THE EDUCATION TRUST | ADV ANCING BY DEGREES | APRIL 2010 3
AdvbyDegreesindd 4 552010 22927 PM
The remainder of this report describes our use of data
from two large higher education systems to confi rm the
patterns of student progress and success noted in the
research literature and to demonstrate the value of using
milestones and on-track indicators to identify points
where students are falling ldquooff trackrdquo By doing so college
leaders will be able to use that information to change
policies and practices to better support student success
TOO FEW STUDENTS REACH MILESTONES ON THE ROAD TO DEGREE COMPLETION To examine patterns of student progress in different types
of institutions with different levels of admissions selecshy
tivity we obtained data from both a community college
system and a university system
The largest system of its kind in the country the Califorshy
nia Community College system (CCC) has 112 open-adshy
missions campuses The State University System of Florida
(SUSF) is fairly selective in its admissions relative to other
public four-year systems Both CCC and SUSF maintain
student-level tracking data at the system offices and both
are large enough to allow for disaggregating data for subshy
groups of students Each system provided data to track a
cohort of new students over time (see ldquoData and Methodsrdquo
on page 7 for more details) Although little remediation
occurs in the SUSF and the CCC did not have good data
on remedial placements their data systems had virtually
all of the other elements necessary to track progress
Milestone Achievement in the California Community Colleges Figure 1 shows the percentage of degree seekers in a cohort
of CCC students who achieved different milestones within
seven years
Among degree seekers in the CCC
bull 74 percent returned for a second semester and
bull 58 percent returned for a second year
Even within seven years of entry large numbers of stushy
dents didnrsquot complete the courses or programs that would
make a significant difference in their lives For example
bull Of entering degree seekers 38 percent failed to
complete even the 12 college credits that researchers
generally associate with the achievement of genuine
ldquocollege pathwayrdquo (nonremedial) status2
bull A majoritymdash58 percentmdashfailed to earn the one year
of college-level credits (30 semester hours) often
associated with increased earnings3
Moreover indicators of completion rates remained low
bull About 23 percent transferred to a four-year college
bull Roughly half of those who transferred to a university
completed a transfer curriculum (not shown) indishy
cating that many transfer students from California
community colleges are not entering universities as
upper division students
bull Only 3 percent completed a certificate and about 8
percent completed an associatersquos degree
In sum only about 29 percent of entering degree-
seeking students completed anythingmdashthat is a certifi cate
a degree or transfer to a four-year college4
Given the large number of nontraditional students in
community colleges it is important to examine outcomes
by age and attendance status5 And indeed we found
some significant differences Full-time students and those
of traditional college age are more likely to reach each of
the milestones (see Figure 2) than part-timers and older
students Further students of traditional college age were
more likely to complete a transfer curriculum before transshy
ferring to a university (not shown)
Racial and ethnic disparities in outcomes are important
to consider especially given the growing populations of
underrepresented minority students in higher education
Among the CCC cohort white and Asian students were
more likely to reach each of the milestones than black
and Latino students (see Figure 3) Intriguingly Latino
Figure 1 Milestone Achievement Among Degree Seekers in the CCC Cohort (within seven years)
Perc
enta
ge A
chie
ving
Mile
ston
e 100
80
60
40
20
0
740
622 580
418
286 227
167 7933
Retained Retained 12+ College 30+ College Transfer Certificate Assoc Transferred Any 2nd Term 2nd Year Credits Credits Curriculum Degree Completion
4 IHELP | THE EDUCATION TRUST | ADV ANCING BY DEGREES | APRIL 2010
769
533
430
AdvbyDegreesindd 5 552010 22928 PM
students were about as likely as white students to persist to Figure 2 Milestone Achievement Among Degree Seekers by Agethe second term and the second year (not shown) but they and Enrollment Status in the CCC Cohort (within seven years)
were less likely to reach the other milestones
Black transfer students were far less likely to have com- 100
805
671
559
430
623
30
126
353
414
427
90
11
1
130
257
21 4
9 222
25
4
50
48 8
014
835
2
206
12+ College Credits 30+ College Credits Certificate Assoc Degree Transferred Any Completion
pleted a transfer curriculum Indeed 70 percent of black
Perc
enta
ge A
chie
ving
Mile
ston
e
80
60
40
20
transfer students moved to a university without having
completed such a curriculum (not shown) Related to this
lower likelihood of completing a transfer curriculum black
students were considerably less likely to transfer to one
of Californiarsquos public universities with only 44 percent of
black student transfers moving on to one of these institushy
tions compared with 68 percent of all students6
Figure 4 shows the percentage of degree seekers com- 0 Traditional Age Older Traditional Age Older
pleting a certificate or degree or transferring to a university (17-24) (25+) (17-24) (25+)
Full-Time Part-Time by year The largest numbers of completions occurred in
the third and fourth years
Figure 3 Milestone Achievement Among Degree Seekers in theMilestone Achievement in the CCC Cohort by RaceEthnicityState University System of Florida
As expected levels of milestone achievement were higher 100
for students initially enrolling in a four-year institution
683
76
9
533
64
0
444
36 8
826
6 32
4
527
37
100
302
374
30 5
0 177
21
7
34 6
7
159
209
289
360
12+ College Credits 30+ College Credits Certificate Assoc Degree Transferred Any Completion
(see Figure 5) Among the cohort of first-time freshmen in
the SUSF
bull By the second semester 94 percent were still enrolled
bull More than eight in ten students were retained to the
second year nearly 85 percent completed at least one
year of college credits
bull Some 70 percent completed at least 15 lower divishy
sion courses intended as a measure of completing a
Perc
enta
ge A
chie
ving
Mile
ston
e
80
60
40
20
0general education curriculum White Asian Black LatinoHispanic
bull Nearly 64 percent completed a bachelorrsquos degree
Interestingly there were marked variations in these
patterns by race Black and Latino students were about
as likely to complete 30 credits or a general education Figure 4 Percentage of Degree Seekers Completing a Certificate Degree or Transfer in the CCC Cohort by Year curriculum but the likelihood of degree completion was
lower especially for black students Among white students
for example almost all of the students who completed
15 lower division courses also completed a bachelorrsquos
degree (686 percent versus 677 percent) Black and Latino
students completed 15 lower division courses at rates
slightly higher than those of white students but their rates
of degree acquisition were significantly lowermdash54 percent
and 61 percent respectively (see Figure 6)
Figure 7 shows the percentage of SUSF students com-
Perc
enta
ge C
ompl
etin
g C
ertif
icat
e D
egre
e o
r Tra
nsfe
r
10
8
6
4
Year 1 Year 2 Year 3 Year 4 Year 5 Year 6 Year 7
03
01
22
42
07 07
08 2
1
53
42
07 2
1
05
14
03
09
29
03 0
7 212
4
Certificate Assoc Degree Transferred
2
pleting a bachelorrsquos degree by year While the largest numshy
ber of completions occurred in year four only 32 percent 0
of students had received a degree by that year half the
IHELP | THE EDUCATION TRUST | ADV ANCING BY DEGREES | APRIL 2010 5
769
430
AdvbyDegreesindd 6 552010 22929 PM
number who would eventually finish within the eight-year Figure 5 Milestone Achievement in the SUSF Cohort (within eighttracking period years)
We now turn to the relationship of on-track indicators
in Table 1 to the likelihood of completion (of a bachelorrsquos 100
degree in the SUSF and of a certifi cateassociate degree 936
831 845
701 635
Perc
enta
ge A
chie
ving
Mile
ston
e 80
60
40
20
transfer in the CCC) Data limitations in each of the systems
preclude analysis of some of the on-track indicators particshy
ularly those related to remediation7 Nevertheless what we
learned provides some helpful clues about success patterns
When we began our examination of system data we
knew from previous research that certain things seemed
to matter in student success But we didnrsquot know exactly
how they would play out in these very different systems or
whether there would be similarities across the systems An
overview of what we learned follows
ON-TRACK INDICATORS WHAT DID WE LEARN ABOUT GATEWAY COURSES Taking college-level math and English early Students in both the CCC and the SUSF cohorts were
more likely to ldquocompleterdquomdashin the CCC that means earn
0 Retained Retained 30+ College 15 Lower Bachelorrsquos 2nd Term 2nd Year Credits Division Courses Degree
Figure 6 Milestone Achievement in the SUSF Cohort by Race Ethnicity
100
80
White Asian Black LatinoHispanic
871844 838 853
722
613
686 677
755
669 729
515
Perc
enta
ge A
chie
ving
Mile
ston
e
a degree a certificate or transfer and in the SUSF it means
earn a bachelorrsquos degreemdashif they completed college-level
math and English early in their enrollment with a grade of
C or better (see Figure 8)
CCC students who completed a college-level math
60
40
20 course within two years of initial enrollment were nearly
three times as likely to complete as students who did not
complete college-level math in that time period Similarly
four-fifths of SUSF students who completed a college-level
math course in their first year earned a bachelorrsquos degree
compared with fewer than half of students who did not
complete a college-level math course in their fi rst year9
Taking ldquosuccessrdquo courses Many colleges offer courses designed to help students
achieve in college and in their careers We call these ldquosuccessrdquo
courses Completing a success course appears to help many
0
Completed 30+ College Credits Bachelorrsquos Degree Completed 15 Lower Division Courses
Figure 7 Percentage of Students Receiving a Bachelorrsquos Degree by Year in the SUSF Cohort
100
0 0 3
29
21
7 3 1
Year 1 Year 2 Year 3 Year 4 Year 5 Year 6 Year 7 Year 7
Perc
enta
ge C
ompl
etin
g B
ache
lorrsquos
Deg
ree
80
60
40
students earn a degree or certificate or to transfer
Our analysis suggests however that it is important
to look underneath these overall averages For example
older students and traditional-age part-time students who
completed a success course had higher completion rates in
the CCC (see Figure 9) Interestingly black students in the 20
CCC who completed a success course were less likely to
complete than black students who did not And for Asian 0
students completing a success course was unrelated to
completion10
IHELP | THE EDUCATION TRUST | ADV ANCING BY DEGREES | APRIL 2010 6
AdvbyDegreesindd 7 552010 22930 PM
DATA AND METHODS Data Source 1 California Community Colleges Chancellorrsquos Office
The student-unit records (SUR) data include demographic information courses taken degreescertificates earned and transfers to four-year universities based on matches to the statersquos public universities and to the National Student Clearingshyhouse We analyzed data for the entering cohort of first-time California Community College students who enrolled in one or more credit-bearing courses during the 2000-01 academic year Noncredit students and high school students concurrently enrolled in community college were excluded We tracked the students over a seven-year period through 2006-07 Data limitations include lack of information on the following student income or other measures of socioeconomic status and assessment-test scores placement recommendations or other indicators of academic preparation for college-level study
The analyses focus on a subset of students identified as ldquodegree seekersrdquo (a term that includes both degrees and certificates) based on their having enrolled in more than six units during the first year This definition is based on a recent suggestion by Clifford Adelman as part of national discussions about revising the federal methodology for calculating gradushyation rates8 Using Adelmanrsquos suggested criterion 63 percent of students in the cohort were identified as degree seekers (N=247493) These students were somewhat younger with an average age of 24 compared with 26 for the entire cohort of students Fifty-three percent of degree seekers were younger
In Florida differences surfaced among campuses In
nine of the ten universities first attended by SUSF students
students who completed a success course were more likely
to earn a bachelorrsquos degree than students who did not
complete a success course (see Figure 10)11
ON-TRACK INDICATORS WHAT DID WE LEARN ABOUT CREDIT ACCUMULATION
Accumulating first-year and second-year credits Choosing on-track indicators for credits earned involves
several considerations
bull whether to track only college-level credits or to track
all credits (including developmentalremedial)
bull whether to track only first-year credits or to track
credits in subsequent years
bull whether to track credits for all students or sepashy
rately for full-time and part-time students (note that
students often change their attendance status across
terms) and
than 20 and 10 percent were age 40 or older compared with 45 percent and 17 percent respectively for the entire cohort The gender and racialethnic distributions were about the same
Data Source 2 Florida Board of Governors The SUR data include demographic information course-taking records and records of degrees earned We analyzed data for the entering cohort of all first-time freshmen in all ten universities in the State University System of Florida in the 1999-2000 academic year We tracked the students over eight years through 2006-07 Limitations of the data include a lack of information on student income and on credits earned through Advanced Placement exams concurrent enrollment or high admission-test scores All students in the cohort were included in the analyses as it was assumed that all students enrolled intending to pursue a bachelorrsquos degree (N=30497)
Methods We calculated the percentage of students who reached milestones and the rates of milestone achievement for different groups of students To gauge the probability of degree compleshytion we examined whether students met the on-track indicashytors We used regression analysis to test whether the on-track indicators predicted completion after controlling for other factors and whether the relationships held across all groups of students (such as racialethnic groups age groups and students who received need-based aid) More details about the statistical analyses are described in the appendix
bull the appropriate threshold of accumulated credits
Our research did not find a threshold number that was
associated with a substantial jump in the completion rate
Rather in both the CCC and the SUSF cohorts we found
a fairly linear relationship between the number of credits
a student earned and the probability of completion The
more credits earned in the first year the higher the chance
of completing (see Figure 11)
That said the impact of early credit accumulation was
clear in both systems We set the threshold at 20 credits (of
any kind) in the first year for the CCC cohort and 24 credshy
its in the first year and 48 credits through the second year
for the SUSF cohort12 Fifty-eight percent of CCC students
who earned at least 20 credits in the first year completedmdash
three times as many as those who did not earn 20 credits
in the first year (see Figure 12) We found a similar pattern
for SUSF students Three-quarters of students who comshy
pleted at least 24 credits in the first year earned a bachelorrsquos
degree compared with 38 percent of students who did not
meet that threshold
IHELP | THE EDUCATION TRUST | ADV ANCING BY DEGREES | APRIL 2010 7
AdvbyDegreesindd 8 552010 22930 PM
Completing summer creditsFigure 8 Probability of Completion Based on Early Completion of
In both the Florida and California systems students who College-Level Math and English earned summer credits completed at a higher rate (see Fig-
Completed college- Completed college- Completed college- Completed college-
Perc
enta
ge C
ompl
etin
g
0
20
40
611
220
512
212
797
416
703
318
60
80
100 Completed Course Did Not Complete Course
ure 13) The difference in the rate of earning a bachelorrsquos
degree between SUSF students who earned summer credits
and those who did not was particularly large (75 percent
versus 12 percent)
However before acting on this information it may
be important to understand what it means and what it
doesnrsquot The strong relationship between earning summer
credits and completion may not mean that it is summer
attendance per se that helps students complete their
level math level English level math by level English by in two years in two years end of Year 1 end of Year 1
CCC Cohort SUSF
Figure 9 Probability of Completion at CCC Based on Finishing a Success Course by Attendance Status and Age Group
100
degrees Students who attend regularly and persist over a
number of years are likely as well to take summer classes13
Therefore summer attendance is in part an indicator that
students are being retained and taking a continuous proshy
gression of courses However summer terms also provide
students with an opportunity to build and sustain progress
by earning additional credits and retaking courses not
completed during other terms14
80
346
269
423 410
307 243
288 245
211 141
Completed Course Did Not Complete Course
Completing most courses attempted To accumulate credits and build momentum toward
60 completion students need to complete their courses
Perc
enta
ge C
ompl
etin
g C
ertif
icat
e
Deg
ree
or T
rans
fer
We calculated credit-completion ratios as the number of 40
credits earned divided by the number of credits attempted
so that either failing or withdrawing from a course led to 20
0 All Students Traditional Older Traditional Older
Age Age
Full Time Part Time
noncompletion of credits We found that rates of earning
a degree attaining a certificate or transferring were 24 and
40 percentage points higher in the CCC and the SUSF sysshy
tems respectively for students who completed at least 80
percent of the credits they enrolled in during the fi rst year
compared with those who completed a smaller percentage
of first-year credits (see Figure 14)
Figure 10 Probability of Bachelorrsquos Degree Completion at SUSF Based on Finishing a Success Course by First University Attended
442
434
509
480
500
467
67
4
650
667
599
589
519
479
514
931
821
549
321
100
735
Perc
enta
ge C
ompl
etin
g B
ache
lorrsquos
Deg
ree
Completed Course Did Not Complete Course
0
20
40
60
80
100
University 1 University 2 University 3 University 4 University 5 University 6 University 7 University 8 University 9 University 10
IHELP | THE EDUCATION TRUST | ADV ANCING BY DEGREES | APRIL 2010 8
AdvbyDegreesindd 9 552010 22930 PM
Enrolling continuously and full-time Figure 11 Probability of Completion by First-Year Credits Earned
Obviously students who attend full time and enroll
continuously can accumulate credits faster than students 100
0-3 gt3-6 gt6ndash9 gt9ndash12 gt12ndash15 gt15ndash18 gt18ndash21 gt21ndash24 gt24ndash27 gt27ndash30 gt30
SUSF CCCwho enroll part time and stop out What may be surprisshy
80ing is how big those differences are In the CCC students
who enrolled full time in their first term were almost twice
as likely to complete as students who enrolled part time
(see Figure 15) Continuously enrolled CCC students had
Perc
enta
ge C
ompl
etin
g
60
40 a completion rate that was seven percentage points higher
than students who stopped out Both factors were associshy
ated with higher rates of earning a bachelorrsquos degree in the
SUSF although far fewer students enroll part time or stop
out in that system
Once again there are some differences underneath
these averages In the CCC for example continuous
enrollment did not correlate with completion for students
25 and older Similarly continuous enrollment did not
predict completion for Asian students in either system15 In
the CCC late registration for courses affected the probabilshy
20
0
First-Year Credits Earned
Figure 12 Probability of Completion Based on Early Accumulation of Credits
100ity of completion The likelihood of completion declined
as the share of courses a student enrolled in late increased
(ldquoLate registrationrdquo was defined as enrolling in a course
after the start date of the term16) Students who registered
late for no more than one in five of their courses had a
completion rate of 32 percent compared with 24 percent
for students who registered late more often Late registrashy
579
194
782
377
858
345
Met Credit Threshold Did Not Meet Credit Threshold
Perc
enta
ge C
ompl
etin
g 80
60
40
tion affected completion for all student groups nearly half 20
(47 percent) of all CCC students registered late for at least
one in five of their courses 0 Earned 20+ Credits Earned 24+ Credits Earned 48+ Credits
in Year 1 in Year 1 Through Year 2
SUSF CohortCCC CohortUSING MILESTONES AND ON-TRACK INDICATORS TO INCREASE DEGREE COMPLETION How can our two postsecondary systems use the frameshy
work of milestones and on-track indicators to identify Figure 13 Probability of Completion Based on Earning Summer problems and design institutional interventions to boost Credits degree completion As they flag problems and plan intershy
100ventions systems like these can take the following steps
1 Collect data on student progress along the milestones
CCC Cohort SUSF Cohort
450
145
746
116
Earned Summer Credit Did Not Earn Summer Credit
80 to degree completion
2 Note at what milestone points student progress is
stalling
3 Analyze on-track indicators to understand what
successful patterns are not being followed leaving Perc
enta
ge C
ompl
etin
g
60
40
students off track for a degree 20
4 Intervene through changes in policy or practice that
address the problem and increase student success 0
IHELP | THE EDUCATION TRUST | ADV ANCING BY DEGREES | APRIL 2010 9
AdvbyDegreesindd 10 552010 22931 PM
5 Monitor the impact of these changes on milestones
and on-track indicators
As an example we analyzed patterns related to two
important on-track indicators early completion of college-
level math and credit accumulation during the fi rst year
of enrollment Figure 16 displays some patterns related
to college-level math for CCC students It shows a large
percentage of CCC students did not complete college-
level math within two years of entry About half of those
students had not enrolled in any math course within two
years (Further analysis could reveal more about these
students including whether they remained enrolled for the
two years or droppedstopped out) The other half enrolled
in math with some students taking only remedial courses
and others attempting but not successfully completing
college-level math
Figure 14 Probability of Completion Based on Credit-Completion Ratios
CCC Cohort SUSF Cohort
Perc
enta
ge C
ompl
eted
387
146
745
348
Year 1 CCR 80+ Year 1 CCR Less Than 80
0
20
40
60
80
100
Figure 15 Probability of Completion Based on Attendance Patterns
Perc
enta
ge C
ompl
etin
g
389
214
360 289
324
656
406
710
505
243
Met Indicator Did Not Meet Indicator
0
20
40
60
80
100
Full Time in Enroll Register On Full Time in Enroll First Term Continously Time for 80+ First Term Continously
of Courses
CCC Cohort SUSF Cohort
College officials could change certain policies and pracshy
tices to increase the share of students completing college-
level math depending on the largest source of the problem
in a particular system or institution Figure 17 displays a
similar analysis of patterns related to early credit accumushy
lation for SUSF students
DIAGNOSING WHY PROGRESS OF BLACK AND LATINO STUDENTS STALLS BEFORE DEGREE COMPLETION Our analysis shows that it often is important to disaggreshy
gate the data and look beneath campuswide or systemwide
averages at the performance of certain groups of students
For example our analysis of milestone completion at SUSF
found that black and Latino students completed 30 credits
and 15 lower division courses at rates similar to white and
Asian students suggesting that they were on track to graduate
But they earned bachelorrsquos degrees at lower rates So while
these students were on track for the first two milestones
they failed to complete the journeymdashat least by the end of
eight years
Why was this the case To understand this fi nding
we took a closer look at the patterns for those black and
Latino students who completed the earlier milestones but
did not earn a degree We began by looking at how far
these students progressed towards completion We found
that 17 percent of black students and 19 percent of Latino
students earned fewer than 60 units and that a larger group
of black (45 percent) and Latino (36 percent) students
earned at least 105 credits Although students in neither of
these groups completed a degree their enrollment patterns
differed markedly and suggest different problems requiring
different institutional actions
Some of the students who earned fewer than 60 credits
may have dropped out of school entirely or stopped out
for extended periods of time but others may have transshy
ferred to other colleges for-profit institutions or historishy
cally black colleges and universities Perhaps minority
students found that the statersquos public universities did not
provide a welcoming climate or did not meet their needs
With additional data college leaders could examine
a variety of possible explanations for why these students
did not progress beyond 60 units Additional data mdashsuch
as records of student enrollments at other institutions
from the National Student Clearinghouse or qualitative
data from interviews or focus groups with students who
stopped attendingmdashwould provide additional information
to help shape policy and practice
IHELP | THE EDUCATION TRUST | ADV ANCING BY DEGREES | APRIL 2010 10
All Degree Seekers (N = 247493)
Completed at least one college-level math course within two yearsmdash41808 (17)
Did NOT complete at least one college-level math course within two years mdash205685 (83)
No math course taken within two yearsN = 105148 (51)
Enrolled in at least one math courseN = 100537 (49)
Enrolled only in remedial mathN = 64412 (64)
Enrolled in college-level mathN = 36125 (36)
On average these students bull Enrolled in two college-level math
courses in the two yearsbull Droppedmdash65bull Failedmdash35
All Students (N=30497)
Completed 24+ credits in fi rst year19458 (638)
Did NOT complete 24+ credits in fi rst year11039 (362)
Did not attempt 24 credits in fi rst year3907 (353)
Attempted 24+ credits in fi rst year7138 (647)
On average these students bull Enrolled in 27 credits in the fi rst yearbull Dropped 122 of coursesbull Failed 203 of coursesbull Had a fi rst-year GPA of 202
AdvbyDegreesindd 11 552010 22932 PM
Figure 16 Patterns Related to Early Completion of College-Level Math (CCC Students)
bull Policies related to assessment and placement of incoming students
bull Practices related to advising and registration processes for new students
bull Policies that allow fl exibility for implementing innovative methods of course delivery
bull Practices that use innovative methods of designing and teaching remedial math courses
bull Policies related to course dropping and course repeats allocations of funding to provide incentives for course completion
bull Practices that identify struggling students early and provide academic assistance
Figure 17 Patterns Related to Early Credit Accumulation (SUSF Students)
bull Policies related to fi nancial aid fees campus employment
bull Practices related to fi nancial aid advising
bull Policies related to course dropping and course repeats and use of summer terms
bull Practices related to tutoring and other academic assistance services
IHELP | THE EDUCATION TRUST | ADV ANCING BY DEGREES | APRIL 2010 11
AdvbyDegreesindd 12 552010 22932 PM
In contrast students who earned 105 credits were well
on their way to completion and additional years of data
might reveal that some eventually completed a degree But
experience elsewhere suggests that many may well have
simply disengaged Fortunately many institutions are fi ndshy
ing these students easy to attract back to campusmdashwhen
they are invited back and their reenrollment is expedited
with attentive service Again institutions would be wise to
supplement quantitative findings of this sort with intershy
views and other information to learn what they might do
to speed the progress of these students
However even without additional data we can use
the on-track indicators in our framework to help diagshy
nose why these students failed to move beyond the initial
milestones To illustrate we compared black and Latino
students who did not earn a bachelorrsquos degree with black
and Latino students who did earn a bachelorrsquos degree on
the on-track indicators As Table 2 shows the primary
factors that distinguish students who earned a bachelorrsquos
degree from those who did not were related to credit accushy
mulation particularly completing courses and enrolling
continuously
Interestingly a higher percentage of students who did
not complete a degree took a success course than those
who did complete One likely explanation of this fi nding
is that students are either directed towards success courses
or choose to enroll in success courses if they are at higher
risk for not completing so the fi ndings refl ect enrollment
in the course more than the impact of the course We also
found that completion of gateway coursesmdashcollege-level
math and Englishmdashdid not appear to explain why these
students did not earn a bachelorrsquos degree17 A large majorshy
ity of students who did not earn a bachelorrsquos degree did
complete these courses Consequently this analysis sugshy
gests that the appropriate institutional response would be
to help students complete a higher percentage of courses
and enroll continuously Interventions might include inteshy
grating supplemental instruction into courses with high
failure rates instituting ldquoearly alertrdquo systems to identify
students having trouble in particular courses limiting the
number of course withdrawals and examining the adeshy
quacy of financial aid policies
RECOMMENDATIONS The purpose of this report is to give institutional leaders
a new set of tools for diagnosing institutional barriers to
degree completion and targeting institutional changes to
remove those barriers This section summarizes the data-
collection capacity that institutions need to use these tools
and offers a guide for using findings from analyzing the
data to improve degree completion
Data System Requirements States and institutions must be able to collect basic data
to track student progress across milestones and link that
progress to the academic patterns that indicate success or
lack thereof
Collect data on studentsrsquo course enrollments Course-enrollment data are necessary to analyze the
milestones and on-track indicators discussed in this report
Some higher education systems may only be collecting
information on whether particular students enrolled in
a specified term how many units they completed their
grade-point average or other aggregated information
about their experiences Such data are not suffi cient for
monitoring the progress and behaviors that our framework
comprises Term-by-term information on individual course
enrollments adds a level of detail about studentsrsquo patterns
of enrollment that is very useful for diagnosing where
students are falling off track which in turn points to ways
to target changes to policies and practices
Collect data to analyze important subgroups of students To ensure that all students are making progress towards
completion states and institutions should be able to
disaggregate data as follows
bull Age
bull Raceethnicity
bull Gender
bull Income
bull Academic preparation
(entrance test scores placement exam scores)
Develop data elements to match milestones and on-track indicators Table 1 on page 3 shows a good set of milestones and
on-track indicators that institutions should be able to
monitor Tracking some of the elements might require
some adjustments such as adding an element to fl ag when
IHELP | THE EDUCATION TRUST | ADV ANCING BY DEGREES | APRIL 2010 12
AdvbyDegreesindd 13 552010 22933 PM
Table 2 Analysis of Black and Latino Students Who Completed Intermediate Milestones at SUSF
Black Students Latino Students
Completed 30 credits 15 lower division courses and bachelorrsquos (n=2625)
Completed 30 credits 15 lower division courses but no bachelorrsquos (n=1315)
Completed 30 credits 15 lower division courses and bachelorrsquos (n=2460)
Completed 30 credits 15 lower division courses but no bachelorrsquos (n=751)
Gateway Courses
Completed Gateway Math
915 843 887 879
Completed Gateway English
898 941 896 955
Completed a success course
274 367 470 672
Credit Accumulation
Earned summer credits 961 859 991 911
Credit-completion ratio of gt80
926 530 944 575
Enrolled continuously 813 587 831 513 Not all students who earned a bachelorrsquos degree completed gateway English and math courses because some students earned credit for these courses through other means such as Advanced Placement
tests
a student has completed general education or has transishy
tioned from developmental to college-level coursework
Participation in the National Student Clearinghouse is also
necessary to track student transfers into other institutions
Absent that tracking a dropout cannot be distinguished
from a successful transfer
Collect data on student use of campus services and particishypation in special programs Many institutions implement special programs or services
to help students but they fail to collect student-level data
associated with those programs and services or to integrate
that information with other data Without such data it is
impossible to evaluate the effectiveness of programs and
services in improving student outcomes
Simplifying Data Collection Some of the on-track indicators that we looked at are
similar and may be interchangeable For example fi rst-year
GPA first-year credit-completion ratio and the number
of credits accumulated in the first year are all interrelated
Systems and institutions may want to reduce the number
of on-track indicators they track by eliminating those that
do not appreciably improve the statistical prediction of
completion18
For example our analysis of the data from Florida
indicated that the number of credits students earn in the
first year is an adequate predictor of completion without
adding first-year GPA and first-year credit-completion ratio
Furthermore we found that two of the fi rst-year indicashy
torsmdashcredits accumulated in the first year and completion
of college-level mathmdashpredicted completion about as well
as using all of the on-track indicators that we identifi ed
from the research literature
It is important to keep in mind while conducting this
type of analysis that results may differ from state to state
and from year to year within a state Therefore we believe
it is best to monitor more than this minimal set of on-
track indicators if institutional resources and data systems
permit such an approach19
Use Data to Target Institutional Changes Table 3 on the next page lists some specific actions institushy
tions may consider in response to findings that emerge
from their data monitoring and analysis
IHELP | THE EDUCATION TRUST | ADV ANCING BY DEGREES | APRIL 2010 13
AdvbyDegreesindd 14 552010 22933 PM
Table 3 Using Indicators of Success to Make Changes in Institutional Policies and Practices
Problem Identified Possible Changes to Policy or Practice
Remediation
Low percentage of developmental educashytion students complete remediation
bull Ensure that policies support innovative practices such as intensive summer-orientation programs for new remedial students
bull Contextualize basic-skills instruction into content courses bull Implement learning communities for developmental students bull Adopt systemwide definitions of college readiness bull Incorporate incentives for institutions to increase success in remedial coursework bull Redesign developmental courses into modules so students only repeat needed sections bull Require early completion of remedial coursework bull Provide brief brush-up courses for students who test near proficiency levels bull Enroll students in college-level courses provide supplementary instruction andor sumshy
mer sessions for nearly proficient students
Gateway courses
Low percentage of students complete bull Better align curriculum and assessment with high schools to improve college readiness college-level math course in their first year bull Require entering students to take first credit-bearing math and English courses imshy
mediately (after completing any required developmental courses)mdashor at least ensure that early advising stresses the importance of taking a math course early in the college career
Low percentage of students complete a ldquosuccessrdquo course in the first year (among part-time and older students)
bull Ensure adequate course offerings and flexible scheduling bull Better advising for new students about the advantages of such courses bull Require degree-seeking nontraditional students to enroll in a success course
Credit accumulation
Low percentage of first-year students reach a threshold of credit accumulation in their fi rst year (20-30 semester credits)
High percentage of course enrollments for which students registered late (after a course begins or within less than some number of days before a term starts)
bull Increase use of college success courses early advising and similar programs bull Improve financial aid counseling to emphasize benefits of full-time enrollment bull Charge lower per-credit fees for enrolling with a full-time credit load bull Encourage full-time attendance by providing financial aid and other incentives bull Provide financial aid for enrollment in summer terms bull For four-year students facilitate summer enrollment in community college ldquoback homerdquo bull Offer online summer courses bull Require enrollment in at least one summer term
Low credit-completion ratio in first year bull Use ldquoearly alertrdquo systems and improved tutoring services to provide more academic assistance
bull Limit course drops and repeats or impose extra fee for course withdrawal past a certain date or for repeating a course
bull Limit late registration or impose an extra fee for registering late bull Use success courses to teach students effective enrollment patterns
IHELP | THE EDUCATION TRUST | ADV ANCING BY DEGREES | APRIL 2010 14
AdvbyDegreesindd 15 552010 22933 PM
APPENDIX Table A-1 Milestone Achievement by Indicator Attainment for the CCC Cohort
Earned 12+ Earned 30+ college- college- Completed Earned
Retention Retention level level transfer Earned associate Any to second to second credits credits curriculum certifi cate degree Transferred completion
SUCCESS INDICATORS term (74) year (58) (62) (42) (17) (33) (8) (23) (29)
College-Level Math
Completed Within Two 928 867 959 834 504 32 206 531 611 Years (21)
Did Not Complete Within 701 522 554 333 99 34 53 169 220 Two Years (79)
College-Level English
Completed Within Two 914 840 924 761 379 35 170 437 512 Years (28)
Did Not Complete Within 682 495 523 304 97 33 49 162 212 Two Years (72)
Success Course
Completed (22) 837 726 766 586 261 34 118 269 345
Did Not Complete (78) 712 538 581 369 140 33 68 214 268
First-Year Credits
Earned 20+ Credits (any) 993 890 977 865 442 62 206 464 579 (24)
Did Not Earn 20 Credits 660 483 511 277 81 24 39 157 194 (any) (76)
Summer Credits
Completed Any (46) 845 754 859 676 307 49 139 365 450
Did Not Complete Any (54) 649 431 419 196 47 20 28 108 145
First-Year Credit-Completion Ratio
Completion Ratio gt80 805 666 738 520 219 45 109 278 387 (62)
Completion Ratio lt 80 634 441 433 251 82 15 30 152 146 (38)
Full-Time Attendance
Full Time in First Term (41) 816 692 783 591 273 38 123 318 389
Part Time in First Term (59) 686 503 510 297 93 30 48 169 214
On-Time Course Registration
On Time for gt80 751 603 653 463 200 38 99 261 324 of Courses (53)
On Time for lt 80 726 554 588 366 130 28 56 196 243 of Courses (47)
Continuous Enrollment
Continuously Enrolled (40) 1000 688 682 487 233 39 121 291 360
Not Continuously Enrolled 773 675 738 491 171 37 73 229 289 (60)
IHELP | THE EDUCATION TRUST | ADV ANCING BY DEGREES | APRIL 2010 15
AdvbyDegreesindd 16 552010 22933 PM
Table A-2 Milestone Achievement by Indicator Attainment for the SUSF Cohort
Completed 15 lower Completed Retention to second Retention to second Earned 30+ credits division courses baccalaureate
SUCCESS INDICATORS term (94) year (83) (85) (70) (64)
College-Level Math
Completed in First Year (58) 980 919 949 813 797
Did Not Complete in First Year (42) 878 713 709 553 416
College-Level English
Completed in First Year (84) 969 881 903 764 703
Did Not Complete in First Year (16) 782 596 582 412 318
Success Course
Completed in First Year (19) 950 845 858 749 547
Did Not Complete in First Year (81) 933 828 845 692 656
First-Year Credits
Earned 24+ Credits (64) 1000 949 977 862 782
Did Not Earn 24 Credits (36) 825 625 621 430 377
First-Year and Second-Year Credits
At Least 48 Credits (57) 999 999 1000 925 858
Less Than 48 Credits (43) 854 613 649 419 345
Summer Credits
Completed Any (83) 969 910 949 811 746
Did Not Complete Any (18) 781 462 362 191 116
First-Year Credit-Completion Ratio
Completion Ratio gt80 (72) 971 918 946 824 745
Completion Ratio lt 80 (28) 845 604 592 396 348
Full-Time Attendance
Full Time in First Term (92) 946 844 864 724 656
Part Time in First Term (8) 822 684 663 501 406
Continuous Enrollment
Continuously Enrolled (77) 1000 908 878 763 710
Not Continuously Enrolled (23) 894 729 898 628 505
IHELP | THE EDUCATION TRUST | ADV ANCING BY DEGREES | APRIL 2010 16
- - - -
- - - -
AdvbyDegreesindd 17 552010 22933 PM
REGRESSION RESULTS Using data for the CCC and SUSF systems we ran two dentsrsquo full enrollment period Dummy variables were used
logistic regression models for all students and for each of in all models to control for institutional effects For simshy
several subgroups for each cohort Each model included plicity we have included tables summarizing the fi ndings
demographic variables and the first model added fi rst-year that use a ldquo+rdquo to indicate a statistically signifi cant positive
success indicators the second model included indicators relationship and a ldquo-ldquo to indicate a statistically signifi cant
from the second year as well as indicators based on the stu- negative relationship with completion
Table A-3 Regression Models on the Likelihood of Completing a CertificateDegreeTransfer | CCC Cohort
Full-Time Part-Time All Degree Traditional Traditional Full-Time Part-Time Seekers Age Age Older Older White Asian Black Latino
First-Year Indicator Models
Demographic and Attendance Characteristics
Female + + + + + + + + +
Age 25+ shy
Asian + - + ns ns
Black ns ns - + shy
Hispanic - - - - shy
OtherUnknown RaceEthnicity ns ns ns ns ns
Ever Received BOG Waiver + + + ns + + + ns +
Full-Time (based on first term) + + + + +
Year 1 Credits Earned + + + + + + + + +
Success Indicators
First-Year GPA + + + + + + + + +
Complete Success Course + ns + + + + ns - +
First-Year Credit-Completion Ratio + + + + + + + + +
Completed College-Level Math in Year 1 + + + + + + + + +
Completed College-Level English in Year 1 + + + + + + + + +
Second-Year and Beyond Indicator Models
Demographic and Attendance Characteristics
Female + + + + ns + + + +
Age 25+ shy
Asian - - ns ns shy
Black ns ns ns - +
Hispanic - - - - shy
OtherUnknown RaceEthnicity ns ns ns ns ns
Ever Received BOG Waiver + ns + - + ns + - ns
Full Time (based on first term) + + + + +
Year 2 Credits Earned + + + + + + + + +
Success Indicators
Second-Year GPA + + + + + + + + +
Completed Success Course + + + + + + + + +
Percentage of Courses Registered Late - - - - - - - - shy
Summer Credits (yesno) + + + + + + + + +
Continuous Enrollment + + + ns ns + ns + +
+ Indicates a statistically significant (05 level or better) positive correlation between the indicator and the likelihood of completion - Indicates a statistically significant (05 level or better) negative correlation between the indicator and the likelihood of completion ns Indicates no statistically significant relationship | Shaded cells are not applicable to the student group
IHELP | THE EDUCATION TRUST | ADV ANCING BY DEGREES | APRIL 2010 17
AdvbyDegreesindd 18 552010 22934 PM
Table A-4 Regression Models on the Likelihood of Bachelorrsquos Degree Completion | SUSF Cohort
Need-Based Aid RaceEthnicity Need- No Need-
All Students Based Aid Based Aid White Black Latino Asian First-Year Indicator Models Demographic and Attendance Characteristics Female + + + Age - ns -Asian ns - ns Black - - -Hispanic ns ns ns OtherUnknown RaceEthnicity - ns -Ever Received Pell + HS GPA + + + SAT Score - - -Credit Hours at Entry + + + Success Indicators Full Time (based on first term) ns Year 1 Credits Earned + First-Year GPA + Completed CollegeCareer Success Course ns First-Year Credit-Completion Ratio ns Completed College-Level Math in Year 1 + Completed College-Level English in Year 1 ns
Year 2 Credits Earned + Second-Year GPA + Second-Year Credit-Completion Ratio + Summer Credits (yesno) + Continuous Enrollment +
ns ns + + + + ns ns ns ns + + ns ns
+ + + + + + + + + +
+ + + + - ns - ns
ns ns ns ns + + ns ns - - ns ns + + + +
ns ns ns ns + + + + + + + + ns ns ns ns ns + ns + ns + + ns ns ns ns ns
ns + + ns - ns ns ns
ns ns ns shy+ + ns ns - - ns ns + ns + +
+ + + + + + + + + + + + + + + + + + + ns
Second-Year and Beyond Indicator Models Demographic and Attendance Characteristics Female + + + Age - ns -Asian - - ns Black - - -Hispanic ns ns ns OtherUnknown RaceEthnicity ns ns ns Ever Received Need-Based Aid ns HS GPA + + + SAT Score - - -Credit Hours at Entry + + + Success Indicators
+ Indicates a statistically significant (05 level or better) positive correlation between the indicator and the likelihood of completion - Indicates a statistically significant (05 level or better) negative correlation between the indicator and the likelihood of completion ns Indicates no statistically significant relationship | Shaded cells are not applicable to the student group
Note Some of the first-year indicators were not statistically significant However this was because of the strong relationships between the indicashytors and the comparatively smaller sample (the CCC cohort was more than eight times as large) When separate models were run for each indicashytor and the demographic and attendance characteristics all of the first-year indicators were significant positively related to completion
IHELP | THE EDUCATION TRUST | ADV ANCING BY DEGREES | APRIL 2010 18
AdvbyDegreesindd 19 552010 22934 PM
ANALYSES TO SIMPLIFY DATA COLLECTION WHILE PREDICTING SUCCESS In order to choose a subset of predictors we compared
several models using the first-year predictors from the
Florida data in terms of practical and statistical signifi shy
cance Specifically we compared models in terms of statisshy
tical significance on the basis of the change in the likelishy
hood-ratio statistic and compared the practical signifi cance
of the models using an approximation of the R2 statistic in
linear regression the correlation between the observed
outcome and the predicted probability of the outcome20
We also examined the statistical significance of the indishy
vidual predictors in the model using the Wald statistic and
the practical significance by looking at the size of the odds
ratio associated with the predictor
We found that each predictor or set of predictors we
added to the model resulted in a statistically signifi cant
improvement in the fit of the model However we found
that one or two predictors were about as useful in predictshy
ing completion as including additional predictors Table
A-5 shows the summary statistics for three of the models
we examined As shown the model that only included
Year 1 credits earned as a predictor was nearly as useful for
predicting completion as a model that included all of the
first-year predictors Although adding completion of math
in the first year did not lead to a dramatic improvement
in the ability of the model to predict completion the size
of the odds ratio suggests that it is practically signifi cant
Therefore the data from this cohort of students in Floridarsquos
four-year system suggest that tracking only fi rst-year credits
earned or tracking first-year credits earned and completion
of math in the first year would be nearly as useful as trackshy
ing all four predictors We found similar results with the
data from the California Community Colleges
Table A-5 Comparison of Three First-Year Predictor Models on Summary Measures of Model Fit
Squared Correlation Between VARIABLES INCLUDED IN MODEL Predicted and Observed df -2 LL
Florida
Background Characteristics + Year 1 Credits Earned 0278 20 2980117
Background Characteristics + All 0304 23 2894586 Year 1 Credit-Accumulation Predictors
Background Characteristics + Year 1 Credits Earned + Completed College-Level Math in Year 1
0282 21 2966201
Background Characteristics + All 0306 26 2887379 Year 1 Predictors
California
Background Characteristics + Year 1 Credits Earned 0180 124 21625726
Background Characteristics + All Year 1 Credit-Accumulation Predictors
0201 127 21188628
Background Characteristics + Year 1 Credits Earned + 0192 125 21392214 Completed College-Level Math in Year 1
Background Characteristics + All Year 1 Predictors
0218 130 20843276
IHELP | THE EDUCATION TRUST | ADV ANCING BY DEGREES | APRIL 2010 19
AdvbyDegreesindd 20 552010 22934 PM
NOTES 1 For a literature review titled ldquoStudent Progress Toward Degree English by Year 1rdquo it would seriously understate the importance
Completion Lessons From the Research Literaturerdquo visit wwwcsus of that indicator in predicting degree completion since these eduihepublications students did earn college-level credits Instead we have counted
2 Horn L amp Lew S (2007) ldquoCalifornia Community College Transshyfer Rates Who is Counted Makes a Differencerdquo Berkeley Calif MPR Associates Inc
those students in the ldquoyesrdquo group (completing CL mathEnglish by end of Year 1) Unfortunately we cannot identify those students who entered with those prior college credits but who did not graduate Such students are unavoidably counted as not having
3 For example see Marcotte DE (2006) ldquoThe Earnings Effect of completed college-level Englishmath by Year 1 because we have Education at Community Collegesrdquo Baltimore University of no way to identify them and move them to the ldquoyesrdquo column Maryland Since the overall Florida graduation rate is 64 percent we believe it
4 We recognize that transferring to a university is not really ldquocompletionrdquogiven that the goal of those students is a bachelorrsquos degree and many students do not complete an associate degree before transferring (81 percent of transfers in the CCC cohort did not earn an associate degree) However transfer is commonly used as a completion measure for community colleges We were not able to track student outcomes after transfer but we recognize that a substantial number of students who transfer to universities do
is safe to assume that the rate is far higher for students who enter the university having completed college-level English andor math Therefore the number of students miscategorized as ldquonordquo should be relatively small (since it is limited to those who came in with college credit but did not graduate in eight years) This unavoidshyable error does overstate the positive impact of taking mathEngshylish by the first year on graduation rates but we are convinced that it is an important indicator of success since before making this
not ultimately earn a baccalaureate adjustment completion of college-level math and college-level English were statistically significant predictors of completion
5 For example see Adelman C (2005) ldquoMoving Into Town and Moving On The Community College In The Lives of Traditional-Aged Studentsrdquo Washington DC US Department of Education Achieving the Dream Cross-State Data Work Group (2008) Test drive Six states pilot better ways to measure and compare comshymunity college performance Boston Jobs for the Future
10 It could be the case that success courses in the CCC are aimed at students with more risk factors complicating the relationship of taking a success course and completion Also the CCC does not have a code to identify success courses so we relied on a combinashytion of Taxonomy of Program (TOP ) code and course title We could have misclassified some courses affecting the results Better
6 The University of California (UC ) and California State University data are needed to accurately identify these courses (CSU) generally require students to finish all transfer requireshyments at the CCC before moving on to one of their campuses Some lower division transfers are accepted at UC CSU campuses that have enrollment space available but lower division transfer students must have completed the 15-course college-preparatory curriculum required for freshman admission (known as A-G) while in high school or must have made up the defi ciencies while attending a CCC Some campuses impose other requirements on lower division transfers and some take no lower division transfers at all
11 We broke these results down by university because for this indicashytor aggregating across universities misrepresented the relationship Specifically aggregating the data across institutions resulted in a higher rate of degree completion for students who did not take a success course than for students who did take a success course This reversal of the relationship occurred because very few students completed a success course at two of the largest universities and these universities had relatively high graduation rates The effect of this was to inflate the overall number of students who did not take a success course and graduated Furthermore the small
7 There is little remediation done in the SUSF Florida students who number of students at some universities can lead to some unlikely require developmental courses are generally referred to commushy findings such as the 100 percent completion rate for students takshynity colleges for those courses and no records of course enrollshy ing a success course in University 5 The perfect completion rate ments or outcomes are included in the SUSF data The CCC data occurred because only two students who first attended University do not include any information on assessment tests or placement 5 completed a success course in their first year and both happened recommendations in order to identify students who need remediashy to complete tion The CCC data do include information on remedial course enrollments but course enrollment does not serve as a valid proxy for ldquoneedrdquo for remediation Many students who need remediation fail to enroll in developmental courses and are therefore misclassishyfied as college ready The result is an overestimate of the success of ldquoremedialrdquo students and an underestimate of the success of ldquocolshy
12 The different credit thresholds reflect the different students served by these types of institutions (that is community colleges have a larger percentage of part-time students than is typically found in four-year institutions and more students who are not college-ready and require remediation)
lege readyrdquo students This problem has also been noted by other 13 On average SUSF students who did not earn any summer credits researchers using data from other state community college systems were enrolled for less than four terms (fallspring) while students (Achieving the Dream Cross-State Data Work Group 2008) who did earn summer credits were enrolled for an average of more
8 Adelman C ldquoProposed Amendment for the Student Right-Toshy than eight terms
Know and Campus Security Act of 1990rdquo (PL 101-542) to produce 14 Adelman C (2006) ldquoThe Toolbox Revisited Paths To Degree a full and honest account of college completion rates Obtained Completion From High School Through Collegerdquo Washington through personal communication on June 2 2008 DC National Center for Education Statistics
9 Students in Floridarsquos public universities must earn college-level 15 A smaller sample size for Asians (5 percent of the sample was credits in English and math in order to earn a bachelorrsquos degree Asian) limited the ability to detect the relationship and could but they can earn those credits while in high school (for example explain the lack of relationship between continuous enrollment Advanced Placement exams) In this cohort there were several and completion for Asian students thousand students who earned a bachelors degree but never enrolled in college-level math or English at the university If we counted those students as ldquonot completing college-level math
16 Some courses in the CCC are offered on a compressed schedule and may start sometime after the beginning of the term Unforshytunately there is no indication in the data for ldquolate startrdquo courses
IHELP | THE EDUCATION TRUST | ADVANCING BY DEGREES | APRIL 2010 20
AdvbyDegreesindd 21 552010 22934 PM
With input from internal CCC researchers rules were developed for identifying circumstances where registrations that occurred more than a certain number of days into the term were probably an indication of ldquolate startrdquo courses These were excluded from the analyses Data were not available to measure late course regisshytration for the SUSF cohort Other research has found that late registrants have higher course-withdrawal rates which would affect credit accumulation (Freer-Weiss D [2004] ldquoCommunity College Freshmen Last In First Out Journal of College Student Retentionrdquo 6[2] 137-154)
17 We modified the gateway-course completion indicators to cover the entire period of enrollment instead of just the first year We were interested in finding out whether failure to complete these courses at any time during their college careers was preventing students from earning a bachelorrsquos degree
18 This can be done by examining measures of practical and statistishycal significance of individual predictors and the overall model See the appendix for details on this analysis
19 An additional concern is that fitting multiple regression models to the data in order to reduce the number of predictors of success runs the risk of choosing a subset of predictors based on some random aspect of the sample cohort
20 See Hosmer D W and Lemeshow S (2000) ldquoApplied Logisshytic Regressionrdquo 2nd ed New York John Wiley amp Sons Inc for a discussion of summary measures that approximate variance explained
IHELP | THE EDUCATION TRUST | ADVANCING BY DEGREES | APRIL 2010 21
AdvbyDegreesindd 22 552010 22934 PM
22 IHELP | THE EDUCATION TRUST | ADVANCING BY DEGREES | APRIL 2010
AdvbyDegreesindd c4 552010 22843 PM
ABOUT THE INSTITUTE FOR HIGHER EDUCATION LEADERSHIP amp POLICY
The Institute for Higher Education Leadership amp Policy seeks to enhance
leadership and policy for higher education in California and the nation by
producing research and services for policymakers practitioners and educators
ABOUT THE EDUCATION TRUST
The Education Trust promotes high academic achievement for all students
at all levelsmdashpre-kindergarten through college We work alongside parents
educators and community and business leaders across the country in
transforming schools and colleges into institutions that serve all students
well Lessons learned in these efforts together with unflinching data analyses
shape our state and national policy agendas Our goal is to close the gaps
in opportunity and achievement that consign far too many young peoplemdash
especially those who are black Latino American Indian or from low-income
familiesmdashto lives on the margins of the American mainstream
IHELP and The Education Trust are grateful to the Bill amp Melinda Gates
Foundation and Lumina Foundation for Education for their generous
support The views expressed in this report do not necessarily represent
those of either organization its officers or its employees
6000 J STREET SACRAMENTO CALIF 95819 1250 H STREET NW SUITE 700 WASHINGTON D C 20005
T 916278-3888 F 916278-3907 WWWCSUSEDUIHELP T 202293-1217 F 202293-2605 WWWEDTRUST ORG
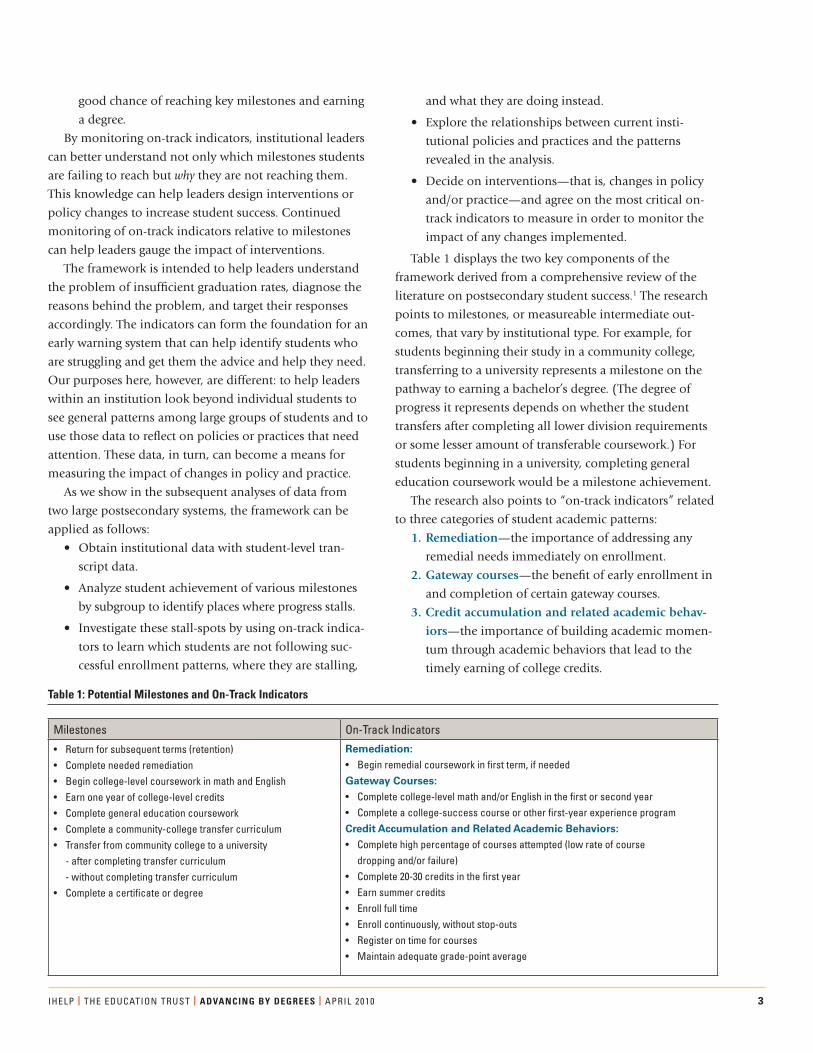

769
533
430
AdvbyDegreesindd 5 552010 22928 PM
students were about as likely as white students to persist to Figure 2 Milestone Achievement Among Degree Seekers by Agethe second term and the second year (not shown) but they and Enrollment Status in the CCC Cohort (within seven years)
were less likely to reach the other milestones
Black transfer students were far less likely to have com- 100
805
671
559
430
623
30
126
353
414
427
90
11
1
130
257
21 4
9 222
25
4
50
48 8
014
835
2
206
12+ College Credits 30+ College Credits Certificate Assoc Degree Transferred Any Completion
pleted a transfer curriculum Indeed 70 percent of black
Perc
enta
ge A
chie
ving
Mile
ston
e
80
60
40
20
transfer students moved to a university without having
completed such a curriculum (not shown) Related to this
lower likelihood of completing a transfer curriculum black
students were considerably less likely to transfer to one
of Californiarsquos public universities with only 44 percent of
black student transfers moving on to one of these institushy
tions compared with 68 percent of all students6
Figure 4 shows the percentage of degree seekers com- 0 Traditional Age Older Traditional Age Older
pleting a certificate or degree or transferring to a university (17-24) (25+) (17-24) (25+)
Full-Time Part-Time by year The largest numbers of completions occurred in
the third and fourth years
Figure 3 Milestone Achievement Among Degree Seekers in theMilestone Achievement in the CCC Cohort by RaceEthnicityState University System of Florida
As expected levels of milestone achievement were higher 100
for students initially enrolling in a four-year institution
683
76
9
533
64
0
444
36 8
826
6 32
4
527
37
100
302
374
30 5
0 177
21
7
34 6
7
159
209
289
360
12+ College Credits 30+ College Credits Certificate Assoc Degree Transferred Any Completion
(see Figure 5) Among the cohort of first-time freshmen in
the SUSF
bull By the second semester 94 percent were still enrolled
bull More than eight in ten students were retained to the
second year nearly 85 percent completed at least one
year of college credits
bull Some 70 percent completed at least 15 lower divishy
sion courses intended as a measure of completing a
Perc
enta
ge A
chie
ving
Mile
ston
e
80
60
40
20
0general education curriculum White Asian Black LatinoHispanic
bull Nearly 64 percent completed a bachelorrsquos degree
Interestingly there were marked variations in these
patterns by race Black and Latino students were about
as likely to complete 30 credits or a general education Figure 4 Percentage of Degree Seekers Completing a Certificate Degree or Transfer in the CCC Cohort by Year curriculum but the likelihood of degree completion was
lower especially for black students Among white students
for example almost all of the students who completed
15 lower division courses also completed a bachelorrsquos
degree (686 percent versus 677 percent) Black and Latino
students completed 15 lower division courses at rates
slightly higher than those of white students but their rates
of degree acquisition were significantly lowermdash54 percent
and 61 percent respectively (see Figure 6)
Figure 7 shows the percentage of SUSF students com-
Perc
enta
ge C
ompl
etin
g C
ertif
icat
e D
egre
e o
r Tra
nsfe
r
10
8
6
4
Year 1 Year 2 Year 3 Year 4 Year 5 Year 6 Year 7
03
01
22
42
07 07
08 2
1
53
42
07 2
1
05
14
03
09
29
03 0
7 212
4
Certificate Assoc Degree Transferred
2
pleting a bachelorrsquos degree by year While the largest numshy
ber of completions occurred in year four only 32 percent 0
of students had received a degree by that year half the
IHELP | THE EDUCATION TRUST | ADV ANCING BY DEGREES | APRIL 2010 5
769
430
AdvbyDegreesindd 6 552010 22929 PM
number who would eventually finish within the eight-year Figure 5 Milestone Achievement in the SUSF Cohort (within eighttracking period years)
We now turn to the relationship of on-track indicators
in Table 1 to the likelihood of completion (of a bachelorrsquos 100
degree in the SUSF and of a certifi cateassociate degree 936
831 845
701 635
Perc
enta
ge A
chie
ving
Mile
ston
e 80
60
40
20
transfer in the CCC) Data limitations in each of the systems
preclude analysis of some of the on-track indicators particshy
ularly those related to remediation7 Nevertheless what we
learned provides some helpful clues about success patterns
When we began our examination of system data we
knew from previous research that certain things seemed
to matter in student success But we didnrsquot know exactly
how they would play out in these very different systems or
whether there would be similarities across the systems An
overview of what we learned follows
ON-TRACK INDICATORS WHAT DID WE LEARN ABOUT GATEWAY COURSES Taking college-level math and English early Students in both the CCC and the SUSF cohorts were
more likely to ldquocompleterdquomdashin the CCC that means earn
0 Retained Retained 30+ College 15 Lower Bachelorrsquos 2nd Term 2nd Year Credits Division Courses Degree
Figure 6 Milestone Achievement in the SUSF Cohort by Race Ethnicity
100
80
White Asian Black LatinoHispanic
871844 838 853
722
613
686 677
755
669 729
515
Perc
enta
ge A
chie
ving
Mile
ston
e
a degree a certificate or transfer and in the SUSF it means
earn a bachelorrsquos degreemdashif they completed college-level
math and English early in their enrollment with a grade of
C or better (see Figure 8)
CCC students who completed a college-level math
60
40
20 course within two years of initial enrollment were nearly
three times as likely to complete as students who did not
complete college-level math in that time period Similarly
four-fifths of SUSF students who completed a college-level
math course in their first year earned a bachelorrsquos degree
compared with fewer than half of students who did not
complete a college-level math course in their fi rst year9
Taking ldquosuccessrdquo courses Many colleges offer courses designed to help students
achieve in college and in their careers We call these ldquosuccessrdquo
courses Completing a success course appears to help many
0
Completed 30+ College Credits Bachelorrsquos Degree Completed 15 Lower Division Courses
Figure 7 Percentage of Students Receiving a Bachelorrsquos Degree by Year in the SUSF Cohort
100
0 0 3
29
21
7 3 1
Year 1 Year 2 Year 3 Year 4 Year 5 Year 6 Year 7 Year 7
Perc
enta
ge C
ompl
etin
g B
ache
lorrsquos
Deg
ree
80
60
40
students earn a degree or certificate or to transfer
Our analysis suggests however that it is important
to look underneath these overall averages For example
older students and traditional-age part-time students who
completed a success course had higher completion rates in
the CCC (see Figure 9) Interestingly black students in the 20
CCC who completed a success course were less likely to
complete than black students who did not And for Asian 0
students completing a success course was unrelated to
completion10
IHELP | THE EDUCATION TRUST | ADV ANCING BY DEGREES | APRIL 2010 6
AdvbyDegreesindd 7 552010 22930 PM
DATA AND METHODS Data Source 1 California Community Colleges Chancellorrsquos Office
The student-unit records (SUR) data include demographic information courses taken degreescertificates earned and transfers to four-year universities based on matches to the statersquos public universities and to the National Student Clearingshyhouse We analyzed data for the entering cohort of first-time California Community College students who enrolled in one or more credit-bearing courses during the 2000-01 academic year Noncredit students and high school students concurrently enrolled in community college were excluded We tracked the students over a seven-year period through 2006-07 Data limitations include lack of information on the following student income or other measures of socioeconomic status and assessment-test scores placement recommendations or other indicators of academic preparation for college-level study
The analyses focus on a subset of students identified as ldquodegree seekersrdquo (a term that includes both degrees and certificates) based on their having enrolled in more than six units during the first year This definition is based on a recent suggestion by Clifford Adelman as part of national discussions about revising the federal methodology for calculating gradushyation rates8 Using Adelmanrsquos suggested criterion 63 percent of students in the cohort were identified as degree seekers (N=247493) These students were somewhat younger with an average age of 24 compared with 26 for the entire cohort of students Fifty-three percent of degree seekers were younger
In Florida differences surfaced among campuses In
nine of the ten universities first attended by SUSF students
students who completed a success course were more likely
to earn a bachelorrsquos degree than students who did not
complete a success course (see Figure 10)11
ON-TRACK INDICATORS WHAT DID WE LEARN ABOUT CREDIT ACCUMULATION
Accumulating first-year and second-year credits Choosing on-track indicators for credits earned involves
several considerations
bull whether to track only college-level credits or to track
all credits (including developmentalremedial)
bull whether to track only first-year credits or to track
credits in subsequent years
bull whether to track credits for all students or sepashy
rately for full-time and part-time students (note that
students often change their attendance status across
terms) and
than 20 and 10 percent were age 40 or older compared with 45 percent and 17 percent respectively for the entire cohort The gender and racialethnic distributions were about the same
Data Source 2 Florida Board of Governors The SUR data include demographic information course-taking records and records of degrees earned We analyzed data for the entering cohort of all first-time freshmen in all ten universities in the State University System of Florida in the 1999-2000 academic year We tracked the students over eight years through 2006-07 Limitations of the data include a lack of information on student income and on credits earned through Advanced Placement exams concurrent enrollment or high admission-test scores All students in the cohort were included in the analyses as it was assumed that all students enrolled intending to pursue a bachelorrsquos degree (N=30497)
Methods We calculated the percentage of students who reached milestones and the rates of milestone achievement for different groups of students To gauge the probability of degree compleshytion we examined whether students met the on-track indicashytors We used regression analysis to test whether the on-track indicators predicted completion after controlling for other factors and whether the relationships held across all groups of students (such as racialethnic groups age groups and students who received need-based aid) More details about the statistical analyses are described in the appendix
bull the appropriate threshold of accumulated credits
Our research did not find a threshold number that was
associated with a substantial jump in the completion rate
Rather in both the CCC and the SUSF cohorts we found
a fairly linear relationship between the number of credits
a student earned and the probability of completion The
more credits earned in the first year the higher the chance
of completing (see Figure 11)
That said the impact of early credit accumulation was
clear in both systems We set the threshold at 20 credits (of
any kind) in the first year for the CCC cohort and 24 credshy
its in the first year and 48 credits through the second year
for the SUSF cohort12 Fifty-eight percent of CCC students
who earned at least 20 credits in the first year completedmdash
three times as many as those who did not earn 20 credits
in the first year (see Figure 12) We found a similar pattern
for SUSF students Three-quarters of students who comshy
pleted at least 24 credits in the first year earned a bachelorrsquos
degree compared with 38 percent of students who did not
meet that threshold
IHELP | THE EDUCATION TRUST | ADV ANCING BY DEGREES | APRIL 2010 7
AdvbyDegreesindd 8 552010 22930 PM
Completing summer creditsFigure 8 Probability of Completion Based on Early Completion of
In both the Florida and California systems students who College-Level Math and English earned summer credits completed at a higher rate (see Fig-
Completed college- Completed college- Completed college- Completed college-
Perc
enta
ge C
ompl
etin
g
0
20
40
611
220
512
212
797
416
703
318
60
80
100 Completed Course Did Not Complete Course
ure 13) The difference in the rate of earning a bachelorrsquos
degree between SUSF students who earned summer credits
and those who did not was particularly large (75 percent
versus 12 percent)
However before acting on this information it may
be important to understand what it means and what it
doesnrsquot The strong relationship between earning summer
credits and completion may not mean that it is summer
attendance per se that helps students complete their
level math level English level math by level English by in two years in two years end of Year 1 end of Year 1
CCC Cohort SUSF
Figure 9 Probability of Completion at CCC Based on Finishing a Success Course by Attendance Status and Age Group
100
degrees Students who attend regularly and persist over a
number of years are likely as well to take summer classes13
Therefore summer attendance is in part an indicator that
students are being retained and taking a continuous proshy
gression of courses However summer terms also provide
students with an opportunity to build and sustain progress
by earning additional credits and retaking courses not
completed during other terms14
80
346
269
423 410
307 243
288 245
211 141
Completed Course Did Not Complete Course
Completing most courses attempted To accumulate credits and build momentum toward
60 completion students need to complete their courses
Perc
enta
ge C
ompl
etin
g C
ertif
icat
e
Deg
ree
or T
rans
fer
We calculated credit-completion ratios as the number of 40
credits earned divided by the number of credits attempted
so that either failing or withdrawing from a course led to 20
0 All Students Traditional Older Traditional Older
Age Age
Full Time Part Time
noncompletion of credits We found that rates of earning
a degree attaining a certificate or transferring were 24 and
40 percentage points higher in the CCC and the SUSF sysshy
tems respectively for students who completed at least 80
percent of the credits they enrolled in during the fi rst year
compared with those who completed a smaller percentage
of first-year credits (see Figure 14)
Figure 10 Probability of Bachelorrsquos Degree Completion at SUSF Based on Finishing a Success Course by First University Attended
442
434
509
480
500
467
67
4
650
667
599
589
519
479
514
931
821
549
321
100
735
Perc
enta
ge C
ompl
etin
g B
ache
lorrsquos
Deg
ree
Completed Course Did Not Complete Course
0
20
40
60
80
100
University 1 University 2 University 3 University 4 University 5 University 6 University 7 University 8 University 9 University 10
IHELP | THE EDUCATION TRUST | ADV ANCING BY DEGREES | APRIL 2010 8
AdvbyDegreesindd 9 552010 22930 PM
Enrolling continuously and full-time Figure 11 Probability of Completion by First-Year Credits Earned
Obviously students who attend full time and enroll
continuously can accumulate credits faster than students 100
0-3 gt3-6 gt6ndash9 gt9ndash12 gt12ndash15 gt15ndash18 gt18ndash21 gt21ndash24 gt24ndash27 gt27ndash30 gt30
SUSF CCCwho enroll part time and stop out What may be surprisshy
80ing is how big those differences are In the CCC students
who enrolled full time in their first term were almost twice
as likely to complete as students who enrolled part time
(see Figure 15) Continuously enrolled CCC students had
Perc
enta
ge C
ompl
etin
g
60
40 a completion rate that was seven percentage points higher
than students who stopped out Both factors were associshy
ated with higher rates of earning a bachelorrsquos degree in the
SUSF although far fewer students enroll part time or stop
out in that system
Once again there are some differences underneath
these averages In the CCC for example continuous
enrollment did not correlate with completion for students
25 and older Similarly continuous enrollment did not
predict completion for Asian students in either system15 In
the CCC late registration for courses affected the probabilshy
20
0
First-Year Credits Earned
Figure 12 Probability of Completion Based on Early Accumulation of Credits
100ity of completion The likelihood of completion declined
as the share of courses a student enrolled in late increased
(ldquoLate registrationrdquo was defined as enrolling in a course
after the start date of the term16) Students who registered
late for no more than one in five of their courses had a
completion rate of 32 percent compared with 24 percent
for students who registered late more often Late registrashy
579
194
782
377
858
345
Met Credit Threshold Did Not Meet Credit Threshold
Perc
enta
ge C
ompl
etin
g 80
60
40
tion affected completion for all student groups nearly half 20
(47 percent) of all CCC students registered late for at least
one in five of their courses 0 Earned 20+ Credits Earned 24+ Credits Earned 48+ Credits
in Year 1 in Year 1 Through Year 2
SUSF CohortCCC CohortUSING MILESTONES AND ON-TRACK INDICATORS TO INCREASE DEGREE COMPLETION How can our two postsecondary systems use the frameshy
work of milestones and on-track indicators to identify Figure 13 Probability of Completion Based on Earning Summer problems and design institutional interventions to boost Credits degree completion As they flag problems and plan intershy
100ventions systems like these can take the following steps
1 Collect data on student progress along the milestones
CCC Cohort SUSF Cohort
450
145
746
116
Earned Summer Credit Did Not Earn Summer Credit
80 to degree completion
2 Note at what milestone points student progress is
stalling
3 Analyze on-track indicators to understand what
successful patterns are not being followed leaving Perc
enta
ge C
ompl
etin
g
60
40
students off track for a degree 20
4 Intervene through changes in policy or practice that
address the problem and increase student success 0
IHELP | THE EDUCATION TRUST | ADV ANCING BY DEGREES | APRIL 2010 9
AdvbyDegreesindd 10 552010 22931 PM
5 Monitor the impact of these changes on milestones
and on-track indicators
As an example we analyzed patterns related to two
important on-track indicators early completion of college-
level math and credit accumulation during the fi rst year
of enrollment Figure 16 displays some patterns related
to college-level math for CCC students It shows a large
percentage of CCC students did not complete college-
level math within two years of entry About half of those
students had not enrolled in any math course within two
years (Further analysis could reveal more about these
students including whether they remained enrolled for the
two years or droppedstopped out) The other half enrolled
in math with some students taking only remedial courses
and others attempting but not successfully completing
college-level math
Figure 14 Probability of Completion Based on Credit-Completion Ratios
CCC Cohort SUSF Cohort
Perc
enta
ge C
ompl
eted
387
146
745
348
Year 1 CCR 80+ Year 1 CCR Less Than 80
0
20
40
60
80
100
Figure 15 Probability of Completion Based on Attendance Patterns
Perc
enta
ge C
ompl
etin
g
389
214
360 289
324
656
406
710
505
243
Met Indicator Did Not Meet Indicator
0
20
40
60
80
100
Full Time in Enroll Register On Full Time in Enroll First Term Continously Time for 80+ First Term Continously
of Courses
CCC Cohort SUSF Cohort
College officials could change certain policies and pracshy
tices to increase the share of students completing college-
level math depending on the largest source of the problem
in a particular system or institution Figure 17 displays a
similar analysis of patterns related to early credit accumushy
lation for SUSF students
DIAGNOSING WHY PROGRESS OF BLACK AND LATINO STUDENTS STALLS BEFORE DEGREE COMPLETION Our analysis shows that it often is important to disaggreshy
gate the data and look beneath campuswide or systemwide
averages at the performance of certain groups of students
For example our analysis of milestone completion at SUSF
found that black and Latino students completed 30 credits
and 15 lower division courses at rates similar to white and
Asian students suggesting that they were on track to graduate
But they earned bachelorrsquos degrees at lower rates So while
these students were on track for the first two milestones
they failed to complete the journeymdashat least by the end of
eight years
Why was this the case To understand this fi nding
we took a closer look at the patterns for those black and
Latino students who completed the earlier milestones but
did not earn a degree We began by looking at how far
these students progressed towards completion We found
that 17 percent of black students and 19 percent of Latino
students earned fewer than 60 units and that a larger group
of black (45 percent) and Latino (36 percent) students
earned at least 105 credits Although students in neither of
these groups completed a degree their enrollment patterns
differed markedly and suggest different problems requiring
different institutional actions
Some of the students who earned fewer than 60 credits
may have dropped out of school entirely or stopped out
for extended periods of time but others may have transshy
ferred to other colleges for-profit institutions or historishy
cally black colleges and universities Perhaps minority
students found that the statersquos public universities did not
provide a welcoming climate or did not meet their needs
With additional data college leaders could examine
a variety of possible explanations for why these students
did not progress beyond 60 units Additional data mdashsuch
as records of student enrollments at other institutions
from the National Student Clearinghouse or qualitative
data from interviews or focus groups with students who
stopped attendingmdashwould provide additional information
to help shape policy and practice
IHELP | THE EDUCATION TRUST | ADV ANCING BY DEGREES | APRIL 2010 10
All Degree Seekers (N = 247493)
Completed at least one college-level math course within two yearsmdash41808 (17)
Did NOT complete at least one college-level math course within two years mdash205685 (83)
No math course taken within two yearsN = 105148 (51)
Enrolled in at least one math courseN = 100537 (49)
Enrolled only in remedial mathN = 64412 (64)
Enrolled in college-level mathN = 36125 (36)
On average these students bull Enrolled in two college-level math
courses in the two yearsbull Droppedmdash65bull Failedmdash35
All Students (N=30497)
Completed 24+ credits in fi rst year19458 (638)
Did NOT complete 24+ credits in fi rst year11039 (362)
Did not attempt 24 credits in fi rst year3907 (353)
Attempted 24+ credits in fi rst year7138 (647)
On average these students bull Enrolled in 27 credits in the fi rst yearbull Dropped 122 of coursesbull Failed 203 of coursesbull Had a fi rst-year GPA of 202
AdvbyDegreesindd 11 552010 22932 PM
Figure 16 Patterns Related to Early Completion of College-Level Math (CCC Students)
bull Policies related to assessment and placement of incoming students
bull Practices related to advising and registration processes for new students
bull Policies that allow fl exibility for implementing innovative methods of course delivery
bull Practices that use innovative methods of designing and teaching remedial math courses
bull Policies related to course dropping and course repeats allocations of funding to provide incentives for course completion
bull Practices that identify struggling students early and provide academic assistance
Figure 17 Patterns Related to Early Credit Accumulation (SUSF Students)
bull Policies related to fi nancial aid fees campus employment
bull Practices related to fi nancial aid advising
bull Policies related to course dropping and course repeats and use of summer terms
bull Practices related to tutoring and other academic assistance services
IHELP | THE EDUCATION TRUST | ADV ANCING BY DEGREES | APRIL 2010 11
AdvbyDegreesindd 12 552010 22932 PM
In contrast students who earned 105 credits were well
on their way to completion and additional years of data
might reveal that some eventually completed a degree But
experience elsewhere suggests that many may well have
simply disengaged Fortunately many institutions are fi ndshy
ing these students easy to attract back to campusmdashwhen
they are invited back and their reenrollment is expedited
with attentive service Again institutions would be wise to
supplement quantitative findings of this sort with intershy
views and other information to learn what they might do
to speed the progress of these students
However even without additional data we can use
the on-track indicators in our framework to help diagshy
nose why these students failed to move beyond the initial
milestones To illustrate we compared black and Latino
students who did not earn a bachelorrsquos degree with black
and Latino students who did earn a bachelorrsquos degree on
the on-track indicators As Table 2 shows the primary
factors that distinguish students who earned a bachelorrsquos
degree from those who did not were related to credit accushy
mulation particularly completing courses and enrolling
continuously
Interestingly a higher percentage of students who did
not complete a degree took a success course than those
who did complete One likely explanation of this fi nding
is that students are either directed towards success courses
or choose to enroll in success courses if they are at higher
risk for not completing so the fi ndings refl ect enrollment
in the course more than the impact of the course We also
found that completion of gateway coursesmdashcollege-level
math and Englishmdashdid not appear to explain why these
students did not earn a bachelorrsquos degree17 A large majorshy
ity of students who did not earn a bachelorrsquos degree did
complete these courses Consequently this analysis sugshy
gests that the appropriate institutional response would be
to help students complete a higher percentage of courses
and enroll continuously Interventions might include inteshy
grating supplemental instruction into courses with high
failure rates instituting ldquoearly alertrdquo systems to identify
students having trouble in particular courses limiting the
number of course withdrawals and examining the adeshy
quacy of financial aid policies
RECOMMENDATIONS The purpose of this report is to give institutional leaders
a new set of tools for diagnosing institutional barriers to
degree completion and targeting institutional changes to
remove those barriers This section summarizes the data-
collection capacity that institutions need to use these tools
and offers a guide for using findings from analyzing the
data to improve degree completion
Data System Requirements States and institutions must be able to collect basic data
to track student progress across milestones and link that
progress to the academic patterns that indicate success or
lack thereof
Collect data on studentsrsquo course enrollments Course-enrollment data are necessary to analyze the
milestones and on-track indicators discussed in this report
Some higher education systems may only be collecting
information on whether particular students enrolled in
a specified term how many units they completed their
grade-point average or other aggregated information
about their experiences Such data are not suffi cient for
monitoring the progress and behaviors that our framework
comprises Term-by-term information on individual course
enrollments adds a level of detail about studentsrsquo patterns
of enrollment that is very useful for diagnosing where
students are falling off track which in turn points to ways
to target changes to policies and practices
Collect data to analyze important subgroups of students To ensure that all students are making progress towards
completion states and institutions should be able to
disaggregate data as follows
bull Age
bull Raceethnicity
bull Gender
bull Income
bull Academic preparation
(entrance test scores placement exam scores)
Develop data elements to match milestones and on-track indicators Table 1 on page 3 shows a good set of milestones and
on-track indicators that institutions should be able to
monitor Tracking some of the elements might require
some adjustments such as adding an element to fl ag when
IHELP | THE EDUCATION TRUST | ADV ANCING BY DEGREES | APRIL 2010 12
AdvbyDegreesindd 13 552010 22933 PM
Table 2 Analysis of Black and Latino Students Who Completed Intermediate Milestones at SUSF
Black Students Latino Students
Completed 30 credits 15 lower division courses and bachelorrsquos (n=2625)
Completed 30 credits 15 lower division courses but no bachelorrsquos (n=1315)
Completed 30 credits 15 lower division courses and bachelorrsquos (n=2460)
Completed 30 credits 15 lower division courses but no bachelorrsquos (n=751)
Gateway Courses
Completed Gateway Math
915 843 887 879
Completed Gateway English
898 941 896 955
Completed a success course
274 367 470 672
Credit Accumulation
Earned summer credits 961 859 991 911
Credit-completion ratio of gt80
926 530 944 575
Enrolled continuously 813 587 831 513 Not all students who earned a bachelorrsquos degree completed gateway English and math courses because some students earned credit for these courses through other means such as Advanced Placement
tests
a student has completed general education or has transishy
tioned from developmental to college-level coursework
Participation in the National Student Clearinghouse is also
necessary to track student transfers into other institutions
Absent that tracking a dropout cannot be distinguished
from a successful transfer
Collect data on student use of campus services and particishypation in special programs Many institutions implement special programs or services
to help students but they fail to collect student-level data
associated with those programs and services or to integrate
that information with other data Without such data it is
impossible to evaluate the effectiveness of programs and
services in improving student outcomes
Simplifying Data Collection Some of the on-track indicators that we looked at are
similar and may be interchangeable For example fi rst-year
GPA first-year credit-completion ratio and the number
of credits accumulated in the first year are all interrelated
Systems and institutions may want to reduce the number
of on-track indicators they track by eliminating those that
do not appreciably improve the statistical prediction of
completion18
For example our analysis of the data from Florida
indicated that the number of credits students earn in the
first year is an adequate predictor of completion without
adding first-year GPA and first-year credit-completion ratio
Furthermore we found that two of the fi rst-year indicashy
torsmdashcredits accumulated in the first year and completion
of college-level mathmdashpredicted completion about as well
as using all of the on-track indicators that we identifi ed
from the research literature
It is important to keep in mind while conducting this
type of analysis that results may differ from state to state
and from year to year within a state Therefore we believe
it is best to monitor more than this minimal set of on-
track indicators if institutional resources and data systems
permit such an approach19
Use Data to Target Institutional Changes Table 3 on the next page lists some specific actions institushy
tions may consider in response to findings that emerge
from their data monitoring and analysis
IHELP | THE EDUCATION TRUST | ADV ANCING BY DEGREES | APRIL 2010 13
AdvbyDegreesindd 14 552010 22933 PM
Table 3 Using Indicators of Success to Make Changes in Institutional Policies and Practices
Problem Identified Possible Changes to Policy or Practice
Remediation
Low percentage of developmental educashytion students complete remediation
bull Ensure that policies support innovative practices such as intensive summer-orientation programs for new remedial students
bull Contextualize basic-skills instruction into content courses bull Implement learning communities for developmental students bull Adopt systemwide definitions of college readiness bull Incorporate incentives for institutions to increase success in remedial coursework bull Redesign developmental courses into modules so students only repeat needed sections bull Require early completion of remedial coursework bull Provide brief brush-up courses for students who test near proficiency levels bull Enroll students in college-level courses provide supplementary instruction andor sumshy
mer sessions for nearly proficient students
Gateway courses
Low percentage of students complete bull Better align curriculum and assessment with high schools to improve college readiness college-level math course in their first year bull Require entering students to take first credit-bearing math and English courses imshy
mediately (after completing any required developmental courses)mdashor at least ensure that early advising stresses the importance of taking a math course early in the college career
Low percentage of students complete a ldquosuccessrdquo course in the first year (among part-time and older students)
bull Ensure adequate course offerings and flexible scheduling bull Better advising for new students about the advantages of such courses bull Require degree-seeking nontraditional students to enroll in a success course
Credit accumulation
Low percentage of first-year students reach a threshold of credit accumulation in their fi rst year (20-30 semester credits)
High percentage of course enrollments for which students registered late (after a course begins or within less than some number of days before a term starts)
bull Increase use of college success courses early advising and similar programs bull Improve financial aid counseling to emphasize benefits of full-time enrollment bull Charge lower per-credit fees for enrolling with a full-time credit load bull Encourage full-time attendance by providing financial aid and other incentives bull Provide financial aid for enrollment in summer terms bull For four-year students facilitate summer enrollment in community college ldquoback homerdquo bull Offer online summer courses bull Require enrollment in at least one summer term
Low credit-completion ratio in first year bull Use ldquoearly alertrdquo systems and improved tutoring services to provide more academic assistance
bull Limit course drops and repeats or impose extra fee for course withdrawal past a certain date or for repeating a course
bull Limit late registration or impose an extra fee for registering late bull Use success courses to teach students effective enrollment patterns
IHELP | THE EDUCATION TRUST | ADV ANCING BY DEGREES | APRIL 2010 14
AdvbyDegreesindd 15 552010 22933 PM
APPENDIX Table A-1 Milestone Achievement by Indicator Attainment for the CCC Cohort
Earned 12+ Earned 30+ college- college- Completed Earned
Retention Retention level level transfer Earned associate Any to second to second credits credits curriculum certifi cate degree Transferred completion
SUCCESS INDICATORS term (74) year (58) (62) (42) (17) (33) (8) (23) (29)
College-Level Math
Completed Within Two 928 867 959 834 504 32 206 531 611 Years (21)
Did Not Complete Within 701 522 554 333 99 34 53 169 220 Two Years (79)
College-Level English
Completed Within Two 914 840 924 761 379 35 170 437 512 Years (28)
Did Not Complete Within 682 495 523 304 97 33 49 162 212 Two Years (72)
Success Course
Completed (22) 837 726 766 586 261 34 118 269 345
Did Not Complete (78) 712 538 581 369 140 33 68 214 268
First-Year Credits
Earned 20+ Credits (any) 993 890 977 865 442 62 206 464 579 (24)
Did Not Earn 20 Credits 660 483 511 277 81 24 39 157 194 (any) (76)
Summer Credits
Completed Any (46) 845 754 859 676 307 49 139 365 450
Did Not Complete Any (54) 649 431 419 196 47 20 28 108 145
First-Year Credit-Completion Ratio
Completion Ratio gt80 805 666 738 520 219 45 109 278 387 (62)
Completion Ratio lt 80 634 441 433 251 82 15 30 152 146 (38)
Full-Time Attendance
Full Time in First Term (41) 816 692 783 591 273 38 123 318 389
Part Time in First Term (59) 686 503 510 297 93 30 48 169 214
On-Time Course Registration
On Time for gt80 751 603 653 463 200 38 99 261 324 of Courses (53)
On Time for lt 80 726 554 588 366 130 28 56 196 243 of Courses (47)
Continuous Enrollment
Continuously Enrolled (40) 1000 688 682 487 233 39 121 291 360
Not Continuously Enrolled 773 675 738 491 171 37 73 229 289 (60)
IHELP | THE EDUCATION TRUST | ADV ANCING BY DEGREES | APRIL 2010 15
AdvbyDegreesindd 16 552010 22933 PM
Table A-2 Milestone Achievement by Indicator Attainment for the SUSF Cohort
Completed 15 lower Completed Retention to second Retention to second Earned 30+ credits division courses baccalaureate
SUCCESS INDICATORS term (94) year (83) (85) (70) (64)
College-Level Math
Completed in First Year (58) 980 919 949 813 797
Did Not Complete in First Year (42) 878 713 709 553 416
College-Level English
Completed in First Year (84) 969 881 903 764 703
Did Not Complete in First Year (16) 782 596 582 412 318
Success Course
Completed in First Year (19) 950 845 858 749 547
Did Not Complete in First Year (81) 933 828 845 692 656
First-Year Credits
Earned 24+ Credits (64) 1000 949 977 862 782
Did Not Earn 24 Credits (36) 825 625 621 430 377
First-Year and Second-Year Credits
At Least 48 Credits (57) 999 999 1000 925 858
Less Than 48 Credits (43) 854 613 649 419 345
Summer Credits
Completed Any (83) 969 910 949 811 746
Did Not Complete Any (18) 781 462 362 191 116
First-Year Credit-Completion Ratio
Completion Ratio gt80 (72) 971 918 946 824 745
Completion Ratio lt 80 (28) 845 604 592 396 348
Full-Time Attendance
Full Time in First Term (92) 946 844 864 724 656
Part Time in First Term (8) 822 684 663 501 406
Continuous Enrollment
Continuously Enrolled (77) 1000 908 878 763 710
Not Continuously Enrolled (23) 894 729 898 628 505
IHELP | THE EDUCATION TRUST | ADV ANCING BY DEGREES | APRIL 2010 16
- - - -
- - - -
AdvbyDegreesindd 17 552010 22933 PM
REGRESSION RESULTS Using data for the CCC and SUSF systems we ran two dentsrsquo full enrollment period Dummy variables were used
logistic regression models for all students and for each of in all models to control for institutional effects For simshy
several subgroups for each cohort Each model included plicity we have included tables summarizing the fi ndings
demographic variables and the first model added fi rst-year that use a ldquo+rdquo to indicate a statistically signifi cant positive
success indicators the second model included indicators relationship and a ldquo-ldquo to indicate a statistically signifi cant
from the second year as well as indicators based on the stu- negative relationship with completion
Table A-3 Regression Models on the Likelihood of Completing a CertificateDegreeTransfer | CCC Cohort
Full-Time Part-Time All Degree Traditional Traditional Full-Time Part-Time Seekers Age Age Older Older White Asian Black Latino
First-Year Indicator Models
Demographic and Attendance Characteristics
Female + + + + + + + + +
Age 25+ shy
Asian + - + ns ns
Black ns ns - + shy
Hispanic - - - - shy
OtherUnknown RaceEthnicity ns ns ns ns ns
Ever Received BOG Waiver + + + ns + + + ns +
Full-Time (based on first term) + + + + +
Year 1 Credits Earned + + + + + + + + +
Success Indicators
First-Year GPA + + + + + + + + +
Complete Success Course + ns + + + + ns - +
First-Year Credit-Completion Ratio + + + + + + + + +
Completed College-Level Math in Year 1 + + + + + + + + +
Completed College-Level English in Year 1 + + + + + + + + +
Second-Year and Beyond Indicator Models
Demographic and Attendance Characteristics
Female + + + + ns + + + +
Age 25+ shy
Asian - - ns ns shy
Black ns ns ns - +
Hispanic - - - - shy
OtherUnknown RaceEthnicity ns ns ns ns ns
Ever Received BOG Waiver + ns + - + ns + - ns
Full Time (based on first term) + + + + +
Year 2 Credits Earned + + + + + + + + +
Success Indicators
Second-Year GPA + + + + + + + + +
Completed Success Course + + + + + + + + +
Percentage of Courses Registered Late - - - - - - - - shy
Summer Credits (yesno) + + + + + + + + +
Continuous Enrollment + + + ns ns + ns + +
+ Indicates a statistically significant (05 level or better) positive correlation between the indicator and the likelihood of completion - Indicates a statistically significant (05 level or better) negative correlation between the indicator and the likelihood of completion ns Indicates no statistically significant relationship | Shaded cells are not applicable to the student group
IHELP | THE EDUCATION TRUST | ADV ANCING BY DEGREES | APRIL 2010 17
AdvbyDegreesindd 18 552010 22934 PM
Table A-4 Regression Models on the Likelihood of Bachelorrsquos Degree Completion | SUSF Cohort
Need-Based Aid RaceEthnicity Need- No Need-
All Students Based Aid Based Aid White Black Latino Asian First-Year Indicator Models Demographic and Attendance Characteristics Female + + + Age - ns -Asian ns - ns Black - - -Hispanic ns ns ns OtherUnknown RaceEthnicity - ns -Ever Received Pell + HS GPA + + + SAT Score - - -Credit Hours at Entry + + + Success Indicators Full Time (based on first term) ns Year 1 Credits Earned + First-Year GPA + Completed CollegeCareer Success Course ns First-Year Credit-Completion Ratio ns Completed College-Level Math in Year 1 + Completed College-Level English in Year 1 ns
Year 2 Credits Earned + Second-Year GPA + Second-Year Credit-Completion Ratio + Summer Credits (yesno) + Continuous Enrollment +
ns ns + + + + ns ns ns ns + + ns ns
+ + + + + + + + + +
+ + + + - ns - ns
ns ns ns ns + + ns ns - - ns ns + + + +
ns ns ns ns + + + + + + + + ns ns ns ns ns + ns + ns + + ns ns ns ns ns
ns + + ns - ns ns ns
ns ns ns shy+ + ns ns - - ns ns + ns + +
+ + + + + + + + + + + + + + + + + + + ns
Second-Year and Beyond Indicator Models Demographic and Attendance Characteristics Female + + + Age - ns -Asian - - ns Black - - -Hispanic ns ns ns OtherUnknown RaceEthnicity ns ns ns Ever Received Need-Based Aid ns HS GPA + + + SAT Score - - -Credit Hours at Entry + + + Success Indicators
+ Indicates a statistically significant (05 level or better) positive correlation between the indicator and the likelihood of completion - Indicates a statistically significant (05 level or better) negative correlation between the indicator and the likelihood of completion ns Indicates no statistically significant relationship | Shaded cells are not applicable to the student group
Note Some of the first-year indicators were not statistically significant However this was because of the strong relationships between the indicashytors and the comparatively smaller sample (the CCC cohort was more than eight times as large) When separate models were run for each indicashytor and the demographic and attendance characteristics all of the first-year indicators were significant positively related to completion
IHELP | THE EDUCATION TRUST | ADV ANCING BY DEGREES | APRIL 2010 18
AdvbyDegreesindd 19 552010 22934 PM
ANALYSES TO SIMPLIFY DATA COLLECTION WHILE PREDICTING SUCCESS In order to choose a subset of predictors we compared
several models using the first-year predictors from the
Florida data in terms of practical and statistical signifi shy
cance Specifically we compared models in terms of statisshy
tical significance on the basis of the change in the likelishy
hood-ratio statistic and compared the practical signifi cance
of the models using an approximation of the R2 statistic in
linear regression the correlation between the observed
outcome and the predicted probability of the outcome20
We also examined the statistical significance of the indishy
vidual predictors in the model using the Wald statistic and
the practical significance by looking at the size of the odds
ratio associated with the predictor
We found that each predictor or set of predictors we
added to the model resulted in a statistically signifi cant
improvement in the fit of the model However we found
that one or two predictors were about as useful in predictshy
ing completion as including additional predictors Table
A-5 shows the summary statistics for three of the models
we examined As shown the model that only included
Year 1 credits earned as a predictor was nearly as useful for
predicting completion as a model that included all of the
first-year predictors Although adding completion of math
in the first year did not lead to a dramatic improvement
in the ability of the model to predict completion the size
of the odds ratio suggests that it is practically signifi cant
Therefore the data from this cohort of students in Floridarsquos
four-year system suggest that tracking only fi rst-year credits
earned or tracking first-year credits earned and completion
of math in the first year would be nearly as useful as trackshy
ing all four predictors We found similar results with the
data from the California Community Colleges
Table A-5 Comparison of Three First-Year Predictor Models on Summary Measures of Model Fit
Squared Correlation Between VARIABLES INCLUDED IN MODEL Predicted and Observed df -2 LL
Florida
Background Characteristics + Year 1 Credits Earned 0278 20 2980117
Background Characteristics + All 0304 23 2894586 Year 1 Credit-Accumulation Predictors
Background Characteristics + Year 1 Credits Earned + Completed College-Level Math in Year 1
0282 21 2966201
Background Characteristics + All 0306 26 2887379 Year 1 Predictors
California
Background Characteristics + Year 1 Credits Earned 0180 124 21625726
Background Characteristics + All Year 1 Credit-Accumulation Predictors
0201 127 21188628
Background Characteristics + Year 1 Credits Earned + 0192 125 21392214 Completed College-Level Math in Year 1
Background Characteristics + All Year 1 Predictors
0218 130 20843276
IHELP | THE EDUCATION TRUST | ADV ANCING BY DEGREES | APRIL 2010 19
AdvbyDegreesindd 20 552010 22934 PM
NOTES 1 For a literature review titled ldquoStudent Progress Toward Degree English by Year 1rdquo it would seriously understate the importance
Completion Lessons From the Research Literaturerdquo visit wwwcsus of that indicator in predicting degree completion since these eduihepublications students did earn college-level credits Instead we have counted
2 Horn L amp Lew S (2007) ldquoCalifornia Community College Transshyfer Rates Who is Counted Makes a Differencerdquo Berkeley Calif MPR Associates Inc
those students in the ldquoyesrdquo group (completing CL mathEnglish by end of Year 1) Unfortunately we cannot identify those students who entered with those prior college credits but who did not graduate Such students are unavoidably counted as not having
3 For example see Marcotte DE (2006) ldquoThe Earnings Effect of completed college-level Englishmath by Year 1 because we have Education at Community Collegesrdquo Baltimore University of no way to identify them and move them to the ldquoyesrdquo column Maryland Since the overall Florida graduation rate is 64 percent we believe it
4 We recognize that transferring to a university is not really ldquocompletionrdquogiven that the goal of those students is a bachelorrsquos degree and many students do not complete an associate degree before transferring (81 percent of transfers in the CCC cohort did not earn an associate degree) However transfer is commonly used as a completion measure for community colleges We were not able to track student outcomes after transfer but we recognize that a substantial number of students who transfer to universities do
is safe to assume that the rate is far higher for students who enter the university having completed college-level English andor math Therefore the number of students miscategorized as ldquonordquo should be relatively small (since it is limited to those who came in with college credit but did not graduate in eight years) This unavoidshyable error does overstate the positive impact of taking mathEngshylish by the first year on graduation rates but we are convinced that it is an important indicator of success since before making this
not ultimately earn a baccalaureate adjustment completion of college-level math and college-level English were statistically significant predictors of completion
5 For example see Adelman C (2005) ldquoMoving Into Town and Moving On The Community College In The Lives of Traditional-Aged Studentsrdquo Washington DC US Department of Education Achieving the Dream Cross-State Data Work Group (2008) Test drive Six states pilot better ways to measure and compare comshymunity college performance Boston Jobs for the Future
10 It could be the case that success courses in the CCC are aimed at students with more risk factors complicating the relationship of taking a success course and completion Also the CCC does not have a code to identify success courses so we relied on a combinashytion of Taxonomy of Program (TOP ) code and course title We could have misclassified some courses affecting the results Better
6 The University of California (UC ) and California State University data are needed to accurately identify these courses (CSU) generally require students to finish all transfer requireshyments at the CCC before moving on to one of their campuses Some lower division transfers are accepted at UC CSU campuses that have enrollment space available but lower division transfer students must have completed the 15-course college-preparatory curriculum required for freshman admission (known as A-G) while in high school or must have made up the defi ciencies while attending a CCC Some campuses impose other requirements on lower division transfers and some take no lower division transfers at all
11 We broke these results down by university because for this indicashytor aggregating across universities misrepresented the relationship Specifically aggregating the data across institutions resulted in a higher rate of degree completion for students who did not take a success course than for students who did take a success course This reversal of the relationship occurred because very few students completed a success course at two of the largest universities and these universities had relatively high graduation rates The effect of this was to inflate the overall number of students who did not take a success course and graduated Furthermore the small
7 There is little remediation done in the SUSF Florida students who number of students at some universities can lead to some unlikely require developmental courses are generally referred to commushy findings such as the 100 percent completion rate for students takshynity colleges for those courses and no records of course enrollshy ing a success course in University 5 The perfect completion rate ments or outcomes are included in the SUSF data The CCC data occurred because only two students who first attended University do not include any information on assessment tests or placement 5 completed a success course in their first year and both happened recommendations in order to identify students who need remediashy to complete tion The CCC data do include information on remedial course enrollments but course enrollment does not serve as a valid proxy for ldquoneedrdquo for remediation Many students who need remediation fail to enroll in developmental courses and are therefore misclassishyfied as college ready The result is an overestimate of the success of ldquoremedialrdquo students and an underestimate of the success of ldquocolshy
12 The different credit thresholds reflect the different students served by these types of institutions (that is community colleges have a larger percentage of part-time students than is typically found in four-year institutions and more students who are not college-ready and require remediation)
lege readyrdquo students This problem has also been noted by other 13 On average SUSF students who did not earn any summer credits researchers using data from other state community college systems were enrolled for less than four terms (fallspring) while students (Achieving the Dream Cross-State Data Work Group 2008) who did earn summer credits were enrolled for an average of more
8 Adelman C ldquoProposed Amendment for the Student Right-Toshy than eight terms
Know and Campus Security Act of 1990rdquo (PL 101-542) to produce 14 Adelman C (2006) ldquoThe Toolbox Revisited Paths To Degree a full and honest account of college completion rates Obtained Completion From High School Through Collegerdquo Washington through personal communication on June 2 2008 DC National Center for Education Statistics
9 Students in Floridarsquos public universities must earn college-level 15 A smaller sample size for Asians (5 percent of the sample was credits in English and math in order to earn a bachelorrsquos degree Asian) limited the ability to detect the relationship and could but they can earn those credits while in high school (for example explain the lack of relationship between continuous enrollment Advanced Placement exams) In this cohort there were several and completion for Asian students thousand students who earned a bachelors degree but never enrolled in college-level math or English at the university If we counted those students as ldquonot completing college-level math
16 Some courses in the CCC are offered on a compressed schedule and may start sometime after the beginning of the term Unforshytunately there is no indication in the data for ldquolate startrdquo courses
IHELP | THE EDUCATION TRUST | ADVANCING BY DEGREES | APRIL 2010 20
AdvbyDegreesindd 21 552010 22934 PM
With input from internal CCC researchers rules were developed for identifying circumstances where registrations that occurred more than a certain number of days into the term were probably an indication of ldquolate startrdquo courses These were excluded from the analyses Data were not available to measure late course regisshytration for the SUSF cohort Other research has found that late registrants have higher course-withdrawal rates which would affect credit accumulation (Freer-Weiss D [2004] ldquoCommunity College Freshmen Last In First Out Journal of College Student Retentionrdquo 6[2] 137-154)
17 We modified the gateway-course completion indicators to cover the entire period of enrollment instead of just the first year We were interested in finding out whether failure to complete these courses at any time during their college careers was preventing students from earning a bachelorrsquos degree
18 This can be done by examining measures of practical and statistishycal significance of individual predictors and the overall model See the appendix for details on this analysis
19 An additional concern is that fitting multiple regression models to the data in order to reduce the number of predictors of success runs the risk of choosing a subset of predictors based on some random aspect of the sample cohort
20 See Hosmer D W and Lemeshow S (2000) ldquoApplied Logisshytic Regressionrdquo 2nd ed New York John Wiley amp Sons Inc for a discussion of summary measures that approximate variance explained
IHELP | THE EDUCATION TRUST | ADVANCING BY DEGREES | APRIL 2010 21
AdvbyDegreesindd 22 552010 22934 PM
22 IHELP | THE EDUCATION TRUST | ADVANCING BY DEGREES | APRIL 2010
AdvbyDegreesindd c4 552010 22843 PM
ABOUT THE INSTITUTE FOR HIGHER EDUCATION LEADERSHIP amp POLICY
The Institute for Higher Education Leadership amp Policy seeks to enhance
leadership and policy for higher education in California and the nation by
producing research and services for policymakers practitioners and educators
ABOUT THE EDUCATION TRUST
The Education Trust promotes high academic achievement for all students
at all levelsmdashpre-kindergarten through college We work alongside parents
educators and community and business leaders across the country in
transforming schools and colleges into institutions that serve all students
well Lessons learned in these efforts together with unflinching data analyses
shape our state and national policy agendas Our goal is to close the gaps
in opportunity and achievement that consign far too many young peoplemdash
especially those who are black Latino American Indian or from low-income
familiesmdashto lives on the margins of the American mainstream
IHELP and The Education Trust are grateful to the Bill amp Melinda Gates
Foundation and Lumina Foundation for Education for their generous
support The views expressed in this report do not necessarily represent
those of either organization its officers or its employees
6000 J STREET SACRAMENTO CALIF 95819 1250 H STREET NW SUITE 700 WASHINGTON D C 20005
T 916278-3888 F 916278-3907 WWWCSUSEDUIHELP T 202293-1217 F 202293-2605 WWWEDTRUST ORG

769
430
AdvbyDegreesindd 6 552010 22929 PM
number who would eventually finish within the eight-year Figure 5 Milestone Achievement in the SUSF Cohort (within eighttracking period years)
We now turn to the relationship of on-track indicators
in Table 1 to the likelihood of completion (of a bachelorrsquos 100
degree in the SUSF and of a certifi cateassociate degree 936
831 845
701 635
Perc
enta
ge A
chie
ving
Mile
ston
e 80
60
40
20
transfer in the CCC) Data limitations in each of the systems
preclude analysis of some of the on-track indicators particshy
ularly those related to remediation7 Nevertheless what we
learned provides some helpful clues about success patterns
When we began our examination of system data we
knew from previous research that certain things seemed
to matter in student success But we didnrsquot know exactly
how they would play out in these very different systems or
whether there would be similarities across the systems An
overview of what we learned follows
ON-TRACK INDICATORS WHAT DID WE LEARN ABOUT GATEWAY COURSES Taking college-level math and English early Students in both the CCC and the SUSF cohorts were
more likely to ldquocompleterdquomdashin the CCC that means earn
0 Retained Retained 30+ College 15 Lower Bachelorrsquos 2nd Term 2nd Year Credits Division Courses Degree
Figure 6 Milestone Achievement in the SUSF Cohort by Race Ethnicity
100
80
White Asian Black LatinoHispanic
871844 838 853
722
613
686 677
755
669 729
515
Perc
enta
ge A
chie
ving
Mile
ston
e
a degree a certificate or transfer and in the SUSF it means
earn a bachelorrsquos degreemdashif they completed college-level
math and English early in their enrollment with a grade of
C or better (see Figure 8)
CCC students who completed a college-level math
60
40
20 course within two years of initial enrollment were nearly
three times as likely to complete as students who did not
complete college-level math in that time period Similarly
four-fifths of SUSF students who completed a college-level
math course in their first year earned a bachelorrsquos degree
compared with fewer than half of students who did not
complete a college-level math course in their fi rst year9
Taking ldquosuccessrdquo courses Many colleges offer courses designed to help students
achieve in college and in their careers We call these ldquosuccessrdquo
courses Completing a success course appears to help many
0
Completed 30+ College Credits Bachelorrsquos Degree Completed 15 Lower Division Courses
Figure 7 Percentage of Students Receiving a Bachelorrsquos Degree by Year in the SUSF Cohort
100
0 0 3
29
21
7 3 1
Year 1 Year 2 Year 3 Year 4 Year 5 Year 6 Year 7 Year 7
Perc
enta
ge C
ompl
etin
g B
ache
lorrsquos
Deg
ree
80
60
40
students earn a degree or certificate or to transfer
Our analysis suggests however that it is important
to look underneath these overall averages For example
older students and traditional-age part-time students who
completed a success course had higher completion rates in
the CCC (see Figure 9) Interestingly black students in the 20
CCC who completed a success course were less likely to
complete than black students who did not And for Asian 0
students completing a success course was unrelated to
completion10
IHELP | THE EDUCATION TRUST | ADV ANCING BY DEGREES | APRIL 2010 6
AdvbyDegreesindd 7 552010 22930 PM
DATA AND METHODS Data Source 1 California Community Colleges Chancellorrsquos Office
The student-unit records (SUR) data include demographic information courses taken degreescertificates earned and transfers to four-year universities based on matches to the statersquos public universities and to the National Student Clearingshyhouse We analyzed data for the entering cohort of first-time California Community College students who enrolled in one or more credit-bearing courses during the 2000-01 academic year Noncredit students and high school students concurrently enrolled in community college were excluded We tracked the students over a seven-year period through 2006-07 Data limitations include lack of information on the following student income or other measures of socioeconomic status and assessment-test scores placement recommendations or other indicators of academic preparation for college-level study
The analyses focus on a subset of students identified as ldquodegree seekersrdquo (a term that includes both degrees and certificates) based on their having enrolled in more than six units during the first year This definition is based on a recent suggestion by Clifford Adelman as part of national discussions about revising the federal methodology for calculating gradushyation rates8 Using Adelmanrsquos suggested criterion 63 percent of students in the cohort were identified as degree seekers (N=247493) These students were somewhat younger with an average age of 24 compared with 26 for the entire cohort of students Fifty-three percent of degree seekers were younger
In Florida differences surfaced among campuses In
nine of the ten universities first attended by SUSF students
students who completed a success course were more likely
to earn a bachelorrsquos degree than students who did not
complete a success course (see Figure 10)11
ON-TRACK INDICATORS WHAT DID WE LEARN ABOUT CREDIT ACCUMULATION
Accumulating first-year and second-year credits Choosing on-track indicators for credits earned involves
several considerations
bull whether to track only college-level credits or to track
all credits (including developmentalremedial)
bull whether to track only first-year credits or to track
credits in subsequent years
bull whether to track credits for all students or sepashy
rately for full-time and part-time students (note that
students often change their attendance status across
terms) and
than 20 and 10 percent were age 40 or older compared with 45 percent and 17 percent respectively for the entire cohort The gender and racialethnic distributions were about the same
Data Source 2 Florida Board of Governors The SUR data include demographic information course-taking records and records of degrees earned We analyzed data for the entering cohort of all first-time freshmen in all ten universities in the State University System of Florida in the 1999-2000 academic year We tracked the students over eight years through 2006-07 Limitations of the data include a lack of information on student income and on credits earned through Advanced Placement exams concurrent enrollment or high admission-test scores All students in the cohort were included in the analyses as it was assumed that all students enrolled intending to pursue a bachelorrsquos degree (N=30497)
Methods We calculated the percentage of students who reached milestones and the rates of milestone achievement for different groups of students To gauge the probability of degree compleshytion we examined whether students met the on-track indicashytors We used regression analysis to test whether the on-track indicators predicted completion after controlling for other factors and whether the relationships held across all groups of students (such as racialethnic groups age groups and students who received need-based aid) More details about the statistical analyses are described in the appendix
bull the appropriate threshold of accumulated credits
Our research did not find a threshold number that was
associated with a substantial jump in the completion rate
Rather in both the CCC and the SUSF cohorts we found
a fairly linear relationship between the number of credits
a student earned and the probability of completion The
more credits earned in the first year the higher the chance
of completing (see Figure 11)
That said the impact of early credit accumulation was
clear in both systems We set the threshold at 20 credits (of
any kind) in the first year for the CCC cohort and 24 credshy
its in the first year and 48 credits through the second year
for the SUSF cohort12 Fifty-eight percent of CCC students
who earned at least 20 credits in the first year completedmdash
three times as many as those who did not earn 20 credits
in the first year (see Figure 12) We found a similar pattern
for SUSF students Three-quarters of students who comshy
pleted at least 24 credits in the first year earned a bachelorrsquos
degree compared with 38 percent of students who did not
meet that threshold
IHELP | THE EDUCATION TRUST | ADV ANCING BY DEGREES | APRIL 2010 7
AdvbyDegreesindd 8 552010 22930 PM
Completing summer creditsFigure 8 Probability of Completion Based on Early Completion of
In both the Florida and California systems students who College-Level Math and English earned summer credits completed at a higher rate (see Fig-
Completed college- Completed college- Completed college- Completed college-
Perc
enta
ge C
ompl
etin
g
0
20
40
611
220
512
212
797
416
703
318
60
80
100 Completed Course Did Not Complete Course
ure 13) The difference in the rate of earning a bachelorrsquos
degree between SUSF students who earned summer credits
and those who did not was particularly large (75 percent
versus 12 percent)
However before acting on this information it may
be important to understand what it means and what it
doesnrsquot The strong relationship between earning summer
credits and completion may not mean that it is summer
attendance per se that helps students complete their
level math level English level math by level English by in two years in two years end of Year 1 end of Year 1
CCC Cohort SUSF
Figure 9 Probability of Completion at CCC Based on Finishing a Success Course by Attendance Status and Age Group
100
degrees Students who attend regularly and persist over a
number of years are likely as well to take summer classes13
Therefore summer attendance is in part an indicator that
students are being retained and taking a continuous proshy
gression of courses However summer terms also provide
students with an opportunity to build and sustain progress
by earning additional credits and retaking courses not
completed during other terms14
80
346
269
423 410
307 243
288 245
211 141
Completed Course Did Not Complete Course
Completing most courses attempted To accumulate credits and build momentum toward
60 completion students need to complete their courses
Perc
enta
ge C
ompl
etin
g C
ertif
icat
e
Deg
ree
or T
rans
fer
We calculated credit-completion ratios as the number of 40
credits earned divided by the number of credits attempted
so that either failing or withdrawing from a course led to 20
0 All Students Traditional Older Traditional Older
Age Age
Full Time Part Time
noncompletion of credits We found that rates of earning
a degree attaining a certificate or transferring were 24 and
40 percentage points higher in the CCC and the SUSF sysshy
tems respectively for students who completed at least 80
percent of the credits they enrolled in during the fi rst year
compared with those who completed a smaller percentage
of first-year credits (see Figure 14)
Figure 10 Probability of Bachelorrsquos Degree Completion at SUSF Based on Finishing a Success Course by First University Attended
442
434
509
480
500
467
67
4
650
667
599
589
519
479
514
931
821
549
321
100
735
Perc
enta
ge C
ompl
etin
g B
ache
lorrsquos
Deg
ree
Completed Course Did Not Complete Course
0
20
40
60
80
100
University 1 University 2 University 3 University 4 University 5 University 6 University 7 University 8 University 9 University 10
IHELP | THE EDUCATION TRUST | ADV ANCING BY DEGREES | APRIL 2010 8
AdvbyDegreesindd 9 552010 22930 PM
Enrolling continuously and full-time Figure 11 Probability of Completion by First-Year Credits Earned
Obviously students who attend full time and enroll
continuously can accumulate credits faster than students 100
0-3 gt3-6 gt6ndash9 gt9ndash12 gt12ndash15 gt15ndash18 gt18ndash21 gt21ndash24 gt24ndash27 gt27ndash30 gt30
SUSF CCCwho enroll part time and stop out What may be surprisshy
80ing is how big those differences are In the CCC students
who enrolled full time in their first term were almost twice
as likely to complete as students who enrolled part time
(see Figure 15) Continuously enrolled CCC students had
Perc
enta
ge C
ompl
etin
g
60
40 a completion rate that was seven percentage points higher
than students who stopped out Both factors were associshy
ated with higher rates of earning a bachelorrsquos degree in the
SUSF although far fewer students enroll part time or stop
out in that system
Once again there are some differences underneath
these averages In the CCC for example continuous
enrollment did not correlate with completion for students
25 and older Similarly continuous enrollment did not
predict completion for Asian students in either system15 In
the CCC late registration for courses affected the probabilshy
20
0
First-Year Credits Earned
Figure 12 Probability of Completion Based on Early Accumulation of Credits
100ity of completion The likelihood of completion declined
as the share of courses a student enrolled in late increased
(ldquoLate registrationrdquo was defined as enrolling in a course
after the start date of the term16) Students who registered
late for no more than one in five of their courses had a
completion rate of 32 percent compared with 24 percent
for students who registered late more often Late registrashy
579
194
782
377
858
345
Met Credit Threshold Did Not Meet Credit Threshold
Perc
enta
ge C
ompl
etin
g 80
60
40
tion affected completion for all student groups nearly half 20
(47 percent) of all CCC students registered late for at least
one in five of their courses 0 Earned 20+ Credits Earned 24+ Credits Earned 48+ Credits
in Year 1 in Year 1 Through Year 2
SUSF CohortCCC CohortUSING MILESTONES AND ON-TRACK INDICATORS TO INCREASE DEGREE COMPLETION How can our two postsecondary systems use the frameshy
work of milestones and on-track indicators to identify Figure 13 Probability of Completion Based on Earning Summer problems and design institutional interventions to boost Credits degree completion As they flag problems and plan intershy
100ventions systems like these can take the following steps
1 Collect data on student progress along the milestones
CCC Cohort SUSF Cohort
450
145
746
116
Earned Summer Credit Did Not Earn Summer Credit
80 to degree completion
2 Note at what milestone points student progress is
stalling
3 Analyze on-track indicators to understand what
successful patterns are not being followed leaving Perc
enta
ge C
ompl
etin
g
60
40
students off track for a degree 20
4 Intervene through changes in policy or practice that
address the problem and increase student success 0
IHELP | THE EDUCATION TRUST | ADV ANCING BY DEGREES | APRIL 2010 9
AdvbyDegreesindd 10 552010 22931 PM
5 Monitor the impact of these changes on milestones
and on-track indicators
As an example we analyzed patterns related to two
important on-track indicators early completion of college-
level math and credit accumulation during the fi rst year
of enrollment Figure 16 displays some patterns related
to college-level math for CCC students It shows a large
percentage of CCC students did not complete college-
level math within two years of entry About half of those
students had not enrolled in any math course within two
years (Further analysis could reveal more about these
students including whether they remained enrolled for the
two years or droppedstopped out) The other half enrolled
in math with some students taking only remedial courses
and others attempting but not successfully completing
college-level math
Figure 14 Probability of Completion Based on Credit-Completion Ratios
CCC Cohort SUSF Cohort
Perc
enta
ge C
ompl
eted
387
146
745
348
Year 1 CCR 80+ Year 1 CCR Less Than 80
0
20
40
60
80
100
Figure 15 Probability of Completion Based on Attendance Patterns
Perc
enta
ge C
ompl
etin
g
389
214
360 289
324
656
406
710
505
243
Met Indicator Did Not Meet Indicator
0
20
40
60
80
100
Full Time in Enroll Register On Full Time in Enroll First Term Continously Time for 80+ First Term Continously
of Courses
CCC Cohort SUSF Cohort
College officials could change certain policies and pracshy
tices to increase the share of students completing college-
level math depending on the largest source of the problem
in a particular system or institution Figure 17 displays a
similar analysis of patterns related to early credit accumushy
lation for SUSF students
DIAGNOSING WHY PROGRESS OF BLACK AND LATINO STUDENTS STALLS BEFORE DEGREE COMPLETION Our analysis shows that it often is important to disaggreshy
gate the data and look beneath campuswide or systemwide
averages at the performance of certain groups of students
For example our analysis of milestone completion at SUSF
found that black and Latino students completed 30 credits
and 15 lower division courses at rates similar to white and
Asian students suggesting that they were on track to graduate
But they earned bachelorrsquos degrees at lower rates So while
these students were on track for the first two milestones
they failed to complete the journeymdashat least by the end of
eight years
Why was this the case To understand this fi nding
we took a closer look at the patterns for those black and
Latino students who completed the earlier milestones but
did not earn a degree We began by looking at how far
these students progressed towards completion We found
that 17 percent of black students and 19 percent of Latino
students earned fewer than 60 units and that a larger group
of black (45 percent) and Latino (36 percent) students
earned at least 105 credits Although students in neither of
these groups completed a degree their enrollment patterns
differed markedly and suggest different problems requiring
different institutional actions
Some of the students who earned fewer than 60 credits
may have dropped out of school entirely or stopped out
for extended periods of time but others may have transshy
ferred to other colleges for-profit institutions or historishy
cally black colleges and universities Perhaps minority
students found that the statersquos public universities did not
provide a welcoming climate or did not meet their needs
With additional data college leaders could examine
a variety of possible explanations for why these students
did not progress beyond 60 units Additional data mdashsuch
as records of student enrollments at other institutions
from the National Student Clearinghouse or qualitative
data from interviews or focus groups with students who
stopped attendingmdashwould provide additional information
to help shape policy and practice
IHELP | THE EDUCATION TRUST | ADV ANCING BY DEGREES | APRIL 2010 10
All Degree Seekers (N = 247493)
Completed at least one college-level math course within two yearsmdash41808 (17)
Did NOT complete at least one college-level math course within two years mdash205685 (83)
No math course taken within two yearsN = 105148 (51)
Enrolled in at least one math courseN = 100537 (49)
Enrolled only in remedial mathN = 64412 (64)
Enrolled in college-level mathN = 36125 (36)
On average these students bull Enrolled in two college-level math
courses in the two yearsbull Droppedmdash65bull Failedmdash35
All Students (N=30497)
Completed 24+ credits in fi rst year19458 (638)
Did NOT complete 24+ credits in fi rst year11039 (362)
Did not attempt 24 credits in fi rst year3907 (353)
Attempted 24+ credits in fi rst year7138 (647)
On average these students bull Enrolled in 27 credits in the fi rst yearbull Dropped 122 of coursesbull Failed 203 of coursesbull Had a fi rst-year GPA of 202
AdvbyDegreesindd 11 552010 22932 PM
Figure 16 Patterns Related to Early Completion of College-Level Math (CCC Students)
bull Policies related to assessment and placement of incoming students
bull Practices related to advising and registration processes for new students
bull Policies that allow fl exibility for implementing innovative methods of course delivery
bull Practices that use innovative methods of designing and teaching remedial math courses
bull Policies related to course dropping and course repeats allocations of funding to provide incentives for course completion
bull Practices that identify struggling students early and provide academic assistance
Figure 17 Patterns Related to Early Credit Accumulation (SUSF Students)
bull Policies related to fi nancial aid fees campus employment
bull Practices related to fi nancial aid advising
bull Policies related to course dropping and course repeats and use of summer terms
bull Practices related to tutoring and other academic assistance services
IHELP | THE EDUCATION TRUST | ADV ANCING BY DEGREES | APRIL 2010 11
AdvbyDegreesindd 12 552010 22932 PM
In contrast students who earned 105 credits were well
on their way to completion and additional years of data
might reveal that some eventually completed a degree But
experience elsewhere suggests that many may well have
simply disengaged Fortunately many institutions are fi ndshy
ing these students easy to attract back to campusmdashwhen
they are invited back and their reenrollment is expedited
with attentive service Again institutions would be wise to
supplement quantitative findings of this sort with intershy
views and other information to learn what they might do
to speed the progress of these students
However even without additional data we can use
the on-track indicators in our framework to help diagshy
nose why these students failed to move beyond the initial
milestones To illustrate we compared black and Latino
students who did not earn a bachelorrsquos degree with black
and Latino students who did earn a bachelorrsquos degree on
the on-track indicators As Table 2 shows the primary
factors that distinguish students who earned a bachelorrsquos
degree from those who did not were related to credit accushy
mulation particularly completing courses and enrolling
continuously
Interestingly a higher percentage of students who did
not complete a degree took a success course than those
who did complete One likely explanation of this fi nding
is that students are either directed towards success courses
or choose to enroll in success courses if they are at higher
risk for not completing so the fi ndings refl ect enrollment
in the course more than the impact of the course We also
found that completion of gateway coursesmdashcollege-level
math and Englishmdashdid not appear to explain why these
students did not earn a bachelorrsquos degree17 A large majorshy
ity of students who did not earn a bachelorrsquos degree did
complete these courses Consequently this analysis sugshy
gests that the appropriate institutional response would be
to help students complete a higher percentage of courses
and enroll continuously Interventions might include inteshy
grating supplemental instruction into courses with high
failure rates instituting ldquoearly alertrdquo systems to identify
students having trouble in particular courses limiting the
number of course withdrawals and examining the adeshy
quacy of financial aid policies
RECOMMENDATIONS The purpose of this report is to give institutional leaders
a new set of tools for diagnosing institutional barriers to
degree completion and targeting institutional changes to
remove those barriers This section summarizes the data-
collection capacity that institutions need to use these tools
and offers a guide for using findings from analyzing the
data to improve degree completion
Data System Requirements States and institutions must be able to collect basic data
to track student progress across milestones and link that
progress to the academic patterns that indicate success or
lack thereof
Collect data on studentsrsquo course enrollments Course-enrollment data are necessary to analyze the
milestones and on-track indicators discussed in this report
Some higher education systems may only be collecting
information on whether particular students enrolled in
a specified term how many units they completed their
grade-point average or other aggregated information
about their experiences Such data are not suffi cient for
monitoring the progress and behaviors that our framework
comprises Term-by-term information on individual course
enrollments adds a level of detail about studentsrsquo patterns
of enrollment that is very useful for diagnosing where
students are falling off track which in turn points to ways
to target changes to policies and practices
Collect data to analyze important subgroups of students To ensure that all students are making progress towards
completion states and institutions should be able to
disaggregate data as follows
bull Age
bull Raceethnicity
bull Gender
bull Income
bull Academic preparation
(entrance test scores placement exam scores)
Develop data elements to match milestones and on-track indicators Table 1 on page 3 shows a good set of milestones and
on-track indicators that institutions should be able to
monitor Tracking some of the elements might require
some adjustments such as adding an element to fl ag when
IHELP | THE EDUCATION TRUST | ADV ANCING BY DEGREES | APRIL 2010 12
AdvbyDegreesindd 13 552010 22933 PM
Table 2 Analysis of Black and Latino Students Who Completed Intermediate Milestones at SUSF
Black Students Latino Students
Completed 30 credits 15 lower division courses and bachelorrsquos (n=2625)
Completed 30 credits 15 lower division courses but no bachelorrsquos (n=1315)
Completed 30 credits 15 lower division courses and bachelorrsquos (n=2460)
Completed 30 credits 15 lower division courses but no bachelorrsquos (n=751)
Gateway Courses
Completed Gateway Math
915 843 887 879
Completed Gateway English
898 941 896 955
Completed a success course
274 367 470 672
Credit Accumulation
Earned summer credits 961 859 991 911
Credit-completion ratio of gt80
926 530 944 575
Enrolled continuously 813 587 831 513 Not all students who earned a bachelorrsquos degree completed gateway English and math courses because some students earned credit for these courses through other means such as Advanced Placement
tests
a student has completed general education or has transishy
tioned from developmental to college-level coursework
Participation in the National Student Clearinghouse is also
necessary to track student transfers into other institutions
Absent that tracking a dropout cannot be distinguished
from a successful transfer
Collect data on student use of campus services and particishypation in special programs Many institutions implement special programs or services
to help students but they fail to collect student-level data
associated with those programs and services or to integrate
that information with other data Without such data it is
impossible to evaluate the effectiveness of programs and
services in improving student outcomes
Simplifying Data Collection Some of the on-track indicators that we looked at are
similar and may be interchangeable For example fi rst-year
GPA first-year credit-completion ratio and the number
of credits accumulated in the first year are all interrelated
Systems and institutions may want to reduce the number
of on-track indicators they track by eliminating those that
do not appreciably improve the statistical prediction of
completion18
For example our analysis of the data from Florida
indicated that the number of credits students earn in the
first year is an adequate predictor of completion without
adding first-year GPA and first-year credit-completion ratio
Furthermore we found that two of the fi rst-year indicashy
torsmdashcredits accumulated in the first year and completion
of college-level mathmdashpredicted completion about as well
as using all of the on-track indicators that we identifi ed
from the research literature
It is important to keep in mind while conducting this
type of analysis that results may differ from state to state
and from year to year within a state Therefore we believe
it is best to monitor more than this minimal set of on-
track indicators if institutional resources and data systems
permit such an approach19
Use Data to Target Institutional Changes Table 3 on the next page lists some specific actions institushy
tions may consider in response to findings that emerge
from their data monitoring and analysis
IHELP | THE EDUCATION TRUST | ADV ANCING BY DEGREES | APRIL 2010 13
AdvbyDegreesindd 14 552010 22933 PM
Table 3 Using Indicators of Success to Make Changes in Institutional Policies and Practices
Problem Identified Possible Changes to Policy or Practice
Remediation
Low percentage of developmental educashytion students complete remediation
bull Ensure that policies support innovative practices such as intensive summer-orientation programs for new remedial students
bull Contextualize basic-skills instruction into content courses bull Implement learning communities for developmental students bull Adopt systemwide definitions of college readiness bull Incorporate incentives for institutions to increase success in remedial coursework bull Redesign developmental courses into modules so students only repeat needed sections bull Require early completion of remedial coursework bull Provide brief brush-up courses for students who test near proficiency levels bull Enroll students in college-level courses provide supplementary instruction andor sumshy
mer sessions for nearly proficient students
Gateway courses
Low percentage of students complete bull Better align curriculum and assessment with high schools to improve college readiness college-level math course in their first year bull Require entering students to take first credit-bearing math and English courses imshy
mediately (after completing any required developmental courses)mdashor at least ensure that early advising stresses the importance of taking a math course early in the college career
Low percentage of students complete a ldquosuccessrdquo course in the first year (among part-time and older students)
bull Ensure adequate course offerings and flexible scheduling bull Better advising for new students about the advantages of such courses bull Require degree-seeking nontraditional students to enroll in a success course
Credit accumulation
Low percentage of first-year students reach a threshold of credit accumulation in their fi rst year (20-30 semester credits)
High percentage of course enrollments for which students registered late (after a course begins or within less than some number of days before a term starts)
bull Increase use of college success courses early advising and similar programs bull Improve financial aid counseling to emphasize benefits of full-time enrollment bull Charge lower per-credit fees for enrolling with a full-time credit load bull Encourage full-time attendance by providing financial aid and other incentives bull Provide financial aid for enrollment in summer terms bull For four-year students facilitate summer enrollment in community college ldquoback homerdquo bull Offer online summer courses bull Require enrollment in at least one summer term
Low credit-completion ratio in first year bull Use ldquoearly alertrdquo systems and improved tutoring services to provide more academic assistance
bull Limit course drops and repeats or impose extra fee for course withdrawal past a certain date or for repeating a course
bull Limit late registration or impose an extra fee for registering late bull Use success courses to teach students effective enrollment patterns
IHELP | THE EDUCATION TRUST | ADV ANCING BY DEGREES | APRIL 2010 14
AdvbyDegreesindd 15 552010 22933 PM
APPENDIX Table A-1 Milestone Achievement by Indicator Attainment for the CCC Cohort
Earned 12+ Earned 30+ college- college- Completed Earned
Retention Retention level level transfer Earned associate Any to second to second credits credits curriculum certifi cate degree Transferred completion
SUCCESS INDICATORS term (74) year (58) (62) (42) (17) (33) (8) (23) (29)
College-Level Math
Completed Within Two 928 867 959 834 504 32 206 531 611 Years (21)
Did Not Complete Within 701 522 554 333 99 34 53 169 220 Two Years (79)
College-Level English
Completed Within Two 914 840 924 761 379 35 170 437 512 Years (28)
Did Not Complete Within 682 495 523 304 97 33 49 162 212 Two Years (72)
Success Course
Completed (22) 837 726 766 586 261 34 118 269 345
Did Not Complete (78) 712 538 581 369 140 33 68 214 268
First-Year Credits
Earned 20+ Credits (any) 993 890 977 865 442 62 206 464 579 (24)
Did Not Earn 20 Credits 660 483 511 277 81 24 39 157 194 (any) (76)
Summer Credits
Completed Any (46) 845 754 859 676 307 49 139 365 450
Did Not Complete Any (54) 649 431 419 196 47 20 28 108 145
First-Year Credit-Completion Ratio
Completion Ratio gt80 805 666 738 520 219 45 109 278 387 (62)
Completion Ratio lt 80 634 441 433 251 82 15 30 152 146 (38)
Full-Time Attendance
Full Time in First Term (41) 816 692 783 591 273 38 123 318 389
Part Time in First Term (59) 686 503 510 297 93 30 48 169 214
On-Time Course Registration
On Time for gt80 751 603 653 463 200 38 99 261 324 of Courses (53)
On Time for lt 80 726 554 588 366 130 28 56 196 243 of Courses (47)
Continuous Enrollment
Continuously Enrolled (40) 1000 688 682 487 233 39 121 291 360
Not Continuously Enrolled 773 675 738 491 171 37 73 229 289 (60)
IHELP | THE EDUCATION TRUST | ADV ANCING BY DEGREES | APRIL 2010 15
AdvbyDegreesindd 16 552010 22933 PM
Table A-2 Milestone Achievement by Indicator Attainment for the SUSF Cohort
Completed 15 lower Completed Retention to second Retention to second Earned 30+ credits division courses baccalaureate
SUCCESS INDICATORS term (94) year (83) (85) (70) (64)
College-Level Math
Completed in First Year (58) 980 919 949 813 797
Did Not Complete in First Year (42) 878 713 709 553 416
College-Level English
Completed in First Year (84) 969 881 903 764 703
Did Not Complete in First Year (16) 782 596 582 412 318
Success Course
Completed in First Year (19) 950 845 858 749 547
Did Not Complete in First Year (81) 933 828 845 692 656
First-Year Credits
Earned 24+ Credits (64) 1000 949 977 862 782
Did Not Earn 24 Credits (36) 825 625 621 430 377
First-Year and Second-Year Credits
At Least 48 Credits (57) 999 999 1000 925 858
Less Than 48 Credits (43) 854 613 649 419 345
Summer Credits
Completed Any (83) 969 910 949 811 746
Did Not Complete Any (18) 781 462 362 191 116
First-Year Credit-Completion Ratio
Completion Ratio gt80 (72) 971 918 946 824 745
Completion Ratio lt 80 (28) 845 604 592 396 348
Full-Time Attendance
Full Time in First Term (92) 946 844 864 724 656
Part Time in First Term (8) 822 684 663 501 406
Continuous Enrollment
Continuously Enrolled (77) 1000 908 878 763 710
Not Continuously Enrolled (23) 894 729 898 628 505
IHELP | THE EDUCATION TRUST | ADV ANCING BY DEGREES | APRIL 2010 16
- - - -
- - - -
AdvbyDegreesindd 17 552010 22933 PM
REGRESSION RESULTS Using data for the CCC and SUSF systems we ran two dentsrsquo full enrollment period Dummy variables were used
logistic regression models for all students and for each of in all models to control for institutional effects For simshy
several subgroups for each cohort Each model included plicity we have included tables summarizing the fi ndings
demographic variables and the first model added fi rst-year that use a ldquo+rdquo to indicate a statistically signifi cant positive
success indicators the second model included indicators relationship and a ldquo-ldquo to indicate a statistically signifi cant
from the second year as well as indicators based on the stu- negative relationship with completion
Table A-3 Regression Models on the Likelihood of Completing a CertificateDegreeTransfer | CCC Cohort
Full-Time Part-Time All Degree Traditional Traditional Full-Time Part-Time Seekers Age Age Older Older White Asian Black Latino
First-Year Indicator Models
Demographic and Attendance Characteristics
Female + + + + + + + + +
Age 25+ shy
Asian + - + ns ns
Black ns ns - + shy
Hispanic - - - - shy
OtherUnknown RaceEthnicity ns ns ns ns ns
Ever Received BOG Waiver + + + ns + + + ns +
Full-Time (based on first term) + + + + +
Year 1 Credits Earned + + + + + + + + +
Success Indicators
First-Year GPA + + + + + + + + +
Complete Success Course + ns + + + + ns - +
First-Year Credit-Completion Ratio + + + + + + + + +
Completed College-Level Math in Year 1 + + + + + + + + +
Completed College-Level English in Year 1 + + + + + + + + +
Second-Year and Beyond Indicator Models
Demographic and Attendance Characteristics
Female + + + + ns + + + +
Age 25+ shy
Asian - - ns ns shy
Black ns ns ns - +
Hispanic - - - - shy
OtherUnknown RaceEthnicity ns ns ns ns ns
Ever Received BOG Waiver + ns + - + ns + - ns
Full Time (based on first term) + + + + +
Year 2 Credits Earned + + + + + + + + +
Success Indicators
Second-Year GPA + + + + + + + + +
Completed Success Course + + + + + + + + +
Percentage of Courses Registered Late - - - - - - - - shy
Summer Credits (yesno) + + + + + + + + +
Continuous Enrollment + + + ns ns + ns + +
+ Indicates a statistically significant (05 level or better) positive correlation between the indicator and the likelihood of completion - Indicates a statistically significant (05 level or better) negative correlation between the indicator and the likelihood of completion ns Indicates no statistically significant relationship | Shaded cells are not applicable to the student group
IHELP | THE EDUCATION TRUST | ADV ANCING BY DEGREES | APRIL 2010 17
AdvbyDegreesindd 18 552010 22934 PM
Table A-4 Regression Models on the Likelihood of Bachelorrsquos Degree Completion | SUSF Cohort
Need-Based Aid RaceEthnicity Need- No Need-
All Students Based Aid Based Aid White Black Latino Asian First-Year Indicator Models Demographic and Attendance Characteristics Female + + + Age - ns -Asian ns - ns Black - - -Hispanic ns ns ns OtherUnknown RaceEthnicity - ns -Ever Received Pell + HS GPA + + + SAT Score - - -Credit Hours at Entry + + + Success Indicators Full Time (based on first term) ns Year 1 Credits Earned + First-Year GPA + Completed CollegeCareer Success Course ns First-Year Credit-Completion Ratio ns Completed College-Level Math in Year 1 + Completed College-Level English in Year 1 ns
Year 2 Credits Earned + Second-Year GPA + Second-Year Credit-Completion Ratio + Summer Credits (yesno) + Continuous Enrollment +
ns ns + + + + ns ns ns ns + + ns ns
+ + + + + + + + + +
+ + + + - ns - ns
ns ns ns ns + + ns ns - - ns ns + + + +
ns ns ns ns + + + + + + + + ns ns ns ns ns + ns + ns + + ns ns ns ns ns
ns + + ns - ns ns ns
ns ns ns shy+ + ns ns - - ns ns + ns + +
+ + + + + + + + + + + + + + + + + + + ns
Second-Year and Beyond Indicator Models Demographic and Attendance Characteristics Female + + + Age - ns -Asian - - ns Black - - -Hispanic ns ns ns OtherUnknown RaceEthnicity ns ns ns Ever Received Need-Based Aid ns HS GPA + + + SAT Score - - -Credit Hours at Entry + + + Success Indicators
+ Indicates a statistically significant (05 level or better) positive correlation between the indicator and the likelihood of completion - Indicates a statistically significant (05 level or better) negative correlation between the indicator and the likelihood of completion ns Indicates no statistically significant relationship | Shaded cells are not applicable to the student group
Note Some of the first-year indicators were not statistically significant However this was because of the strong relationships between the indicashytors and the comparatively smaller sample (the CCC cohort was more than eight times as large) When separate models were run for each indicashytor and the demographic and attendance characteristics all of the first-year indicators were significant positively related to completion
IHELP | THE EDUCATION TRUST | ADV ANCING BY DEGREES | APRIL 2010 18
AdvbyDegreesindd 19 552010 22934 PM
ANALYSES TO SIMPLIFY DATA COLLECTION WHILE PREDICTING SUCCESS In order to choose a subset of predictors we compared
several models using the first-year predictors from the
Florida data in terms of practical and statistical signifi shy
cance Specifically we compared models in terms of statisshy
tical significance on the basis of the change in the likelishy
hood-ratio statistic and compared the practical signifi cance
of the models using an approximation of the R2 statistic in
linear regression the correlation between the observed
outcome and the predicted probability of the outcome20
We also examined the statistical significance of the indishy
vidual predictors in the model using the Wald statistic and
the practical significance by looking at the size of the odds
ratio associated with the predictor
We found that each predictor or set of predictors we
added to the model resulted in a statistically signifi cant
improvement in the fit of the model However we found
that one or two predictors were about as useful in predictshy
ing completion as including additional predictors Table
A-5 shows the summary statistics for three of the models
we examined As shown the model that only included
Year 1 credits earned as a predictor was nearly as useful for
predicting completion as a model that included all of the
first-year predictors Although adding completion of math
in the first year did not lead to a dramatic improvement
in the ability of the model to predict completion the size
of the odds ratio suggests that it is practically signifi cant
Therefore the data from this cohort of students in Floridarsquos
four-year system suggest that tracking only fi rst-year credits
earned or tracking first-year credits earned and completion
of math in the first year would be nearly as useful as trackshy
ing all four predictors We found similar results with the
data from the California Community Colleges
Table A-5 Comparison of Three First-Year Predictor Models on Summary Measures of Model Fit
Squared Correlation Between VARIABLES INCLUDED IN MODEL Predicted and Observed df -2 LL
Florida
Background Characteristics + Year 1 Credits Earned 0278 20 2980117
Background Characteristics + All 0304 23 2894586 Year 1 Credit-Accumulation Predictors
Background Characteristics + Year 1 Credits Earned + Completed College-Level Math in Year 1
0282 21 2966201
Background Characteristics + All 0306 26 2887379 Year 1 Predictors
California
Background Characteristics + Year 1 Credits Earned 0180 124 21625726
Background Characteristics + All Year 1 Credit-Accumulation Predictors
0201 127 21188628
Background Characteristics + Year 1 Credits Earned + 0192 125 21392214 Completed College-Level Math in Year 1
Background Characteristics + All Year 1 Predictors
0218 130 20843276
IHELP | THE EDUCATION TRUST | ADV ANCING BY DEGREES | APRIL 2010 19
AdvbyDegreesindd 20 552010 22934 PM
NOTES 1 For a literature review titled ldquoStudent Progress Toward Degree English by Year 1rdquo it would seriously understate the importance
Completion Lessons From the Research Literaturerdquo visit wwwcsus of that indicator in predicting degree completion since these eduihepublications students did earn college-level credits Instead we have counted
2 Horn L amp Lew S (2007) ldquoCalifornia Community College Transshyfer Rates Who is Counted Makes a Differencerdquo Berkeley Calif MPR Associates Inc
those students in the ldquoyesrdquo group (completing CL mathEnglish by end of Year 1) Unfortunately we cannot identify those students who entered with those prior college credits but who did not graduate Such students are unavoidably counted as not having
3 For example see Marcotte DE (2006) ldquoThe Earnings Effect of completed college-level Englishmath by Year 1 because we have Education at Community Collegesrdquo Baltimore University of no way to identify them and move them to the ldquoyesrdquo column Maryland Since the overall Florida graduation rate is 64 percent we believe it
4 We recognize that transferring to a university is not really ldquocompletionrdquogiven that the goal of those students is a bachelorrsquos degree and many students do not complete an associate degree before transferring (81 percent of transfers in the CCC cohort did not earn an associate degree) However transfer is commonly used as a completion measure for community colleges We were not able to track student outcomes after transfer but we recognize that a substantial number of students who transfer to universities do
is safe to assume that the rate is far higher for students who enter the university having completed college-level English andor math Therefore the number of students miscategorized as ldquonordquo should be relatively small (since it is limited to those who came in with college credit but did not graduate in eight years) This unavoidshyable error does overstate the positive impact of taking mathEngshylish by the first year on graduation rates but we are convinced that it is an important indicator of success since before making this
not ultimately earn a baccalaureate adjustment completion of college-level math and college-level English were statistically significant predictors of completion
5 For example see Adelman C (2005) ldquoMoving Into Town and Moving On The Community College In The Lives of Traditional-Aged Studentsrdquo Washington DC US Department of Education Achieving the Dream Cross-State Data Work Group (2008) Test drive Six states pilot better ways to measure and compare comshymunity college performance Boston Jobs for the Future
10 It could be the case that success courses in the CCC are aimed at students with more risk factors complicating the relationship of taking a success course and completion Also the CCC does not have a code to identify success courses so we relied on a combinashytion of Taxonomy of Program (TOP ) code and course title We could have misclassified some courses affecting the results Better
6 The University of California (UC ) and California State University data are needed to accurately identify these courses (CSU) generally require students to finish all transfer requireshyments at the CCC before moving on to one of their campuses Some lower division transfers are accepted at UC CSU campuses that have enrollment space available but lower division transfer students must have completed the 15-course college-preparatory curriculum required for freshman admission (known as A-G) while in high school or must have made up the defi ciencies while attending a CCC Some campuses impose other requirements on lower division transfers and some take no lower division transfers at all
11 We broke these results down by university because for this indicashytor aggregating across universities misrepresented the relationship Specifically aggregating the data across institutions resulted in a higher rate of degree completion for students who did not take a success course than for students who did take a success course This reversal of the relationship occurred because very few students completed a success course at two of the largest universities and these universities had relatively high graduation rates The effect of this was to inflate the overall number of students who did not take a success course and graduated Furthermore the small
7 There is little remediation done in the SUSF Florida students who number of students at some universities can lead to some unlikely require developmental courses are generally referred to commushy findings such as the 100 percent completion rate for students takshynity colleges for those courses and no records of course enrollshy ing a success course in University 5 The perfect completion rate ments or outcomes are included in the SUSF data The CCC data occurred because only two students who first attended University do not include any information on assessment tests or placement 5 completed a success course in their first year and both happened recommendations in order to identify students who need remediashy to complete tion The CCC data do include information on remedial course enrollments but course enrollment does not serve as a valid proxy for ldquoneedrdquo for remediation Many students who need remediation fail to enroll in developmental courses and are therefore misclassishyfied as college ready The result is an overestimate of the success of ldquoremedialrdquo students and an underestimate of the success of ldquocolshy
12 The different credit thresholds reflect the different students served by these types of institutions (that is community colleges have a larger percentage of part-time students than is typically found in four-year institutions and more students who are not college-ready and require remediation)
lege readyrdquo students This problem has also been noted by other 13 On average SUSF students who did not earn any summer credits researchers using data from other state community college systems were enrolled for less than four terms (fallspring) while students (Achieving the Dream Cross-State Data Work Group 2008) who did earn summer credits were enrolled for an average of more
8 Adelman C ldquoProposed Amendment for the Student Right-Toshy than eight terms
Know and Campus Security Act of 1990rdquo (PL 101-542) to produce 14 Adelman C (2006) ldquoThe Toolbox Revisited Paths To Degree a full and honest account of college completion rates Obtained Completion From High School Through Collegerdquo Washington through personal communication on June 2 2008 DC National Center for Education Statistics
9 Students in Floridarsquos public universities must earn college-level 15 A smaller sample size for Asians (5 percent of the sample was credits in English and math in order to earn a bachelorrsquos degree Asian) limited the ability to detect the relationship and could but they can earn those credits while in high school (for example explain the lack of relationship between continuous enrollment Advanced Placement exams) In this cohort there were several and completion for Asian students thousand students who earned a bachelors degree but never enrolled in college-level math or English at the university If we counted those students as ldquonot completing college-level math
16 Some courses in the CCC are offered on a compressed schedule and may start sometime after the beginning of the term Unforshytunately there is no indication in the data for ldquolate startrdquo courses
IHELP | THE EDUCATION TRUST | ADVANCING BY DEGREES | APRIL 2010 20
AdvbyDegreesindd 21 552010 22934 PM
With input from internal CCC researchers rules were developed for identifying circumstances where registrations that occurred more than a certain number of days into the term were probably an indication of ldquolate startrdquo courses These were excluded from the analyses Data were not available to measure late course regisshytration for the SUSF cohort Other research has found that late registrants have higher course-withdrawal rates which would affect credit accumulation (Freer-Weiss D [2004] ldquoCommunity College Freshmen Last In First Out Journal of College Student Retentionrdquo 6[2] 137-154)
17 We modified the gateway-course completion indicators to cover the entire period of enrollment instead of just the first year We were interested in finding out whether failure to complete these courses at any time during their college careers was preventing students from earning a bachelorrsquos degree
18 This can be done by examining measures of practical and statistishycal significance of individual predictors and the overall model See the appendix for details on this analysis
19 An additional concern is that fitting multiple regression models to the data in order to reduce the number of predictors of success runs the risk of choosing a subset of predictors based on some random aspect of the sample cohort
20 See Hosmer D W and Lemeshow S (2000) ldquoApplied Logisshytic Regressionrdquo 2nd ed New York John Wiley amp Sons Inc for a discussion of summary measures that approximate variance explained
IHELP | THE EDUCATION TRUST | ADVANCING BY DEGREES | APRIL 2010 21
AdvbyDegreesindd 22 552010 22934 PM
22 IHELP | THE EDUCATION TRUST | ADVANCING BY DEGREES | APRIL 2010
AdvbyDegreesindd c4 552010 22843 PM
ABOUT THE INSTITUTE FOR HIGHER EDUCATION LEADERSHIP amp POLICY
The Institute for Higher Education Leadership amp Policy seeks to enhance
leadership and policy for higher education in California and the nation by
producing research and services for policymakers practitioners and educators
ABOUT THE EDUCATION TRUST
The Education Trust promotes high academic achievement for all students
at all levelsmdashpre-kindergarten through college We work alongside parents
educators and community and business leaders across the country in
transforming schools and colleges into institutions that serve all students
well Lessons learned in these efforts together with unflinching data analyses
shape our state and national policy agendas Our goal is to close the gaps
in opportunity and achievement that consign far too many young peoplemdash
especially those who are black Latino American Indian or from low-income
familiesmdashto lives on the margins of the American mainstream
IHELP and The Education Trust are grateful to the Bill amp Melinda Gates
Foundation and Lumina Foundation for Education for their generous
support The views expressed in this report do not necessarily represent
those of either organization its officers or its employees
6000 J STREET SACRAMENTO CALIF 95819 1250 H STREET NW SUITE 700 WASHINGTON D C 20005
T 916278-3888 F 916278-3907 WWWCSUSEDUIHELP T 202293-1217 F 202293-2605 WWWEDTRUST ORG
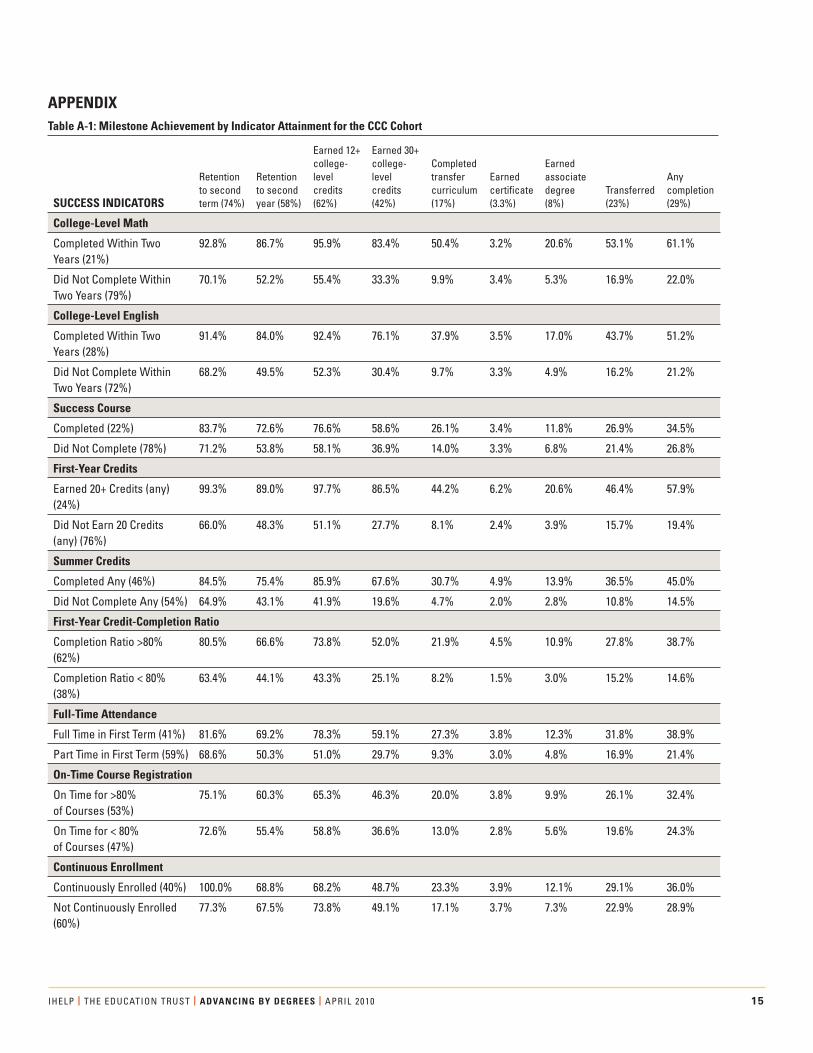

- - - -
- - - -
AdvbyDegreesindd 17 552010 22933 PM
REGRESSION RESULTS Using data for the CCC and SUSF systems we ran two dentsrsquo full enrollment period Dummy variables were used
logistic regression models for all students and for each of in all models to control for institutional effects For simshy
several subgroups for each cohort Each model included plicity we have included tables summarizing the fi ndings
demographic variables and the first model added fi rst-year that use a ldquo+rdquo to indicate a statistically signifi cant positive
success indicators the second model included indicators relationship and a ldquo-ldquo to indicate a statistically signifi cant
from the second year as well as indicators based on the stu- negative relationship with completion
Table A-3 Regression Models on the Likelihood of Completing a CertificateDegreeTransfer | CCC Cohort
Full-Time Part-Time All Degree Traditional Traditional Full-Time Part-Time Seekers Age Age Older Older White Asian Black Latino
First-Year Indicator Models
Demographic and Attendance Characteristics
Female + + + + + + + + +
Age 25+ shy
Asian + - + ns ns
Black ns ns - + shy
Hispanic - - - - shy
OtherUnknown RaceEthnicity ns ns ns ns ns
Ever Received BOG Waiver + + + ns + + + ns +
Full-Time (based on first term) + + + + +
Year 1 Credits Earned + + + + + + + + +
Success Indicators
First-Year GPA + + + + + + + + +
Complete Success Course + ns + + + + ns - +
First-Year Credit-Completion Ratio + + + + + + + + +
Completed College-Level Math in Year 1 + + + + + + + + +
Completed College-Level English in Year 1 + + + + + + + + +
Second-Year and Beyond Indicator Models
Demographic and Attendance Characteristics
Female + + + + ns + + + +
Age 25+ shy
Asian - - ns ns shy
Black ns ns ns - +
Hispanic - - - - shy
OtherUnknown RaceEthnicity ns ns ns ns ns
Ever Received BOG Waiver + ns + - + ns + - ns
Full Time (based on first term) + + + + +
Year 2 Credits Earned + + + + + + + + +
Success Indicators
Second-Year GPA + + + + + + + + +
Completed Success Course + + + + + + + + +
Percentage of Courses Registered Late - - - - - - - - shy
Summer Credits (yesno) + + + + + + + + +
Continuous Enrollment + + + ns ns + ns + +
+ Indicates a statistically significant (05 level or better) positive correlation between the indicator and the likelihood of completion - Indicates a statistically significant (05 level or better) negative correlation between the indicator and the likelihood of completion ns Indicates no statistically significant relationship | Shaded cells are not applicable to the student group
IHELP | THE EDUCATION TRUST | ADV ANCING BY DEGREES | APRIL 2010 17
AdvbyDegreesindd 18 552010 22934 PM
Table A-4 Regression Models on the Likelihood of Bachelorrsquos Degree Completion | SUSF Cohort
Need-Based Aid RaceEthnicity Need- No Need-
All Students Based Aid Based Aid White Black Latino Asian First-Year Indicator Models Demographic and Attendance Characteristics Female + + + Age - ns -Asian ns - ns Black - - -Hispanic ns ns ns OtherUnknown RaceEthnicity - ns -Ever Received Pell + HS GPA + + + SAT Score - - -Credit Hours at Entry + + + Success Indicators Full Time (based on first term) ns Year 1 Credits Earned + First-Year GPA + Completed CollegeCareer Success Course ns First-Year Credit-Completion Ratio ns Completed College-Level Math in Year 1 + Completed College-Level English in Year 1 ns
Year 2 Credits Earned + Second-Year GPA + Second-Year Credit-Completion Ratio + Summer Credits (yesno) + Continuous Enrollment +
ns ns + + + + ns ns ns ns + + ns ns
+ + + + + + + + + +
+ + + + - ns - ns
ns ns ns ns + + ns ns - - ns ns + + + +
ns ns ns ns + + + + + + + + ns ns ns ns ns + ns + ns + + ns ns ns ns ns
ns + + ns - ns ns ns
ns ns ns shy+ + ns ns - - ns ns + ns + +
+ + + + + + + + + + + + + + + + + + + ns
Second-Year and Beyond Indicator Models Demographic and Attendance Characteristics Female + + + Age - ns -Asian - - ns Black - - -Hispanic ns ns ns OtherUnknown RaceEthnicity ns ns ns Ever Received Need-Based Aid ns HS GPA + + + SAT Score - - -Credit Hours at Entry + + + Success Indicators
+ Indicates a statistically significant (05 level or better) positive correlation between the indicator and the likelihood of completion - Indicates a statistically significant (05 level or better) negative correlation between the indicator and the likelihood of completion ns Indicates no statistically significant relationship | Shaded cells are not applicable to the student group
Note Some of the first-year indicators were not statistically significant However this was because of the strong relationships between the indicashytors and the comparatively smaller sample (the CCC cohort was more than eight times as large) When separate models were run for each indicashytor and the demographic and attendance characteristics all of the first-year indicators were significant positively related to completion
IHELP | THE EDUCATION TRUST | ADV ANCING BY DEGREES | APRIL 2010 18
AdvbyDegreesindd 19 552010 22934 PM
ANALYSES TO SIMPLIFY DATA COLLECTION WHILE PREDICTING SUCCESS In order to choose a subset of predictors we compared
several models using the first-year predictors from the
Florida data in terms of practical and statistical signifi shy
cance Specifically we compared models in terms of statisshy
tical significance on the basis of the change in the likelishy
hood-ratio statistic and compared the practical signifi cance
of the models using an approximation of the R2 statistic in
linear regression the correlation between the observed
outcome and the predicted probability of the outcome20
We also examined the statistical significance of the indishy
vidual predictors in the model using the Wald statistic and
the practical significance by looking at the size of the odds
ratio associated with the predictor
We found that each predictor or set of predictors we
added to the model resulted in a statistically signifi cant
improvement in the fit of the model However we found
that one or two predictors were about as useful in predictshy
ing completion as including additional predictors Table
A-5 shows the summary statistics for three of the models
we examined As shown the model that only included
Year 1 credits earned as a predictor was nearly as useful for
predicting completion as a model that included all of the
first-year predictors Although adding completion of math
in the first year did not lead to a dramatic improvement
in the ability of the model to predict completion the size
of the odds ratio suggests that it is practically signifi cant
Therefore the data from this cohort of students in Floridarsquos
four-year system suggest that tracking only fi rst-year credits
earned or tracking first-year credits earned and completion
of math in the first year would be nearly as useful as trackshy
ing all four predictors We found similar results with the
data from the California Community Colleges
Table A-5 Comparison of Three First-Year Predictor Models on Summary Measures of Model Fit
Squared Correlation Between VARIABLES INCLUDED IN MODEL Predicted and Observed df -2 LL
Florida
Background Characteristics + Year 1 Credits Earned 0278 20 2980117
Background Characteristics + All 0304 23 2894586 Year 1 Credit-Accumulation Predictors
Background Characteristics + Year 1 Credits Earned + Completed College-Level Math in Year 1
0282 21 2966201
Background Characteristics + All 0306 26 2887379 Year 1 Predictors
California
Background Characteristics + Year 1 Credits Earned 0180 124 21625726
Background Characteristics + All Year 1 Credit-Accumulation Predictors
0201 127 21188628
Background Characteristics + Year 1 Credits Earned + 0192 125 21392214 Completed College-Level Math in Year 1
Background Characteristics + All Year 1 Predictors
0218 130 20843276
IHELP | THE EDUCATION TRUST | ADV ANCING BY DEGREES | APRIL 2010 19
AdvbyDegreesindd 20 552010 22934 PM
NOTES 1 For a literature review titled ldquoStudent Progress Toward Degree English by Year 1rdquo it would seriously understate the importance
Completion Lessons From the Research Literaturerdquo visit wwwcsus of that indicator in predicting degree completion since these eduihepublications students did earn college-level credits Instead we have counted
2 Horn L amp Lew S (2007) ldquoCalifornia Community College Transshyfer Rates Who is Counted Makes a Differencerdquo Berkeley Calif MPR Associates Inc
those students in the ldquoyesrdquo group (completing CL mathEnglish by end of Year 1) Unfortunately we cannot identify those students who entered with those prior college credits but who did not graduate Such students are unavoidably counted as not having
3 For example see Marcotte DE (2006) ldquoThe Earnings Effect of completed college-level Englishmath by Year 1 because we have Education at Community Collegesrdquo Baltimore University of no way to identify them and move them to the ldquoyesrdquo column Maryland Since the overall Florida graduation rate is 64 percent we believe it
4 We recognize that transferring to a university is not really ldquocompletionrdquogiven that the goal of those students is a bachelorrsquos degree and many students do not complete an associate degree before transferring (81 percent of transfers in the CCC cohort did not earn an associate degree) However transfer is commonly used as a completion measure for community colleges We were not able to track student outcomes after transfer but we recognize that a substantial number of students who transfer to universities do
is safe to assume that the rate is far higher for students who enter the university having completed college-level English andor math Therefore the number of students miscategorized as ldquonordquo should be relatively small (since it is limited to those who came in with college credit but did not graduate in eight years) This unavoidshyable error does overstate the positive impact of taking mathEngshylish by the first year on graduation rates but we are convinced that it is an important indicator of success since before making this
not ultimately earn a baccalaureate adjustment completion of college-level math and college-level English were statistically significant predictors of completion
5 For example see Adelman C (2005) ldquoMoving Into Town and Moving On The Community College In The Lives of Traditional-Aged Studentsrdquo Washington DC US Department of Education Achieving the Dream Cross-State Data Work Group (2008) Test drive Six states pilot better ways to measure and compare comshymunity college performance Boston Jobs for the Future
10 It could be the case that success courses in the CCC are aimed at students with more risk factors complicating the relationship of taking a success course and completion Also the CCC does not have a code to identify success courses so we relied on a combinashytion of Taxonomy of Program (TOP ) code and course title We could have misclassified some courses affecting the results Better
6 The University of California (UC ) and California State University data are needed to accurately identify these courses (CSU) generally require students to finish all transfer requireshyments at the CCC before moving on to one of their campuses Some lower division transfers are accepted at UC CSU campuses that have enrollment space available but lower division transfer students must have completed the 15-course college-preparatory curriculum required for freshman admission (known as A-G) while in high school or must have made up the defi ciencies while attending a CCC Some campuses impose other requirements on lower division transfers and some take no lower division transfers at all
11 We broke these results down by university because for this indicashytor aggregating across universities misrepresented the relationship Specifically aggregating the data across institutions resulted in a higher rate of degree completion for students who did not take a success course than for students who did take a success course This reversal of the relationship occurred because very few students completed a success course at two of the largest universities and these universities had relatively high graduation rates The effect of this was to inflate the overall number of students who did not take a success course and graduated Furthermore the small
7 There is little remediation done in the SUSF Florida students who number of students at some universities can lead to some unlikely require developmental courses are generally referred to commushy findings such as the 100 percent completion rate for students takshynity colleges for those courses and no records of course enrollshy ing a success course in University 5 The perfect completion rate ments or outcomes are included in the SUSF data The CCC data occurred because only two students who first attended University do not include any information on assessment tests or placement 5 completed a success course in their first year and both happened recommendations in order to identify students who need remediashy to complete tion The CCC data do include information on remedial course enrollments but course enrollment does not serve as a valid proxy for ldquoneedrdquo for remediation Many students who need remediation fail to enroll in developmental courses and are therefore misclassishyfied as college ready The result is an overestimate of the success of ldquoremedialrdquo students and an underestimate of the success of ldquocolshy
12 The different credit thresholds reflect the different students served by these types of institutions (that is community colleges have a larger percentage of part-time students than is typically found in four-year institutions and more students who are not college-ready and require remediation)
lege readyrdquo students This problem has also been noted by other 13 On average SUSF students who did not earn any summer credits researchers using data from other state community college systems were enrolled for less than four terms (fallspring) while students (Achieving the Dream Cross-State Data Work Group 2008) who did earn summer credits were enrolled for an average of more
8 Adelman C ldquoProposed Amendment for the Student Right-Toshy than eight terms
Know and Campus Security Act of 1990rdquo (PL 101-542) to produce 14 Adelman C (2006) ldquoThe Toolbox Revisited Paths To Degree a full and honest account of college completion rates Obtained Completion From High School Through Collegerdquo Washington through personal communication on June 2 2008 DC National Center for Education Statistics
9 Students in Floridarsquos public universities must earn college-level 15 A smaller sample size for Asians (5 percent of the sample was credits in English and math in order to earn a bachelorrsquos degree Asian) limited the ability to detect the relationship and could but they can earn those credits while in high school (for example explain the lack of relationship between continuous enrollment Advanced Placement exams) In this cohort there were several and completion for Asian students thousand students who earned a bachelors degree but never enrolled in college-level math or English at the university If we counted those students as ldquonot completing college-level math
16 Some courses in the CCC are offered on a compressed schedule and may start sometime after the beginning of the term Unforshytunately there is no indication in the data for ldquolate startrdquo courses
IHELP | THE EDUCATION TRUST | ADVANCING BY DEGREES | APRIL 2010 20
AdvbyDegreesindd 21 552010 22934 PM
With input from internal CCC researchers rules were developed for identifying circumstances where registrations that occurred more than a certain number of days into the term were probably an indication of ldquolate startrdquo courses These were excluded from the analyses Data were not available to measure late course regisshytration for the SUSF cohort Other research has found that late registrants have higher course-withdrawal rates which would affect credit accumulation (Freer-Weiss D [2004] ldquoCommunity College Freshmen Last In First Out Journal of College Student Retentionrdquo 6[2] 137-154)
17 We modified the gateway-course completion indicators to cover the entire period of enrollment instead of just the first year We were interested in finding out whether failure to complete these courses at any time during their college careers was preventing students from earning a bachelorrsquos degree
18 This can be done by examining measures of practical and statistishycal significance of individual predictors and the overall model See the appendix for details on this analysis
19 An additional concern is that fitting multiple regression models to the data in order to reduce the number of predictors of success runs the risk of choosing a subset of predictors based on some random aspect of the sample cohort
20 See Hosmer D W and Lemeshow S (2000) ldquoApplied Logisshytic Regressionrdquo 2nd ed New York John Wiley amp Sons Inc for a discussion of summary measures that approximate variance explained
IHELP | THE EDUCATION TRUST | ADVANCING BY DEGREES | APRIL 2010 21
AdvbyDegreesindd 22 552010 22934 PM
22 IHELP | THE EDUCATION TRUST | ADVANCING BY DEGREES | APRIL 2010
AdvbyDegreesindd c4 552010 22843 PM
ABOUT THE INSTITUTE FOR HIGHER EDUCATION LEADERSHIP amp POLICY
The Institute for Higher Education Leadership amp Policy seeks to enhance
leadership and policy for higher education in California and the nation by
producing research and services for policymakers practitioners and educators
ABOUT THE EDUCATION TRUST
The Education Trust promotes high academic achievement for all students
at all levelsmdashpre-kindergarten through college We work alongside parents
educators and community and business leaders across the country in
transforming schools and colleges into institutions that serve all students
well Lessons learned in these efforts together with unflinching data analyses
shape our state and national policy agendas Our goal is to close the gaps
in opportunity and achievement that consign far too many young peoplemdash
especially those who are black Latino American Indian or from low-income
familiesmdashto lives on the margins of the American mainstream
IHELP and The Education Trust are grateful to the Bill amp Melinda Gates
Foundation and Lumina Foundation for Education for their generous
support The views expressed in this report do not necessarily represent
those of either organization its officers or its employees
6000 J STREET SACRAMENTO CALIF 95819 1250 H STREET NW SUITE 700 WASHINGTON D C 20005
T 916278-3888 F 916278-3907 WWWCSUSEDUIHELP T 202293-1217 F 202293-2605 WWWEDTRUST ORG
Recommended