Noise and Vibration Impact Assessment
Technical Report
HIGH-CUBE WAREHOUSE /
DISTRIBUTION CENTER
BLOOMINGTON, CA
March 25, 2015 DRAFT
Prepared for:
Golden Springs Development Company
13116 Imperial Highway
Santa Fe Springs, CA 90670
Prepared by:
dBF Associates, Inc.
9909 Huennekens Street, Suite 206
San Diego, CA 92121
619-609-0712
dBF Associates, Inc. 2015
TABLE OF CONTENTS
i
1.0 Introduction and Summary ................................................................................................ 1
1.1 Project Description ........................................................................................................................ 3 1.2 Noise Descriptors .......................................................................................................................... 4 1.3 Vibration Descriptors .................................................................................................................... 8
2.0 Impact Criteria .................................................................................................................... 9
2.1 San Bernardino County Development Code ................................................................................. 9
3.0 Existing Noise Environment ............................................................................................ 14
3.1 Sound Level Measurements ........................................................................................................ 14
4.0 Impacts ............................................................................................................................. 17
4.1 Significance Criteria .................................................................................................................... 17 4.2 Operation ..................................................................................................................................... 17 4.3 Construction ................................................................................................................................ 24 4.4 Mitigation .................................................................................................................................... 27
5.0 References........................................................................................................................ 28
Tables
Table 1. Sound Levels of Typical Noise Sources and Noise Environments ................................................. 7 Table 2. Reaction of People and Damage to Buildings at Various Continuous Vibration Levels ................ 8 Table 3. Sound Level Measurements (dBA) ............................................................................................... 15 Table 4. Modeled Vehicle Speeds and P.M. Peak-Hour Volumes ............................................................. 22 Table 5. Traffic-Related Noise Levels along Project Roadways (dBA CNEL) .......................................... 23 Table 6. Construction Equipment Vibration Source Levels ....................................................................... 25
Figures
Figure 1. Vicinity Map .................................................................................................................................. 2 Figure 2. Sound Level Measurement Locations ......................................................................................... 16 Figure 3. Conceptual Mechanical Layout / Project-Generated Noise Levels (Leq) ................................... 20 Figure 4. Typical Construction Noise Levels ............................................................................................. 26
Appendices
Appendix A. Mechanical Equipment
1
1.0 INTRODUCTION AND SUMMARY
This Noise and Vibration Impact Assessment Technical Report assesses potential operational and
construction noise and vibration impacts associated with the proposed High-Cube Warehouse /
Distribution Center project. The applicant proposes to entitle the construction and operation of a high-
cube warehouse building on an approximate 28.95-acre project site at the northwest and northeast corners
of Cedar Avenue and Orange Street in the Bloomington area of unincorporated San Bernardino County,
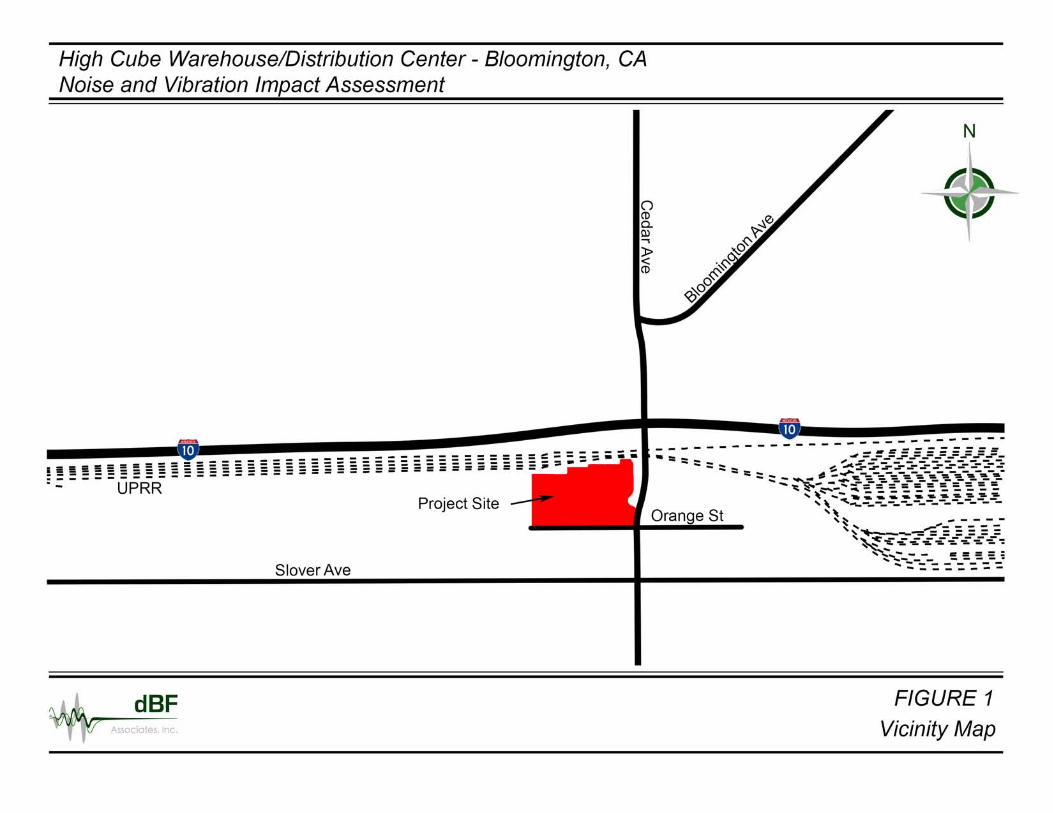
California. The project vicinity is shown on Figure 1.
A project site reconnaissance was performed to identify noise-sensitive receptors and to conduct sound
level measurements. Noise-sensitive land uses potentially affected by the project consist of single-family
residential and school properties across Orange Street to the south of the project site. Sound level
measurements were conducted to estimate existing ambient noise levels near noise-sensitive locations in
the project vicinity.
Onsite operational noise levels at property lines of nearby noise-sensitive receptors were estimated using
the Cadna/A noise model, using operational parameters obtained from the applicant and a conceptual
mechanical layout. Operational noise impacts as a result of the project would be less than significant.
Offsite traffic noise level increases were estimated using the Federal Highway Administration (FHWA)
Traffic Noise Model (TNM) version 2.5. Traffic volumes were obtained from the project traffic impact
study. Traffic noise impacts as a result of the project would be less than significant.
Operation of the project would generate vibration levels below the allowable limit at vibration-sensitive
receptors in the project area. Operational vibration impacts as a result of the project would be less than
significant.
Construction of the project would generate a temporary increase in noise at noise-sensitive receptors in
the project area. Construction noise impacts as a result of the project would be less than significant.
Construction of the project would generate vibration levels below the allowable limit at vibration-
sensitive receptors in the project area. Construction vibration impacts as a result of the project would be
less than significant.
3
1.1 PROJECT DESCRIPTION
1.1.1 Project Location
The project site is comprised of one parcel located northwest of the intersection of Cedar Avenue at
Orange Street in the community of Bloomington in unincorporated San Bernardino County, California.
The parcel (Assessor Parcel Map [APN] 0253-171-16) is located northwest of the intersection of Cedar
Avenue at Orange Street. The parcel is generally bounded to the north by vacant property, Union Pacific
Railroad (UPRR) tracks, and Interstate 10 (I-10); to the south by Orange Street; to the east by Cedar Place
and Cedar Avenue; and to the west by Linden Avenue.
1.1.2 Existing Site Conditions
The project site is relatively flat, with a slope of less than two percent, and ranges in elevation from north
to south from approximately 1,090 feet above mean sea level (msl) to approximately 1,077 feet above
msl. The project site is vacant, with no structures.
1.1.3 Surrounding Land Uses
The following land uses border the project site:
North: Fenced parcel with manufactured building owned by the West San Bernardino County
Water District facility; Union Pacific Rail Company railroad tracks; I-10 is located north of the
railroad property.
South: Orange Avenue is the southern boundary. To the south of Orange Avenue are single-
family residences. The property on the southwest corner of the intersection of Cedar Avenue at
Orange Street is vacant.
East: Cedar Place, which is an unmaintained road that provides access to the West San
Bernardino County Water District property. Cedar Avenue is east of Cedar Place.
West: Freight transfer facility with three industrial buildings and a proposed high-cube
warehouse.
1.1.4 Project Description
As proposed, the project would allow for the construction and operation of a 371,000(±)-sf high-cube
warehouse building on an approximate 19.14-acre project site northwest of the intersection of Cedar
Avenue at Orange Street. The project site parcel is zoned Community Industrial (IC).
High-cube warehouses or distribution centers are primarily for the storage and/or consolidation of
manufactured goods (and to a lesser extent, raw materials) prior to their distribution to retail locations or
other warehouses. These facilities are generally very large buildings characterized by a small employment
count due to a high level of automation, and truck activities are frequently outside of the peak hour of the
adjacent street system.
4
The building is a rectangular structure (approximately 1,022 feet long east-to-west and 354 feet wide
north-to-south) and is symmetrical along both the north/south and east/west axes. The building is a cross-
dock facility with vertical-lift dock-high roll up doors. Truck maneuvering and staging would be located
along the north and south sides of the building to allow access for the loading and unloading of products
from trucks/trailers. The warehouse doors and staging areas are accessible to trucks through
ingress/egress drive aisles. There would be up to 84 dock doors: 35 dock doors on the northern side of the
warehouse and 49 dock doors on the southern side of the warehouse. There would be two 5,000-sf offices,
at the southeast and southwest corners of the building. The building would be a concrete tilt-up structure
with a height of approximately 42-46 feet above grade.
With respect to operations, the analysis presented in this report assumes that the facility could operate
seven days per week in two eight-hour shifts. The estimated number of employees would be 100.
Access into and out of the project site would be provided from four driveways: (1) Cedar Place via Cedar
Street; (2) Orange Street; and (3 and 4) Linden Avenue. Both auto and truck traffic would be permitted at
these locations. 161 automobile parking spaces would be provided.
All truck and staging areas would be screened with 14-foot-high concrete tilt-up walls to obscure the
visibility of these areas from public view.
Total grading for the project is estimated to be approximately 89,000 cubic yards (cy) of raw cut and
75,000 cy of raw fill. Accounting for over-excavation, shrinkage, and subsidence, the combined
properties are expected to balance.
Construction is expected to begin in December 2015. The expected duration of construction is 8 months.
The project would be developed in one phase. The expected project opening year is 2016.
1.2 NOISE DESCRIPTORS
Noise is generally defined as loud, unpleasant, unexpected, or undesired sound that is typically associated
with human activity and that interferes with or disrupts normal activities. Human environments are
characterized by a generally consistent noise level which varies with each area. This is called ambient
noise. Although exposure to high noise levels has been demonstrated to cause hearing loss, the principal
human response to environmental noise is annoyance. The response of individuals to similar noise events
is diverse and influenced by the type of noise, perceived importance of the noise and its appropriateness
in the setting, time of day and type of activity during which the noise occurs, sensitivity of the individual,
and change from ambient conditions.
Sound is a physical phenomenon consisting of minute vibrations that travel through a medium, such as
air, and are sensed by the human ear. Sound is generally characterized by several variables, including
frequency and intensity. Frequency describes the sound’s pitch and is measured in cycles per second, or
hertz (Hz), whereas intensity describes the sound’s loudness and is measured in decibels (dB). Decibels
are measured using a logarithmic scale. A sound level of 0 dB is approximately the threshold of human
hearing and is barely audible under extremely quiet listening conditions. Normal speech has a sound level
5
of approximately 60 dB. Sound levels above about 120 dB begin to be felt inside the human ear as
discomfort and eventually as pain at still higher levels. The minimum change in the sound level of
individual events that an average human ear can detect is about 3 dB. The average person perceives a
change in sound level of about 10 dB as a doubling (or halving) of the sound’s loudness; this relation
holds true for sounds of any loudness. Sound levels of typical noise sources and environments are
provided in Table 1.
Because of the logarithmic nature of the decibel unit, sound levels cannot be added or subtracted directly
and are somewhat cumbersome to handle mathematically. A simple rule is useful, however, in dealing
with sound levels: if a sound’s intensity is doubled, the sound level increases by 3 dB, regardless of the
initial sound level. Thus, for example, 60 dB + 60 dB = 63 dB, and 80 dB + 80 dB = 83 dB.
The normal human ear can detect sounds that range in frequency from about 20 Hz to 20,000 Hz.
However, all sounds in this wide range of frequencies are not heard equally well by the human ear, which
is most sensitive to frequencies in the range of 1,000 Hz to 4,000 Hz. This frequency dependence can be
taken into account by applying a correction to each frequency range to approximate the sensitivity of the
human ear within each range. This is called A-weighting and is commonly used in measurements of
community environmental noise. The A-weighted sound pressure level (abbreviated as dBA) is the sound
level with the “A-weighting” frequency correction. In practice, the level of a noise source is conveniently
measured using a sound level meter that includes a filter corresponding to the dBA curve.
Community noise levels usually change continuously during the day. The equivalent continuous A-
weighted sound pressure level (Leq) is normally used to describe community noise. The Leq is the
energy-averaged A-weighted sound level during a measured time interval, and is equal to the level of a
continuous steady sound containing the same total acoustical energy over the averaging time period as the
actual time-varying sound. Additionally, it is often desirable to know the acoustic range of the noise
source being measured. This is accomplished through the Lmax and Lmin indicators, which represent the
root-mean-square maximum and minimum noise levels obtained during the measurement interval. The
Lmin value obtained for a particular monitoring location is often called the “acoustic floor” for that
location.
To describe the time-varying character of environmental noise, the statistical noise descriptors L10, L50,
and L90 are commonly used. They are the noise levels equaled or exceeded during 10, 50, and 90 percent
of a stated time, respectively. Sound levels associated with L10 typically describe transient or short-term
events, whereas levels associated with L90 describe the steady-state (or most prevalent) noise conditions.
Another sound measure known as the Day-Night Sound Level (Ldn) is an adjusted average A-weighted
sound level for a 24-hour day. It is calculated by adding a 10-dBA adjustment to sound levels during
nighttime hours (10:00 p.m. to 7:00 a.m.). This adjustment compensates for the increased sensitivity to
noise during the typically quieter nighttime hours. The Ldn is used by agencies such as the U.S.
Department of Housing and Urban Development (HUD) and the U.S. Environmental Protection Agency
(EPA) to evaluate land-use compatibility with regard to noise.
6
Another sound measure known as the Community Noise Equivalent Level (CNEL) is an adjusted average
A-weighted sound level for a 24-hour day. It is calculated by adding a 5-dB adjustment to sound levels
during evening hours (7:00 p.m. to 10:00 p.m.) and a 10-dB adjustment to sound levels during nighttime
hours (10:00 p.m. to 7:00 a.m.). These adjustments compensate for the increased sensitivity to noise
during the typically quieter evening and nighttime hours. The CNEL is used by the State of California and
San Bernardino County (County) to evaluate land-use compatibility with regard to noise. Generally, the
Ldn is approximately 1 dBA less than the CNEL.
The sound power level is a distance-independent measure of a noise source’s energy.
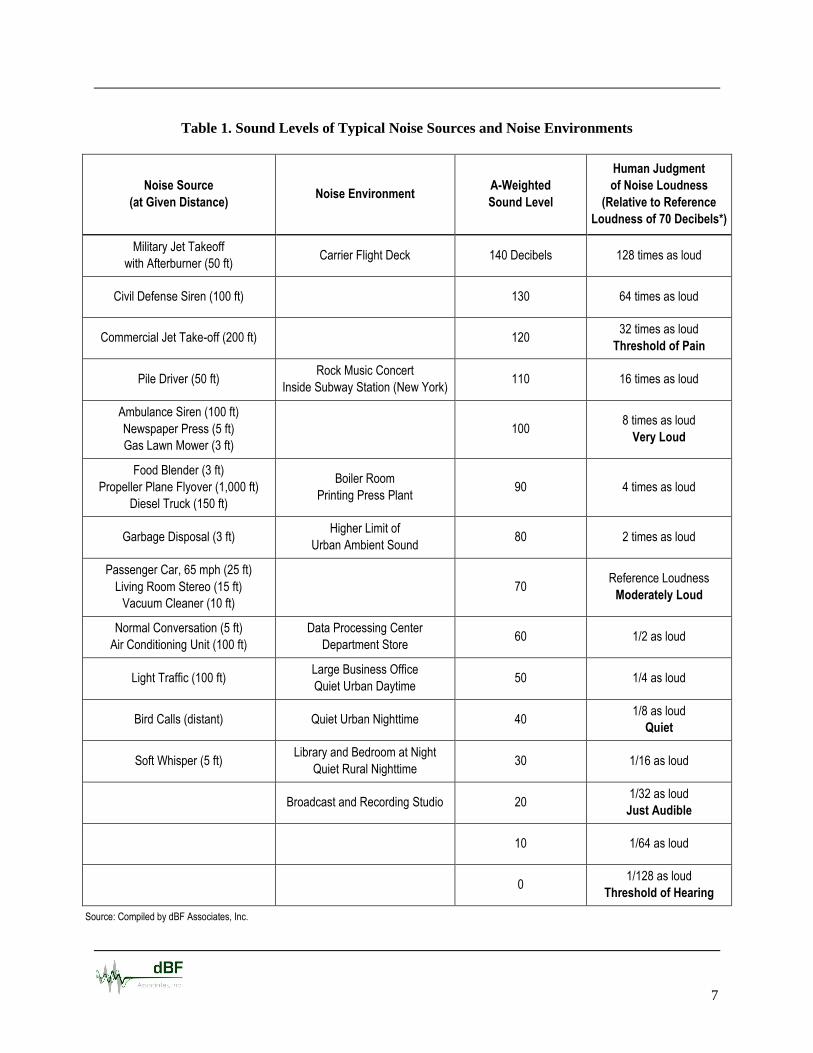
7
Table 1. Sound Levels of Typical Noise Sources and Noise Environments
Noise Source
(at Given Distance) Noise Environment
A-Weighted
Sound Level
Human Judgment
of Noise Loudness
(Relative to Reference
Loudness of 70 Decibels*)
Military Jet Takeoff
with Afterburner (50 ft) Carrier Flight Deck 140 Decibels 128 times as loud
Civil Defense Siren (100 ft) 130 64 times as loud
Commercial Jet Take-off (200 ft) 120 32 times as loud
Threshold of Pain
Pile Driver (50 ft) Rock Music Concert
Inside Subway Station (New York) 110 16 times as loud
Ambulance Siren (100 ft)
Newspaper Press (5 ft)
Gas Lawn Mower (3 ft)
100 8 times as loud
Very Loud
Food Blender (3 ft)
Propeller Plane Flyover (1,000 ft)
Diesel Truck (150 ft)
Boiler Room
Printing Press Plant 90 4 times as loud
Garbage Disposal (3 ft) Higher Limit of
Urban Ambient Sound 80 2 times as loud
Passenger Car, 65 mph (25 ft)
Living Room Stereo (15 ft)
Vacuum Cleaner (10 ft)
70 Reference Loudness
Moderately Loud
Normal Conversation (5 ft)
Air Conditioning Unit (100 ft)
Data Processing Center
Department Store 60 1/2 as loud
Light Traffic (100 ft) Large Business Office
Quiet Urban Daytime 50 1/4 as loud
Bird Calls (distant) Quiet Urban Nighttime 40 1/8 as loud
Quiet
Soft Whisper (5 ft) Library and Bedroom at Night
Quiet Rural Nighttime 30 1/16 as loud
Broadcast and Recording Studio 20 1/32 as loud
Just Audible
10 1/64 as loud
0 1/128 as loud
Threshold of Hearing
Source: Compiled by dBF Associates, Inc.
8
1.3 VIBRATION DESCRIPTORS
Vibration is defined as any oscillatory motion induced in a structure or mechanical device as a direct
result of some type of input excitation. Input excitation, generally in the form of an applied force or
displacement, is the mechanism required to start some type of vibratory response. Sources of earthborne
vibrations include natural phenomena (earthquakes, volcanic eruptions, sea waves, landslides, etc.) or
manmade (explosions, machinery, traffic, construction equipment, etc.).
Vibration amplitudes are usually expressed as either peak particle velocity (PPV) or the root mean square
(RMS) velocity. The PPV is defined as the maximum instantaneous peak of the vibration signal in inches
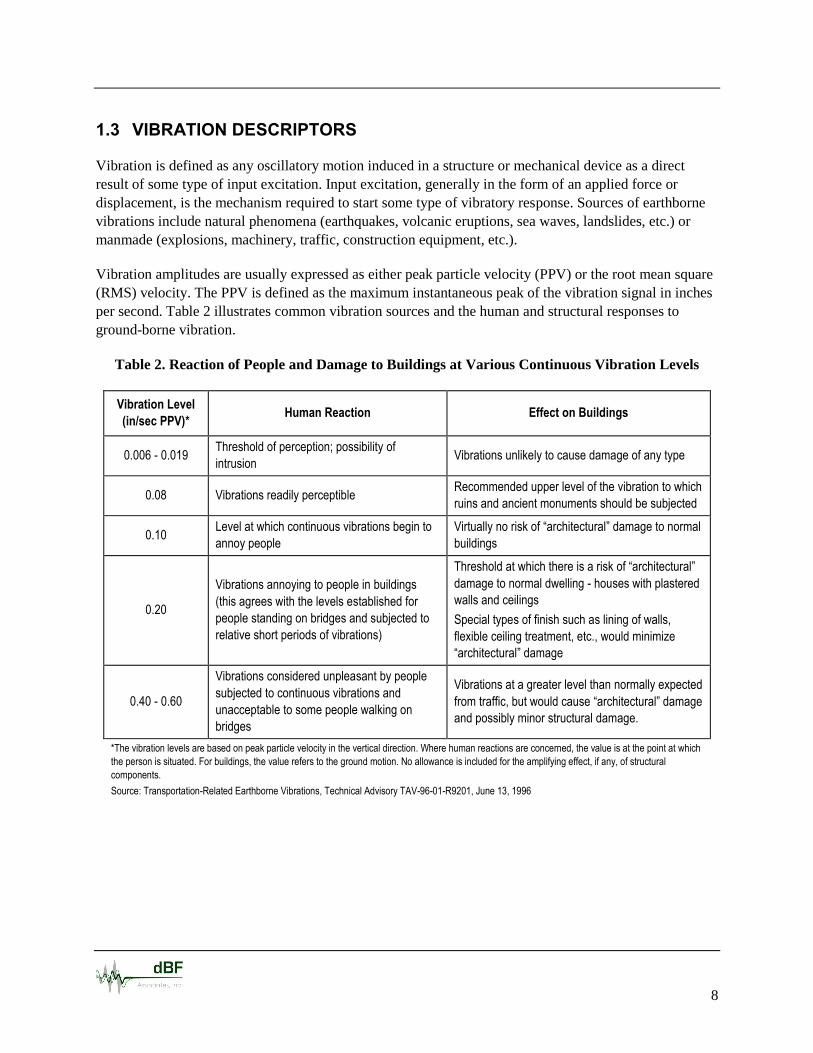
per second. Table 2 illustrates common vibration sources and the human and structural responses to
ground-borne vibration.
Table 2. Reaction of People and Damage to Buildings at Various Continuous Vibration Levels
Vibration Level
(in/sec PPV)* Human Reaction Effect on Buildings
0.006 - 0.019 Threshold of perception; possibility of
intrusion Vibrations unlikely to cause damage of any type
0.08 Vibrations readily perceptible Recommended upper level of the vibration to which
ruins and ancient monuments should be subjected
0.10 Level at which continuous vibrations begin to
annoy people
Virtually no risk of “architectural” damage to normal
buildings
0.20
Vibrations annoying to people in buildings
(this agrees with the levels established for
people standing on bridges and subjected to
relative short periods of vibrations)
Threshold at which there is a risk of “architectural”
damage to normal dwelling - houses with plastered
walls and ceilings
Special types of finish such as lining of walls,
flexible ceiling treatment, etc., would minimize
“architectural” damage
0.40 - 0.60
Vibrations considered unpleasant by people
subjected to continuous vibrations and
unacceptable to some people walking on
bridges
Vibrations at a greater level than normally expected
from traffic, but would cause “architectural” damage
and possibly minor structural damage.
*The vibration levels are based on peak particle velocity in the vertical direction. Where human reactions are concerned, the value is at the point at which
the person is situated. For buildings, the value refers to the ground motion. No allowance is included for the amplifying effect, if any, of structural
components.
Source: Transportation-Related Earthborne Vibrations, Technical Advisory TAV-96-01-R9201, June 13, 1996
9
2.0 IMPACT CRITERIA
This section presents the guidelines, criteria, and regulations used to assess noise and vibration impacts
associated with the proposed project. Section (§) 83.01.080 and §83.01.090 of the San Bernardino County
Development Code (SBCDC) govern noise and vibration, respectively, within unincorporated areas of
San Bernardino County.
San Bernardino County does not define thresholds of significance for traffic noise increases when existing
traffic noise levels currently exceed the standard. Sound level variations of up to 3 dBA are not detectable
by the typical human ear. Therefore, when existing traffic noise levels exceed the standard, an increase of
3 dBA CNEL directly attributable to the project is considered significant.
2.1 SAN BERNARDINO COUNTY DEVELOPMENT CODE
§83.01.080 Noise
This Section establishes standards concerning acceptable noise levels for both noise-sensitive land uses
and for noise-generating land uses.
(a) Noise Measurement. Noise shall be measured:
(1) At the property line of the nearest site that is occupied by, and/or zoned or designated to
allow the development of noise-sensitive land uses;
(2) With a sound level meter that meets the standards of the American National Standards
Institute (ANSI § SI4 1979, Type 1 or Type 2);
(3) Using the “A” weighted sound pressure level scale in decibels (ref. pressure = 20
micronewtons per meter squared). The unit of measure shall be designated as dB(A).
(b) Noise Impacted Areas. Areas within the County shall be designated as “noise-impacted” if
exposed to existing or projected future exterior noise levels from mobile or stationary sources
exceeding the standards listed in Subdivision (d) (Noise Standards for Stationary Noise Sources)
and Subdivision (e) (Noise Standards for Adjacent Mobile Noise Sources), below. New
development of residential or other noise-sensitive land uses shall not be allowed in noise-
impacted areas unless effective mitigation measures are incorporated into the project design to
reduce noise levels to these standards. Noise-sensitive land uses shall include residential uses,
schools, hospitals, nursing homes, religious institutions, libraries, and similar uses.
(c) Noise Standards for Stationary Noise Sources.
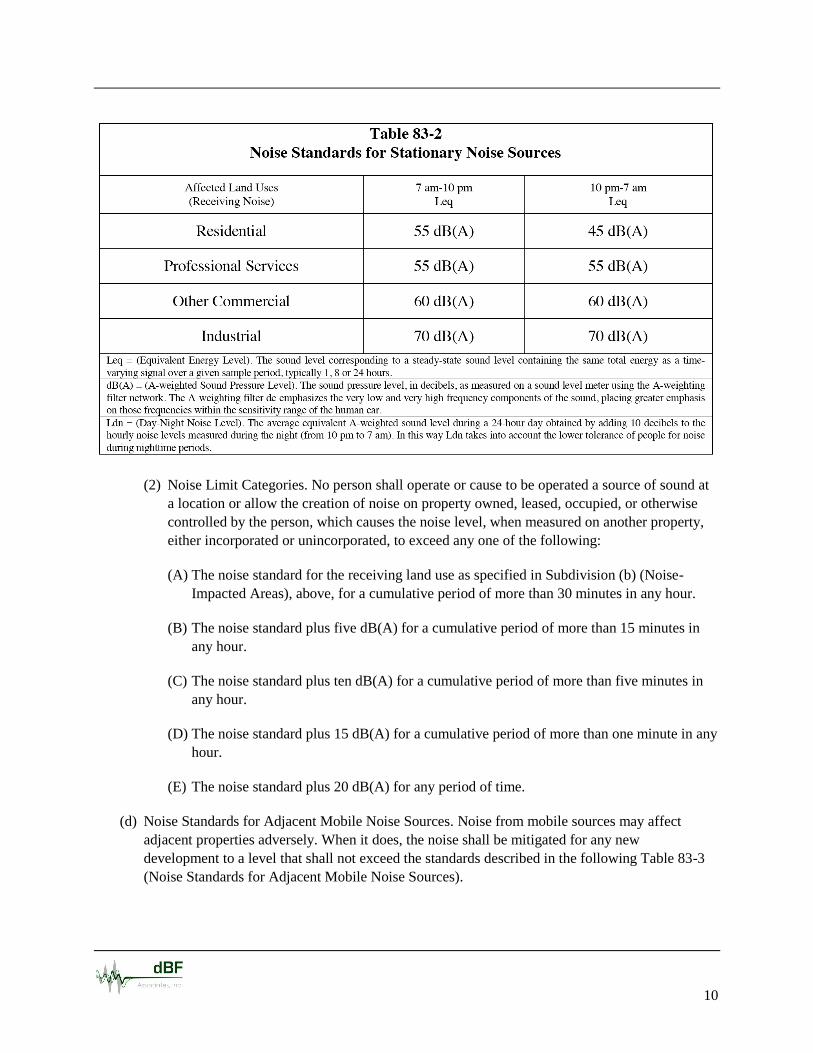
(1) Noise Standards. Table 83-2 (Noise Standards for Stationary Noise Sources) describes the
noise standard for emanations from a stationary noise source, as it affects adjacent properties:
10
(2) Noise Limit Categories. No person shall operate or cause to be operated a source of sound at
a location or allow the creation of noise on property owned, leased, occupied, or otherwise
controlled by the person, which causes the noise level, when measured on another property,
either incorporated or unincorporated, to exceed any one of the following:
(A) The noise standard for the receiving land use as specified in Subdivision (b) (Noise-
Impacted Areas), above, for a cumulative period of more than 30 minutes in any hour.
(B) The noise standard plus five dB(A) for a cumulative period of more than 15 minutes in
any hour.
(C) The noise standard plus ten dB(A) for a cumulative period of more than five minutes in
any hour.
(D) The noise standard plus 15 dB(A) for a cumulative period of more than one minute in any
hour.
(E) The noise standard plus 20 dB(A) for any period of time.
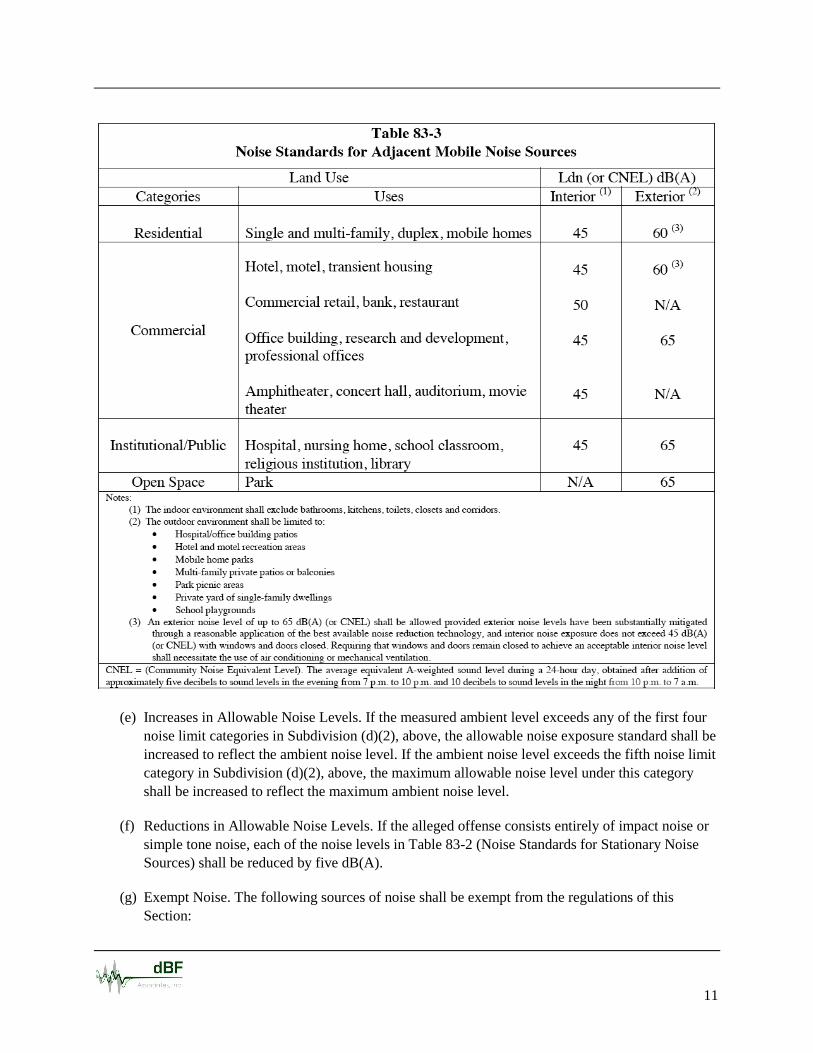
(d) Noise Standards for Adjacent Mobile Noise Sources. Noise from mobile sources may affect
adjacent properties adversely. When it does, the noise shall be mitigated for any new
development to a level that shall not exceed the standards described in the following Table 83-3
(Noise Standards for Adjacent Mobile Noise Sources).
11
(e) Increases in Allowable Noise Levels. If the measured ambient level exceeds any of the first four
noise limit categories in Subdivision (d)(2), above, the allowable noise exposure standard shall be
increased to reflect the ambient noise level. If the ambient noise level exceeds the fifth noise limit
category in Subdivision (d)(2), above, the maximum allowable noise level under this category
shall be increased to reflect the maximum ambient noise level.
(f) Reductions in Allowable Noise Levels. If the alleged offense consists entirely of impact noise or
simple tone noise, each of the noise levels in Table 83-2 (Noise Standards for Stationary Noise
Sources) shall be reduced by five dB(A).
(g) Exempt Noise. The following sources of noise shall be exempt from the regulations of this
Section:
12
(1) Motor vehicles not under the control of the commercial or industrial use.
(2) Emergency equipment, vehicles, and devices.
(3) Temporary construction, maintenance, repair, or demolition activities between 7:00 a.m. and
7:00 p.m., except Sundays and Federal holidays.
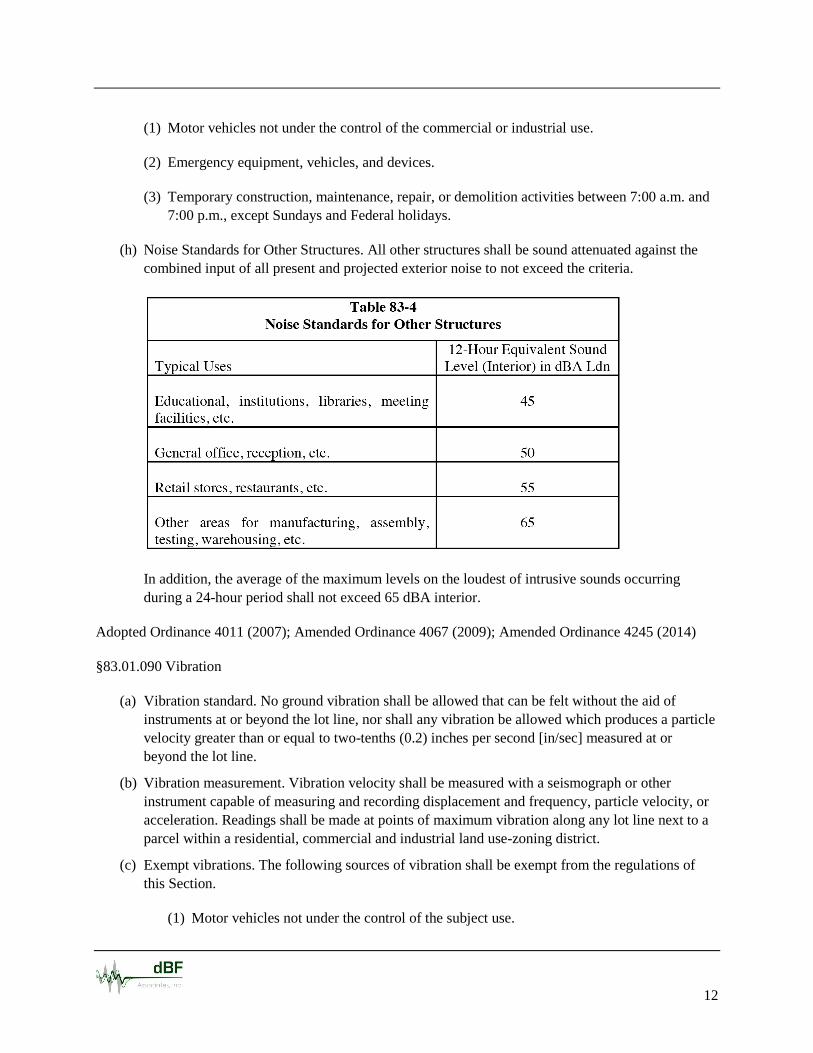
(h) Noise Standards for Other Structures. All other structures shall be sound attenuated against the
combined input of all present and projected exterior noise to not exceed the criteria.
In addition, the average of the maximum levels on the loudest of intrusive sounds occurring
during a 24-hour period shall not exceed 65 dBA interior.
Adopted Ordinance 4011 (2007); Amended Ordinance 4067 (2009); Amended Ordinance 4245 (2014)
§83.01.090 Vibration
(a) Vibration standard. No ground vibration shall be allowed that can be felt without the aid of
instruments at or beyond the lot line, nor shall any vibration be allowed which produces a particle
velocity greater than or equal to two-tenths (0.2) inches per second [in/sec] measured at or
beyond the lot line.
(b) Vibration measurement. Vibration velocity shall be measured with a seismograph or other
instrument capable of measuring and recording displacement and frequency, particle velocity, or
acceleration. Readings shall be made at points of maximum vibration along any lot line next to a
parcel within a residential, commercial and industrial land use-zoning district.
(c) Exempt vibrations. The following sources of vibration shall be exempt from the regulations of
this Section.
(1) Motor vehicles not under the control of the subject use.
13
(2) Temporary construction, maintenance, repair, or demolition activities between 7:00 a.m.
and 7:00 p.m., except Sundays and Federal holidays.
Adopted Ordinance 4011 (2007); Amended Ordinance 4067 (2009)
14
3.0 EXISTING NOISE ENVIRONMENT
Many land uses are considered sensitive to noise. Noise-sensitive receptors are land uses associated with
indoor and/or outdoor activities that may be subject to stress and/or significant interference from noise,
such as residential dwellings, transient lodging (hotels/motels), dormitories, hospitals, educational
facilities, and libraries. Industrial and commercial land uses are generally not considered sensitive to
noise. The existing sound level at any given location depends on the distance to a roadway, proximity to
commercial and neighborhood noise sources, and intervening structures and topography.
Noise-sensitive land uses potentially affected by the project consist of 14 single-family residential
properties across Orange Street to the south and southwest (10432 Linden Avenue, 10404 & 10407
Orchard Street, and 18509, 18519, 18527, 18537, 18551, 18599, 18613, 18623, 18633, 18639, & 18661
Orange Street), the CJUSD facility and the Bloomington Middle School / Bloomington Junior High
School / Slover Mountain High School campus across Orange Street to the south and southeast, and along
project access roadways.
Non-noise-sensitive land uses adjacent to the project site include: UPRR tracks, I-10, and the Water
District facility to the north, northeast, and northwest; the vacant land to the east; and the freight transfer
facility to the west. The project site and all adjacent properties are in unincorporated San Bernardino
County.
Noise sources in the project area consist of vehicular traffic on I-10, Cedar Avenue, and Orange Street,
and UPRR traffic. Primary project access roadways would include Valley Boulevard, Orange Street,
Slover Avenue, and Cedar Street.
The largest closest operational airports to the project site are the San Bernardino International Airport to
the east and the LA/Ontario International Airport to the west. The project site is located outside the 60
dBA CNEL noise contours of both airports. No airport-related noise sources affect the project site or
surrounding properties.
3.1 SOUND LEVEL MEASUREMENTS
An ambient noise level survey was conducted on Tuesday, December 23, 2014 to estimate the existing
noise environment near noise-sensitive areas within the project area. Sound measurement locations (MLs)
were selected near single-family residential land uses and/or project boundaries. Three attended short-
term (20-minute) measurements were conducted during the daytime period (7:00 a.m. – 7:00 p.m.).
The data collection device was a Larson-Davis Model 820 American National Standards Institute (ANSI)
Integrating Sound Level Meter (SLM). The meter was field-calibrated with a Larson Davis Model
CAL200 acoustic calibrator. The meter was set for “slow” time response and A-weighting for all
measurements. The microphone was equipped with a windscreen and placed five feet above the ground to
simulate the average height of the human ear. Weather conditions during the measurements were
approximately 75°F, calm wind, and clear skies. The results of the measurements are summarized in
Table 3 and correspond to the locations depicted on Figure 2.
15
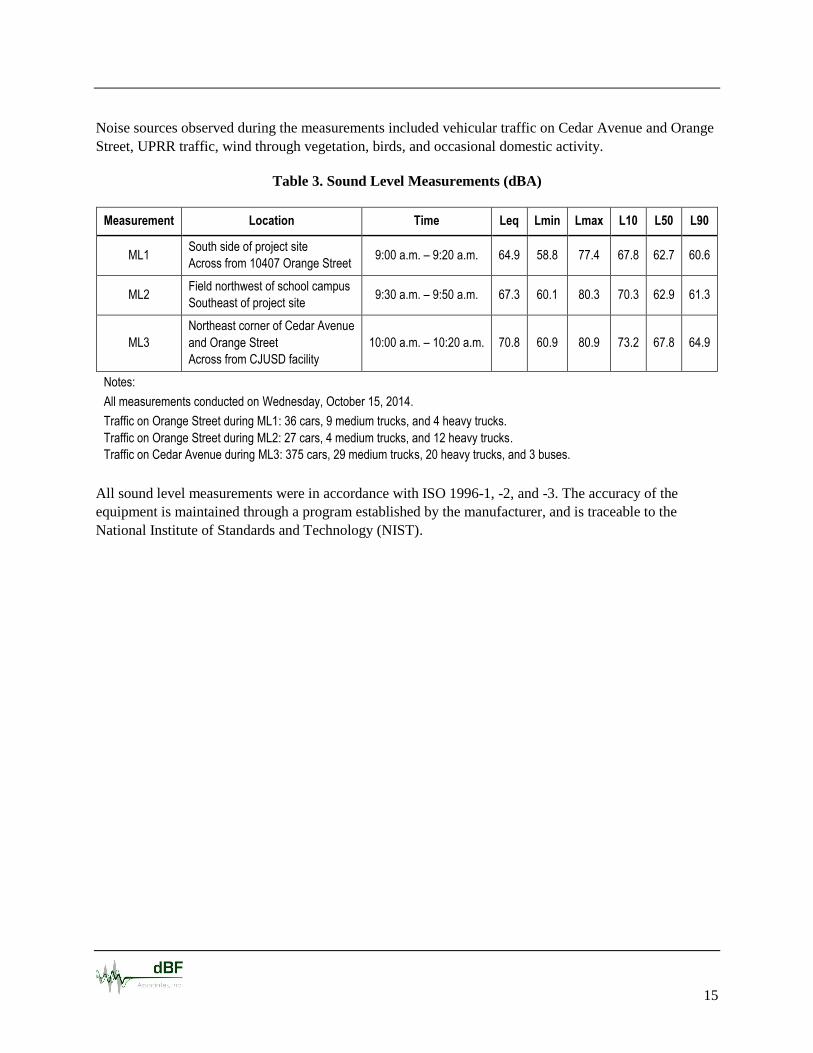
Noise sources observed during the measurements included vehicular traffic on Cedar Avenue and Orange
Street, UPRR traffic, wind through vegetation, birds, and occasional domestic activity.
Table 3. Sound Level Measurements (dBA)
Measurement Location Time Leq Lmin Lmax L10 L50 L90
ML1 South side of project site
Across from 10407 Orange Street 9:00 a.m. – 9:20 a.m. 64.9 58.8 77.4 67.8 62.7 60.6
ML2 Field northwest of school campus
Southeast of project site 9:30 a.m. – 9:50 a.m. 67.3 60.1 80.3 70.3 62.9 61.3
ML3
Northeast corner of Cedar Avenue
and Orange Street
Across from CJUSD facility
10:00 a.m. – 10:20 a.m. 70.8 60.9 80.9 73.2 67.8 64.9
Notes:
All measurements conducted on Wednesday, October 15, 2014.
Traffic on Orange Street during ML1: 36 cars, 9 medium trucks, and 4 heavy trucks.
Traffic on Orange Street during ML2: 27 cars, 4 medium trucks, and 12 heavy trucks.
Traffic on Cedar Avenue during ML3: 375 cars, 29 medium trucks, 20 heavy trucks, and 3 buses.
All sound level measurements were in accordance with ISO 1996-1, -2, and -3. The accuracy of the
equipment is maintained through a program established by the manufacturer, and is traceable to the
National Institute of Standards and Technology (NIST).
17
4.0 IMPACTS
4.1 SIGNIFICANCE CRITERIA
The SBCDC standards for stationary noise sources affecting school land uses are unclear. For the
purposes of the operational portion of this analysis, the three-building CJUSD facility at the southwest
corner of Orange Street and Cedar Avenue was evaluated as a Professional Services land use, and the
school campus between the CJUSD facility and Larch Avenue was evaluated as a residential land use. For
the purposes of the offsite traffic portion of this analysis, both the CJUSD facility and the school campus
were considered institutional land uses.
The proposed project could have a significant effect with respect to noise or vibration if:
Operational noise levels at an offsite residential or school campus property line exceed 55 dBA
Leq between 7:00 a.m. and 10:00 p.m. or 45 dBA Leq between 10:00 p.m. and 7:00 a.m.
Operational noise levels at a CJUSD facility property line exceed 55 dBA Leq at any time.
Operational noise levels at a commercial property line exceed 60 dBA Leq at any time.
Operational noise levels at a CJUSD facility property line exceed 70 dBA Leq at any time.
Construction activities occur outside of the County’s allowable construction hours – between 7:00
a.m. and 7:00 p.m. – or on a Sunday or a Federal holiday.
Project-generated traffic increases the noise level at a residential land use to 60 dBA CNEL or
above, and/or by 3 dBA CNEL.
Project-generated traffic increases the noise level at an institutional land use to 65 dBA CNEL or
above, and/or by 3 dBA CNEL.
Vibration levels from construction occurring outside of the County’s allowable construction
hours – between 7:00 a.m. and 7:00 p.m. – or on a Sunday or a Federal holiday exceed 0.2 in/sec
peak particle velocity (PPV) at a project property line.
Operational vibration levels exceed 0.2 in/sec PPV at a project property line.
4.2 OPERATION
4.2.1 Onsite Operational Noise
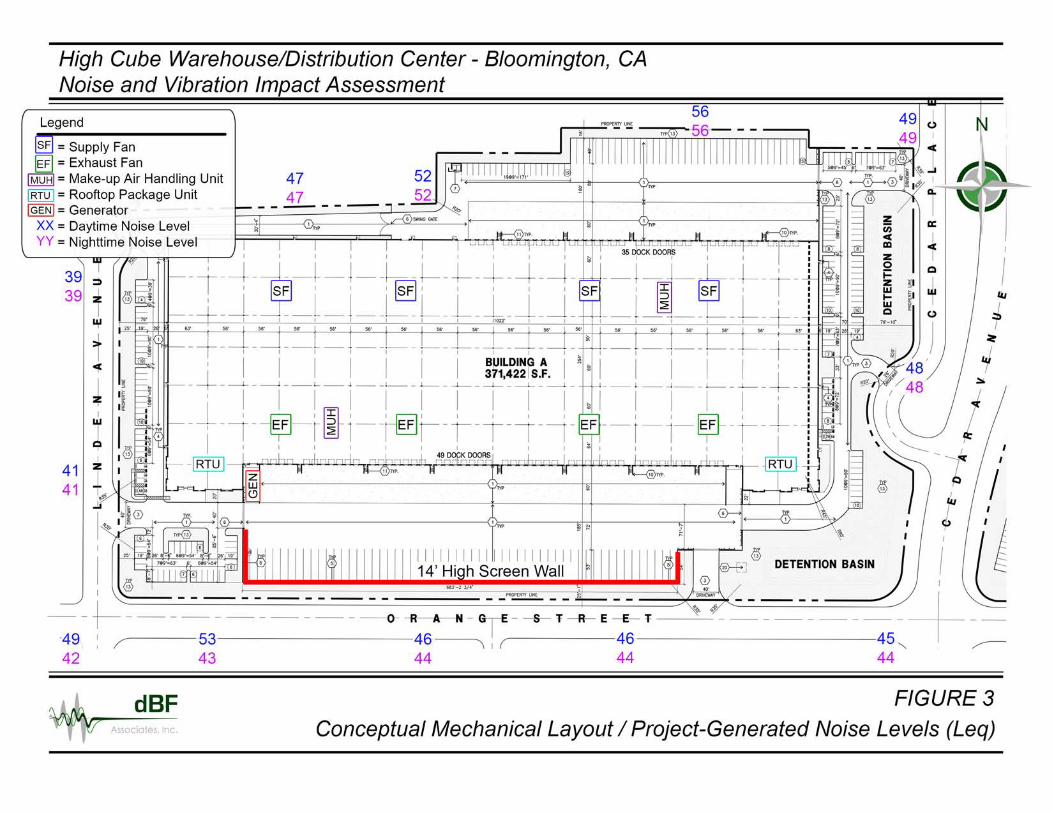
The Datakustik Cadna/A industrial noise prediction model was used to estimate noise levels from noise
sources on the project site, which are expected to include vehicular traffic and mechanical equipment. The
locations of the project building were imported from the site plan [HPA 2014]. The mechanical
equipment was positioned according to a conceptual mechanical layout based on a similar facility; refer to
Figure 3 for details. The project is not expected to include exterior trash compactors. The assumptions
made for source input into the noise model are detailed below.
18
Onsite project traffic would primarily consist of trucks in the trailer parking yards. All project trucks were
assumed to be heavy trucks. The project building would be equipped with 86 dock doors (49 on the south
side and 35 on the north side). The project would generate a daily truck volume of 125 trucks [Hall &
Foreman 2015] During the highest (P.M.) peak hour, the project would generate an hourly truck volume
of 9 trucks. During a typical nighttime hour, based on the remainder of daily non-peak-hour trucks
distributed over a 16-hour (two 8-hour shifts) work day, the project is expected to generate an hourly
truck volume of 8 trucks.
Heavy truck traffic at 15 mph generates an hourly noise level of approximately 64.3 dBA Leq(h) at a
distance of 50 feet from a frequency of one truck per minute (46.5 dBA Leq(h) from one truck per hour)
[FHWA 1978]. Onsite vehicles were treated as areas of moving point sources. It was assumed that an
average truck would operate on site for a period of 5 minutes.
The project is expected to include up to one exterior emergency generator. The generator is expected to be
ground-mounted at the west end of the south trailer parking yard. The generator is expected to be a 750kw
Cummins Model DQCB (or similar), housed in a Cummins Quiet Site II Second Stage enclosure (or
similar). This generator configuration is approximately 7 feet in height and produces 74 dBA at 7 meters
(23 feet). The generator was treated as a stationary point source and was assumed to run for a standard
testing duration of one hour during daytime hours.
The project building would be approximately 42-49 feet in height. Rooftop mechanical equipment is
expected to consist of two make-up air handling units (MUHs), two office rooftop package units (RTUs),
4 supply fans (SFs), and 4 exhaust fans (EFs). Each MUH was assumed to be a 10-horsepower (hp)
Greenheck Model DGX-120-H32 (or similar), which is approximately 4 feet in height and produces a
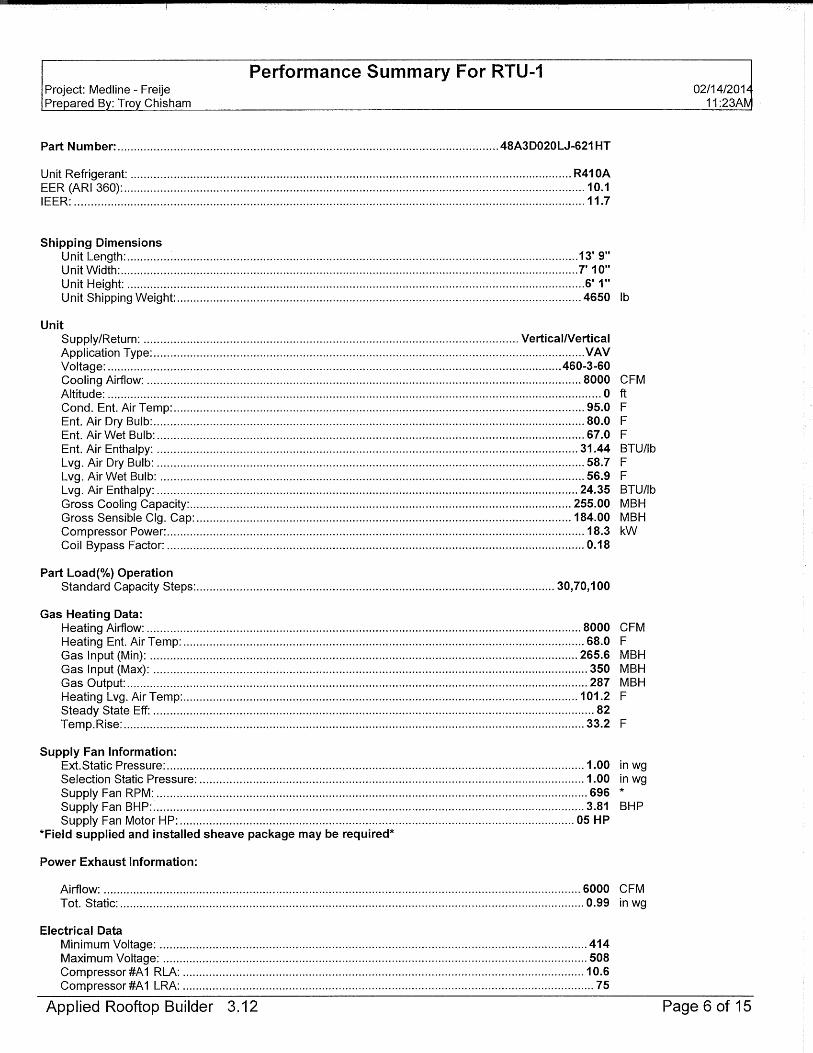
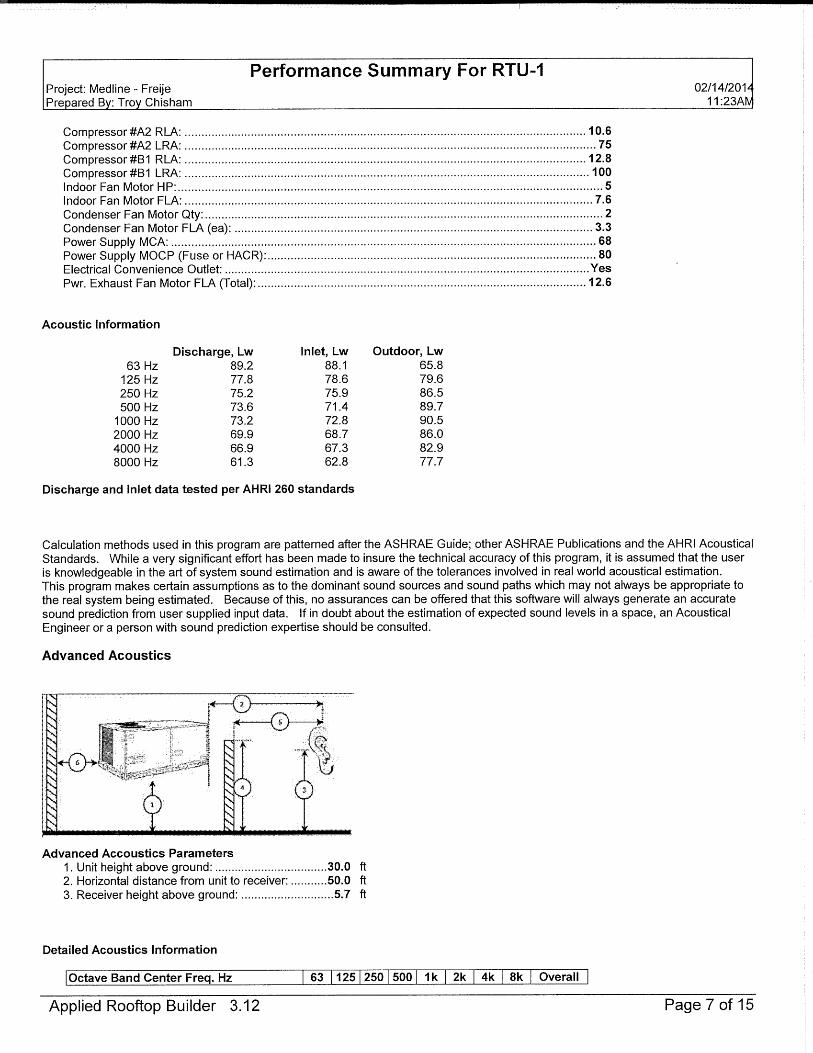
sound power level of 78 dBA. Each office RTU was assumed to be a 20-ton Carrier Model 48A3D020 (or
similar), which is approximately 3 feet in height and produces a sound power level of 78 dBA. Each SF
was assumed to be a 7-hp Cook HXFL (or similar), which is approximately 3.5 feet in height and
produces a sound power level of 76 dBA. Each EF was assumed to be a 5-hp Cook LXUL (or similar),
which is approximately 4.25 feet in height and produces a sound power level of 79 dBA. Rooftop
mechanical equipment was treated as stationary point sources and was assumed to be constantly
operational.
Onsite operational noise levels at various points along offsite property lines would range from
approximately 39 dBA Leq at the northwest property line corner to approximately 56 dBA Leq at the
north property line. Refer to Figure 3 for details.
The properties adjacent to the south and southeast of the project site are currently developed as single-
family residences and school facilities, respectively. The project operational noise levels at the south
offsite property lines would be as high as 53 dBA Leq between 7:00 a.m. and 10:00 p.m. / 44 dBA Leq
between 10:00 p.m. and 7:00 a.m, The project operational noise level at the south offsite residential
property lines would not exceed the San Bernardino County unmitigated property line noise limits of 55
dBA Leq between 7:00 a.m. and 10:00 p.m. / 45 dBA Leq between 10:00 p.m. and 7:00 a.m. The project
operational noise level at the south offsite school property lines would not exceed the San Bernardino
County unmitigated property line noise limits of 55 dBA Leq at any time.
19
The properties adjacent to the north, east, and west of the project site are commercial / industrial land
uses. The project operational noise level at the north, east, and west offsite property lines would be as
high as 56 dBA Leq. The project operational noise level at the north, east and west offsite property lines
not exceed 60 dBA Leq at any time. The project operational noise level at the commercial offsite property
lines would not exceed the San Bernardino County unmitigated property line noise limits of 60 dBA Leq
at any time. The project operational noise level at the industrial offsite property lines would not exceed
the San Bernardino County unmitigated property line noise limits of 70 dBA Leq at any time.
21
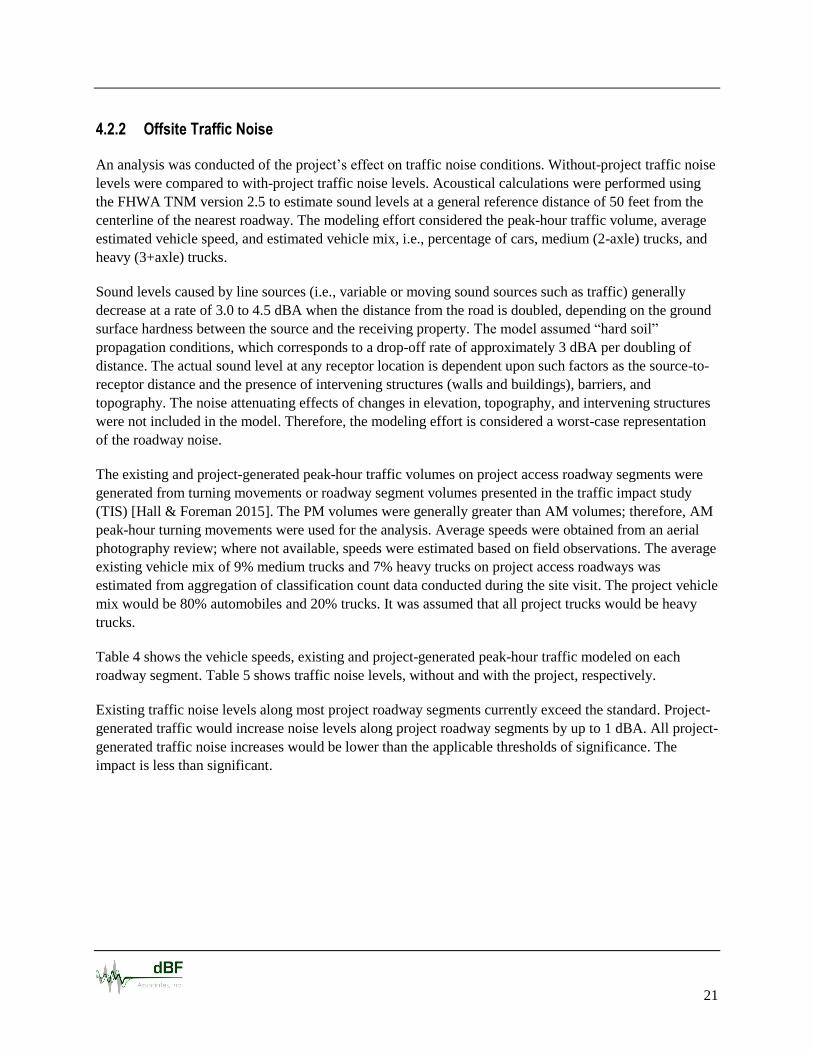
4.2.2 Offsite Traffic Noise
An analysis was conducted of the project’s effect on traffic noise conditions. Without-project traffic noise
levels were compared to with-project traffic noise levels. Acoustical calculations were performed using
the FHWA TNM version 2.5 to estimate sound levels at a general reference distance of 50 feet from the
centerline of the nearest roadway. The modeling effort considered the peak-hour traffic volume, average
estimated vehicle speed, and estimated vehicle mix, i.e., percentage of cars, medium (2-axle) trucks, and
heavy (3+axle) trucks.
Sound levels caused by line sources (i.e., variable or moving sound sources such as traffic) generally
decrease at a rate of 3.0 to 4.5 dBA when the distance from the road is doubled, depending on the ground
surface hardness between the source and the receiving property. The model assumed “hard soil”
propagation conditions, which corresponds to a drop-off rate of approximately 3 dBA per doubling of
distance. The actual sound level at any receptor location is dependent upon such factors as the source-to-
receptor distance and the presence of intervening structures (walls and buildings), barriers, and
topography. The noise attenuating effects of changes in elevation, topography, and intervening structures
were not included in the model. Therefore, the modeling effort is considered a worst-case representation
of the roadway noise.
The existing and project-generated peak-hour traffic volumes on project access roadway segments were
generated from turning movements or roadway segment volumes presented in the traffic impact study
(TIS) [Hall & Foreman 2015]. The PM volumes were generally greater than AM volumes; therefore, AM
peak-hour turning movements were used for the analysis. Average speeds were obtained from an aerial
photography review; where not available, speeds were estimated based on field observations. The average
existing vehicle mix of 9% medium trucks and 7% heavy trucks on project access roadways was
estimated from aggregation of classification count data conducted during the site visit. The project vehicle
mix would be 80% automobiles and 20% trucks. It was assumed that all project trucks would be heavy
trucks.
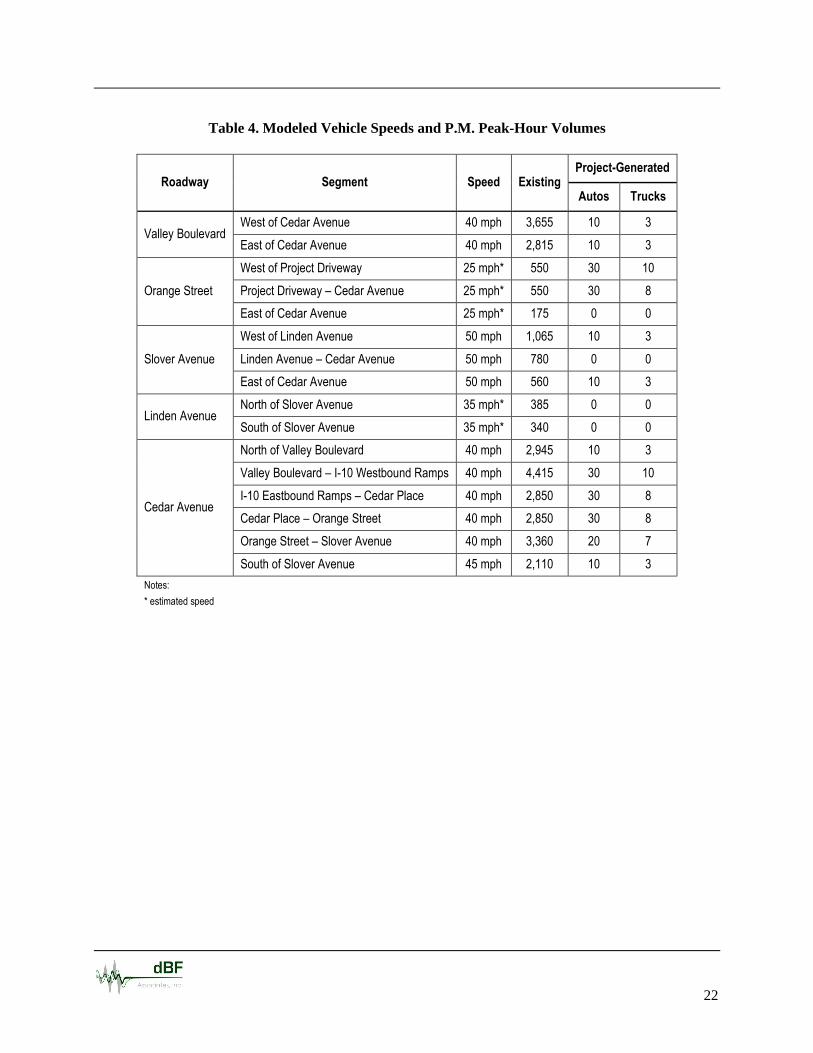
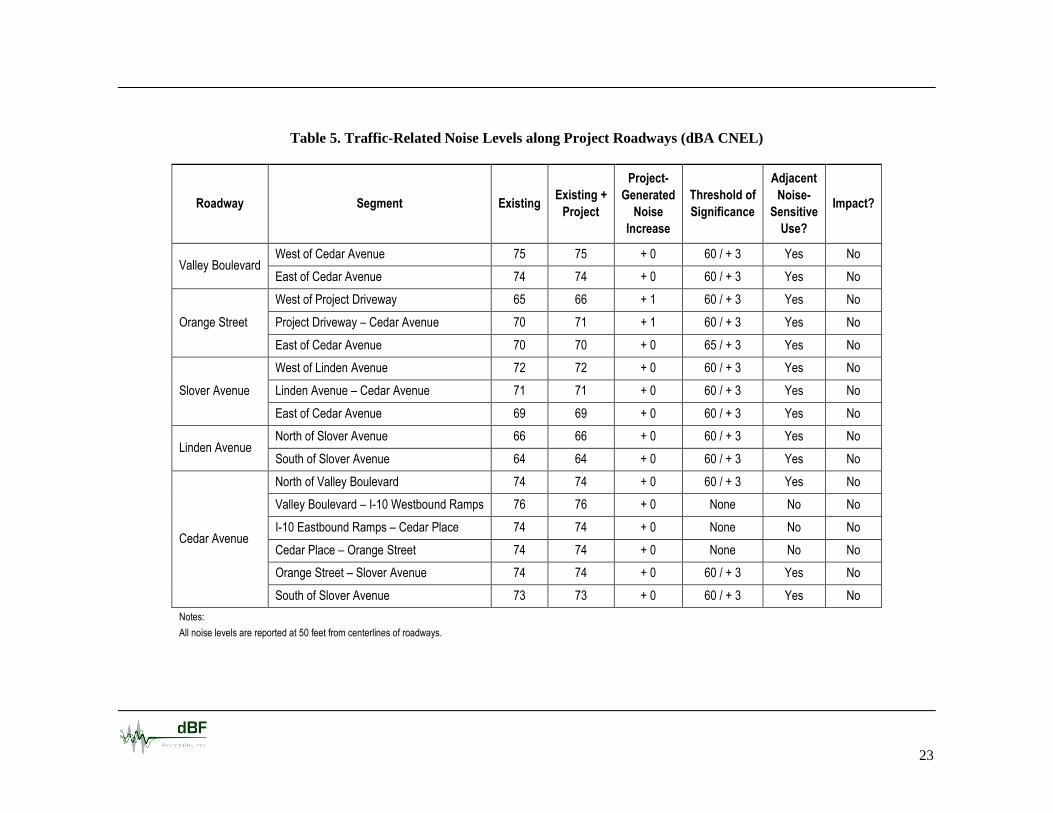
Table 4 shows the vehicle speeds, existing and project-generated peak-hour traffic modeled on each
roadway segment. Table 5 shows traffic noise levels, without and with the project, respectively.
Existing traffic noise levels along most project roadway segments currently exceed the standard. Project-
generated traffic would increase noise levels along project roadway segments by up to 1 dBA. All project-
generated traffic noise increases would be lower than the applicable thresholds of significance. The
impact is less than significant.
22
Table 4. Modeled Vehicle Speeds and P.M. Peak-Hour Volumes
Roadway Segment Speed Existing Project-Generated
Autos Trucks
Valley Boulevard West of Cedar Avenue 40 mph 3,655 10 3
East of Cedar Avenue 40 mph 2,815 10 3
Orange Street
West of Project Driveway 25 mph* 550 30 10
Project Driveway – Cedar Avenue 25 mph* 550 30 8
East of Cedar Avenue 25 mph* 175 0 0
Slover Avenue
West of Linden Avenue 50 mph 1,065 10 3
Linden Avenue – Cedar Avenue 50 mph 780 0 0
East of Cedar Avenue 50 mph 560 10 3
Linden Avenue North of Slover Avenue 35 mph* 385 0 0
South of Slover Avenue 35 mph* 340 0 0
Cedar Avenue
North of Valley Boulevard 40 mph 2,945 10 3
Valley Boulevard – I-10 Westbound Ramps 40 mph 4,415 30 10
I-10 Eastbound Ramps – Cedar Place 40 mph 2,850 30 8
Cedar Place – Orange Street 40 mph 2,850 30 8
Orange Street – Slover Avenue 40 mph 3,360 20 7
South of Slover Avenue 45 mph 2,110 10 3
Notes:
* estimated speed
23
Table 5. Traffic-Related Noise Levels along Project Roadways (dBA CNEL)
Roadway Segment Existing Existing +
Project
Project-
Generated
Noise
Increase
Threshold of
Significance
Adjacent
Noise-
Sensitive
Use?
Impact?
Valley Boulevard West of Cedar Avenue 75 75 + 0 60 / + 3 Yes No
East of Cedar Avenue 74 74 + 0 60 / + 3 Yes No
Orange Street
West of Project Driveway 65 66 + 1 60 / + 3 Yes No
Project Driveway – Cedar Avenue 70 71 + 1 60 / + 3 Yes No
East of Cedar Avenue 70 70 + 0 65 / + 3 Yes No
Slover Avenue
West of Linden Avenue 72 72 + 0 60 / + 3 Yes No
Linden Avenue – Cedar Avenue 71 71 + 0 60 / + 3 Yes No
East of Cedar Avenue 69 69 + 0 60 / + 3 Yes No
Linden Avenue North of Slover Avenue 66 66 + 0 60 / + 3 Yes No
South of Slover Avenue 64 64 + 0 60 / + 3 Yes No
Cedar Avenue
North of Valley Boulevard 74 74 + 0 60 / + 3 Yes No
Valley Boulevard – I-10 Westbound Ramps 76 76 + 0 None No No
I-10 Eastbound Ramps – Cedar Place 74 74 + 0 None No No
Cedar Place – Orange Street 74 74 + 0 None No No
Orange Street – Slover Avenue 74 74 + 0 60 / + 3 Yes No
South of Slover Avenue 73 73 + 0 60 / + 3 Yes No
Notes:
All noise levels are reported at 50 feet from centerlines of roadways.
24
4.2.3 Operational Vibration
Vibration associated with operation of the project would be generated by vehicular traffic and mechanical
equipment operation.
Vehicles traveling on a smooth pavement surface are rarely, if ever, the source of perceptible ground
vibration. All vehicles on the project site would have rubber tires and suspension systems that isolate
vibration from the ground, and would generally travel at a maximum speed of approximately 10 miles per
hour. All vehicular traffic would operate over 25 feet from vibration-sensitive land uses. Vibration is
expected to be consistent with the existing condition, and would be negligible.
All mechanical equipment would be located over 100 feet from vibration-sensitive land uses.
Groundborne vibration levels resulting from mechanical equipment are dependent of the design of the
equipment. All ground-mounted mechanical equipment would be installed using vibration-dampening
resilient isolators designed to ensure that vibration levels would be lower than 0.2 in/sec PPV at project
property lines adjacent to vibration-sensitive land uses.
No operational significant vibration impacts would be expected.
4.3 CONSTRUCTION
Noise and vibration levels associated with the construction phase of the project were estimated based on
information from the project developer for construction equipment requirements and schedule. It was
assumed that construction of the project would require approximately 8 months to complete. The initial
phase of construction would involve fine grading of the site, along with site development activities,
including construction of internal roadways which involves trenching and paving activities. Following
site preparation activities, the project would include construction of buildings, including office and
warehousing space. Construction of the buildings would require the following phases: site development
(fine grading, trenching, and paving), building construction, architectural coatings application, and paving
associated with buildings.
Fine grading is expected to produce the highest construction noise and vibration levels. Grading is
estimated to require two to three motor graders, two to three dozers, one excavator, three scrapers, and
one water truck. All construction activity would occur between 7:00 a.m. and 7:00 p.m. Monday through
Sunday; no construction activity would occur on a Federal holiday.
25
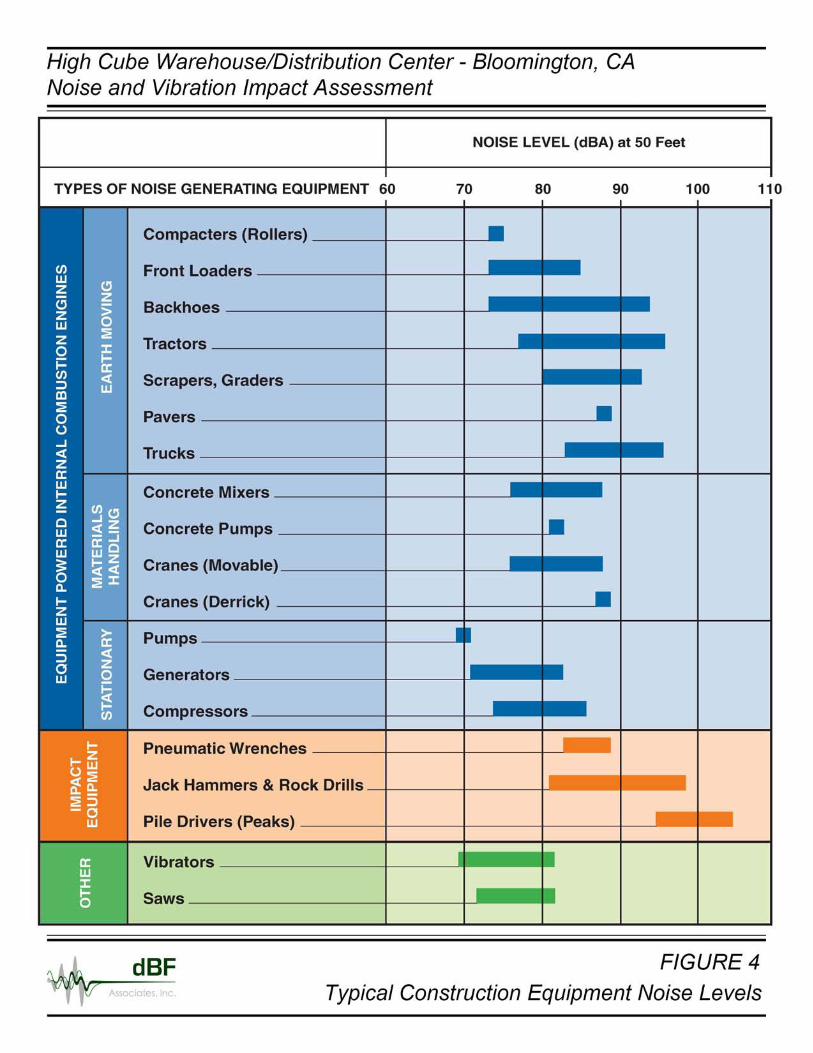
4.3.1 Construction Noise
Project construction would result in a temporary increase in noise levels in the project vicinity.
Construction noise varies depending on the construction process, type of equipment involved, location of
the construction site with respect to sensitive receptors, the schedule proposed to carry out each task (e.g.,
hours and days of the week) and the duration of the construction work. Typical noise sources and noise
levels associated with site grading are shown in Figure 4.
Project construction would occur only during the hours and days allowed by San Bernardino County.
Project construction activities would comply with SBCDC §83.01.080.
4.3.2 Construction Vibration
Because project construction is temporary and would occur during the hours and days allowed by San
Bernardino County, vibration generated by construction of this project is exempt from regulation per
SBCDC §83.01.090(C)(2). Typical vibration levels associated with project construction equipment are
presented in Table 6.
Table 6. Construction Equipment Vibration Source Levels
Equipment PPV at 25 feet
Grader 0.11 in/sec
Large Bulldozer 0.089 in/sec
Small Bulldozer 0.003 in/sec
Excavator 0.11 in/sec
Loaded Truck 0.076 in/sec
Scraper 0.11 in/sec
Front-End Loader 0.089 in/sec
Source: FTA 2006
In addition, project construction would not require pile driving.
Project construction would occur only during the hours and days allowed by San Bernardino County.
Project construction activities would comply with SBCDC §83.01.090.
27
4.4 MITIGATION
This section discusses the possible mitigation measures that can be implemented to either reduce or
mitigate the impacts generated by the development of the proposed project.
4.4.1 Operation
4.4.1.1 Onsite Operational Noise
No impacts were identified. No mitigation is necessary.
4.4.1.2 Offsite Traffic Noise
No impacts were identified. No mitigation is necessary.
4.4.1.3 Operational Vibration
No impacts were identified. No mitigation is necessary.
4.4.2 Construction
4.4.2.1 Construction Noise
No impacts were identified. No mitigation is necessary. However, to avoid unnecessary annoyance from
construction noise, the following construction noise control measures should be implemented:
Perform all construction in a manner to minimize noise and vibration. The contractor should
be required to select construction processes and techniques that create the lowest noise levels.
Equip all internal combustion engines with a muffler of a type recommended by the
manufacturer.
Turn off idling equipment.
Perform noisier operations during the times least sensitive to receptors.
Implement a noise control monitoring program to limit the impacts.
The construction contractor should be required by contract specification to comply with all
local noise ordinances and obtain all necessary permits and variances.
4.4.2.2 Construction Vibration
No impacts were identified. No mitigation is necessary.
28
5.0 REFERENCES
Caltrans. 2006. Technical Advisory TAV-96-01. Transportation-Related Earthborne Vibrations. June 13.
County of San Bernardino. Development Code. §83.01.080 and §83.01.090.
Federal Highway Administration (FHWA). 1978. FHWA Highway Traffic Noise Prediction Model,
Federal Highway Administration Report FHWA-RD-77-108.
Federal Transit Administration (FTA). 2006. Transit Noise and Vibration Impact Assessment. FTA-VA-
90-1003-06. May.
Hall & Foreman. 2015. Traffic Impact Study. High-Cube Warehouse / Distribution Center, Bloomington,
CA. March 18.
Harris, Cyril M. 1998. Handbook of Acoustical Measurements and Noise Control, Third Edition.
Acoustical Society of America. Woodbury, NY.
HPA Architecture. 2014. Cedar & Orange Business Center. Sheet A1.1: Overall Site Plan. December 2.
International Organization For Standardization (ISO). 1996a. Description and Measurement of
Environmental Noise, Basic Quantities and Procedures Part 1. ISO 1996/1.
1996b. Description and Measurement of Environmental Noise, Basic Quantities and Procedures,
Acquisition of Data Pertinent to Land Use, Part 2. ISO 1996/2.
1996c. Description and Measurement of Environmental Noise, Basic Quantities and Procedures,
Application to Noise Limits, Part 3. ISO 1996/3.

APPENDICES

APPENDIX A
MECHANICAL EQUIPMENT
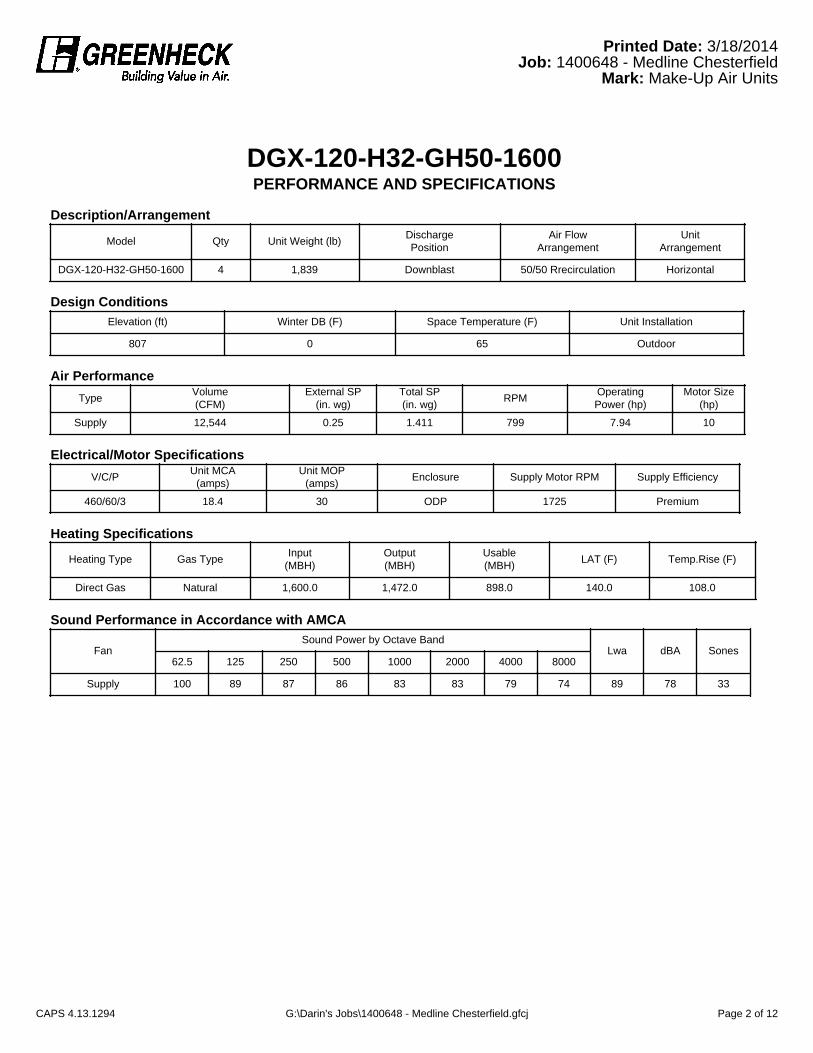
DGX-120-H32-GH50-1600PERFORMANCE AND SPECIFICATIONS
Description/Arrangement
Model Qty Unit Weight (lb) DischargePosition
Air FlowArrangement
UnitArrangement
DGX-120-H32-GH50-1600 4 1,839 Downblast 50/50 Rrecirculation Horizontal
Design ConditionsElevation (ft) Winter DB (F) Space Temperature (F) Unit Installation
807 0 65 Outdoor
Air PerformanceType Volume
(CFM)External SP
(in. wg)Total SP(in. wg) RPM Operating
Power (hp)Motor Size
(hp)
Supply 12,544 0.25 1.411 799 7.94 10
Electrical/Motor SpecificationsV/C/P Unit MCA
(amps)Unit MOP
(amps) Enclosure Supply Motor RPM Supply Efficiency
460/60/3 18.4 30 ODP 1725 Premium
Heating Specifications
Heating Type Gas Type Input(MBH)
Output(MBH)
Usable(MBH) LAT (F) Temp.Rise (F)
Direct Gas Natural 1,600.0 1,472.0 898.0 140.0 108.0
Sound Performance in Accordance with AMCA
FanSound Power by Octave Band
Lwa dBA Sones62.5 125 250 500 1000 2000 4000 8000
Supply 100 89 87 86 83 83 79 74 89 78 33
3/18/2014Printed Date: 1400648 - Medline ChesterfieldJob:
Make-Up Air UnitsMark:
CAPS 4.13.1294 G:\Darin's Jobs\1400648 - Medline Chesterfield.gfcj Page 2 of 12
LXUL Low Silhouette Upblast Exhaust Ventilator Low Pressure X-Stream Propeller C
Roof MountedlBelt Drive STANDARD CONSTRUCTION FEATURES: X-Stream steel propeller - All non-galvanized steel components finished with Lorenized baked powder coat - 14 gauge spun steel B Venturilcurb cap - 14 gauge steel lower drum - Minimum 18 gauge steel windband -Welded tubular steel power assembly - 2 point lifting lugs - Aluminum butterfly damper doors (20-36) - Galvanized steel butterfly dampers (42-60) -Welded curb cap corners - Adjustable pitch drives through 5 hp - Regreasable bearings in cast housing, rated at 200,000 hours average life - Propellers are statically and dynamically balanced - Corrosion resistant fasteners - Oil and heat resistant, static conducting belts - All fans factory adjusted to specified RPM
Fan Curve Legend CFM vs SP -
Performance
Altitude (ft): 807 Temperature (F): 70 Motor Information
NEMA Premium@ efficiency motor per MG-1 (201 1) Table 12-1 2
Sound Data Inlet Sound Power by Octave Band
CFM vs HP Point of Operation 0
Fan Curve
T Sq. 72
Roof Open. 67-112 VOTE: Accessories may affect dimensions shown.
Accessories: Premium Efficiency Motor (Min. 91.0%) DRIVES (1.5 SF) @ 401 RPM STD DISCONNECT PRE-WIRED NEMAI ROOF CURB RCG 70-24H MAGNETIC LATCHES ANTICONDENSATE COAT
8
67
1
91
0 11000 22000 33000 44000 55000 Flow (CFM)
Shipping Weight(lbs)***
3
93
2
95
11 11
LwA
89
-Includes fan, motor 8 accessories.
4
85
dBA
78
5
82
Sones
30
6
79
7
76
1 MARK: SF-I THRU 9 1 /.: &$p$ PROJECT: MEDI-INE CHESTERFIELD
v?&::'..., s
\!$$$J DATE: 4/16/2014
HXFL Hooded Filtered Supply Ventilator Low-Pressu re Steel Propeller Roof MountedIBelt Drive STANDARD CONSTRUCTION FEATURES: X-stream steel propeller - Spun steel Venturilcurb cap - Lorenized steel lower housing - Galvanized steel hood - Heavy duty steel power assembly - Welded curb cap corners - Adjustable pitch drives through 5 hp motor - Regreasable bearings in cast housing rated at 200,000 hours average life - Propellers are statically and dynamically balanced - Washable filters - Quick release filter retainers - Corrosion resistant fasteners - Oil and heat resistant, static conducting belts - All fans factory adjusted to specified RPM. NOTE: Sizes 36-60 require field assembly of hood.
Dimensions (inches)
Performance
Altitude (ft): 807 Temperature (F): 70 Motor Information
A B C
LxW T Sq.
Base Hood
Max Mtr Frame Roof Open.Sq.*
42
3
14-1 12
146x 119
72
14
18
256T
67-112
NOTE: Accessories may affect dimensions shown.
NEMA Premium@ efficiency motor per MG-1 (201 1) Table 12-12 .. Shipping Weight(lbs)*** 2231
Sound Data Inlet Sound Power by Octave Band -ROOF OPENING SIZE FOR CURBS SUPPLIED BY COOK ONLY. "'Includes fan, motor 8 accessories.
Accessories: Premium Efficiency Motor (Min. 91.7%) 10.0
DRIVES (1.5 SF) @ 414 RPM STD DISCONNECT NEMA3 PRE-WIRED L-T BDIC-66 DAMPER ROOF CURB RCG 70-13.5H WITRAY 8.00 LIFTING LUGS -SHIPPED LOOSE ANTICONDENSATE COAT
6.00 2 s ? h
I 4.00 3
2.00
0.00 11000 22000 33000 44000 55000
Point of Operation 0 Flow (CFM)
Page 1 of 15
1
88
3
89
2
92
4
85
8
69
5
81 27
6
79 88
7
76
LwAdBASones
76
cumminspower.com©2014 Cummins Power Generation Inc. | S-1551j (3/14)
Specification sheet
Diesel generator set QSK23 series engine 545 kW - 800 kW
DescriptionCummins Power Generation commercial generator sets are fully integrated power generation systems providing optimum performance, reliability and versatility for stationary standby and prime power applications.
Features
Cummins® heavy-duty engine - Rugged 4-cycle, industrial diesel delivers reliable power, low emissions and fast response to load changes. Alternator - Several alternator sizes offer selectable motor starting capability with low reactance 2/3 pitch windings, low waveform distortion with non-linear loads and fault clearing short-circuit capability.
Permanent magnet generator (PMG) - Offers enhanced motor starting and fault clearing short-circuit capability. Control system - The PowerCommand® electronic control is standard equipment and provides total genset system integration including automatic remote starting/stopping, precise frequency and voltage regulation, alarm and status message display, AmpSentry™ protection, output metering, auto-shutdown at fault detection and NFPA 110 Level 1 compliance. Cooling system - Standard integral set-mounted radiator system, designed and tested for rated ambient temperatures, simplifies facility design requirements for rejected heat. Enclosures - Optional weather protective and sound attenuated enclosures are available. NFPA - The genset accepts full rated load in a single step in accordance with NFPA 110 for Level 1 systems. Warranty and service - Backed by a comprehensive warranty and worldwide distributor network.
Standby rating Prime rating Continuous rating Data sheets
Model 60 Hz kW (kVA)
50 Hz kW (kVA)
60 Hz kW (kVA)
50 Hz kW (kVA)
60 Hz kW (kVA)
50 Hz kW (kVA) 60 Hz 50 Hz
DQCA 600 (750) 545 (681) D-3352
DQCB 750 (938) 680 (850) D-3353
DQCC 800 (1000) 725 (906) D-3354
Page 5 of 57
Sound Data
750DQCB 60Hz
Sound Pressure Level @ 7 meters, dB(A)
See Notes 1-8 listed below
Configuration Measurement Location Number
Average 1 2 3 4 5 6 7 8
Standard - Unhoused Infinite
Exhaust 90 95 95 96 93 96 94 95 95
F200 –Weather
Mounted Muffler 85 81 79 90 91 91 78 81 87
F201 - Quiet Site II First Stage Mounted Muffler
85 80 73 74 78 74 74 80 79
F202 - Quiet Site II Second
Stage
Mounted Muffler
73 71 74 74 75 76 75 72 74
Sound Power Level, dB(A) See Notes 2-6, 9, 10 listed below
Configuration Octave Band Center Frequency (Hz) Overall Sound
Power Level 63 125 250 500 1000 2000 4000 8000
Standard - Unhoused Infinite
Exhaust 83 102 107 113 115 115 113 108 121
F200 –Weather
Mounted Muffler
93 102 107 109 108 107 104 99 115
F201 - Quiet Site II First Stage Mounted Muffler
92 100 101 102 101 101 100 95 109
F202 - Quiet Site II Second Stage
Mounted Muffler
86 96 96 93 100 99 99 91 106
Exhaust Sound Pressure Level @ 1 meter, dB(A)
Open Exhaust (No Muffler Rated Load)
Octave Band Center Frequency (Hz) Sound Pressure Level
63 125 250 500 1000 2000 4000 8000
105 112 120 121 125 126 126 124 132
Note:
1. Position 1 faces the engine front. The positions proceed around the generator set in a counter-clockwise direction in 45° increments. All positions are at 7m (23 ft) from the surface of the generator set and 1.2m (48”) from floor level.
2. Sound levels are subject to instrumentation, measurement, installation and manufacturing variability. 3. Sound data with remote-cooled generator sets are based on rated loads without cooling fan noise. 4. Sound levels for aluminum enclosures are approximately 2 dB(A)s higher than listed sound levels for steel enclosures. 5. Sound data for generator set with infinite exhaust do not include exhaust noise. 6. Data is based on full rated load with standard radiator-cooling fan package 7. Sound Pressure Levels are measured per ANSI S1.13 and ANSI S12.18, as applicable. 8. Reference sound pressure is 20 µPa. 9. Sound Power Levels per ISO 3744 and ISO 8528-10, as applicable.
10. Reference power = 1 pw (10-12
11. W)
Exhaust Sound Pressure Levels are per ISO 6798, as applicable.
Cummins Power Generation Data and Specification Subject to Change Without Notice Bulletin msp-1013d
Recommended