Hawaii’s Working Population: An Analysis by Industry 2012-2016
April 2018 Department of Business, Economic Development & Tourism Research and Economic Analysis Division

1 | P a g e
This report is prepared by Naomi Akamine, Economist, under the direction of Dr. Eugene Tian, Division Administrator.

2 | P a g e
TABLE OF CONTENT
EXECUTIVE SUMMARY ............................................................................................................. 4
Introduction ............................................................................................................................ 8
A. Employment Analysis .......................................................................................................... 9
Employment by Industry ................................................................................................................. 9
Employment by Gender ................................................................................................................ 10
Employment by Major Age Group ................................................................................................. 11
Employment by Major Race Group ................................................................................................ 12
Employment by Educational Attainment ....................................................................................... 14
Employment by Full-Time and Part-Time Status ............................................................................ 15
Employment by Payroll Status ...................................................................................................... 16
Employment by Nativity ................................................................................................................ 17
B. Average Labor Earning Analysis ......................................................................................... 19
Average Labor Earning by Industry ................................................................................................ 19
Average labor Earning by Gender .................................................................................................. 20
Average Labor Earning by Major Age Group .................................................................................. 21
Average Labor Earning by Major Race Group ................................................................................ 22
Average Labor Earning by Educational Attainment ........................................................................ 24
Average Labor Earning by Full-Time and Part-Time Status ............................................................. 25
Average Labor Earning by Payroll Status ....................................................................................... 26
Average Labor Earning by Nativity ................................................................................................ 27
C. Average Wage Analysis ...................................................................................................... 28
Average Wage for Full-Time Payroll Workers by Industry .............................................................. 28
Average Wage for Full-Time Payroll Workers by Gender ............................................................... 29
Average Wage for Full-Time Payroll Workers by Major Age Group ................................................ 30
Average Wage for Full-Time Payroll Workers by Major Race Group ............................................... 31
Average Wage for Full-Time Payroll Workers by Educational Attainment ...................................... 32
Average Wage for Full-Time Payroll Workers by Nativity............................................................... 33

3 | P a g e
LIST OF TABLES
Table 1. 2012 North American Industry Classification System .................................................. 8
Table 2. Hawaii employment distribution by industry by major race group (%) ..................... 12
Table 3. Employment by industry by nativity (%) ................................................................... 17
Table 4. Average labor earning by industry by major age group ($) ....................................... 21
Table 5. Average labor earning by industry by major race group ($) ...................................... 22
Table 6. Average wage for full-time payroll workers by major age group ($) ......................... 30
Table 7. Average wage for full-time payroll workers by major race group ($) ........................ 31
Table 8. Average wage for full-time payroll workers by educational attainment ($) .............. 32
LIST OF FIGURES
Figure 1. Employment distribution by major industry: Hawaii vs U.S. ...................................... 9
Figure 2. Hawaii employment distribution by industry by gender .......................................... 10
Figure 3. Hawaii employment distribution by industry by major age group ........................... 11
Figure 4. Employment distribution by industry by major race group ..................................... 13
Figure 5. Employment distribution by industry and educational attainment ......................... 14
Figure 6. Employment distribution by industry and full-time/part-time status ...................... 15
Figure 7. Employment distribution by industry by payroll status ........................................... 16
Figure 8. Employment distribution by industry by nativity .................................................... 18
Figure 9. Labor earning by industry: Hawaii vs U.S. ................................................................ 19
Figure 10. Average labor earning by industry by gender ........................................................ 20
Figure 11. Average labor earning by industry by major race group ........................................ 23
Figure 12. Average labor earning by industry by educational attainment .............................. 24
Figure 13. Average labor earning by industry by full-time/part-time status ........................... 25
Figure 14. Average labor earning by industry by payroll status .............................................. 26
Figure 15. Average labor earning by industry by nativity ....................................................... 27
Figure 16. Average wage for full-time payroll workers by industry: Hawaii vs U.S. ................ 28
Figure 17. Average wage for full-time payroll workers by industry by gender ........................ 29
Figure 18. Average wage for full-time payroll workers by nativity ......................................... 33

4 | P a g e
EXECUTIVE SUMMARY Employment The major industry structure difference between Hawaii and the U.S., in terms of employment, lies in tourism and Manufacturing during the 2012-2016 period. Top three industries with the largest employment for the U.S. were Healthcare and Social Assistance (13.8%), Retail Trade (11.5%), and Manufacturing (10.4%), while the top three industries in Hawaii were Accommodation and Food Services (13.6%), Retail Trade (11.6%), and Healthcare and Social Assistance (11.4%). Male to female ratio in Hawaii’s workforce was 51.9 males, 48.1 females per 100 workers during the 2012-2016 period. Construction sector was the top industry dominated by male workers at 89.8% versus 10.2% female workers. Utilities had the second largest share of male workers at 74.1%. The third largest industry with male workers was Transportation and Warehousing with 70.1% of male workers. Health Care and Social Assistance sector had the largest share of female workers at 73.3%, followed by Educational Services sector (68.4%). These two industries had more than twice as many female workers as male workers. Finance and Insurance sector was the third largest industry with 65.3% of female workers. Real Estate and Rental and Leasing industry and Accommodation and Food Services had about the same male-female ratio (48.3% male vs. 51.7% female and 50.3% male vs. 49.7% female, respectively). Overall in the state, among the working population, both payroll and self-employed workers, Millennials (those who were born between 1981 and 1998) accounted for one third of the total workforce (33.2%), Generation X (those who born between 1965 and 1980) accounted for 37.3%, Baby Boomers (those who were born between 1946-1964) accounted for 28.3%, and the Silent Generation (those who were born between 1928 and 1945) and the Greatest Generation (those who were born between 1915 and 1927) combined accounted for 1.1% of the total workforce during the 2012-2016 period. Retail Trade, Accommodation and Food Services, and Wholesale Trade industry sectors had a larger proportion of Millennials. Utilities, Professional, Scientific and Technical Services, Construction, Educational Services, Finance and Insurance, Public Administration, Health Care and Social Assistance, Administrative and Support and Waste Management and Remediation Services, Manufacturing, Transportation and Warehousing, Information, and Other Services had a bigger share of Generation X workers. Agriculture, Forestry, Fishing and Hunting, Real Estate, Rental and Leasing, Art, Entertainment and Recreation sectors had a larger share of Baby Boomers. Due to the large number of Asians in Hawaii (38% of Hawaii population were pure Asians in 2016), Asians were the largest race group for all the industry sectors except Art, Entertainment and Recreation where White was the dominating race group. White was the second largest race group in Professional, Scientific and Technical Services, Real Estate and Rental and Leasing, Public Administration, Educational Services, Agriculture, and Manufacturing.

5 | P a g e
Educational Services, Professional, Scientific and Technical Services, Finance and Insurance, Health Care and Social Assistance, Public Administration, and Information sectors hired more workers with at least a bachelor degree. On the other hand, Agriculture, Forestry, Fishing and Hunting, Construction, Accommodations and Food Services, Administrative and Support and Waste Management and Remediation Services, and Retail Trade hired more workers with high school diploma (including GED) or below. 78.0 percent of workers had full-time jobs, 22.0 percent of workers had part-time jobs during the 2012-2016 period. Top five industries with more full-time workers included Public Administration (96.2%), Finance and Insurance (92.2%), Construction (86.7%), Manufacturing (84.3%), and Wholesale Trade (84%). Arts, Entertainment and Recreation industry had the largest percentage share of part-time workers at 40.9% followed by Retail Trade (32.2%), Other Services (31.8%), and Accommodation and Food Services (30.7%). 89.5 percent of total workers in the state were wage and salary (payroll) workers, with the rest 10.5 percent were self-employed proprietors during the 2012-2016 period. All workers in Public Administration sector were wage and salary employees. Majority of workers in Educational Services, Accommodation and Food Services sectors were wage and salary employees (97.2% and 96.6%, respectively). The largest percentage share of self-employed workers was found in Agriculture, Forestry, Fishing and Hunting industry at 31.7%, followed by Other Services (26.7%), Professional, Scientific and Technical Services (24.3%) and Real Estate and Rental and Leasing (23.3%). Labor Earnings The top paying industry in the country was Professional, Scientific and Technical Services sector with average annual labor earning of $80,833. People in the same industry in Hawaii earned 82.0% of the U.S. average labor earning. The No.1 industry with the highest labor earning in Hawaii was Utilities ($70,576). In most industries, the U.S. average labor earnings were higher than those of Hawaii. However, there were a few industries where Hawaii average labor earnings were higher than the U.S. averages. These industries included Accommodation and Food Services ($9,630 higher than the U.S. average), Construction ($7,915 higher) and Health Care and Social Assistance ($7,312 higher). The state average labor earning for male workers was $51,566, $12,921 higher than the average labor earning by female workers ($38,645). Male workers earned more on average than females in all the industries except Agriculture, Forestry, Fishing and Hunting where female workers earned more than males ($42,762 for female and $33,872 for male). In general, average labor earning increased with age until Baby Boomers age (52-70 years of age during the 2012-2016 period). In all the industry sectors, Generation X had higher average earnings than Millennials. Average labor earnings for White alone were higher than other major race groups in all the industry sectors except Art, Entertainment and Recreation where Asians had higher average labor earning at $32,771, higher than that of White alone at $31,612.

6 | P a g e
Average labor earnings had a close positive relationship with education level. The higher the education level, the higher the earnings and it is true for all the industry sectors. The average labor earning of the workers with high school diploma (including GED) or below was $32,653, workers with associate degree and some college education earned an average income of $39,551, and workers with bachelor degree or above earned an average income of $63,700. Overall for all the industries, full-time workers had $52,907 average labor earning and part-time workers had an average labor earning of $18,591 during the 2012-2016 period. Full-time workers in Professional, Scientific and Technical Services had the highest average labor earning at $75,889 per year, followed by Utilities at $72,187, Health Care and Social Assistance at $64,052, Finance and Insurance at $62,950, Information at $62,725, and Public Administration at $60,861. Full-time workers in Accommodation and Food Services had the lowest average labor earning at $37,591 per year during the 2012-2016 period. State average labor earning for payroll (wage and salary) workers was $44,584 per year, including full-time and part-time workers during the 2012-2016 period. Self-employed workers made more money on average than payroll workers. The average labor earning for self-employed workers was $51,868 per year, 16.3% higher than that of payroll workers. Wages of Full-Time Payroll Employees Overall industry average wage of full-time payroll workers was $51,347 for Hawaii, lower than the U.S. average of $54,840 during the 2012-2016 period. In other words, Hawaii’s average wage for full-time payroll workers was 93.6% of the U.S. average. U.S. average wages were higher than those of Hawaii in most of the industry sectors, except Agriculture, Forestry, Fishing and Hunting, Construction, Transportation and Warehousing, Administration and Support and Waste Management and Remediation Services, Health Care and Social Assistance, and Accommodation and Food Services. Among the full-time payroll workers in Hawaii and for all the industry sectors combined, male employees had an average annual wage of $55,925, about $10,000 higher than female workers at $45,948. An average male worker earned more wage than an average female worker for all industry sectors except Agriculture, Forestry, Fishing and Hunting, and Arts, Entertainment and Recreation where an average female worker earned more than an average male worker. Average wage increased with age, especially up to the Baby Boomer’s age, for most of the industry sectors. This indicates that experience did play an important role in wage level. Among the Millennials, those worked in Utilities had the highest average wage at $59,226 per year, followed by Professional, Scientific and Technical Services at $56,940, Public Administration at $49,495, and Health Care and Social Assistance at $47,586. Those Millennials who worked in Agriculture, Forestry, Fishing and Hunting had the lowest annual wage at $29,839 per year.

7 | P a g e
For Generation X workers, Professional, Scientific and Technical Services had the highest annual wage at $74,517, followed by Utilities at $74,129, Health Care and Social Assistance at $69,059, and Information at $66,885. Those Baby Boomers worked in Information had the highest annual wage at $80,974, followed by Professional, Scientific and Technical Services at $78,779, Finance and Insurance at $73,688, and Utilities at $71,832. White had the highest average wage than other major race groups during the 2012-2016 period. The average wage for White was the highest in every industry sectors. Among the workers with White alone race, Professional, Scientific and Technical Services sector had the highest average annual wage at $83,042, followed by Health Care and Social Assistance at $82,914, Information at $78,243.
Average wage went up with educational level for every industry sector. The average annual wage for those with associate degree and some college was 23.2% higher than those with high school diploma or below. Workers with at least bachelor degree had an average annual wage of $67,680, 44.7% higher than those with associate degree, and 78.2% higher than those with high school diploma.

8 | P a g e
Introduction This report provides information on the demographic, social, and economic characteristics of Hawaii’s workforce by major industry sectors at the state level during the 2012-2016 period. The workforce in this report includes civilians 16 years of age and older either employed full-time or part-time with wage and salaries income or/and self-employed with proprietor’s income. Unpaid workers are excluded. The major industries presented in this report is based on 2012 North American Industry Classification System (NAICS). There are 20 major industry sectors classified by 2-digit code as presented in table 1. Table 1. 2012 North American Industry Classification System
Sector Description 11 Agriculture, Forestry, Fishing and Hunting 21 Mining, Quarrying, and Oil and Gas Extraction 22 Utilities 23 Construction
31-33 Manufacturing 42 Wholesale Trade
44-45 Retail Trade 48-49 Transportation and Warehousing
51 Information 52 Finance and Insurance 53 Real Estate and Rental and Leasing 54 Professional, Scientific and Technical Services 55 Management of Companies and Enterprises 56 Administrative and Support and Waste Management and Remediation Services 61 Educational Services 62 Health Care and Social Assistance 71 Arts, Entertainment and Recreation 72 Accommodation and Food Services 81 Other Services, except Public Administration 92 Public Administration
Source: the U.S. Census Bureau, North American Industry Classification System, https://www.census.gov/cgi-bin/sssd/naics/naicsrch?chart=2012 The data source for this report is the U.S. Census Bureau’s American Community Survey (ACS) 2012-2016 5-Year estimates PUMS data. The ACS is the survey conducted nationwide throughout the year and collects information on demographic, social, economic and housing characteristics of households and people. About 9.2% of Hawaii’s population were surveyed during the five-year period by the U.S. Census Bureau. Due to the small sample size, Mining, Quarrying, and Oil and Gas Extraction (NAICS code = 21) and Management of Companies and Enterprises (NAICS code = 55) are excluded from this report.
9 | P a g e
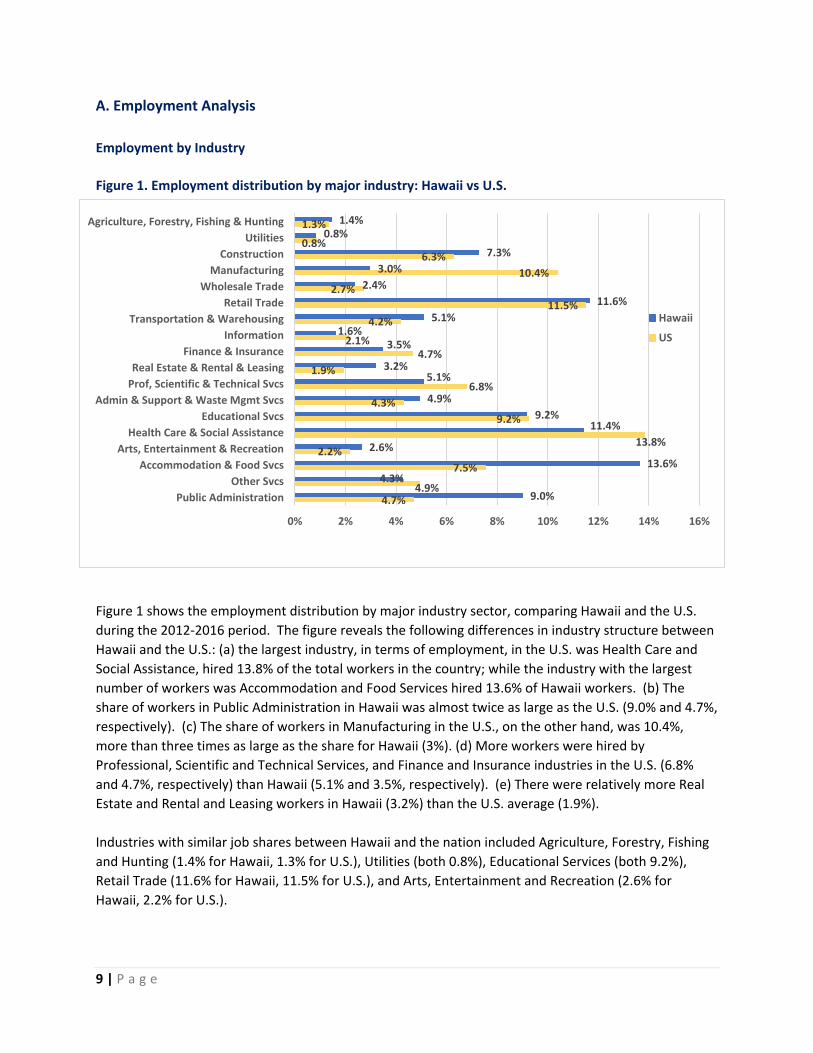
A. Employment Analysis Employment by Industry Figure 1. Employment distribution by major industry: Hawaii vs U.S.
Figure 1 shows the employment distribution by major industry sector, comparing Hawaii and the U.S. during the 2012-2016 period. The figure reveals the following differences in industry structure between Hawaii and the U.S.: (a) the largest industry, in terms of employment, in the U.S. was Health Care and Social Assistance, hired 13.8% of the total workers in the country; while the industry with the largest number of workers was Accommodation and Food Services hired 13.6% of Hawaii workers. (b) The share of workers in Public Administration in Hawaii was almost twice as large as the U.S. (9.0% and 4.7%, respectively). (c) The share of workers in Manufacturing in the U.S., on the other hand, was 10.4%, more than three times as large as the share for Hawaii (3%). (d) More workers were hired by Professional, Scientific and Technical Services, and Finance and Insurance industries in the U.S. (6.8% and 4.7%, respectively) than Hawaii (5.1% and 3.5%, respectively). (e) There were relatively more Real Estate and Rental and Leasing workers in Hawaii (3.2%) than the U.S. average (1.9%). Industries with similar job shares between Hawaii and the nation included Agriculture, Forestry, Fishing and Hunting (1.4% for Hawaii, 1.3% for U.S.), Utilities (both 0.8%), Educational Services (both 9.2%), Retail Trade (11.6% for Hawaii, 11.5% for U.S.), and Arts, Entertainment and Recreation (2.6% for Hawaii, 2.2% for U.S.).
1.4%0.8%
7.3%3.0%
2.4%11.6%
5.1%1.6%
3.5%
3.2%5.1%
4.9%9.2%
11.4%
2.6%13.6%
4.3%9.0%
1.3%0.8%
6.3%10.4%
2.7%11.5%
4.2%2.1%
4.7%1.9%
6.8%4.3%
9.2%
13.8%2.2%
7.5%
4.9%4.7%
0% 2% 4% 6% 8% 10% 12% 14% 16%
Agriculture, Forestry, Fishing & HuntingUtilities
ConstructionManufacturing
Wholesale TradeRetail Trade
Transportation & WarehousingInformation
Finance & InsuranceReal Estate & Rental & Leasing
Prof, Scientific & Technical SvcsAdmin & Support & Waste Mgmt Svcs
Educational SvcsHealth Care & Social Assistance
Arts, Entertainment & RecreationAccommodation & Food Svcs
Other SvcsPublic Administration
Hawaii
US
10 | P a g e
Looking at the top three industries, in terms of employment, both Healthcare and Social Assistance and Retail Trade were among the top three for both Hawaii and the nation. The difference lies in Tourism and Manufacturing. As an indication of the stronger Tourism industry in Hawaii, Accommodation and Food Services was among the top three industries, ranked No.1 in Hawaii. Manufacturing was among the top three industries for the U.S. indicated that Manufacturing was one of the core industries in the country.
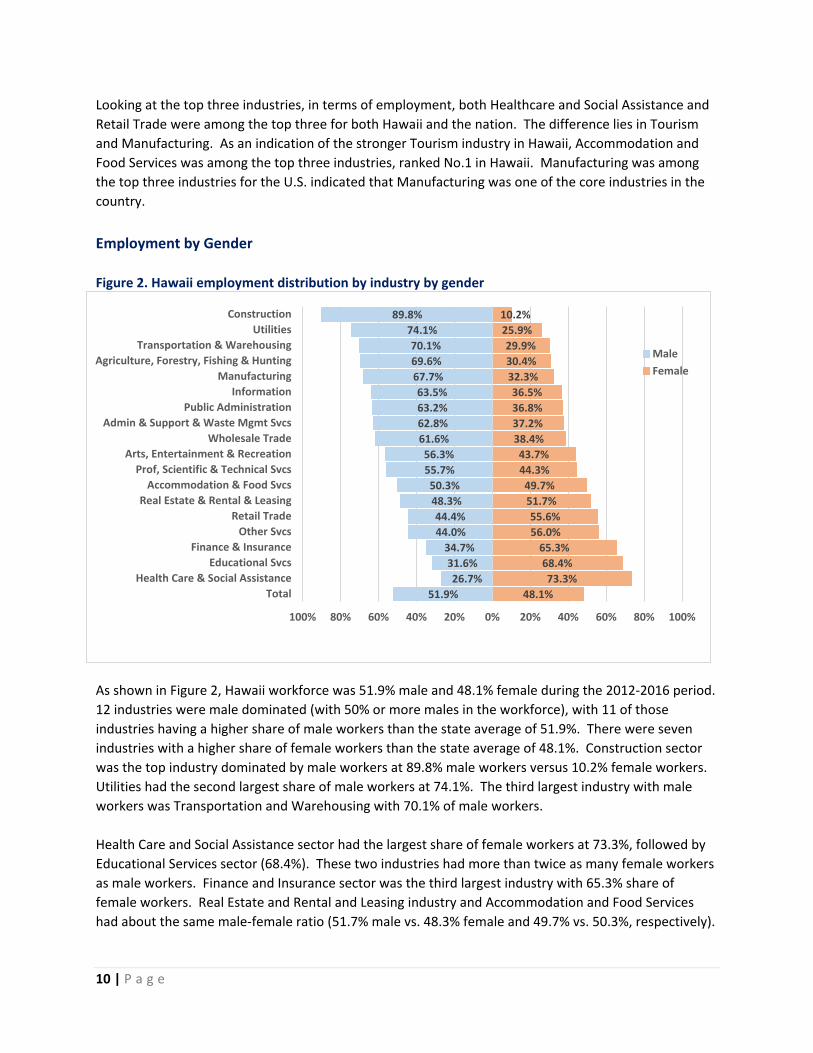
Employment by Gender Figure 2. Hawaii employment distribution by industry by gender
As shown in Figure 2, Hawaii workforce was 51.9% male and 48.1% female during the 2012-2016 period. 12 industries were male dominated (with 50% or more males in the workforce), with 11 of those industries having a higher share of male workers than the state average of 51.9%. There were seven industries with a higher share of female workers than the state average of 48.1%. Construction sector was the top industry dominated by male workers at 89.8% male workers versus 10.2% female workers. Utilities had the second largest share of male workers at 74.1%. The third largest industry with male workers was Transportation and Warehousing with 70.1% of male workers. Health Care and Social Assistance sector had the largest share of female workers at 73.3%, followed by Educational Services sector (68.4%). These two industries had more than twice as many female workers as male workers. Finance and Insurance sector was the third largest industry with 65.3% share of female workers. Real Estate and Rental and Leasing industry and Accommodation and Food Services had about the same male-female ratio (51.7% male vs. 48.3% female and 49.7% vs. 50.3%, respectively).
48.1%73.3%
68.4%65.3%
56.0%55.6%
51.7%49.7%
44.3%43.7%
38.4%37.2%36.8%36.5%
32.3%30.4%29.9%
25.9%10.2%
51.9%26.7%
31.6%34.7%
44.0%44.4%
48.3%50.3%
55.7%56.3%
61.6%62.8%63.2%63.5%
67.7%69.6%70.1%
74.1%89.8%
100% 80% 60% 40% 20% 0% 20% 40% 60% 80% 100%
TotalHealth Care & Social Assistance
Educational SvcsFinance & Insurance
Other SvcsRetail Trade
Real Estate & Rental & LeasingAccommodation & Food Svcs
Prof, Scientific & Technical SvcsArts, Entertainment & Recreation
Wholesale TradeAdmin & Support & Waste Mgmt Svcs
Public AdministrationInformation
ManufacturingAgriculture, Forestry, Fishing & Hunting
Transportation & WarehousingUtilities
Construction
MaleFemale
11 | P a g e
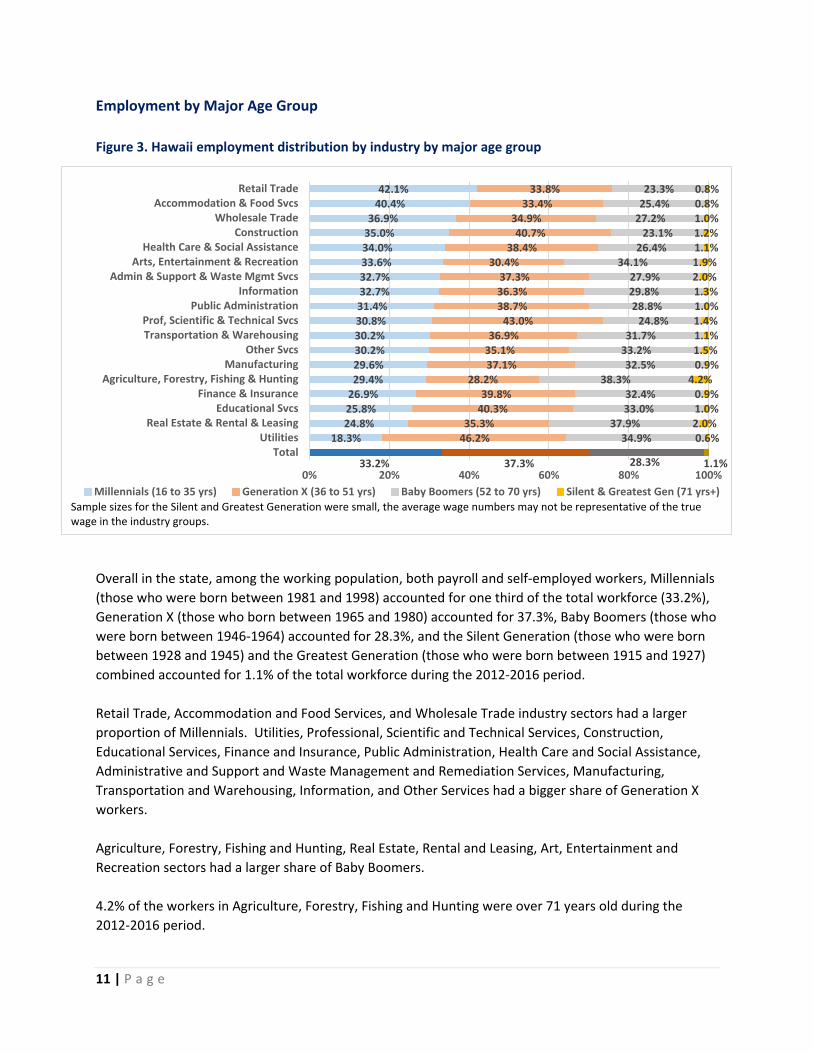
Employment by Major Age Group Figure 3. Hawaii employment distribution by industry by major age group
Overall in the state, among the working population, both payroll and self-employed workers, Millennials (those who were born between 1981 and 1998) accounted for one third of the total workforce (33.2%), Generation X (those who born between 1965 and 1980) accounted for 37.3%, Baby Boomers (those who were born between 1946-1964) accounted for 28.3%, and the Silent Generation (those who were born between 1928 and 1945) and the Greatest Generation (those who were born between 1915 and 1927) combined accounted for 1.1% of the total workforce during the 2012-2016 period. Retail Trade, Accommodation and Food Services, and Wholesale Trade industry sectors had a larger proportion of Millennials. Utilities, Professional, Scientific and Technical Services, Construction, Educational Services, Finance and Insurance, Public Administration, Health Care and Social Assistance, Administrative and Support and Waste Management and Remediation Services, Manufacturing, Transportation and Warehousing, Information, and Other Services had a bigger share of Generation X workers. Agriculture, Forestry, Fishing and Hunting, Real Estate, Rental and Leasing, Art, Entertainment and Recreation sectors had a larger share of Baby Boomers. 4.2% of the workers in Agriculture, Forestry, Fishing and Hunting were over 71 years old during the 2012-2016 period.
33.2%
18.3%24.8%25.8%26.9%29.4%29.6%30.2%30.2%30.8%31.4%32.7%32.7%33.6%34.0%35.0%36.9%
40.4%42.1%
37.3%
46.2%35.3%
40.3%39.8%
28.2%37.1%35.1%36.9%
43.0%38.7%36.3%37.3%
30.4%38.4%
40.7%34.9%
33.4%33.8%
28.3%
34.9%37.9%
33.0%32.4%
38.3%32.5%
33.2%31.7%
24.8%28.8%
29.8%27.9%
34.1%26.4%
23.1%27.2%25.4%23.3%
1.1%
0.6%2.0%1.0%0.9%
4.2%0.9%1.5%1.1%1.4%1.0%1.3%2.0%1.9%1.1%1.2%1.0%0.8%0.8%
0% 20% 40% 60% 80% 100%
TotalUtilities
Real Estate & Rental & LeasingEducational Svcs
Finance & InsuranceAgriculture, Forestry, Fishing & Hunting
ManufacturingOther Svcs
Transportation & WarehousingProf, Scientific & Technical Svcs
Public AdministrationInformation
Admin & Support & Waste Mgmt SvcsArts, Entertainment & Recreation
Health Care & Social AssistanceConstruction
Wholesale TradeAccommodation & Food Svcs
Retail Trade
Millennials (16 to 35 yrs) Generation X (36 to 51 yrs) Baby Boomers (52 to 70 yrs) Silent & Greatest Gen (71 yrs+)Sample sizes for the Silent and Greatest Generation were small, the average wage numbers may not be representative of the true wage in the industry groups.

12 | P a g e
Employment by Major Race Group Table 2. Hawaii employment distribution by industry by major race group (%)
Industry White Alone
Asian Alone
Native Hawaiian
Alone
Other incl.
Mixed Total 100.0 100.0 100.0 100.0 Health Care & Social Assistance 11.5 12.2 9.3 10.7 Public Administration 10.8 7.3 10.0 9.9 Educational Svcs 10.7 8.6 10.8 8.3 Accommodation & Food Svcs 9.6 16.5 10.9 13.4 Retail Trade 9.4 12.5 10.4 12.7 Prof, Scientific & Technical Svcs 8.0 4.9 3.1 3.2 Construction 7.5 5.9 10.7 8.5 Admin & Support & Waste Mgmt Svcs 4.7 4.5 5.7 5.7 Real Estate & Rental & Leasing 4.6 2.8 2.0 2.7 Other Svcs 4.4 4.3 3.4 4.3 Transportation & Warehousing 4.1 4.4 7.6 6.5 Arts, Entertainment & Recreation 3.7 2.0 2.7 2.6 Manufacturing 2.9 3.3 2.6 2.6 Finance & Insurance 2.2 4.5 3.2 3.1 Wholesale Trade 2.0 2.5 2.6 2.5 Information 1.7 1.3 1.7 1.9 Agriculture, Forestry, Fishing & Hunting 1.6 1.6 1.8 0.9 Utilities 0.6 1.0 1.4 0.7
Health Care and Social Assistance industry was the top industry among White alone workers at 11.5%, followed by Public Administration (10.8%), Educational Services (10.7%) and Accommodation and Food Services (9.6%) during the 2012-2016 period. Among Asian alone workers, Accommodation and Food Services was the top industry accounted for 16.5%. Retail Trade was the second highest industry among Asian alone workers at 12.5%, followed by Health Care and Social Assistance (12.2%) and Educational Services (8.6%). More than 50% of pure Native Hawaiians worked in five industries. The largest number of Hawaiian alone workers were found in Accommodation and Food Services (10.9%) followed by Educational Services (10.8%), Construction (10.7%), Retail Trade (10.4%) and Public Administration (10.0%).

13 | P a g e
Figure 4. Employment distribution by industry by major race group
Due to the large number of Asians in Hawaii (38% of Hawaii population were pure Asians in 2016), Asians were the largest race group for all the industry sectors except Art, Entertainment and Recreation where White was the dominating race group. White was the second largest race group in Professional, Scientific and Technical Services, Real Estate and Rental and Leasing, Public Administration, Educational Services, Agriculture, Forestry, Fishing and Hunting, and Manufacturing.
0%10%20%30%40%50%60%70%80%90%
100%Pr
of, S
cien
tific
&Te
chni
cal S
vcs
Real
Est
ate
& R
enta
l &Le
asin
gAr
ts, E
nter
tain
men
t &Re
crea
tion
Publ
ic A
dmin
istr
atio
n
Educ
atio
nal S
vcs
Agric
ultu
re, F
ores
try,
Fish
ing
& H
untin
g
Info
rmat
ion
Cons
truc
tion
Oth
er S
vcs
Hea
lth C
are
& S
ocia
lAs
sist
ance
Man
ufac
turin
g
Adm
in &
Sup
port
&W
aste
Mgm
t Svc
s
Who
lesa
le T
rade
Reta
il Tr
ade
Tran
spor
tatio
n &
War
ehou
sing
Util
ities
Acco
mm
odat
ion
& F
ood
Svcs
Fina
nce
& In
sura
nce
White Alone Aisan Alone Native Hawaiian Alone Other incl. Mixed

14 | P a g e
Employment by Educational Attainment Figure 5. Employment distribution by industry and educational attainment
Figure 5 presents the education level of Hawaii workers. Of the total civilian workers in Hawaii, it was roughly one third at each education level: high school diploma or below (32%), associate degree and some college (34.8%), and bachelor degree and above (33.1%) during the 2012-2016 period. 10 industries had higher than state average percentage share of workers with education level at high school diploma or below. 14 industries had a larger share of workers with associate degree and some college than the state average of 34.8%. 7 industries had a larger share of workers with bachelor degree or above than the state average of 33.1%. Among the high school diploma or below level, Agriculture, Forestry, Fishing and Hunting sector had the largest percentage share of workers in this education category at 54.9%, followed by Construction (49.1%), Accommodation and Food Services (49.0%), Administrative and Support and Waste Management and Remediation Services (48.6%). Retail Trade sector had the largest share of the workers with associate degree and some college at 40.6%, followed by Transportation and Warehousing (39.7%) and Manufacturing (39.5%). Educational Services sector had the largest share of the workers with bachelor degree or above at 65.3%, followed by Professional, Scientific and Technical Services (63.9%) and Finance and Insurance (47.5%). About equal share of workers with high school diploma or below and the workers with associate degree and some college were found in Retail Trade (40.9% and 40.6%, respectively). It is apparent from Figure 5 that Educational Services, Professional, Scientific and Technical Services, Finance and Insurance, Health Care and Social Assistance, Public Administration, and Information sectors hired more workers with at least a bachelor degree. On the other hand, Agriculture,
32.0%13.0%
10.5%17.4%16.6%16.9%
25.8%27.0%
31.8%32.5%
38.7%38.6%
35.9%38.5%
48.6%54.9%
40.9%49.0%49.1%
34.8%21.7%25.6%
35.1%36.0%
38.4%35.8%
36.8%36.1%
37.9%35.3%36.3%
39.5%39.7%
31.4%25.8%
40.6%35.9%36.0%
33.1%65.3%63.9%
47.5%47.4%
44.7%38.4%36.3%
32.0%29.6%
26.0%25.2%24.5%
21.8%20.0%19.3%18.5%
15.1%14.9%
0% 10% 20% 30% 40% 50% 60% 70% 80% 90% 100%
TotalEducational Svcs
Prof, Scientific & Technical SvcsFinance & Insurance
Health Care & Social AssistancePublic Administration
InformationUtilities
Real Estate & Rental & LeasingArts, Entertainment & Recreation
Wholesale TradeOther Svcs
ManufacturingTransportation & Warehousing
Admin & Support & Waste Mgmt SvcsAgriculture, Forestry, Fishing & Hunting
Retail TradeAccommodation & Food Svcs
Construction
High school diploma or below Associate degree and some college Bachelor degree or above

15 | P a g e
Construction, Administrative and Support and Waste Management and Remediation Services, Retail Trade, and Accommodations and Food Services hired more workers with lower education levels.
Employment by Full-Time and Part-Time Status
Figure 6. Employment distribution by industry and full-time/part-time status
Full-time workers in this report are defined as anyone who worked for 35 hours or more per week. Part-time workers are defined as anyone who worked for 1 to 34 hours per week. Under this definition, a worker who had two part-time jobs was included in the part-time category even the person worked more than 35 hours per week collectively. The ACS survey asked respondents to report only one job if a person had two jobs. During the 2012-2016 period, 78.0 percent of workers had full-time jobs in the state, and 22.0 percent of workers had part-time jobs. 11 industries had larger percentage share of full-time workers than the state average. Large percentage share of full-time workers was found in Public Administration sector at 96.2%, followed by Finance and Insurance at 92.2% and Construction at 86.7%. Arts, Entertainment and Recreation industry had the largest percentage share of part-time workers at 40.9%. The other industries with higher percentage share of the part-time workers were Retail Trade (32.2%), Other Services (31.8%), and Accommodation and Food Services (30.7%). Industries more likely with office workers such as Public Administration, Finance and Insurance, information, and Professional, Scientific and Technical Services had a higher share of full-time workers.
78.0%
59.1%67.8%68.2%69.3%
72.9%75.2%
79.4%79.6%79.9%80.8%81.0%82.5%84.0%84.3%86.7%
92.2%96.2%
22.0%
40.9%32.2%31.8%30.7%
27.1%24.8%
20.6%20.4%20.1%19.2%19.0%17.5%16.0%15.7%13.3%
7.8%3.8%
0% 10% 20% 30% 40% 50% 60% 70% 80% 90% 100%
TotalUtilities*
Arts, Entertainment & RecreationRetail Trade
Other SvcsAccommodation & Food Svcs
Educational SvcsAdmin & Support & Waste Mgmt Svcs
Agriculture, Forestry, Fishing & HuntingTransportation & WarehousingHealth Care & Social AssistanceProf, Scientific & Technical SvcsReal Estate & Rental & Leasing
InformationWholesale Trade
ManufacturingConstruction
Finance & InsurancePublic Administration
Full-time Part-time*Excluded due to a small sample size of part-time workers

16 | P a g e
Employment by Payroll Status Figure 7. Employment distribution by industry by payroll status
Figure 7 presents the payroll status of Hawaii workers by industry sector. Overall, 89.5 percent of total workers in the state were wage and salary (payroll) workers, 10.5 percent of total workers were self-employed during the 2012-2016 period. The percentage share of wage and salary employees in seven industries were larger than the state average. All workers in Public Administration sector were wage and salary employees. Majority of the workers in Educational Services, Accommodation and Food Services sectors were wage and salary employees (97.2% and 96.6%, respectively). 10 industries had larger percentage share of self-employed workers than the state average. The largest percentage share of self-employed workers was found in Agriculture, Forestry, Fishing and Hunting industry at 31.7%, followed by other services (26.7%), Professional, Scientific and Technical Services (24.3%) and Real Estate and Rental and Leasing (23.3%).
89.5%
68.3%73.3%75.7%76.7%
80.0%81.6%82.6%83.5%
87.0%89.1%90.5%92.1%92.5%93.6%
96.6%97.2%100.0%
10.5%
31.7%26.7%24.3%23.3%
20.0%18.4%17.4%16.5%
13.0%10.9%
9.5%7.9%7.5%6.4%
3.4%2.8%
0.0%
0% 10% 20% 30% 40% 50% 60% 70% 80% 90% 100%
TotalUtilities*
Agriculture, Forestry, Fishing & HuntingOther Svcs
Prof, Scientific & Technical SvcsReal Estate & Rental & Leasing
Arts, Entertainment & RecreationAdmin & Support & Waste Mgmt Svcs
ConstructionInformation
Wholesale TradeManufacturing
Health Care & Social AssistanceTransportation & Warehousing
Retail TradeFinance & Insurance
Accommodation & Food SvcsEducational Svcs
Public Administration
W&S employees Self-employed*Excluded due to a small sample size of self-employed workers

17 | P a g e
Employment by Nativity Table 3. Employment by industry by nativity (%)
In this report, Native refers to those people who were U.S. or U.S territorial citizens at birth regardless where they were born. Foreign born refers to those people who were not U.S. or U.S. territorial citizens at birth. Hawaii ranked the No.1 state in terms of foreign born population. In 2016, 10.1% of Hawaii’s population were born in foreign countries. Among the Hawaii working population during the 2012-2016 period, 22% were born in foreign countries. 54.4% of native workers worked in five industries. Retail Trade and Health Care and Social Assistance industries were the
top two industries among native workers both at 11.3%, followed by Accommodation and Food Services (11.1%), Public Administration (10.4%). 10.3% of the native workers were found working in Educational Services. Almost one fourth of foreign born workers were found in Accommodation and Food Services (22.5%). Foreign born workers also liked to work in Retail Trade (12.8%) and Health Care and Social Assistance (11.8%). By industry, as shown in Figure 8, Agriculture, Forestry, Fishing and Hunting had the largest share of foreign born workers at about 38.8%, followed by Accommodation and Food Services at 36.3%, Administration and Support and Waste Management and Remediation Services at 30.5%. Public Administration sector which consists of Federal, State, and local governments, had the least foreign born employees at 10%.
Industry Native Foreign
born Total 100.0 100.0 Retail Trade 11.3 12.8 Health Care & Social Assistance 11.3 11.8 Accommodation & Food Services 11.1 22.5 Public Administration 10.4 4.1 Educational Services 10.3 5.3 Construction 7.9 5.1 Prof, Scientific & Technical Svcs 5.5 3.5 Transportation & Warehousing 5.2 4.5 Admin & Support & Waste Mgmt Svcs 4.4 6.8 Other Svcs 4.1 4.8 Finance & Insurance 3.7 2.8 Real Estate & Rental & Leasing 3.2 3.3 Manufacturing 2.8 3.4 Arts, Entertainment & Recreation 2.6 2.6 Wholesale Trade 2.3 2.4 Information 1.7 1.1 Agriculture, Forestry, Fishing & Hunting 1.1 2.5 Utilities 0.9 0.4

18 | P a g e
Figure 8. Employment distribution by industry by nativity
0%10%20%30%40%50%60%70%80%90%
100%To
tal
Publ
ic A
dmin
istr
atio
n
Util
ities
Educ
atio
nal S
vcs
Prof
, Sci
entif
ic &
Tec
hnic
al S
vcs
Cons
truc
tion
Info
rmat
ion
Fina
nce
& In
sura
nce
Tran
spor
tatio
n &
War
ehou
sing
Arts
, Ent
erta
inm
ent &
Rec
reat
ion
Who
lesa
le T
rade
Hea
lth C
are
& S
ocia
l Ass
ista
nce
Real
Est
ate
& R
enta
l & L
easi
ng
Reta
il Tr
ade
Oth
er S
vcs
Man
ufac
turin
g
Adm
in &
Sup
port
& W
aste
Mgm
tSv
cs
Acco
mm
odat
ion
& F
ood
Svcs
Agric
ultu
re, F
ores
try,
Fis
hing
&H
untin
g
Native Foreign born

19 | P a g e
B. Average Labor Earning Analysis This section provides comparisons of average labor earnings by industry and by employee’s demographic and social characteristics. Labor earning in this section includes wage and salaries of both full-time and part-time payroll employees, as well as proprietor’s income of self-employed individuals. Fringe benefits are not included in this labor earning definition. The statistics in this section would provide a general information about return on labor by industry and by employee characteristics. Average Labor Earning by Industry Figure 9. Labor earning by industry: Hawaii vs U.S.
Figure 9 shows the average labor earning by major industry, comparing Hawaii and the U.S. during the 2012-2016 period. The figure shows some differences between Hawaii and the U.S. The top paying industry in the country was Professional, Scientific and Technical Services sector with average annual labor earning of $80,833. People in the same industry in Hawaii earned 82.0% of the U.S. average labor earning. The No.1 industry with the highest labor earning in Hawaii was Utilities ($70,576), which was the third highest industry in the nation with about the same amount ($71,258). In most industries, the U.S. average labor earnings were higher than those of Hawaii. However, there were a few industries where Hawaii average labor earnings were higher than the U.S. averages. These industries included Accommodation and Food Services ($9,630 higher than the U.S. average), Construction ($7,915 higher)
36,57570,576
52,895
51,44645,881
31,61646,704
54,65559,953
52,61366,272
35,87940,930
56,608
29,94030,555
33,15159,461
37,38471,258
44,98156,545
58,13332,006
47,16964,865
77,44855,159
80,83333,915
42,128
49,29631,121
20,92531,057
58,592
$0
$10,
000
$20,
000
$30,
000
$40,
000
$50,
000
$60,
000
$70,
000
$80,
000
$90,
000
Agriculture, Forestry, Fishing & HuntingUtilities
ConstructionManufacturing
Wholesale TradeRetail Trade
Transportation & WarehousingInformation
Finance & InsuranceReal Estate & Rental & Leasing
Prof, Scientific & Technical SvcsAdmin & Support & Waste Mgmt Svcs
Educational SvcsHealth Care & Social Assistance
Arts, Entertainment & RecreationAccommodation & Food Svcs
Other SvcsPublic Administration
Hawaii
U.S.

20 | P a g e
and Health Care and Social Assistance ($7,312 higher). Industries with similar average labor earnings between Hawaii and the nation included Retail Trade ($31,616 vs. $32,006, respectively), Transportation and Warehousing ($46,704 vs. $47,169) and Utilities ($70,576 vs. $71,258). Average labor Earning by Gender Figure 10. Average labor earning by industry by gender
During the 2012-2016 period, the state average labor earning for male workers was $51,566, $12,921 higher than the average labor earning by female workers ($38,645). Male workers earned more on average than females in all the industries except Agriculture, Forestry, Fishing and Hunting where female workers earned more than males ($42,762 for female and $33,872 for male). There were nine industries that male labor earnings were higher than the state average. Male workers in Professional, Scientific and Technical Services earned $81,177 annual average, the highest among all industries. There were three other industries with more than $70,000 average male labor earnings. These were Health Care and Social Assistance ($79,104), Finance and Insurance ($78,491) and Utilities ($75,756). The average labor earnings by female workers in 10 industries were higher than the state average. Female workers earned $55,784 in Utilities, the highest among all industries.
33,872
75,756
53,29457,729
50,930
38,475
49,532
61,156
78,491
57,688
81,177
37,670
46,225
79,104
32,599 33,64938,039
63,822
42,762
55,784
49,39438,28537,781
26,14140,070
43,36850,086
47,869 47,506
32,862
38,483
48,434
26,51827,426 29,315
51,972
$0$10,000$20,000$30,000$40,000$50,000$60,000$70,000$80,000$90,000
Agric
ultu
re, F
ores
try,
Fis
hing
&H
untin
g
Util
ities
Cons
truc
tion
Man
ufac
turin
g
Who
lesa
le T
rade
Reta
il Tr
ade
Tran
spor
tatio
n &
War
ehou
sing
Info
rmat
ion
Fina
nce
& In
sura
nce
Real
Est
ate
& R
enta
l & L
easi
ng
Prof
, Sci
entif
ic &
Tec
hnic
al S
vcs
Adm
in &
Sup
port
& W
aste
Mgm
t Svc
s
Educ
atio
nal S
vcs
Hea
lth C
are
& S
ocia
l Ass
ista
nce
Arts
, Ent
erta
inm
ent &
Recr
eatio
n
Acco
mm
odat
ion
& F
ood
Svcs
Oth
er S
vcs
Publ
ic A
dmin
istr
atio
n
Male Female

21 | P a g e
Average Labor Earning by Major Age Group Table 4. Average labor earning by industry by major age group ($)
Millennials
(16 to 35 yrs) Generation X (36 to 51 yrs)
Baby Boomers
(52 to 70 yrs)
Silent & Greatest
Gen (71 yrs+) Total
Total 31,323 53,011 53,860 40,775 45,347 Agriculture, Forestry, Fishing & Hunting 23,593 40,330 45,310 20,212 36,575 Utilities 58,173 72,991 73,618 73,676 70,576 Construction 38,280 58,710 61,075 71,224 52,895 Manufacturing 38,074 60,846 53,237 56,858 51,446 Wholesale Trade 35,427 48,814 55,383 41,239 45,881 Retail Trade 23,071 39,165 39,707 28,728 31,616 Transportation & Warehousing 30,969 52,394 54,754 45,804 46,704 Information 33,288 66,893 67,716 66,271 54,655 Finance & Insurance 34,910 64,198 75,100 87,841 59,953 Real Estate & Rental & Leasing 32,616 58,958 58,173 50,835 52,613 Prof, Scientific & Technical Svcs 46,251 74,980 74,750 61,115 66,272 Admin & Support & Waste Mgmt Svcs 26,161 38,549 43,626 32,276 35,879 Educational Svcs 26,813 46,502 50,794 29,426 40,930 Health Care & Social Assistance 41,316 64,521 64,822 58,471 56,608 Arts, Entertainment & Recreation 20,689 38,727 33,337 22,697 29,940 Accommodation & Food Svcs 22,239 38,231 38,626 23,267 30,555 Other Svcs 27,788 36,859 36,518 18,161 33,151 Public Administration 47,929 64,800 65,257 53,901 59,461
In general, average labor earning increased with age until Baby Boomers age (52-70 years of age during the 2012-2016 period). In all the industry sectors, Generation X had higher average earnings than Millennials. Baby Boomers had higher average earning than Generation X in most of the industry sectors except in Manufacturing (Baby Boomer at $53,237 vs $60,846 for Generation X), Real Estate and Rental and Leasing (Baby Boomers at $58,173 vs $58,958 for Generation X), Professional, Scientific and Technical Services (Baby Boomers at $74,750 vs $74,980 for Generation X), Art, Entertainment and Recreation (Baby Boomers at $33,337 vs $38,727 for Generation X), and Other Services (Baby Boomers at $36,518 vs $36,859 for Generation X). However, the differences between the average labor earnings were small. The difference may be due to the number of part-time workers and/or the number of self-employed workers in these industry sectors.
Sample sizes for the Silent and Greatest Generation were small, the average wage numbers may not be representative of the true wage in the industry groups.

22 | P a g e
Average Labor Earning by Major Race Group Table 5. Average labor earning by industry by major race group ($)
Industry White Alone Asian Alone
Native Hawaiian
Alone Other incl.
Mixed Total 55,597 44,126 36,748 39,706 Agriculture, Forestry, Fishing & Hunting 52,038 32,687 25,483 27,722 Utilities 82,501 69,879 49,020 71,840 Construction 59,661 56,069 40,096 47,436 Manufacturing 67,476 44,954 50,598 48,117 Wholesale Trade 65,888 41,524 38,163 39,963 Retail Trade 37,308 31,875 24,426 28,639 Transportation & Warehousing 60,287 44,196 39,745 43,354 Information 67,483 56,260 48,567 43,068 Finance & Insurance 72,103 62,286 46,221 49,748 Real Estate & Rental & Leasing 61,193 49,078 33,445 48,133 Prof, Scientific & Technical Svcs 76,898 61,262 36,289 60,393 Admin & Support & Waste Mgmt Svcs 44,585 34,826 30,522 31,727 Educational Svcs 47,275 40,716 35,900 35,154 Health Care & Social Assistance 73,131 55,385 40,173 45,484 Arts, Entertainment & Recreation 31,612 32,771 26,504 25,037 Accommodation & Food Svcs 37,451 30,430 25,395 27,148 Other Svcs 37,086 34,155 34,968 27,517 Public Administration 63,698 59,115 52,922 57,045
The average wage and salary and self-employment income earned by White alone workers during the 2012-2016 period was $55,597. Utilities sector had the highest average labor earning by this group ($82,501), followed by Professional, Scientific and Technical Services ($76,898) and Health Care and Social Assistance ($73,131). Compared to other race alone groups, the average labor earning by White alone was higher in all industries except Arts, Entertainment and Recreation sector. The average labor earning by Asian alone followed the same pattern as White alone. Utilities sector was the top industry among Asian alone ($69,879), followed by Finance and Insurance ($62,286) and Professional, Scientific and Technical Services ($61,262). The ratio of income earned by Asian alone ($32,771) to State average ($29,940 in figure 9) in Arts, Entertainment and Recreation sector was 109%, the highest compared to Asian alone worked in other industries.

23 | P a g e
The average labor earning by Hawaiian alone was the highest in Public Administration sector at $52,922. Manufacturing sector was the second highest average earning for Hawaiian alone ($50,598). The third highest average labor earning by Hawaiian alone was Utilities sector ($49,020). The average income earned by this race group in Other Services sector ($34,968) was 105% of the state average ($33,151 in figure 9).
Figure 11. Average labor earning by industry by major race group
$0$10,000$20,000$30,000$40,000$50,000$60,000$70,000$80,000$90,000
Tota
l
Agric
ultu
re, F
ores
try,
Fis
hing
&H
untin
g
Util
ities
Cons
truc
tion
Man
ufac
turin
g
Who
lesa
le T
rade
Reta
il Tr
ade
Tran
spor
tatio
n &
War
ehou
sing
Info
rmat
ion
Fina
nce
& In
sura
nce
Real
Est
ate
& R
enta
l & L
easi
ng
Prof
, Sci
entif
ic &
Tec
hnic
alSv
csAd
min
& S
uppo
rt &
Was
teM
gmt S
vcs
Educ
atio
nal S
vcs
Hea
lth C
are
& S
ocia
lAs
sist
ance
Arts
, Ent
erta
inm
ent &
Recr
eatio
n
Acco
mm
odat
ion
& F
ood
Svcs
Oth
er S
vcs
Publ
ic A
dmin
istr
atio
n
White Alone Aisan Alone Native Hawaiian Alone Other incl. Mixed
24 | P a g e
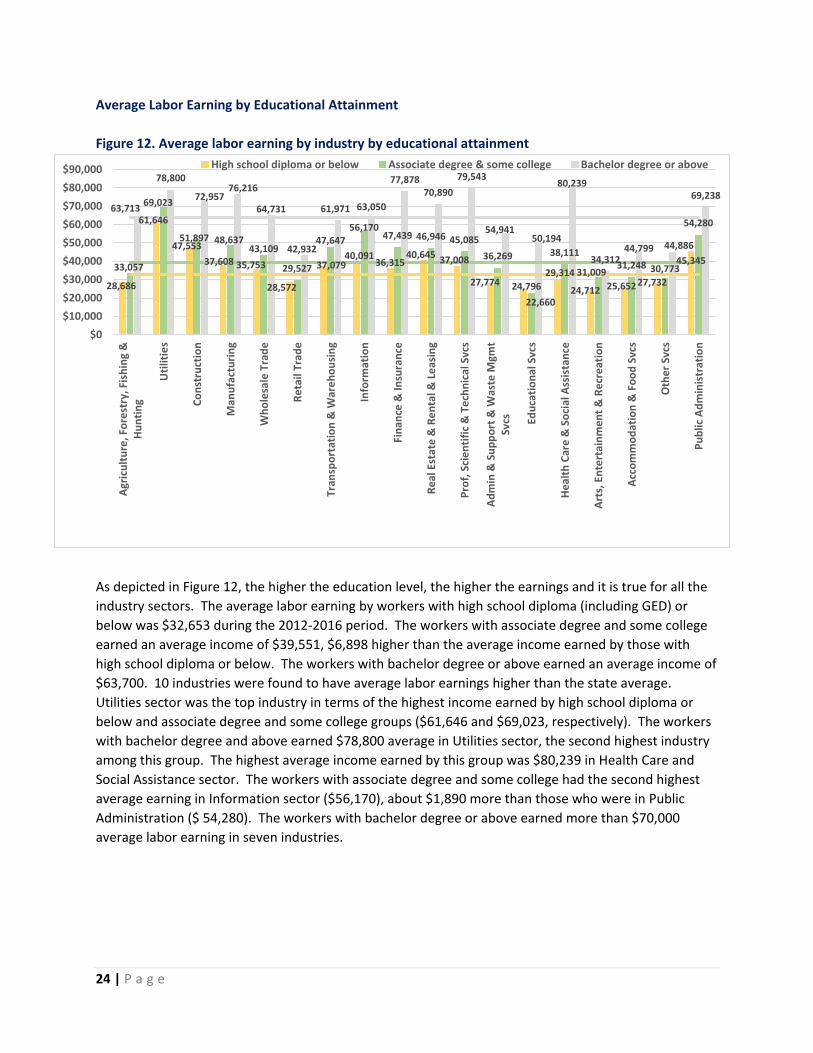
Average Labor Earning by Educational Attainment Figure 12. Average labor earning by industry by educational attainment
As depicted in Figure 12, the higher the education level, the higher the earnings and it is true for all the industry sectors. The average labor earning by workers with high school diploma (including GED) or below was $32,653 during the 2012-2016 period. The workers with associate degree and some college earned an average income of $39,551, $6,898 higher than the average income earned by those with high school diploma or below. The workers with bachelor degree or above earned an average income of $63,700. 10 industries were found to have average labor earnings higher than the state average. Utilities sector was the top industry in terms of the highest income earned by high school diploma or below and associate degree and some college groups ($61,646 and $69,023, respectively). The workers with bachelor degree and above earned $78,800 average in Utilities sector, the second highest industry among this group. The highest average income earned by this group was $80,239 in Health Care and Social Assistance sector. The workers with associate degree and some college had the second highest average earning in Information sector ($56,170), about $1,890 more than those who were in Public Administration ($ 54,280). The workers with bachelor degree or above earned more than $70,000 average labor earning in seven industries.
28,686
61,646
47,55337,608 35,753
28,572
37,07940,091
36,31540,645 37,008
27,774 24,79629,314
24,712 25,652 27,732
45,34533,057
69,023
51,897 48,63743,109
29,527
47,64756,170
47,439 46,946 45,08536,269
22,660
38,111
31,00931,248 30,773
54,28063,713
78,800
72,95776,216
64,731
42,932
61,971 63,050
77,87870,890
79,543
54,94150,194
80,239
34,31244,799 44,886
69,238
$0$10,000$20,000$30,000$40,000$50,000$60,000$70,000$80,000$90,000
Agric
ultu
re, F
ores
try,
Fis
hing
&H
untin
g
Util
ities
Cons
truc
tion
Man
ufac
turin
g
Who
lesa
le T
rade
Reta
il Tr
ade
Tran
spor
tatio
n &
War
ehou
sing
Info
rmat
ion
Fina
nce
& In
sura
nce
Real
Est
ate
& R
enta
l & L
easi
ng
Prof
, Sci
entif
ic &
Tec
hnic
al S
vcs
Adm
in &
Sup
port
& W
aste
Mgm
tSv
cs Educ
atio
nal S
vcs
Hea
lth C
are
& S
ocia
l Ass
ista
nce
Arts
, Ent
erta
inm
ent &
Rec
reat
ion
Acco
mm
odat
ion
& F
ood
Svcs
Oth
er S
vcs
Publ
ic A
dmin
istr
atio
n
High school diploma or below Associate degree & some college Bachelor degree or above

25 | P a g e
Average Labor Earning by Full-Time and Part-Time Status Figure 13. Average labor earning by industry by full-time/part-time status
Overall for all the industries, full-time workers had $52,907 average labor earning and part-time workers had an average labor earning of $18,591 during the 2012-2016 period. Full-time workers in Professional, Scientific and Technical Services had the highest average labor earning at $75,889 per year, followed by Utilities at $72,187, Health Care and Social Assistance at $64,052, Finance and Insurance at $62,950, Information at $62,725, and Public Administration at $60,861. Full-time workers in Accommodation and Food Services had the lowest average labor earning at $37,591 per year during the 2012-2016 period. Part-time workers in Transportation and Warehousing had the highest average labor earning at $31,492 per year, followed by Construction at $27,143, Health Care and Social Assistance at $27,031, Real Estate and Rental and Leasing at $25,773, and Professional, Scientific and Technical Services at $25,762.
42,458
72,187
56,847 56,69550,626
40,224
50,61162,72562,950
58,909
75,889
41,763
51,146
64,052
41,06437,59141,188
60,861
13,948
27,14323,283 21,037
13,482
31,492
16,579
24,77125,773 25,762
18,027
13,517
27,031
13,895 14,67515,950
24,194
$0
$10,000
$20,000
$30,000
$40,000
$50,000
$60,000
$70,000
$80,000
Agric
ultu
re, F
ores
try,
Fis
hing
&H
untin
g
Util
ities
*
Cons
truc
tion
Man
ufac
turin
g
Who
lesa
le T
rade
Reta
il Tr
ade
Tran
spor
tatio
n &
War
ehou
sing
Info
rmat
ion
Fina
nce
& In
sura
nce
Real
Est
ate
& R
enta
l & L
easi
ng
Prof
, Sci
entif
ic &
Tec
hnic
al S
vcs
Adm
in &
Sup
port
& W
aste
Mgm
t Svc
s
Educ
atio
nal S
vcs
Hea
lth C
are
& S
ocia
l Ass
ista
nce
Arts
, Ent
erta
inm
ent &
Recr
eatio
n
Acco
mm
odat
ion
& F
ood
Svcs
Oth
er S
vcs
Publ
ic A
dmin
istr
atio
n
Full-time Part-time
*Part-time workers in Utilities sector is excluded due to a small sample size.
26 | P a g e
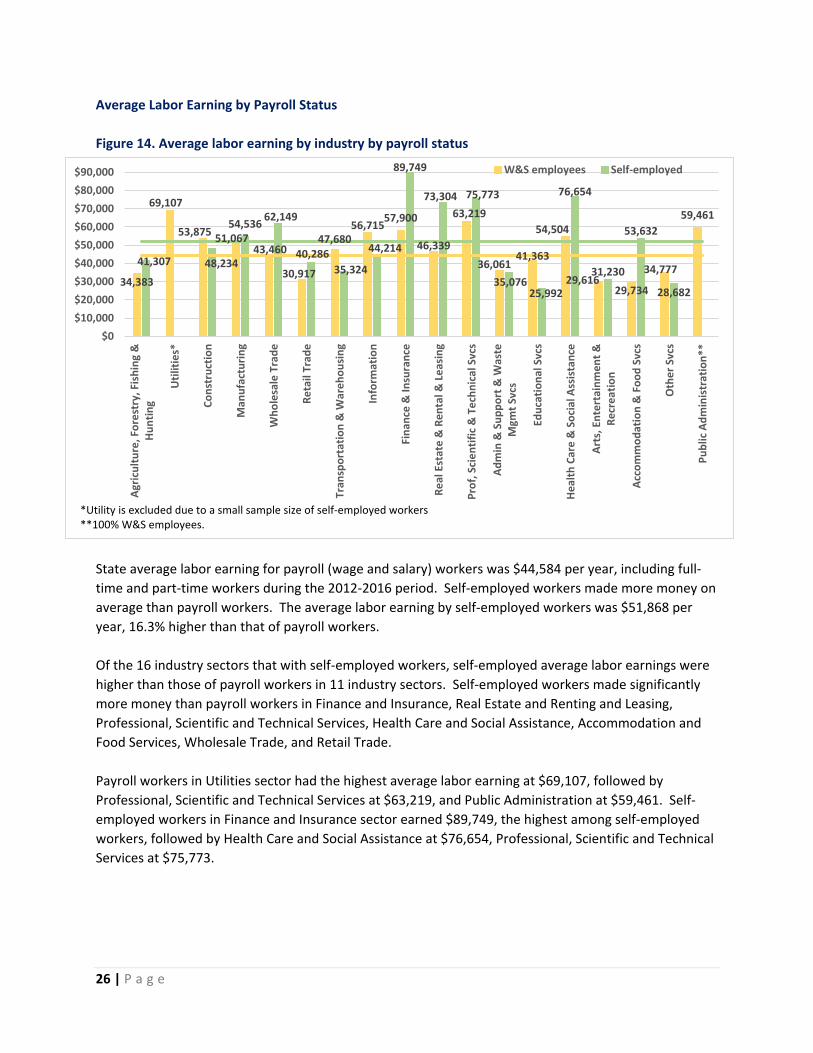
Average Labor Earning by Payroll Status Figure 14. Average labor earning by industry by payroll status
State average labor earning for payroll (wage and salary) workers was $44,584 per year, including full-time and part-time workers during the 2012-2016 period. Self-employed workers made more money on average than payroll workers. The average labor earning by self-employed workers was $51,868 per year, 16.3% higher than that of payroll workers. Of the 16 industry sectors that with self-employed workers, self-employed average labor earnings were higher than those of payroll workers in 11 industry sectors. Self-employed workers made significantly more money than payroll workers in Finance and Insurance, Real Estate and Renting and Leasing, Professional, Scientific and Technical Services, Health Care and Social Assistance, Accommodation and Food Services, Wholesale Trade, and Retail Trade. Payroll workers in Utilities sector had the highest average labor earning at $69,107, followed by Professional, Scientific and Technical Services at $63,219, and Public Administration at $59,461. Self-employed workers in Finance and Insurance sector earned $89,749, the highest among self-employed workers, followed by Health Care and Social Assistance at $76,654, Professional, Scientific and Technical Services at $75,773.
34,383
69,107
53,875 51,06743,460
30,917
47,68056,71557,900
46,339
63,219
36,06141,363
54,504
29,61629,734
34,777
59,461
41,307 48,234
54,536 62,149
40,28635,324
44,214
89,749
73,304 75,773
35,07625,992
76,654
31,230
53,632
28,682
$0$10,000$20,000$30,000$40,000$50,000$60,000$70,000$80,000$90,000
Agric
ultu
re, F
ores
try,
Fis
hing
&H
untin
g
Util
ities
*
Cons
truc
tion
Man
ufac
turin
g
Who
lesa
le T
rade
Reta
il Tr
ade
Tran
spor
tatio
n &
War
ehou
sing
Info
rmat
ion
Fina
nce
& In
sura
nce
Real
Est
ate
& R
enta
l & L
easi
ng
Prof
, Sci
entif
ic &
Tec
hnic
al S
vcs
Adm
in &
Sup
port
& W
aste
Mgm
t Svc
s
Educ
atio
nal S
vcs
Hea
lth C
are
& S
ocia
l Ass
ista
nce
Arts
, Ent
erta
inm
ent &
Recr
eatio
n
Acco
mm
odat
ion
& F
ood
Svcs
Oth
er S
vcs
Publ
ic A
dmin
istr
atio
n**
W&S employees Self-employed
*Utility is excluded due to a small sample size of self-employed workers**100% W&S employees.
27 | P a g e
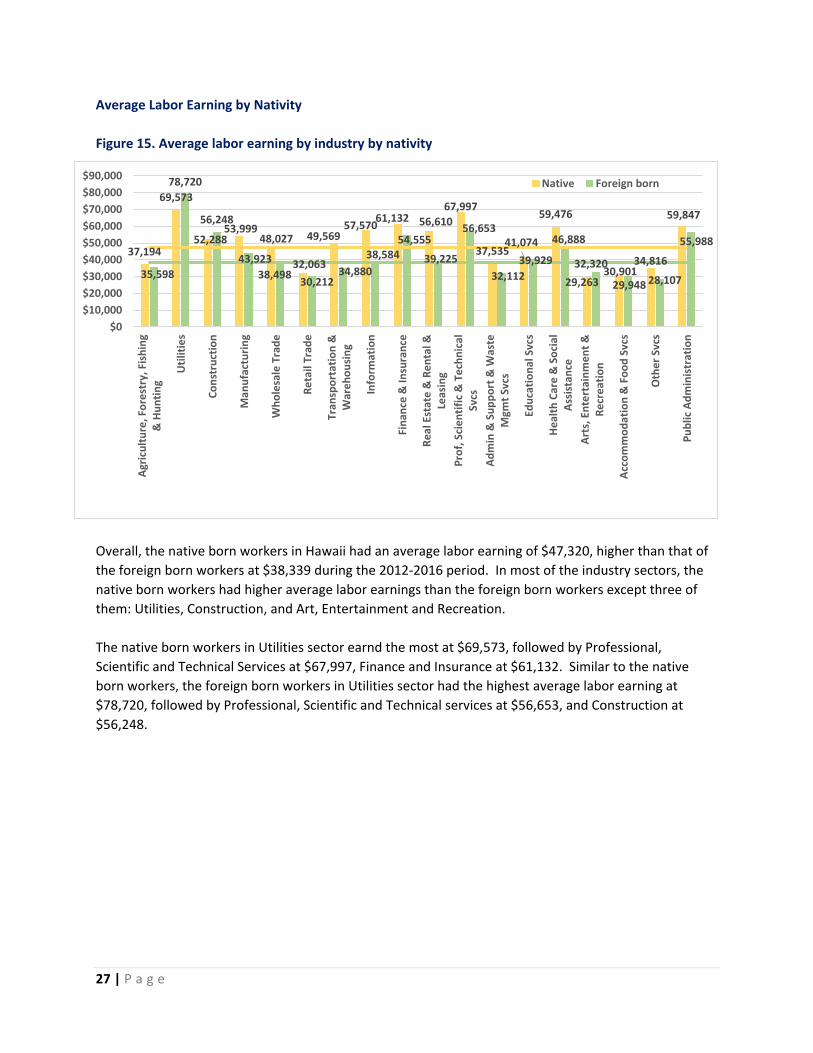
Average Labor Earning by Nativity Figure 15. Average labor earning by industry by nativity
Overall, the native born workers in Hawaii had an average labor earning of $47,320, higher than that of the foreign born workers at $38,339 during the 2012-2016 period. In most of the industry sectors, the native born workers had higher average labor earnings than the foreign born workers except three of them: Utilities, Construction, and Art, Entertainment and Recreation. The native born workers in Utilities sector earnd the most at $69,573, followed by Professional, Scientific and Technical Services at $67,997, Finance and Insurance at $61,132. Similar to the native born workers, the foreign born workers in Utilities sector had the highest average labor earning at $78,720, followed by Professional, Scientific and Technical services at $56,653, and Construction at $56,248.
37,194
69,573
52,28853,999
48,027
32,063
49,56957,57061,132 56,610
67,997
37,53541,074
59,476
29,26330,901
34,816
59,847
35,598
78,720
56,248
43,92338,498 30,212
34,88038,584
54,555
39,225
56,653
32,11239,929
46,888
32,320
29,948 28,107
55,988
$0$10,000$20,000$30,000$40,000$50,000$60,000$70,000$80,000$90,000
Agric
ultu
re, F
ores
try,
Fis
hing
& H
untin
g
Util
ities
Cons
truc
tion
Man
ufac
turin
g
Who
lesa
le T
rade
Reta
il Tr
ade
Tran
spor
tatio
n &
War
ehou
sing
Info
rmat
ion
Fina
nce
& In
sura
nce
Real
Est
ate
& R
enta
l &Le
asin
gPr
of, S
cien
tific
& T
echn
ical
Svcs
Adm
in &
Sup
port
& W
aste
Mgm
t Svc
s
Educ
atio
nal S
vcs
Hea
lth C
are
& S
ocia
lAs
sist
ance
Arts
, Ent
erta
inm
ent &
Recr
eatio
n
Acco
mm
odat
ion
& F
ood
Svcs
Oth
er S
vcs
Publ
ic A
dmin
istr
atio
n
Native Foreign born

28 | P a g e
C. Average Wage Analysis This section provides some statistics on average wages by industry and by demographic and social characteristics for full-time payroll workers. Part-time and self-employed workers are not included. The information may beuseful for college students and even high school students in planning their field of studies. The average wage for an industry was calculated for all the employees in that industry regardless of occupation. A report comparing wages by occupation and by industry is underway. Average Wage for Full-Time Payroll Workers by Industry Figure 16. Average wage for full-time payroll workers by industry: Hawaii vs U.S.
Overall industry average wage of full-time payroll workers was $51,347 for Hawaii, lower than the U.S. average of $54,840 during the 2012-2016 period. In other words, Hawaii’s average wage for full-time payroll workers was 93.6% of the U.S. average. U.S. average wages were higher than Hawaii in most of the industry sectors, except Agriculture, Forestry, Fishing and Hunting, Construction, Transportation and Warehousing, Administration and Support and Waste Management and Remediation Services, Health Care and Social Assistance, and Accommodation and Food Services, and Other Services. Industry sectors with larger differences in average wage between Hawaii and U.S. included Professional, Scientific and Technical Services ($84,967 for U.S. and $70,276 for Hawaii), Finance and Insurance
37,80770,596
56,33855,669
47,20839,211
51,17263,443
60,24649,805
70,276
40,82350,991
61,112
39,529
36,45242,367
60,63051,347
31,367
72,76947,480
58,32059,760
41,73550,915
73,41479,267
56,82684,967
38,61051,432
53,80042,006
28,74040,691
61,36254,840
$0
$10,
000
$20,
000
$30,
000
$40,
000
$50,
000
$60,
000
$70,
000
$80,
000
$90,
000
Agriculture, Forestry, Fishing & HuntingUtilities
ConstructionManufacturing
Wholesale TradeRetail Trade
Transportation & WarehousingInformation
Finance & InsuranceReal Estate & Rental & Leasing
Prof, Scientific & Technical SvcsAdmin & Support & Waste Mgmt Svcs
Educational SvcsHealth Care & Social Assistance
Arts, Entertainment & RecreationAccommodation & Food Svcs
Other SvcsPublic Administration
Total
HawaiiU.S.

29 | P a g e
($79,267 for U.S. and $60,246 for Hawaii), Information ($73,414 for U.S. and $63,443 for Hawaii), Wholesale Trade ($59,760 for U.S. and $47,208 for Hawaii). Hawaii’s average wages were much higher than the U.S. in three industry sectors: Health Care and Social Assistance (Hawaii $61,112 vs U.S. $53,800), Construction (Hawaii $ 56,338 vs U.S. $47,480), Accommodation and Food Services (Hawaii $36,452 vs U.S. $28,740), and Agriculture, Forestry, Fishing and Hunting (Hawaii $37,807 vs U.S. $31,367). Average Wage for Full-Time Payroll Workers by Gender Figure 17. Average wage for full-time payroll workers by industry by gender
Among the full-time payroll workers in Hawaii and for all the industry sectors combined, male employees had an average annual wage of $55,925, about $10,000 higher than female workers at $45,948. An average male worker earned more wage than an average female worker for all industry sectors except Agriculture, Forestry, Fishing and Hunting, and Arts, Entertainment and Recreation where an average female worker earned more than an average male worker. Industry sectors with larger differences in average wage between male and female included Professional, Scientific and Technical Services ($83,109 for male and $54,140 for female), Health Care and Social Assistance (Male $81,023 vs female $53,834), Finance and Insurance (Male $77,064 vs female $52,196), and Manufacturing (male $61,065 vs female $41,844).
37,382
75,130
56,63961,065
51,34944,567
53,420
69,00677,064
54,219
83,109
41,032
55,870
81,023
38,57238,430
43,298
64,955
38,759
57,578
53,72941,844
39,22834,080
45,523
53,374
52,196 45,340
54,140
40,412
48,573
53,834
41,166
34,25641,354
53,157
$0
$10,000
$20,000
$30,000
$40,000
$50,000
$60,000
$70,000
$80,000
$90,000
Agric
ultu
re, F
ores
try,
Fis
hing
&H
untin
g
Util
ities
Cons
truc
tion
Man
ufac
turin
g
Who
lesa
le T
rade
Reta
il Tr
ade
Tran
spor
tatio
n &
War
ehou
sing
Info
rmat
ion
Fina
nce
& In
sura
nce
Real
Est
ate
& R
enta
l & L
easi
ng
Prof
, Sci
entif
ic &
Tec
hnic
al S
vcs
Adm
in &
Sup
port
& W
aste
Mgm
tSv
cs Educ
atio
nal S
vcs
Hea
lth C
are
& S
ocia
l Ass
ista
nce
Arts
, Ent
erta
inm
ent &
Rec
reat
ion
Acco
mm
odat
ion
& F
ood
Svcs
Oth
er S
vcs
Publ
ic A
dmin
istr
atio
n
Male Female

30 | P a g e
Average Wage for Full-Time Payroll Workers by Major Age Group
Table 6. Average wage for full-time payroll workers by major age group ($)
Industry
Millennials (16 to 35
yrs) Generation X (36 to 51 yrs)
Baby Boomers (52 to 70 yrs)
Silent & Greatest Gen
(71 yrs+) Total Total 39,491 56,430 58,361 56,180 51,347 Agriculture, Forestry, Fishing & Hunting 29,839 44,537 40,379 24,683 37,807 Utilities 59,226 74,129 71,832 73,676 70,596 Construction 42,361 61,346 67,078 87,597 56,338 Manufacturing 44,736 62,921 57,191 61,714 55,669 Wholesale Trade 40,130 47,071 57,307 38,706 47,208 Retail Trade 31,373 44,906 45,451 28,458 39,211 Transportation & Warehousing 34,724 56,677 59,730 70,715 51,172 Information 43,040 66,885 80,974 78,255 63,443 Finance & Insurance 37,762 63,793 73,688 91,553 60,246 Real Estate & Rental & Leasing 36,578 53,607 54,583 56,625 49,805 Prof, Scientific & Technical Svcs 56,940 74,517 78,779 82,469 70,276 Admin & Support & Waste Mgmt Svcs 31,544 42,618 49,843 33,107 40,823 Educational Svcs 40,292 51,712 58,262 58,146 50,991 Health Care & Social Assistance 47,586 69,059 66,540 71,327 61,112 Arts, Entertainment & Recreation 31,388 42,564 44,272 49,455 39,529 Accommodation & Food Svcs 30,145 40,265 41,555 33,668 36,452 Other Svcs 37,584 44,435 45,297 25,820 42,367 Public Administration 49,495 65,178 66,680 60,312 60,630
As shown in Table 6, average wage increased with age, especially up to the Baby Boomer’s age, for most of the industry sectors. This indicates that experience did play an important role in wage schedule. Among the Millennials, those worked in Utilities had the highest average wage at $59,226 per year, followed by Professional, Scientific and Technical Services at $56,940, Public Administration at $49,495, and Health Care and Social Assistance at $47,586. Those Millennials who worked in Agriculture, Forestry, Fishing and Hunting had the lowest annual wage at $29,839 per year. For Generation X workers, Professional, Scientific and Technical Services had the highest annual wage at $74,517, followed by Utilities at $74,129, Health Care and Social Assistance at $69,059, and Information at $66,885. Those Baby Boomers worked in Information had the highest annual wage at $80,974, followed by Professional, Scientific and Technical Services at $78,779, Finance and Insurance at $73,688, and Utilities at $71,832. Sample sizes for the Silent and Greatest Generation were small, the average wage numbers may not be representative of the true wage in the industry sectors.

31 | P a g e
Average Wage for Full-Time Payroll Workers by Major Race Group Table 7. Average wage for full-time payroll workers by major race group ($)
Industry White alone Asian alone
Native Hawaiian
alone Other incl.
Mixed Total Total 62,994 49,393 41,964 46,667 51,347 Agriculture, Forestry, Fishing & Hunting 62,696 33,451 27,683 32,603 37,807 Utilities 78,191 70,425 49,313 75,090 70,596 Construction 68,369 58,241 42,119 51,134 56,338 Manufacturing 70,673 50,114 58,114 52,702 55,669 Wholesale Trade 73,334 42,136 39,138 40,763 47,208 Retail Trade 44,400 38,942 29,880 37,887 39,211 Transportation & Warehousing 59,659 50,341 45,337 48,777 51,172 Information 78,243 64,176 56,058 52,409 63,443 Finance & Insurance 73,241 61,692 49,516 51,061 60,246 Real Estate & Rental & Leasing 55,095 50,107 37,861 44,445 49,805 Prof, Scientific & Technical Svcs 83,042 61,810 42,548 69,938 70,276 Admin & Support & Waste Mgmt Svcs 55,935 39,402 33,219 35,456 40,823 Educational Svcs 58,212 50,842 43,072 44,826 50,991 Health Care & Social Assistance 82,914 58,790 41,640 49,196 61,112 Arts, Entertainment & Recreation 44,414 39,543 31,935 36,150 39,529 Accommodation & Food Svcs 42,791 34,729 34,055 36,294 36,452 Other Svcs 50,465 41,842 42,564 35,951 42,367 Public Administration 65,260 60,421 52,837 57,930 60,630
As shown in Table 7, White had the highest average wage than other major race groups during the 2012-2016 period. The average wage for White was the highest in every industry sectors. Among the workers with White alone race, Professional, Scientific and Technical Services sector had the highest average annual wage at $83,042, followed by Health Care and Social Assistance at $82,914, Information at $78,243.
Among workers with Asian alone race, those worked in Utilities sector had the highest average wage at $70,425, followed by Information at $64,176, and Professional, Scientific and Technical Services at $61,810.
Among the workers with Native Hawaiian alone race, those worked in Manufacturing sector had the highest average annual wage at $58,114, followed by Information at $56,058, Public Administration at $52,837.

32 | P a g e
Average Wage for Full-Time Payroll Workers by Educational Attainment Table 8. Average wage for full-time payroll workers by educational attainment ($)
Industry
High school diploma or
below
Associate degree &
some college
Bachelor degree or
above Total Total 37,977 46,780 67,680 51,347 Agriculture, Forestry, Fishing & Hunting 29,320 36,580 68,268 37,807 Utilities 63,895 69,444 76,826 70,596 Construction 49,682 56,098 79,195 56,338 Manufacturing 40,917 53,387 81,539 55,669 Wholesale Trade 37,680 45,358 67,504 47,208 Retail Trade 34,050 39,008 50,787 39,211 Transportation & Warehousing 42,593 52,430 64,182 51,172 Information 46,920 69,272 70,823 63,443 Finance & Insurance 38,435 48,565 77,186 60,246 Real Estate & Rental & Leasing 42,004 44,614 67,152 49,805 Prof, Scientific & Technical Svcs 49,015 52,780 80,552 70,276 Admin & Support & Waste Mgmt Svcs 32,717 39,210 62,275 40,823 Educational Svcs 34,015 35,971 56,300 50,991 Health Care & Social Assistance 32,819 44,666 84,127 61,112 Arts, Entertainment & Recreation 32,158 42,996 44,893 39,529 Accommodation & Food Svcs 31,533 38,199 47,561 36,452 Other Svcs 33,468 41,110 53,742 42,367 Public Administration 46,911 55,640 69,904 60,630
Table 8 presents the average wage of full-time payroll workers by educational attainment. It was clear that average wage went up with education level for every industry sector. The average annual wage for those with associate degree and some college education was 23.2% higher than those with high school diploma or below. Workers with at least bachelor degree had an average annual wage of $67,680, 44.7% higher than those with associate degree, and 78.2% higher than those with high school diploma. By industry sector, workers with at least bachelor degree had average wage much higher than those with associate degree including Health Care and Social Assistance at 88.3% higher, Agriculture, Forestry, Fishing and Hunting at 86.6% higher, Finance and Insurance at 58.9% higher, Administration and Support and Waste Management and Remediation Services at 58.8% higher.

33 | P a g e
Average Wage for Full-Time Payroll Workers by Nativity Figure 18. Average wage for full-time payroll workers by nativity
As shown in Figure 18, the native born workers had higher average wage for most of the industry sectors except Utilities, Construction, and Educational Services where the foreign born workers had higher average wages.
40,547
69,560
55,37159,985
49,49940,527
53,389
66,23862,050
52,227
71,639
43,104 50,716
64,010
39,85739,193
44,908
61,053
35,098
78,584
61,707
42,81639,23235,226
40,36444,81952,487
41,444
63,112
35,973
53,066 51,381
38,57532,404
34,685
56,828
$0$10,000$20,000$30,000$40,000$50,000$60,000$70,000$80,000$90,000
Agric
ultu
re, F
ores
try,
Fis
hing
&H
untin
g
Util
ities
Cons
truc
tion
Man
ufac
turin
g
Who
lesa
le T
rade
Reta
il Tr
ade
Tran
spor
tatio
n &
War
ehou
sing
Info
rmat
ion
Fina
nce
& In
sura
nce
Real
Est
ate
& R
enta
l & L
easi
ng
Prof
, Sci
entif
ic &
Tec
hnic
al S
vcs
Adm
in &
Sup
port
& W
aste
Mgm
t Svc
s
Educ
atio
nal S
vcs
Hea
lth C
are
& S
ocia
l Ass
ista
nce
Arts
, Ent
erta
inm
ent &
Recr
eatio
n
Acco
mm
odat
ion
& F
ood
Svcs
Oth
er S
vcs
Publ
ic A
dmin
istr
atio
n
Native Foreign born
Recommended