Embed Size (px)
Citation preview
MidMid--cycle hiccups? Hawaiicycle hiccups? Hawaii’’s economic s economic expansion risks losing momentumexpansion risks losing momentum
Copyright 2013Copyright 2013Paul H. Brewbaker, Ph.D.Paul H. Brewbaker, Ph.D.
slides prepared for a joint informational briefing of theslides prepared for a joint informational briefing of the
Senate Committee on Ways and Means Senate Committee on Ways and Means House Committee on Finance House Committee on Finance
Hawaii State Capitol AuditoriumHawaii State Capitol Auditoriumbyby Paul H. Brewbaker, Ph.D.Paul H. Brewbaker, Ph.D.
TZ Economics, Kailua, HawaiiTZ Economics, Kailua, Hawaii
December 18, 2013December 18, 2013
11
Slide copyright 2013
Outline and prefaceOutline and preface
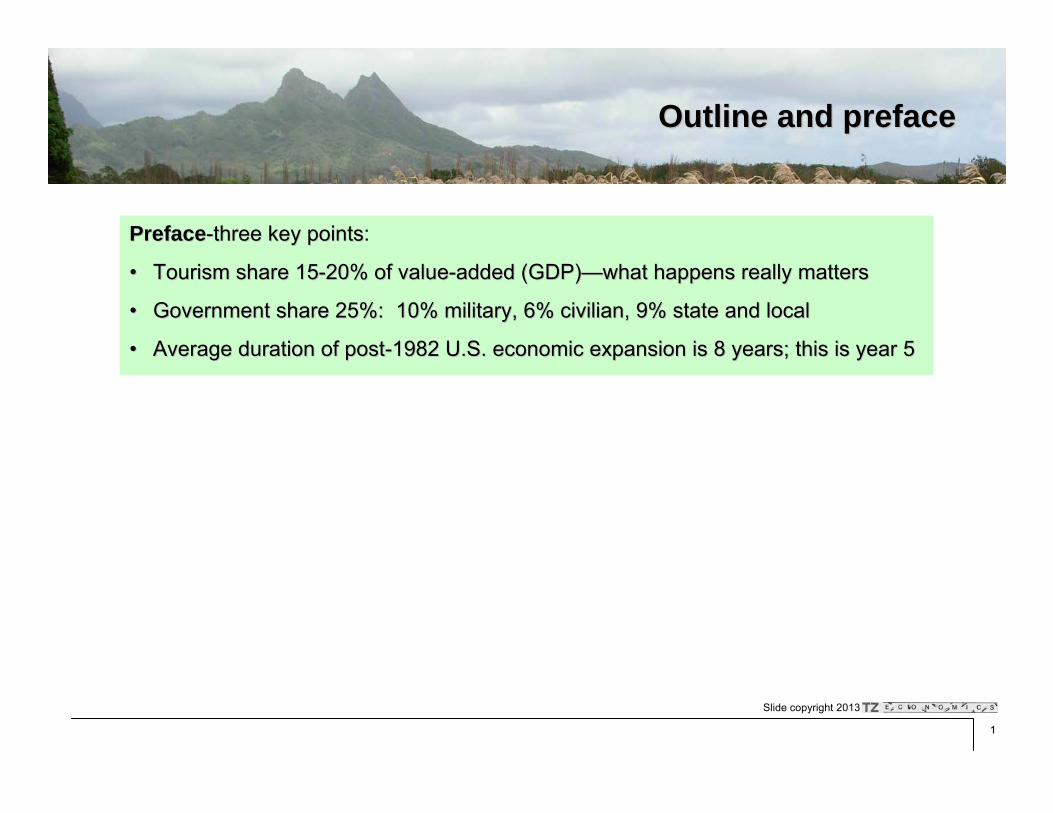
PrefacePreface--three key pointsthree key points:
•• Tourism share 15Tourism share 15--20% of value20% of value--added (GDP)added (GDP)——what happens really matterswhat happens really matters
•• Government share 25%: 10% military, 6% civilian, 9% state and lGovernment share 25%: 10% military, 6% civilian, 9% state and localocal
•• Average duration of postAverage duration of post--1982 U.S. economic expansion is 8 years; this is year 51982 U.S. economic expansion is 8 years; this is year 5

22
Slide copyright 2013
State and local8.9%
Federal military9.6%
Federal civilian5.8%
Private industry75.6%
Non-tourism85.2%
Tourism14.8%
Hawaii economic valueHawaii economic value--added (GDP) sharesadded (GDP) sharesin tourism and military: in tourism and military: combinedcombined approx. 25%approx. 25%
2010 Tourism vs. Non-tourism
Source for underlying data: Bureau of Economic Analysis, U.S. Department of Commerce, Hawaii DBEDT, Hawaii Tourism Authority; all calculations by TZE
See also:James Mak, 2005. “Tourism demand and output in the U.S. Tourism Satellite Accounts: 1998-2003,” Journal of Travel Research, 44 (1), pp. 4-5Eugene Tian, James Mak, and PingSun Leung, “The direct and indirect contributions of tourism to regional GDP: Hawaii,“ UHERO Working Paper
No. 2011-5 (July 28, 2011) (http://www.uhero.hawaii.edu/assets/WP_2011-5.pdf) DBEDT State of Hawaii Data Book (http://hawaii.gov/dbedt/info/economic/databook/2010-individual/07/073410.xls) James Hosek, Aviva Litovitz, Adam C. Resnick, 2011 “How Much Does Military Spending Add to Hawaii’s Economy?” Rand Corporation Technical
Report TR-996 (http://www.rand.org/pubs/technical_reports/TR996.html); note that this report incorrectly doubles the military share of Hawaii GDP to inflate its “association” with other industries using input-output multipliers, which is like doubling everything.
2010 Military vs.
Non-military
33
Slide copyright 2013
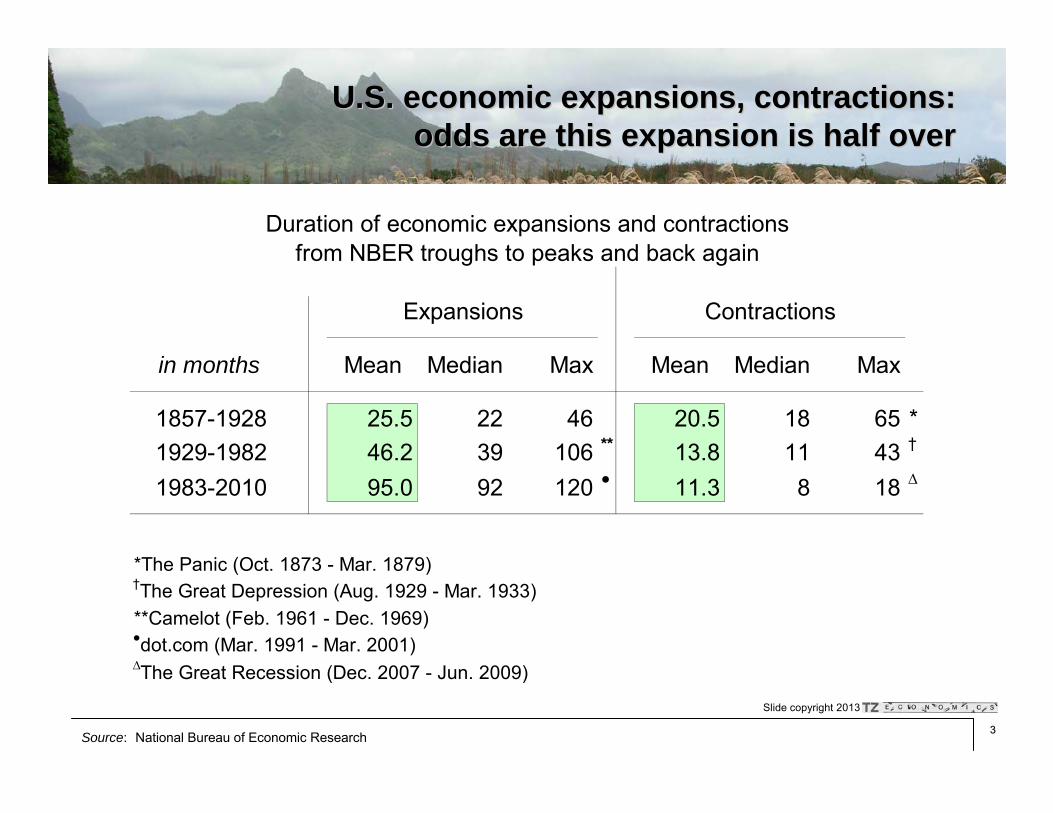
in months Mean Median Max Mean Median Max
1857-1928 25.5 22 46 20.5 18 65 *1929-1982 46.2 39 106 ** 13.8 11 43 †
1983-2010 95.0 92 120 ● 11.3 8 18 ∆
*The Panic (Oct. 1873 - Mar. 1879)†The Great Depression (Aug. 1929 - Mar. 1933)**Camelot (Feb. 1961 - Dec. 1969)●dot.com (Mar. 1991 - Mar. 2001)∆The Great Recession (Dec. 2007 - Jun. 2009)
Expansions Contractions
Duration of economic expansions and contractionsfrom NBER troughs to peaks and back again
U.S. economic expansions, contractions: U.S. economic expansions, contractions: odds are this expansion is half overodds are this expansion is half over
Source: National Bureau of Economic Research
44
Slide copyright 2013
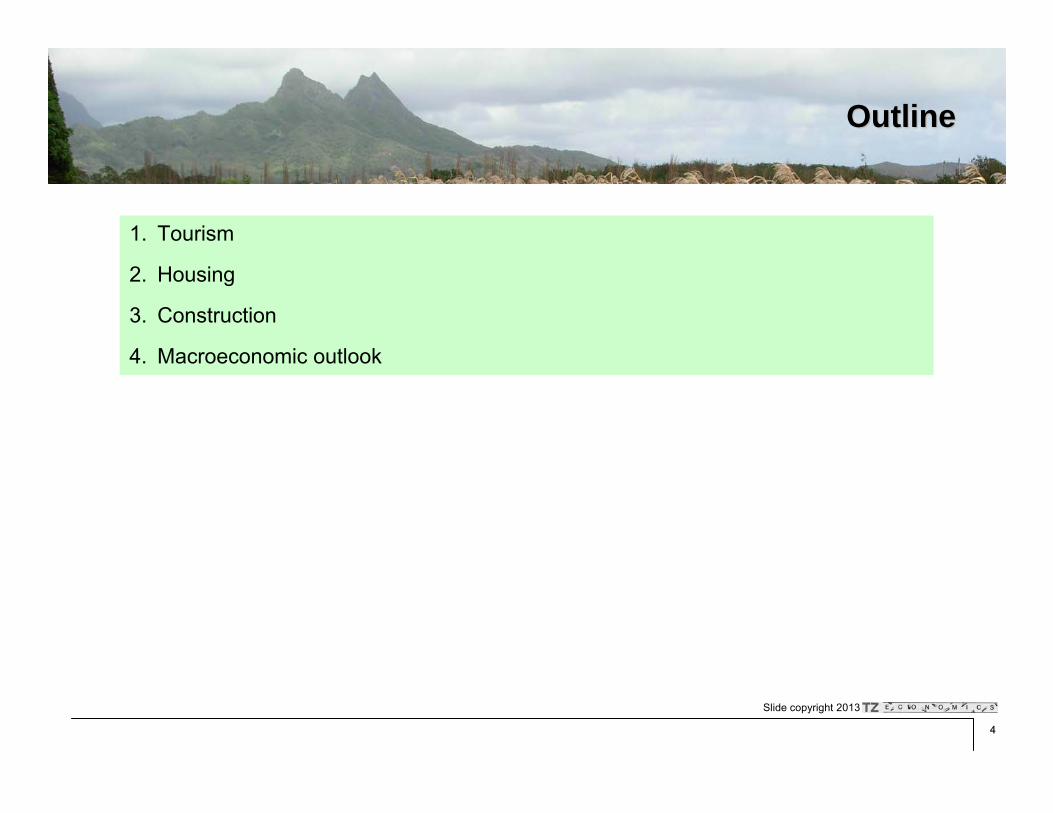
1. Tourism
2. Housing
3. Construction
4. Macroeconomic outlook
OutlineOutline
55
Slide copyright 2013
Hawaii tourism was Hawaii tourism was decliningdeclining during 2013during 2013
[This slide intentionally left blank]
66
Slide copyright 2013
450
500
550
600
650
700
750
04 05 06 07 08 09 10 11 12 13 14
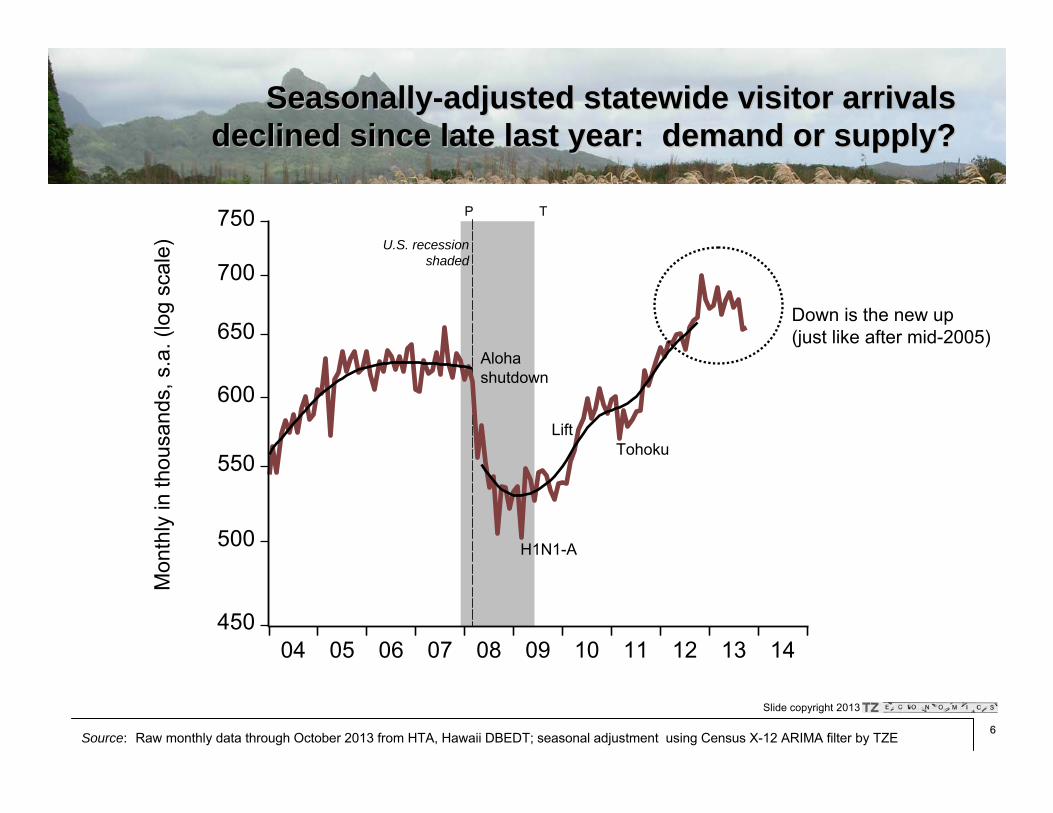
SeasonallySeasonally--adjusted statewide visitor arrivals adjusted statewide visitor arrivals declined since late last year: demand or supply?declined since late last year: demand or supply?M
onth
ly in
thou
sand
s, s
.a. (
log
scal
e)
Source: Raw monthly data through October 2013 from HTA, Hawaii DBEDT; seasonal adjustment using Census X-12 ARIMA filter by TZE
U.S. recessionshaded
Aloha shutdown
Tohoku
P T
Lift
Down is the new up(just like after mid-2005)
H1N1-A

77
Slide copyright 2013
4.5
5.0
5.5
6.0
6.5
04 05 06 07 08 09 10 11 12 13 14
Statewide total visitor days (Statewide total visitor days (s.as.a.): growth stalled.): growth stalledM
onth
ly in
milli
ons,
.s.a
. (lo
g sc
ale)
Source: Raw monthly data through October 2013 from HTA, Hawaii DBEDT; seasonal adjustment using Census X-12 ARIMA filter by TZE
U.S. recessionshaded
Aloha shutdown
Tohoku
P T
Lift
H1N1-A

88
Slide copyright 2013
650
700
750
800
850
900
950
04 05 06 07 08 09 10 11 12 13 14
Total seats to Hawaii through October 2013 (Total seats to Hawaii through October 2013 (s.as.a.): .): after two pushes (2010, 2012) capacity flattenedafter two pushes (2010, 2012) capacity flattened
No Aloha
U.S. recession shaded
Tohoku
Mon
thly
in th
ousa
nds,
s.a
. (lo
g sc
ale)
Source: Data through October 2013 from HTA, Hawaii DBEDT; seasonal adjustment by TZE
P T
99
Slide copyright 2013
2.0
2.5
3.0
3.5
4.0
4.5
2002 2004 2006 2008 2010 2012
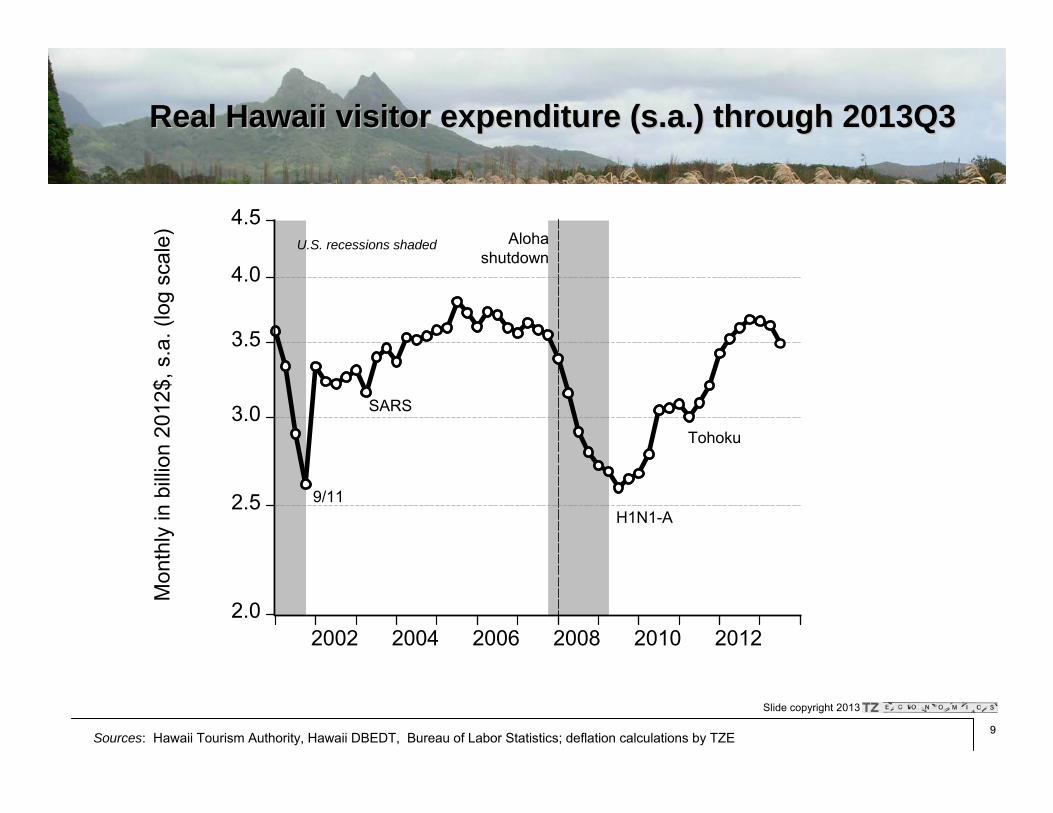
Real Hawaii visitor expenditure (Real Hawaii visitor expenditure (s.as.a.) through 2013Q3.) through 2013Q3
Sources: Hawaii Tourism Authority, Hawaii DBEDT, Bureau of Labor Statistics; deflation calculations by TZE
Mon
thly
in b
illion
201
2$, s
.a. (
log
scal
e) U.S. recessions shaded Aloha shutdown
9/11
SARS
Tohoku
H1N1-A
1010
Slide copyright 2013
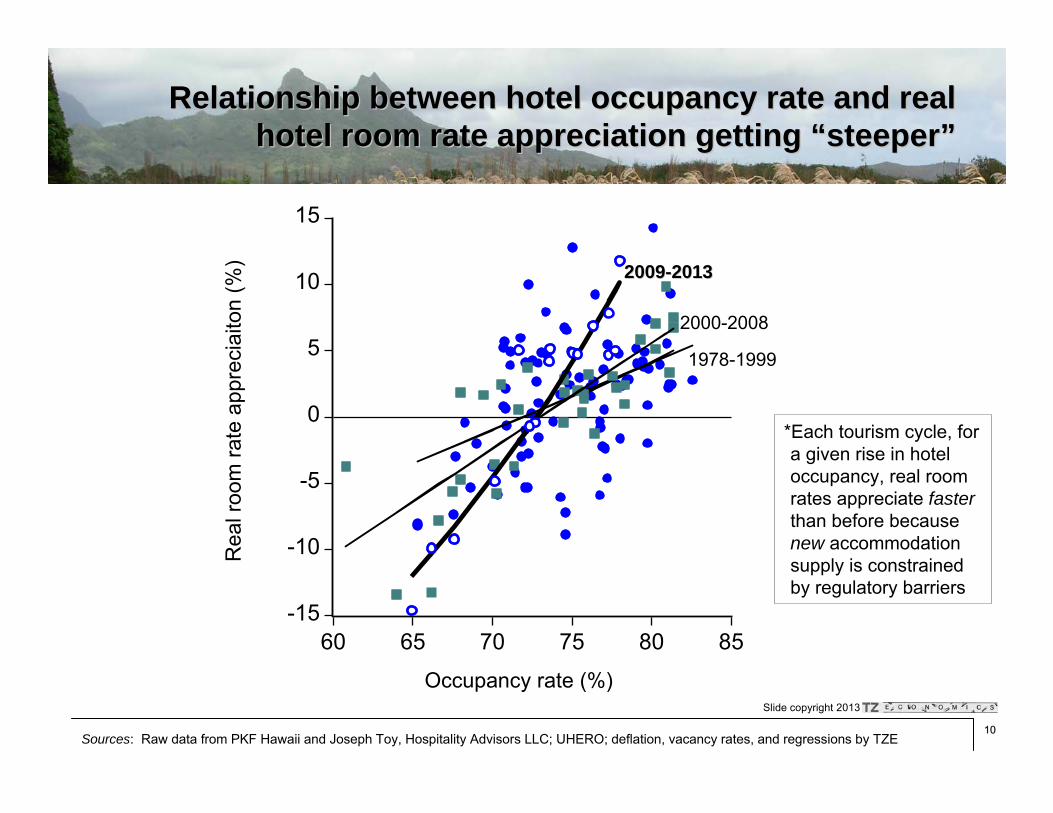
Relationship between hotel occupancy rate and real Relationship between hotel occupancy rate and real hotel room rate appreciation getting hotel room rate appreciation getting ““steepersteeper””
-15
-10
-5
0
5
10
15
60 65 70 75 80 85
1978-1999
2000-2008
20092009--20132013
Sources: Raw data from PKF Hawaii and Joseph Toy, Hospitality Advisors LLC; UHERO; deflation, vacancy rates, and regressions by TZE
*Each tourism cycle, for a given rise in hotel occupancy, real room rates appreciate fasterthan before because new accommodation supply is constrained by regulatory barriers
Occupancy rate (%)
Rea
l roo
m ra
te a
ppre
ciai
ton
(%)

1111
Slide copyright 2013
0.5
1.0
1.5
2.0
2.5
3.0
1950 1960 1970 1980 1990 2000 2010
Visitor days growing faster than capacity (more Visitor days growing faster than capacity (more highlyhighly--utilized): past 2.5 visitors/room utilized): past 2.5 visitors/room ““sold outsold out””
Visi
tors
/ un
it
E
E estimated based on January-October 2013 data
Sources: Hawaii Visitors Bureau, Hawaii Tourism, Authority Hawaii DBEDT; visitors/unit is calculated by dividing total visitor days by the previous year’s visitor plant inventory, and dividing the resulting ratio by 365.25 (days/year), data are annual except for 2013 estimate (10-mos. data).
1212
Slide copyright 2013
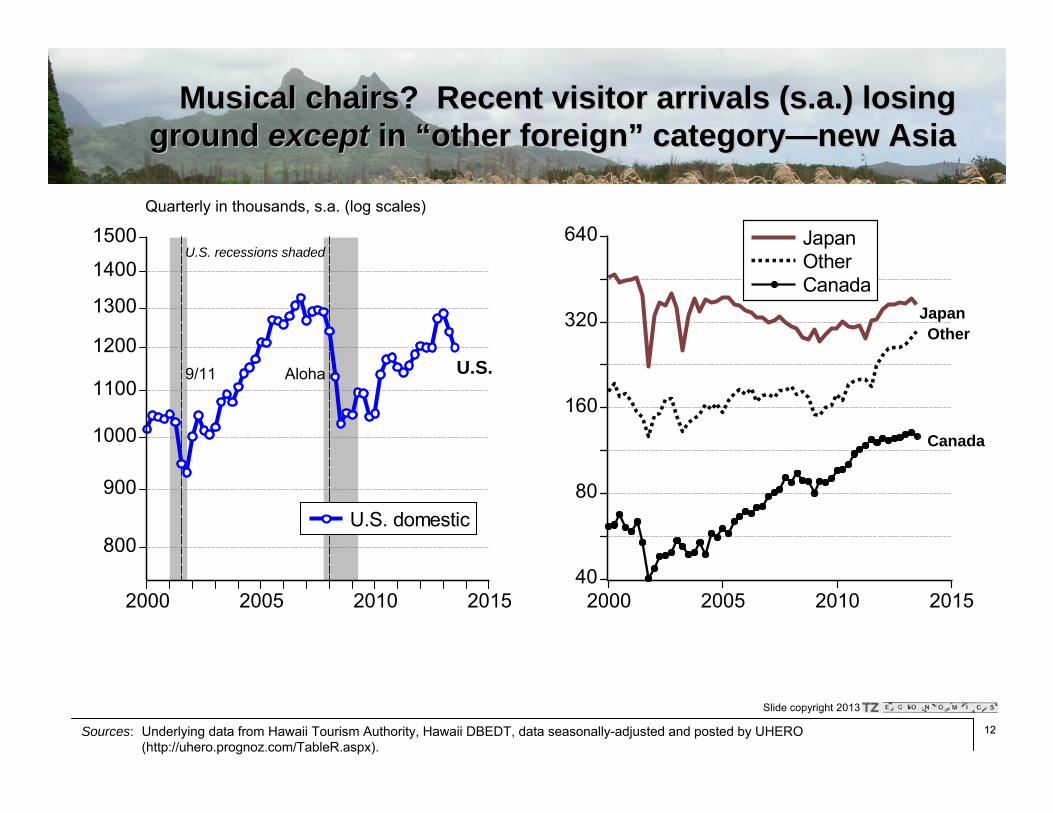
Musical chairs? Recent visitor arrivals (Musical chairs? Recent visitor arrivals (s.as.a.) losing .) losing ground ground exceptexcept in in ““other foreignother foreign”” categorycategory——new Asianew Asia
40
80
160
320
640
2000 2005 2010 2015
JapanOtherCanada
800
900
1000
1100
1200
1300
1400
1500
2000 2005 2010 2015
U.S. domestic
Quarterly in thousands, s.a. (log scales)
Sources: Underlying data from Hawaii Tourism Authority, Hawaii DBEDT, data seasonally-adjusted and posted by UHERO (http://uhero.prognoz.com/TableR.aspx).
U.S.
JapanOther
Canada
U.S. recessions shaded
9/11 Aloha

1313
Slide copyright 2013
1.1. TourismTourismTourism leadership in Tourism leadership in ““first halffirst half”” now impaired by capacity constraintnow impaired by capacity constraintNo more rooms No more rooms ⇒⇒ higher room rates at faster rates of increasehigher room rates at faster rates of increaseHigher lodging expense reduces: (a) stay length; (b) nonHigher lodging expense reduces: (a) stay length; (b) non--lodging lodging outlay/visitor; and (c) total real (inflationoutlay/visitor; and (c) total real (inflation--adjusted) tourism export receiptsadjusted) tourism export receiptsLoss of momentum in U.S., Japan, Canada arrivals: probably not Loss of momentum in U.S., Japan, Canada arrivals: probably not ““demanddemand””
2. Housing
3. Construction
4. Macroeconomic outlook
OutlineOutline

1414
Slide copyright 2013
Housing trends: cyclical recovery hindered by Housing trends: cyclical recovery hindered by slowslow--moving regulatory processmoving regulatory process
[This slide intentionally left blank]

1515
Slide copyright 2013
The (Mike) Sklarz Curve: Oahu home price The (Mike) Sklarz Curve: Oahu home price appreciation, lagged inventory remaining 1994appreciation, lagged inventory remaining 1994--20132013
-20
-10
0
10
20
30
0 4 8 12 16 20 24
Single-familyCondominium
Months of MLS inventory remaining (-5)
Hom
e pr
ice
appr
ecia
tion
(%)
Source: Honolulu Board of Realtors; seasonal adjustment, regressions on logs of months of inventory remaining by TZE; see Norm Miller and Mike Sklarz, “A Note on Leading Indicators of House Price Trends,” Journal of Real Estate Research 1:1 (Fall 1986) pp. 99-109
( )[ ]5ln618.13474.28ˆ: −−= tt mpSF
( )[ ]5ln529.13830.28ˆ: −−= tt mpCO
@3 months of inventory remaining, prediction is 10-15% appreciation before next summer

1616
Slide copyright 2013
100
200
400
800
1995 2000 2005 2010 2015
Single-familyCondominium
+2 years:$450k
+2 years: $850k
Source: Honolulu Board of Realtors (raw data through September 2013); seasonal adjustment using Census X-12 ARIMA filter by TZE
Thou
sand
dol
lars
, s.a
. (lo
g sc
ale)
Recessions shaded
Monthly Oahu median existing home sales pricesMonthly Oahu median existing home sales prices

1717
Slide copyright 2013
200
400
800
1995 2000 2005 2010 2015
SF Bay AreaOrange Co., CAMauiKauaiKona side
California, Neighbor Island existing singleCalifornia, Neighbor Island existing single--family family home median sales prices: strong cohome median sales prices: strong co--movementmovement
Sources: Hawaii Information Service, Realtors Association of Maui, National Association of Realtors; seasonal adjustment by TZE
U.S. recessions shaded
Qua
rterly
in th
ousa
nd $
, s.a
. (lo
g sc
ale)
CrossCross--correlation correlation 90% and up90% and up
1818
Slide copyright 2013
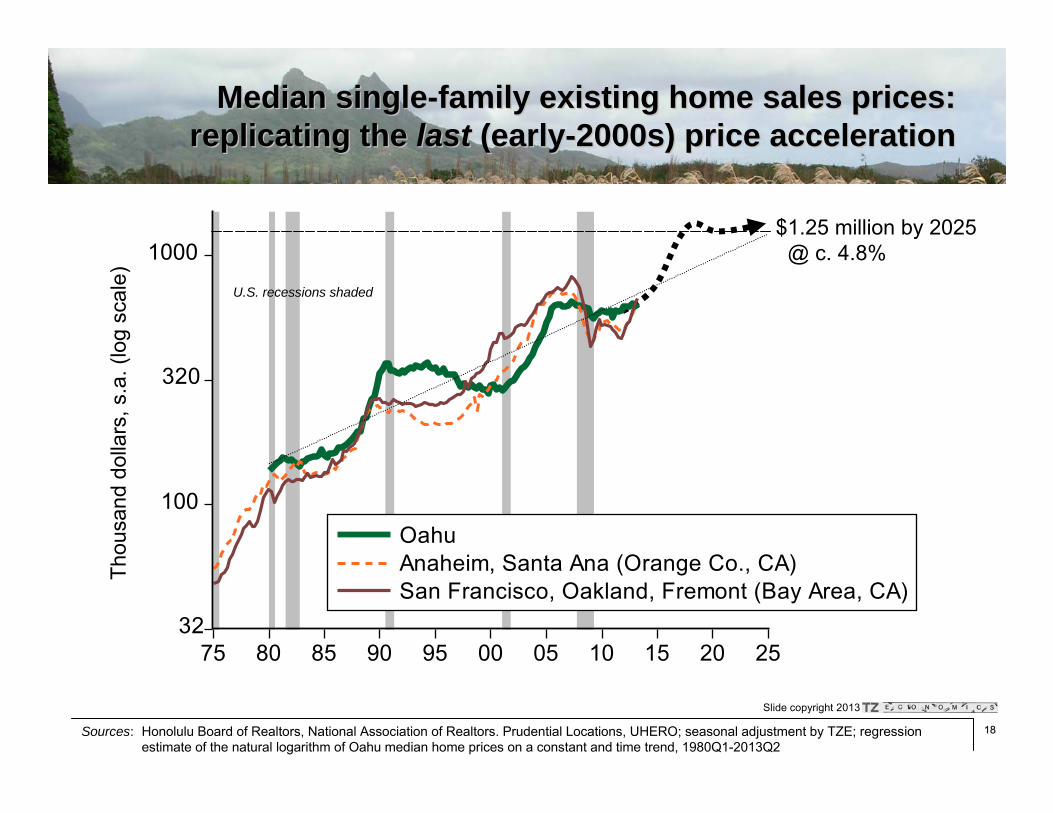
100
1000
75 80 85 90 95 00 05 10 15 20 25
OahuAnaheim, Santa Ana (Orange Co., CA)San Francisco, Oakland, Fremont (Bay Area, CA)
320
32
U.S. recessions shaded
Sources: Honolulu Board of Realtors, National Association of Realtors. Prudential Locations, UHERO; seasonal adjustment by TZE; regression estimate of the natural logarithm of Oahu median home prices on a constant and time trend, 1980Q1-2013Q2
$1.25 million by 2025@ c. 4.8%
Thou
sand
dol
lars
, s.a
. (lo
g sc
ale)
Median singleMedian single--family existing home sales prices: family existing home sales prices: replicating the replicating the lastlast (early(early--2000s) price acceleration2000s) price acceleration

1919
Slide copyright 2013
0.4
0.8
1.6
3.2
6.4
80 85 90 95 00 05 10 15 20
Existing home salesNew units authorized
Hawaii existing home sales outpace new residential Hawaii existing home sales outpace new residential units permitted (especially slow Neighbor Isle recovery)units permitted (especially slow Neighbor Isle recovery)
U.S. recessions shadedThou
sand
uni
ts/q
uarte
r, s.
a. (l
og s
cale
)
Source: Prudential Locations, UHERO, County Building Departments, Hawaii DBEDT and TZ Economics; seasonal adjustment, trend extraction by TZE, housing unit authorization data through third quarter 2013, existing home sales through second quarter 2013

2020
Slide copyright 2013
0
2
4
6
8
10
12
14
20 30 40 50 60 70 80 90 00 10 20
OahuNeighbor Isles
Thou
sand
new
uni
ts/a
nnum
WWIIWWII
Sources: Robert C. Schmitt Historical Statistics of Hawaii, Hawaii DBEDT (http://dbedt.hawaii.gov/economic/county_report/), Bank of Hawaii Annual Economic Report (various); annual TZE data through 2012
Annual new housing units authorized by building permitAnnual new housing units authorized by building permit

2121
Slide copyright 2013
-4.0
-2.0
0.0
2.0
4.0
6.0
8.0
10.0
1930s 1950s 1970s 1990s 2010-12-4.0
-2.0
0.0
2.0
4.0
6.0
8.0
10.0
1930s 1950s 1970s 1990s 2010-12
Sources: Robert C. Schmitt Historical Statistics of Hawaii, Hawaii DBEDT (http://dbedt.hawaii.gov/economic/county_report/), Bank ofHawaii Annual Economic Report (various), annual TZE data through 2012
o
oMilitary downsizing (BRAC) PProjection to 2020 with Koa Ridge, Ho’opili, Kakaako; assumes housing cycle tapers after 2017 (next slide)
Hawaii now: population growth > housing formationHawaii now: population growth > housing formation
Oahu Neighbor Islands
P
2000s “boom”
2000s “boom”
Housing growth Housing growth rate (%) (rate (%) (ΔΔKKtt/K/Ktt--11))
Housing growth Housing growth rate (%) (rate (%) (ΔΔKKtt/K/Ktt--11))
Population Population growth rate (%)growth rate (%)
Population Population growth rate (%)growth rate (%)

2222
Slide copyright 2013
1.0
2.0
4.0
8.0
80 85 90 95 00 05 10 15 20
Actual/projectedTrend/cycle
Projection assumes that existing home sales prices rise 15% annually 2014-2017 to approximately $1 million (SF), $530k (condo), long-term Treasury bond yields rise to 4% by 2015, production of 5,500 high-rise condominium units in Kakaako is completed but absorption reduces notional annual production amounts at Koa Ridge (300 units) and Ho’opili (500 units) by one-third in 2017 and two-thirds in 2018 at the end of a U.S. economic expansion of average duration for the post-1970s era (eight years)
Thou
sand
new
uni
ts, s
.a.
(lo
g sc
ale)
ProjectedProjected
Oahu annual new housing units authorized by Oahu annual new housing units authorized by building permit actual and projected for 20building permit actual and projected for 20--teensteens
You are You are herehere
Sources: County building departments, Hawaii DBEDT, TZE database; trend extraction by TZE
2323
Slide copyright 2013
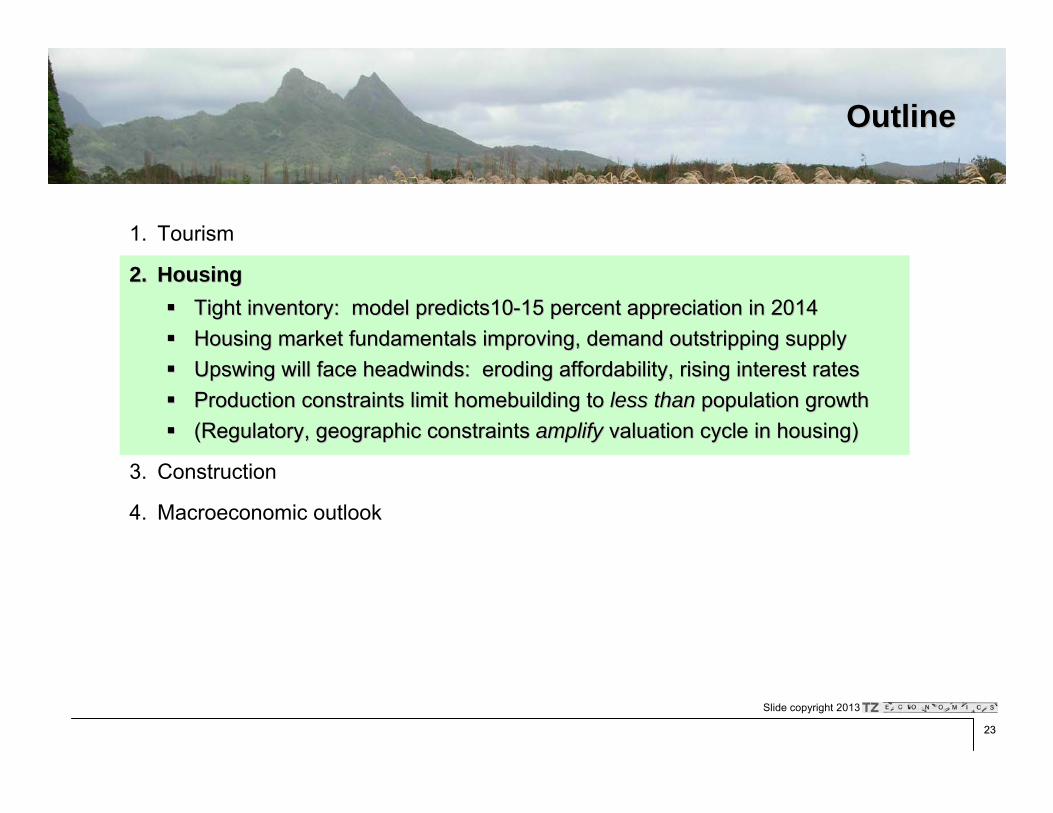
1. Tourism
2.2. HousingHousingTight inventory: model predicts10Tight inventory: model predicts10--15 percent appreciation in 201415 percent appreciation in 2014Housing market fundamentals improving, demand outstripping supplHousing market fundamentals improving, demand outstripping supplyyUpswing will face headwinds: eroding affordability, rising inteUpswing will face headwinds: eroding affordability, rising interest ratesrest ratesProduction constraints limit homebuilding to Production constraints limit homebuilding to less thanless than population growthpopulation growth(Regulatory, geographic constraints (Regulatory, geographic constraints amplifyamplify valuation cycle in housing)valuation cycle in housing)
3. Construction
4. Macroeconomic outlook
OutlineOutline

2424
Slide copyright 2013
Construction: head fakeConstruction: head fake——PV panels PV panels are not are not buildingsbuildings
[This slide intentionally left blank]
2525
Slide copyright 2013
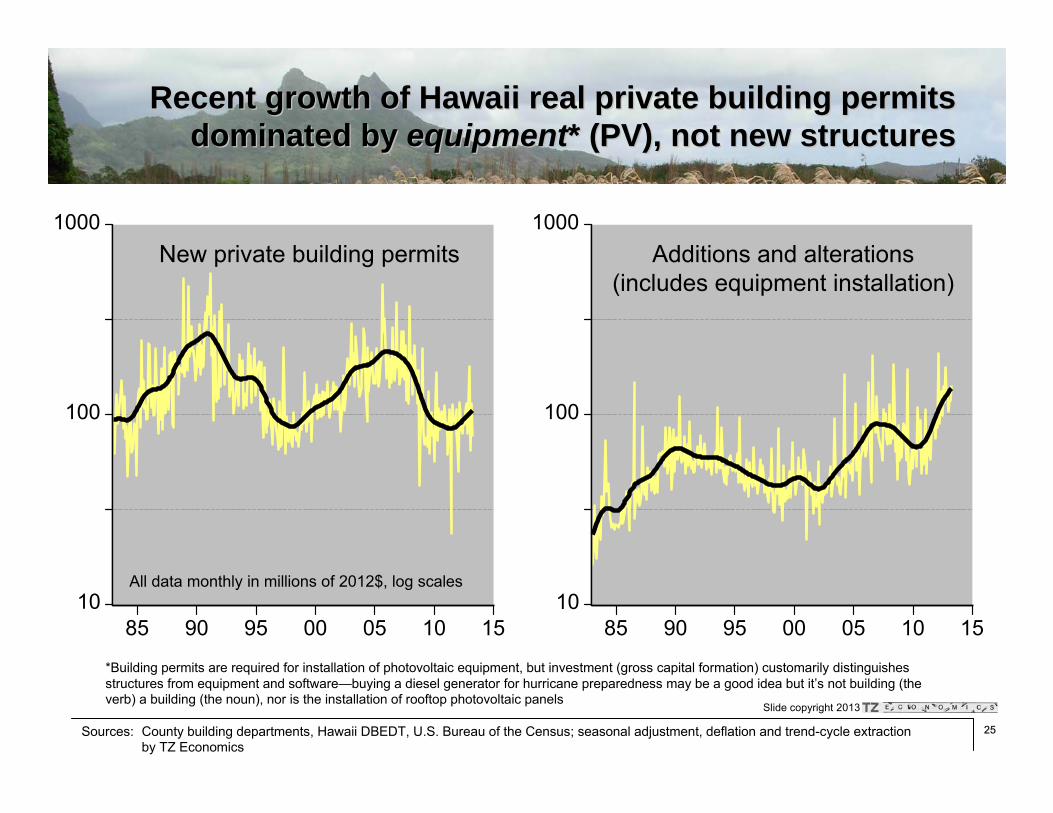
Recent growth of Hawaii real private building permits Recent growth of Hawaii real private building permits dominated by dominated by equipmentequipment* (PV), not new structures* (PV), not new structures
10
100
1000
85 90 95 00 05 10 1510
100
1000
85 90 95 00 05 10 15
Additions and alterations Additions and alterations (includes equipment installation)(includes equipment installation)
New private building permitsNew private building permits
All data monthly in millions of 2012$, log scalesAll data monthly in millions of 2012$, log scales
*Building permits are required for installation of photovoltaic equipment, but investment (gross capital formation) customarily distinguishes structures from equipment and software—buying a diesel generator for hurricane preparedness may be a good idea but it’s not building (the verb) a building (the noun), nor is the installation of rooftop photovoltaic panels
Sources: County building departments, Hawaii DBEDT, U.S. Bureau of the Census; seasonal adjustment, deflation and trend-cycle extraction by TZ Economics

2626
Slide copyright 2013
10
20
40
200
400
800
1980 1985 1990 1995 2000 2005 2010 2015
Contracting receipts* (right scale)Construction jobs (NAICS) (left scale)Construction jobs (SIC) (left scale)
Construction receipts and jobs correlate, but buying Construction receipts and jobs correlate, but buying PV or a diesel generator is PV or a diesel generator is equipmentequipment investmentinvestment
Thou
sand
jobs
, s.a
. (lo
g sc
ale)
1062012$, s.a. (log scale)
U.S. recessions shaded
*Excludes military housing privatization which was tax-exempt
Sources: Hawaii Department of Taxation, Hawaii DLIR and DBEDT, U.S. Bureau of the Census; seasonal adjustment, deflation and trend extraction by TZE, tax base data through May 2013, payroll employment data through August 2013

2727
Slide copyright 2013
20
24
28
32
36
40
200
400
600
800
90 95 00 05 10 15
Contracting* (right scale)Jobs (left scale)
Construction jobs not keeping up with spendingConstruction jobs not keeping up with spendingTh
ousa
nd jo
bs, s
.a. (
log
scal
e)10
62012$, s.a. (log scale)
U.S. recessions shaded
*Excludes military housing privatization which was tax-free
c. $640 million/month
Sources: Hawaii Department of Taxation, Hawaii DLIR and DBEDT, U.S. Bureau of the Census; seasonal adjustment, deflation and trend extraction by TZE, tax base data through May 2013, payroll employment data through August 2013

2828
Slide copyright 2013
Real new residential building permits: laggingReal new residential building permits: laggingM
illion
201
2 do
llars
, s.a
. (lo
g sc
ale)
20
40
80
160
320
1980 1985 1990 1995 2000 2005 2010 2015
Sources: County building departments, Hawaii DBEDT, U.S. Bureau of the Census; seasonal adjustment, deflation and trend extraction by TZEmonthly data through August 2013
Not even near halfway back

2929
Slide copyright 2013
Real new commercial building permits: lagging worseReal new commercial building permits: lagging worseM
illion
201
2 do
llars
, s.a
. (lo
g sc
ale)
10
100
1980 1985 1990 1995 2000 2005 2010 2015
Sources: County building departments, Hawaii DBEDT, U.S. Bureau of the Census; seasonal adjustment, deflation and trend extraction by TZEmonthly data through August 2013

3030
Slide copyright 2013
Quarterly real government construction contracts to Quarterly real government construction contracts to midmid--2013: signs of life or deferred maintenance?2013: signs of life or deferred maintenance?
100
200
400
65 70 75 80 85 90 95 00 05 10 15
Sources: Bank of Hawaii (discontinued), Hawaii DBEDT, U.S. Bureau of the Census; seasonal adjustment, deflation and trend extraction by TZEquarterly data through second quarter 2013, combined federal, state and county government construction commitments
Qua
rterly
, 106
2012
$, s
.a. (
log
scal
e)
“Catch a Wave”
“Uncle John”
“Choo-choo?”
3131
Slide copyright 2013
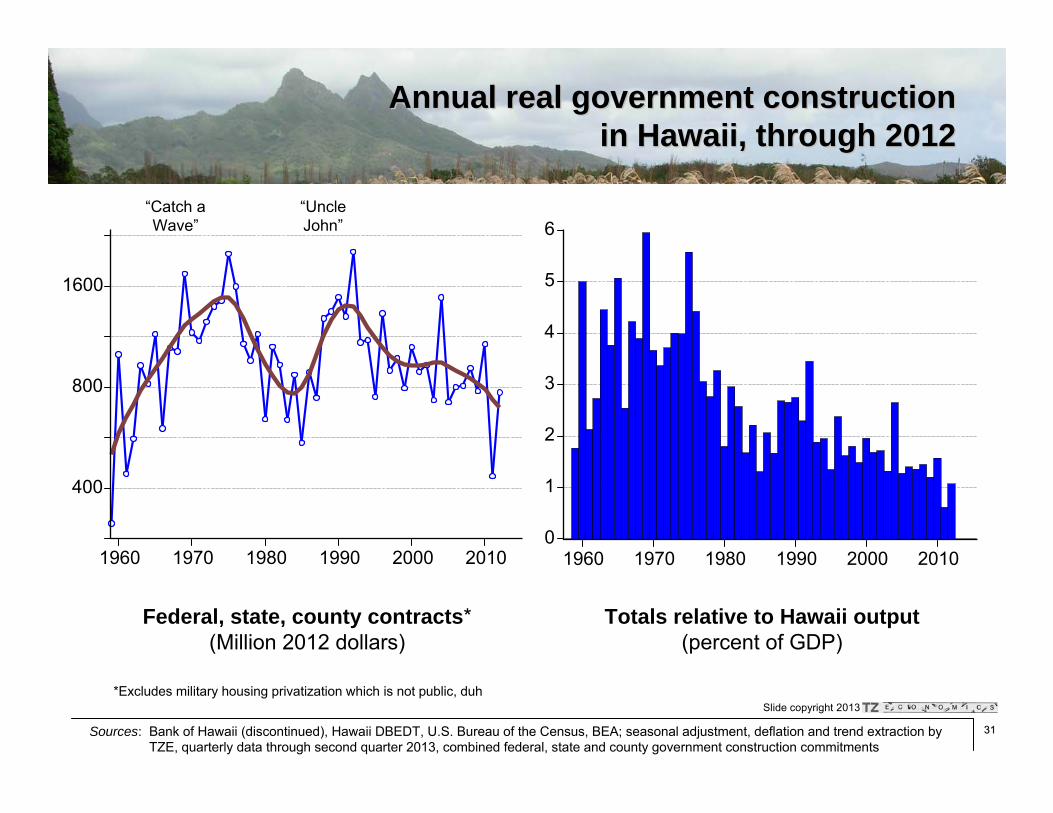
Annual real government construction Annual real government construction in Hawaii, through 2012in Hawaii, through 2012
400
800
1600
1960 1970 1980 1990 2000 20100
1
2
3
4
5
6
1960 1970 1980 1990 2000 2010
Federal, state, county contracts*(Million 2012 dollars)
Totals relative to Hawaii output(percent of GDP)
“Catch a Wave”
“Uncle John”
*Excludes military housing privatization which is not public, duh
Sources: Bank of Hawaii (discontinued), Hawaii DBEDT, U.S. Bureau of the Census, BEA; seasonal adjustment, deflation and trend extraction by TZE, quarterly data through second quarter 2013, combined federal, state and county government construction commitments
3232
Slide copyright 2013
OutlineOutline
1. Halfway into the current economic expansion
2. Housing
3.3. ConstructionConstructionRecovery isRecovery is partly a head fake: PV panels are partly a head fake: PV panels are equipmentequipment, not buildings*, not buildings*Construction of new Construction of new buildingsbuildings recovering less quickly; commercial not at allrecovering less quickly; commercial not at allHomebuilding mired in Homebuilding mired in acronymphobiaacronymphobia (LUC, DPP, HCDA, HHFDC, DHHL(LUC, DPP, HCDA, HHFDC, DHHL……))AfterAfter rising, public construction as % of GDP still rising, public construction as % of GDP still less thanless than fifty years agofifty years ago
4. Macroeconomic outlook
*As in “building permit,” the noun, not the verb
3333
Slide copyright 2013
Macroeconomic outlook: growth with challengesMacroeconomic outlook: growth with challenges
[This slide intentionally left blank]
3434
Slide copyright 2013
-8
-4
0
4
8
05 06 07 08 09 10 11 12 13 14
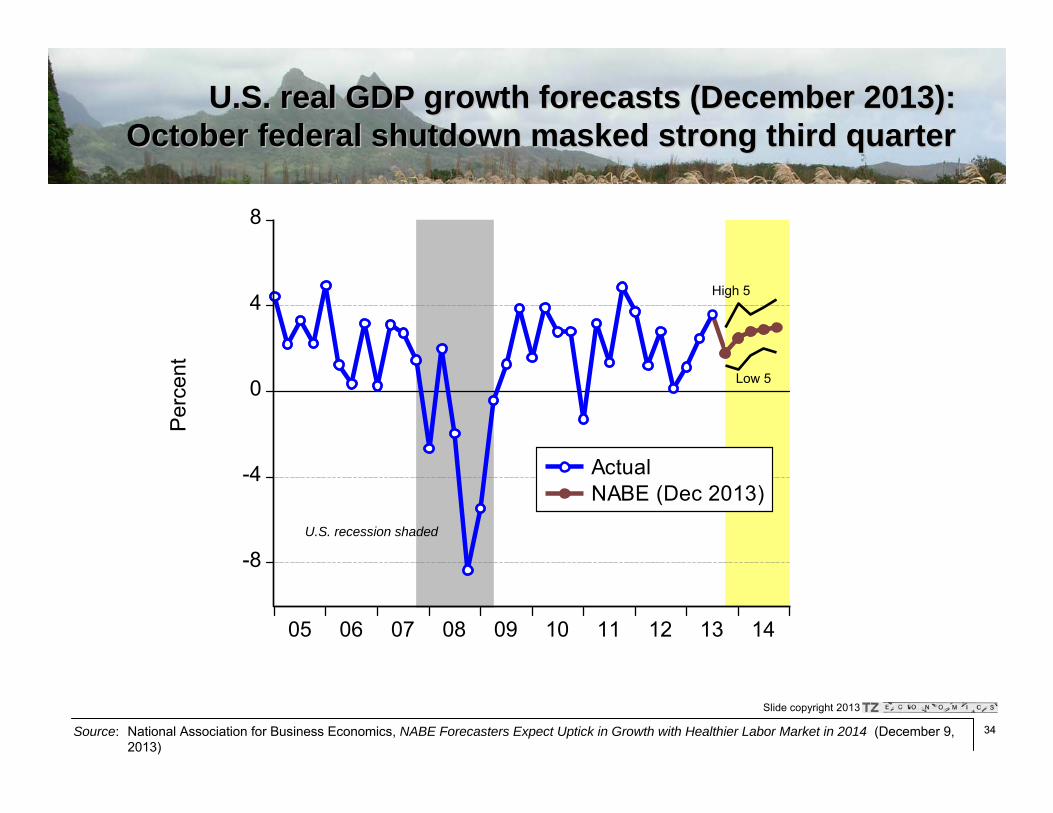
ActualNABE (Dec 2013)
U.S. real GDP growth forecasts (December 2013):U.S. real GDP growth forecasts (December 2013):October federal shutdown masked strong third quarterOctober federal shutdown masked strong third quarter
U.S. recession shaded
High 5
Low 5
Source: National Association for Business Economics, NABE Forecasters Expect Uptick in Growth with Healthier Labor Market in 2014 (December 9, 2013)
Per
cent

3535
Slide copyright 2013
Composition of U.S. real GDP since 2010: Composition of U.S. real GDP since 2010: consumptionconsumption--, investment, investment--, and export, and export--led growthled growth
-12
-8
-4
0
4
8
2005 2006 2007 2008 2009 2010 2011 2012 2013
ConsumptionCapital formationGovernmentNet exportsInventory change
Source: Bureau of Economic Analysis, U.S. Department of Commerce
Per
cent
U.S. recession shaded

3636
Slide copyright 2013
Compound annual growth of real U.S. GDP government Compound annual growth of real U.S. GDP government components highlight shifting sources of fiscal dragcomponents highlight shifting sources of fiscal drag
Source: Bureau of Economic Analysis, U.S. Department of Commerce
Expansion to-date
First 2 years 09Q2-11Q2
Second 2 years 11Q2-13Q3
GDP 2.3 2.25 2.36
Government -1.5 -1.5 -1.4
Federal -1.1 1.1 -3.0National defense -2.1 0.8 -4.5Nondefense 0.7 1.8 -0.3
State and local -1.7 -3.3 -0.3
Hawaii math: 0.25 of economy (public sector) is growing −1.5% per annum0.75 of economy (private sector) is growing +3.5%Overall economy grows 2.25%

3737
Slide copyright 2013
Hawaii quarterly real personal income growth (Hawaii quarterly real personal income growth (pukapuka))and contemporaneous Honolulu inflation rates (line)and contemporaneous Honolulu inflation rates (line)
U.S. recession shaded
22--3% growth expectation 3% growth expectation (e.g. DBEDT, UHERO)(e.g. DBEDT, UHERO)
Source: Bureau of Economic Analysis, U.S. Department of Commerce, Bureau of Labor Statistics, U.S. Department of Labor; Honolulu CPI-U is interpolated from semiannual data
Per
cent
Real personal income growth rates
Federal government sequestration
-2
0
2
4
6
04 05 06 07 08 09 10 11 12 13 14
HNL CPI-U inflationHawaii real PI growthCPI inflation
3838
Slide copyright 2013
0
4
8
12
2000 2005 2010 2015
U.S. averageNeighbor IslesOahu
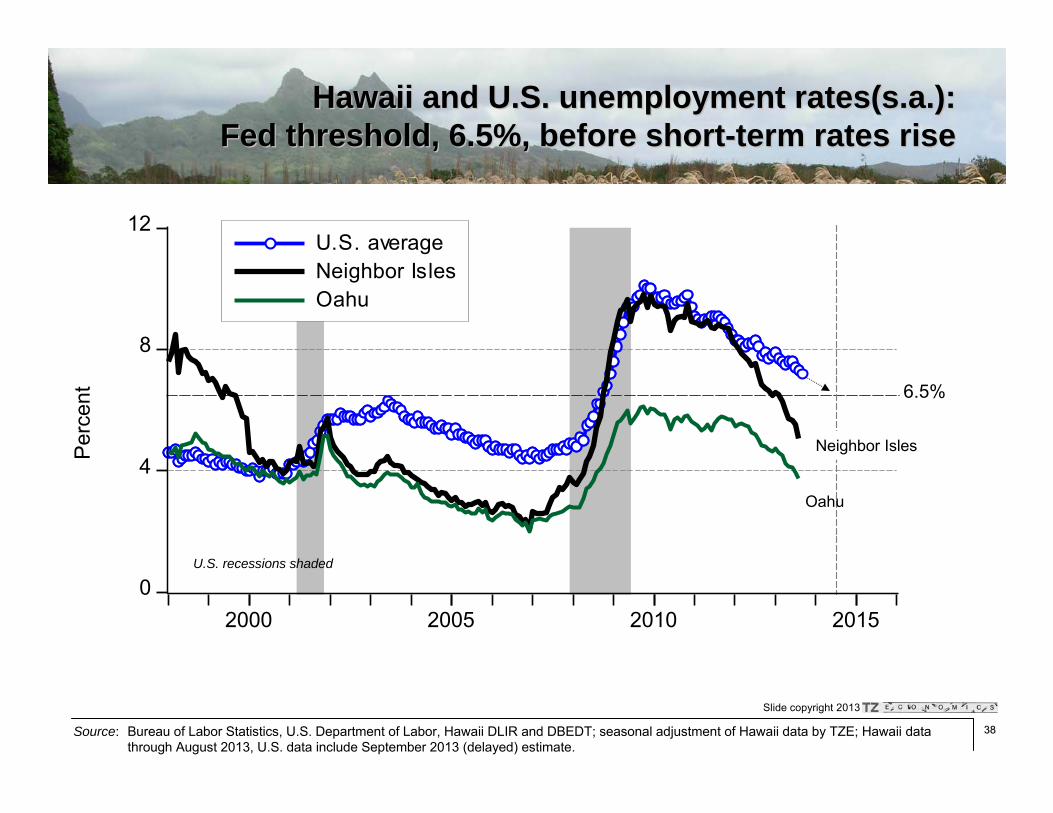
Hawaii and U.S. unemployment Hawaii and U.S. unemployment rates(s.arates(s.a.): .): Fed threshold, 6.5%, before shortFed threshold, 6.5%, before short--term rates riseterm rates rise
Per
cent
Source: Bureau of Labor Statistics, U.S. Department of Labor, Hawaii DLIR and DBEDT; seasonal adjustment of Hawaii data by TZE; Hawaii data through August 2013, U.S. data include September 2013 (delayed) estimate.
6.5%
Neighbor Isles
Oahu
U.S. recessions shaded

3939
Slide copyright 2013
0 5 10 15 0 5 10 15 0 5 10 15 0 5 10 150 5 10 150 5 10 150 5 10 15 0 5 10 150 5 10 15 0 5 10 150 5 10 15 0 5 10 150 5 10 150 5 10 150 5 10 15
Distributions of FOMC participantDistributions of FOMC participant’’s forecasts for s forecasts for the fed funds target rate and weighted averagesthe fed funds target rate and weighted averages
2013 2014 2015 Longer-run
Perc
ent
Number of observations (FOMC participants, total = 17)
0.25% 0.40%
2.26%
3.93%
2016
1.25%
5
4
3
2
1
0
Source: Advance release of Figure 2 Overview of FOMC participants’ assessments of appropriate monetary policy to be released with September17-18, 2013 FOMC minutes (released September 18, 2013) (http://www.federalreserve.gov/monetarypolicy/fomcprojtabl20130918.htm)

4040
Slide copyright 2013
0
2
4
6
2000 2002 2004 2006 2008 2010 2012 2014 2016 2018
Treasury constantTreasury constant--maturity yields (term structure) maturity yields (term structure) and fed funds rate trajectory implied by the FOMCand fed funds rate trajectory implied by the FOMC
“Longer-run (4%)”
Sept. 2013 FOMC fed funds rate forecast
U.S. recessions shaded
Per
cent
Source: H.15 and advance release of Figure 2 Overview of FOMC participants’ assessments of appropriate monetary policy to be released with Sept. 17-18, 2013 FOMC minutes (released September 18, 2013) (http://www.federalreserve.gov/monetarypolicy/fomcprojtabl20130918.htm)
9/11 Lehman10-year U.S. Treasury Note yield
Effective fed funds rate

4141
Slide copyright 2013
Hawaii Council on Revenues multiHawaii Council on Revenues multi--year forecasts for year forecasts for nominal General Fund revenue growth since FY1999nominal General Fund revenue growth since FY1999
U.S. recessions shaded
Per
cent
cha
nge
Source: Hawaii Department of Taxation (http://www.state.hi.us/tax/a9_1cor.htm)
Actual
Forecasts
Fiscal years
-15
-10
-5
0
5
10
15
20
2000 2005 2010 2015 2020
4242
Slide copyright 2013
800
1000
1200
1400
1600
2000 2005 2010 2015
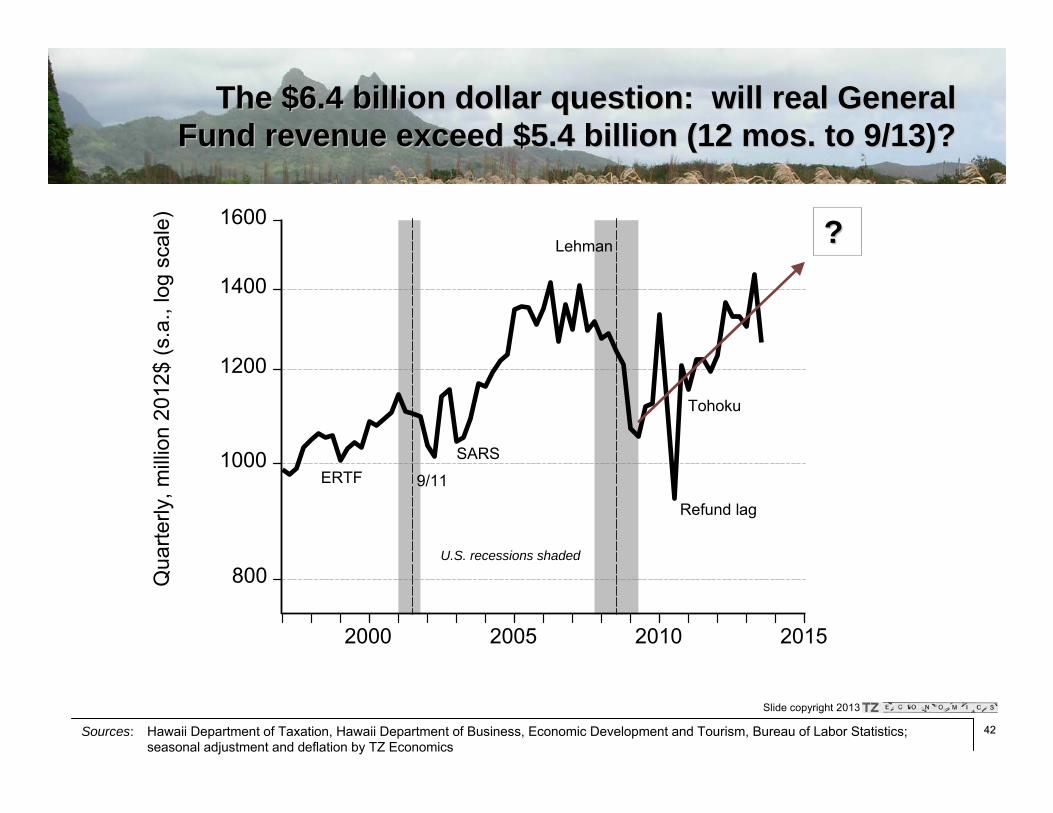
The $6.4 billion dollar question: will real General The $6.4 billion dollar question: will real General Fund revenue exceed $5.4 billion (12 mos. to 9/13)?Fund revenue exceed $5.4 billion (12 mos. to 9/13)?
Qua
rterly
, milli
on 2
012$
(s.a
., lo
g sc
ale)
U.S. recessions shaded
9/11
Lehman
Tohoku
Refund lag
ERTF
??
SARS
Sources: Hawaii Department of Taxation, Hawaii Department of Business, Economic Development and Tourism, Bureau of Labor Statistics; seasonal adjustment and deflation by TZ Economics
4343
Slide copyright 2013
800
1000
1200
1400
1600
2000 2005 2010 2015
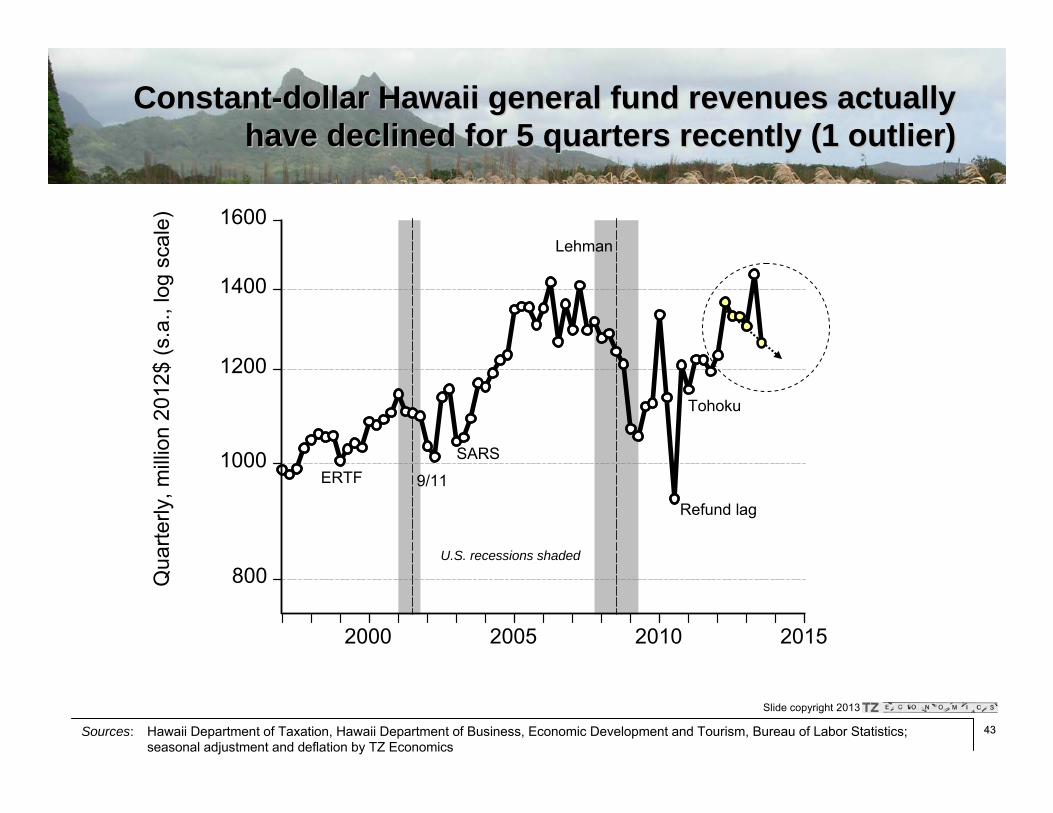
ConstantConstant--dollar Hawaii general fund revenues actually dollar Hawaii general fund revenues actually have declined for 5 quarters recently (1 outlier)have declined for 5 quarters recently (1 outlier)
Qua
rterly
, milli
on 2
012$
(s.a
., lo
g sc
ale)
Sources: Hawaii Department of Taxation, Hawaii Department of Business, Economic Development and Tourism, Bureau of Labor Statistics; seasonal adjustment and deflation by TZ Economics
Lehman
SARS
Tohoku
Refund lag
ERTF
U.S. recessions shaded
9/11

4444
Slide copyright 2013
1. Halfway into the current economic expansion
2. Housing
3. Construction
4.4. Macroeconomic outlookMacroeconomic outlookU.S. real GDP growth forecast: 2% going to 3% (Hawaii too)U.S. real GDP growth forecast: 2% going to 3% (Hawaii too)Private sector growth despite fiscal drag, now from federal govePrivate sector growth despite fiscal drag, now from federal governmentrnmentOilOil--driven inflation shocks were temporary; tighter labor markets codriven inflation shocks were temporary; tighter labor markets comingmingNormalization of monetary policy will raise interest ratesNormalization of monetary policy will raise interest rates——more dragmore dragGeneral fund revenues exceed forecast, boom General fund revenues exceed forecast, boom andand bust; position for latterbust; position for latter
OutlineOutline

4545
Slide copyright 2013
MahaloMahalo!!Slides available from:Slides available from:
Paul H. Brewbaker, Ph.D.Paul H. Brewbaker, Ph.D.Principal, TZ EconomicsPrincipal, TZ Economics606 606 UlulaniUlulani St.St.Kailua, Hawaii 96734Kailua, Hawaii [email protected]@tzeconomics.com
Slide copyright 2013
Appendix: Phillips Curves, etc.Appendix: Phillips Curves, etc.

4646
Slide copyright 2013
MahaloMahalo!!
Slides available from:Slides available from:
Paul H. Brewbaker, Ph.D.Paul H. Brewbaker, Ph.D.Principal, TZ EconomicsPrincipal, TZ Economics606 606 UlulaniUlulani St.St.Kailua, Hawaii 96734Kailua, Hawaii [email protected]@tzeconomics.com

4747
Slide copyright 2013
Appendix 1: NABE September 2013 forecastAppendix 1: NABE September 2013 forecast
[This slide intentionally left blank]

4848
Slide copyright 2013
-8
-4
0
4
8
05 06 07 08 09 10 11 12 13 14
ActualNABE (Sep 2013)
U.S. real GDP growth forecasts (September 2013):U.S. real GDP growth forecasts (September 2013):actual third quarter growth closer to high endactual third quarter growth closer to high end
U.S. recession shaded
High 5
Low 5
Source: National Association for Business Economics, NABE Panelists Forecast a Gradual Acceleration in Economic Expansion (September 9, 2013)
Per
cent
4949
Slide copyright 2013
Appendix 2: Tourism hasAppendix 2: Tourism has notnot grown since 1990grown since 1990
[This slide intentionally left blank]

5050
Slide copyright 2013
0
1
2
3
4
5
6
7
8
1950 1975 20000
2
4
6
8
10
12
14
16
18
1950 1975 2000
DBEDT forecastActual data
Tourism dilemmaTourism dilemma——higher volumes, higher volumes, lowerlower receipts; receipts; binding constraint: 75k rooms (2012) vs. 73k (1992)binding constraint: 75k rooms (2012) vs. 73k (1992)
Billion 2012$Million visitors
Sources: Hawaii Tourism Authority, Hawaii DBEDT (annual visitor plant inventory surveys, monthly visitor arrivals and expenditure estimates, November visitor expenditure forecasts), Bureau of Labor Statistics (Honolulu consumer price index); deflation calculations by TZE
Thousand rooms
Tourist accommodationsTourist accommodations Tourist arrivalsTourist arrivals Real tourism receiptsReal tourism receipts
0
10
20
30
40
50
60
70
80
1950 1975 2000
5151
Slide copyright 2013
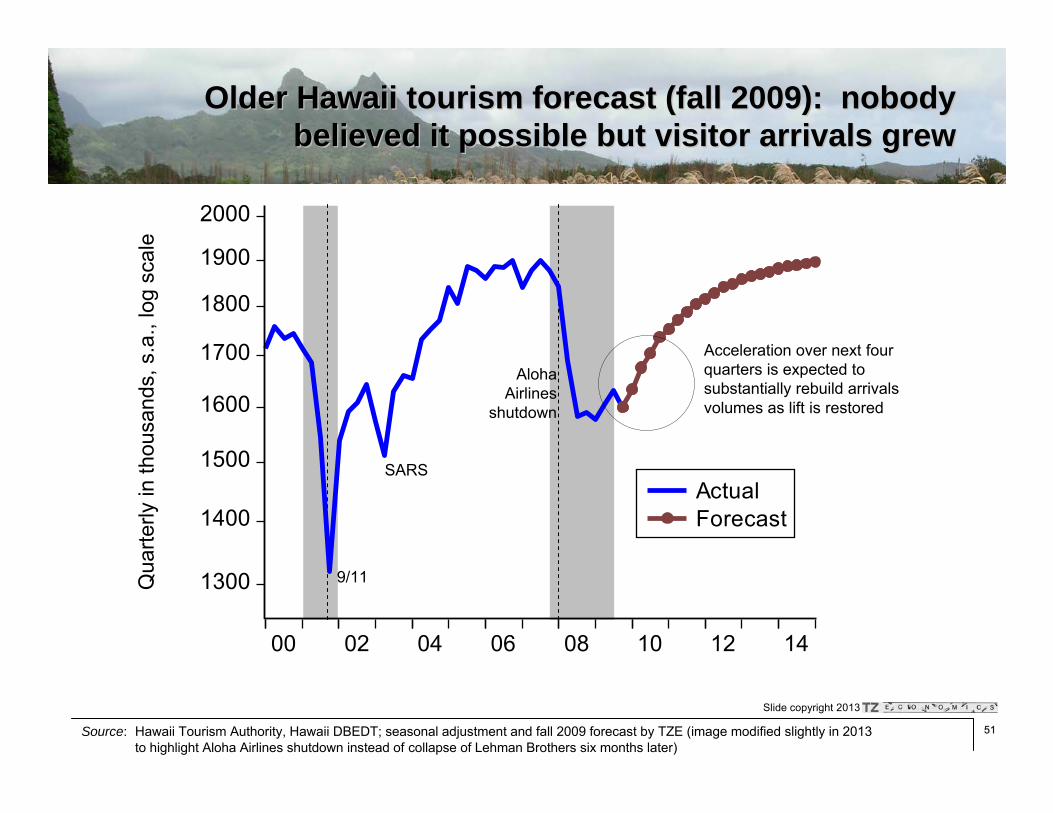
Older Hawaii tourism forecast (fall 2009): nobody Older Hawaii tourism forecast (fall 2009): nobody believed it possible but visitor arrivals grewbelieved it possible but visitor arrivals grew
1300
1400
1500
1600
1700
1800
1900
2000
00 02 04 06 08 10 12 14
ActualForecast
Qua
rterly
in th
ousa
nds,
s.a
., lo
g sc
ale
Source: Hawaii Tourism Authority, Hawaii DBEDT; seasonal adjustment and fall 2009 forecast by TZE (image modified slightly in 2013 to highlight Aloha Airlines shutdown instead of collapse of Lehman Brothers six months later)
9/11
SARS
Aloha Airlines
shutdown
Acceleration over next four quarters is expected to substantially rebuild arrivals volumes as lift is restored

5252
Slide copyright 2013
500
550
600
650
700
750
800
05 06 07 08 09 10 11 12 13 14 15
ActualTZE forecast2012 DBEDT/UHERO2011 DBEDT/UHERO
2011 forecasts too low, 2012 too high (especially mine): 2011 forecasts too low, 2012 too high (especially mine): failing to identify lodging capacity constraintfailing to identify lodging capacity constraint
Mon
thly
in th
ousa
nds,
s.a
. (lo
g sc
ale)
Source: Data through September 2013 from HTA, Hawaii DBEDT; forecasts from DBEDT and UHERO); seasonal adjustment (Census X-12 ARIMA filter) and forecast from trend components of tax revenue model for January 2013 HIPA conference by TZE
U.S. recessionshaded
Aloha shutdown
Tohoku
P T
DBEDT/UHERO 2012
TZE forecast
DBEDT/UHERO forecast 2011
Lift

5353
Slide copyright 2013
Appendix 3. State of Hawaii is Appendix 3. State of Hawaii is notnot saving enoughsaving enough
[This slide intentionally left blank]

5454
Slide copyright 2013
-5
0
5
10
15
-10
0
10
20
30
1980 1985 1990 1995 2000 2005 2010 2015 2020
Real income growth rate* (left scale)General Fund cash/exp. (right)
State cash balances historically provided deeper State cash balances historically provided deeper ““insuranceinsurance”” coverage than during the last cyclecoverage than during the last cycle
Sources: BEA, BLS, Hawaii Tax Review Commission, Hawaii Dept. of B&F (December 17, 2012) (http://budget.hawaii.gov/wp-content/uploads/2012/12/05.-State-Receipt-and-Revenue-Plans-FB13-15-PFP.pdf), Hawaii DoTAX (http://www.state.hi.us/tax/cor/2013tpi10-31_with1104_Rpt2Gov.pdf)
State of H
awaii cash balance as percent of
General Fund expenditure (%
)H
awai
i rea
l per
sona
l inc
ome
grow
th ra
te (%
)
*Lagged one year
Sugar (Commodity Bubble)
Japan Bubble
Sub-primeBubble
dot.com ProjectedProjected

5555
Slide copyright 2013
Another fund: unemployment rate falls to 3%, wage Another fund: unemployment rate falls to 3%, wage base, tax rate revert to base, tax rate revert to ““normalnormal””——adequate funding?adequate funding?
0
2
4
6
8
10
70 75 80 85 90 95 00 05 10 15 200
1
2
3
4
70 75 80 85 90 95 00 05 10 15 20
0
10
20
30
40
50
70 75 80 85 90 95 00 05 10 15 20-200
0
200
400
600
800
70 75 80 85 90 95 00 05 10 15 20
Assumed Assumed
Assumed Projected
Hawaii unemployment
rate (u)(percent)
Taxable wage base (w)
(thousand 2011$)
Payroll tax rate (τ) (percent)
Real unemployment compensation fund (R)(million 2011 $)
Source: Hawaii DLIR (special correspondence and http://hawaii.gov/labor/reports/annual/2011-4/program/UTF%20FY2011.pdf); deflation by TZE using Honolulu CPI-U; even agressive restoration of funding parameters and a good economy may not rebuild the fund fast enough
5656
Slide copyright 2013
Appendix 4. Homebuilding really is Appendix 4. Homebuilding really is that that lowlow
[This slide intentionally left blank]

5757
Slide copyright 2013
Neighbor Island quarterly new housing units Neighbor Island quarterly new housing units authorized by building permit: nothing but upsideauthorized by building permit: nothing but upside
Sources: County building departments, Hawaii DBEDT, quarterly TZE data through third quarter 2013; seasonal adjustment and trend extraction by TZE
Uni
ts, s
.a. (
log
scal
e)
200
400
800
1600
3200
1975 1980 1985 1990 1995 2000 2005 2010 2015 2020
Lehman Brothers
5858
Slide copyright 2013
200
400
800
1600
3200
1980 1985 1990 1995 2000 2005 2010 2015 2020
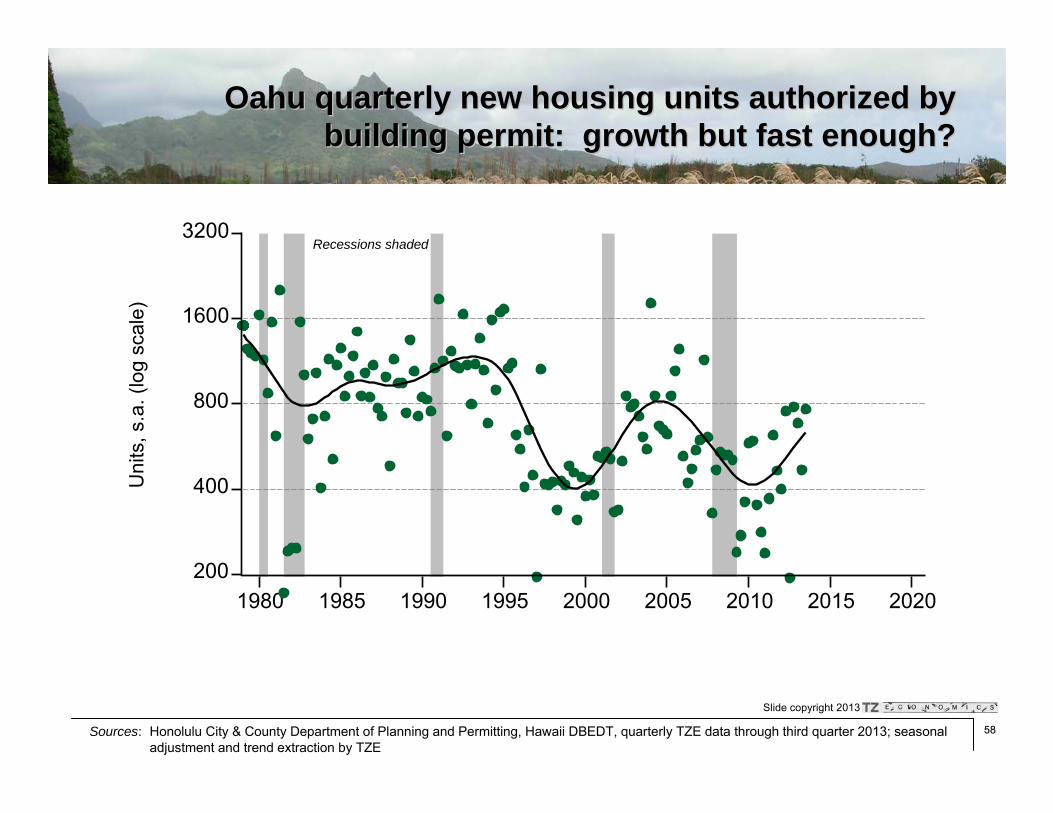
Oahu quarterly new housing units authorized by Oahu quarterly new housing units authorized by building permit: growth but fast enough?building permit: growth but fast enough?
Sources: Honolulu City & County Department of Planning and Permitting, Hawaii DBEDT, quarterly TZE data through third quarter 2013; seasonal adjustment and trend extraction by TZE
Uni
ts, s
.a. (
log
scal
e)
Recessions shaded

5959
Slide copyright 2013
.00
.02
.04
.06
.08
.10
20 30 40 50 60 70 80 90 00 10 20
OahuNeighbor Isles
Pro
porti
on o
f exi
stin
g ho
usin
g st
ock
Sources: Robert C. Schmitt Historical Statistics of Hawaii, Hawaii DBEDT (http://dbedt.hawaii.gov/economic/county_report/), Bank of Hawaii Annual Economic Report (various); annual TZE data through 2012
New housing units as % of housing stock(New housing units as % of housing stock(--1)1)

6060
Slide copyright 2013
Appendix 5: Honolulu Phillips CurvesAppendix 5: Honolulu Phillips Curves
[This slide intentionally left blank]

6161
Slide copyright 2013
-2
0
2
4
6
8
1 2 3 4 5 6 7
1998-20062007-2013fh
u
p̂
Honolulu inflation and unemployment since 2007: Honolulu inflation and unemployment since 2007: oil shocks (2008, 2010oil shocks (2008, 2010--11); into 11); into ““The ZoneThe Zone”” 20132013
19981998
20062006
2007200720082008
20092009
Source: Bureau of Labor Statistics, U.S. Department of Labor, Hawaii DBEDT and DLIR; data through second half 2012, all calculations by TZE
20112011Oil shock (unwound in 2012)
Oil shock (unwound in 2009)
20132013

6262
Slide copyright 2013
-2
0
2
4
6
8
1 2 3 4 5 6 7
1998-20062007-2013fh
u
p̂
Fed inflation goal (2%) defines LR equilibrium;Fed inflation goal (2%) defines LR equilibrium;Oahu housing cycle exerts Oahu housing cycle exerts ““clockwiseclockwise”” tendencytendency
19981998
20062006
2007200720082008
20092009
Source: Bureau of Labor Statistics, U.S. Department of Labor, Hawaii DBEDT and DLIR; data through second half 2012, all calculations by TZE
20112011Oil shock (unwound in 2012)
Oil shock (unwound in 2009)