This sample business plan has been made available to users of Business Plan Pro®, business planningsoftware published by Palo Alto Software, Inc. Names, locations and numbers may have beenchanged, and substantial portions of the original plan text may have been omitted to preserveconfidentiality and proprietary information.
You are welcome to use this plan as a starting point to create your own, but you do not havepermission to resell, reproduce, publish, distribute or even copy this plan as it exists here.
Requests for reprints, academic use, and other dissemination of this sample plan should be emailedto the marketing department of Palo Alto Software at [email protected]. For productinformation visit our website: www.paloalto.com or call: 1-800-229-7526.
Copyright © Palo Alto Software, Inc., 1995-2009 All rights reserved.
Confidentiality Agreement
The undersigned reader acknowledges that the information provided by_________________________ in this business plan is confidential; therefore, reader agrees not todisclose it without the express written permission of _________________________.
It is acknowledged by reader that information to be furnished in this business plan is in all respectsconfidential in nature, other than information which is in the public domain through other meansand that any disclosure or use of same by reader, may cause serious harm or damage to_________________________.
Upon request, this document is to be immediately returned to _________________________.
___________________Signature
___________________Name (typed or printed)
___________________Date
This is a business plan. It does not imply an offering of securities.
Table of Contents
Page 1
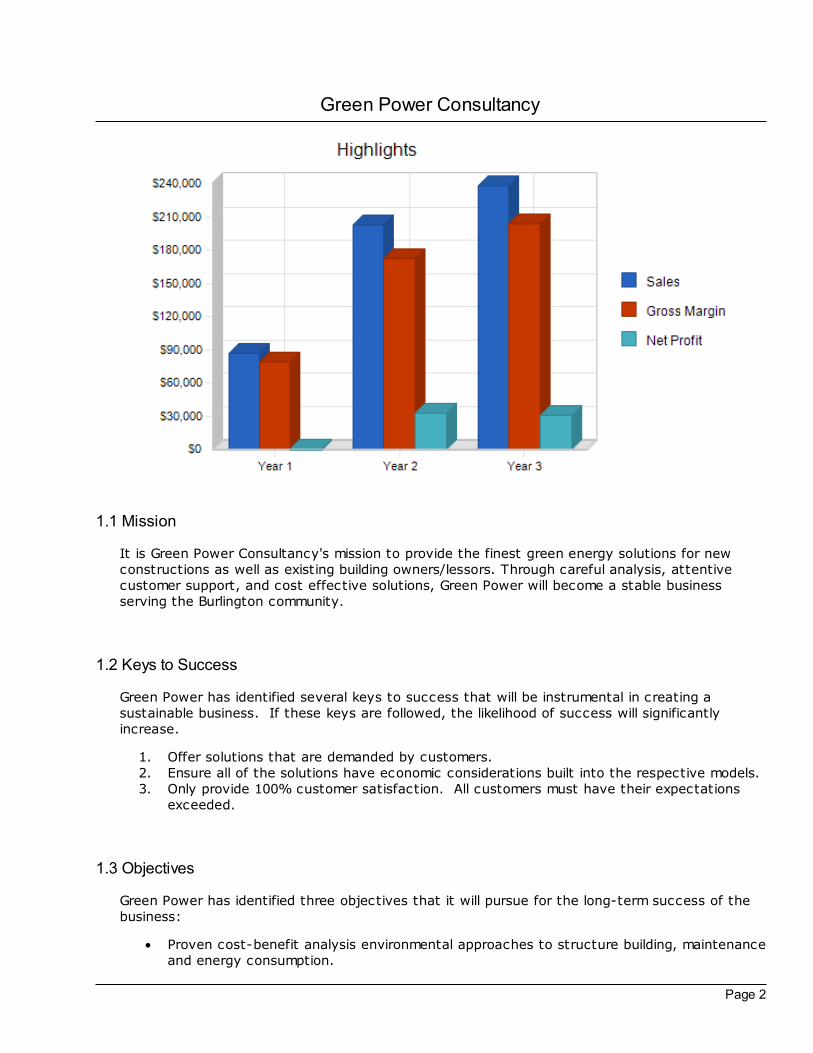
1.0 Executive Summary.............................................................................................................................1Chart: Highlights ......................................................................................................................2
1.1 Mission ........................................................................................................................................21.2 Keys to Success ........................................................................................................................21.3 Objectives ...................................................................................................................................2
2.0 Company Summary.............................................................................................................................32.1 Start-up Summary ......................................................................................................................3
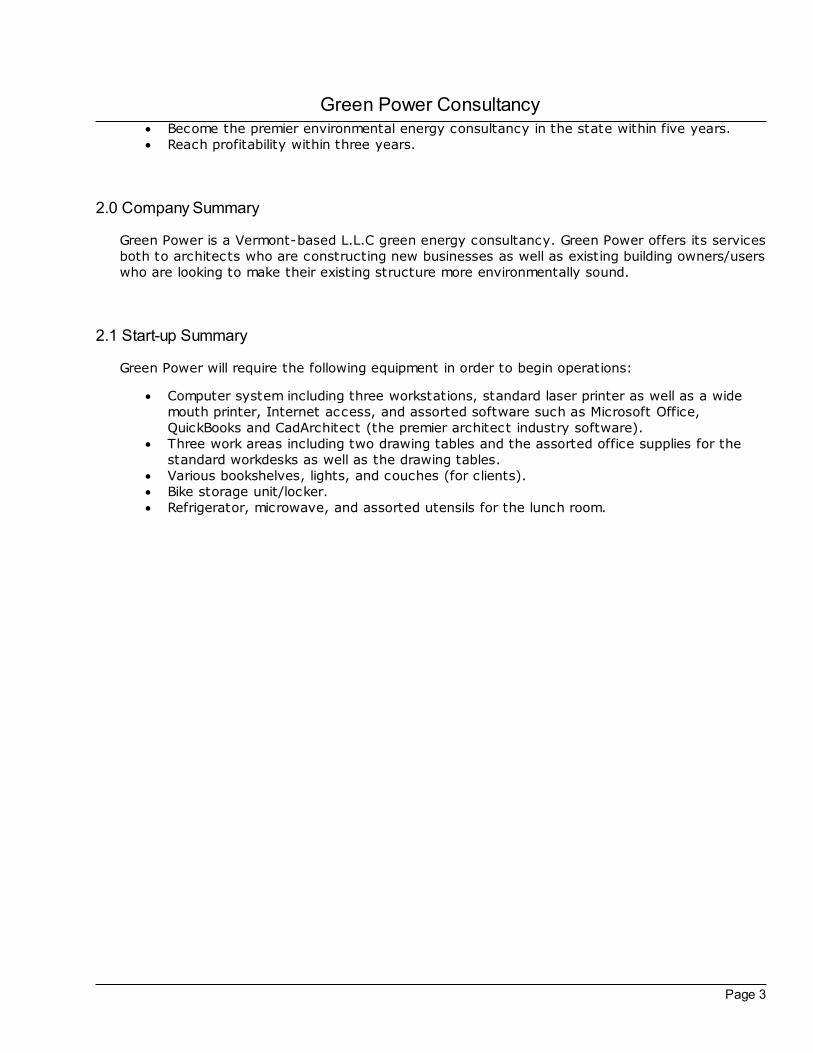
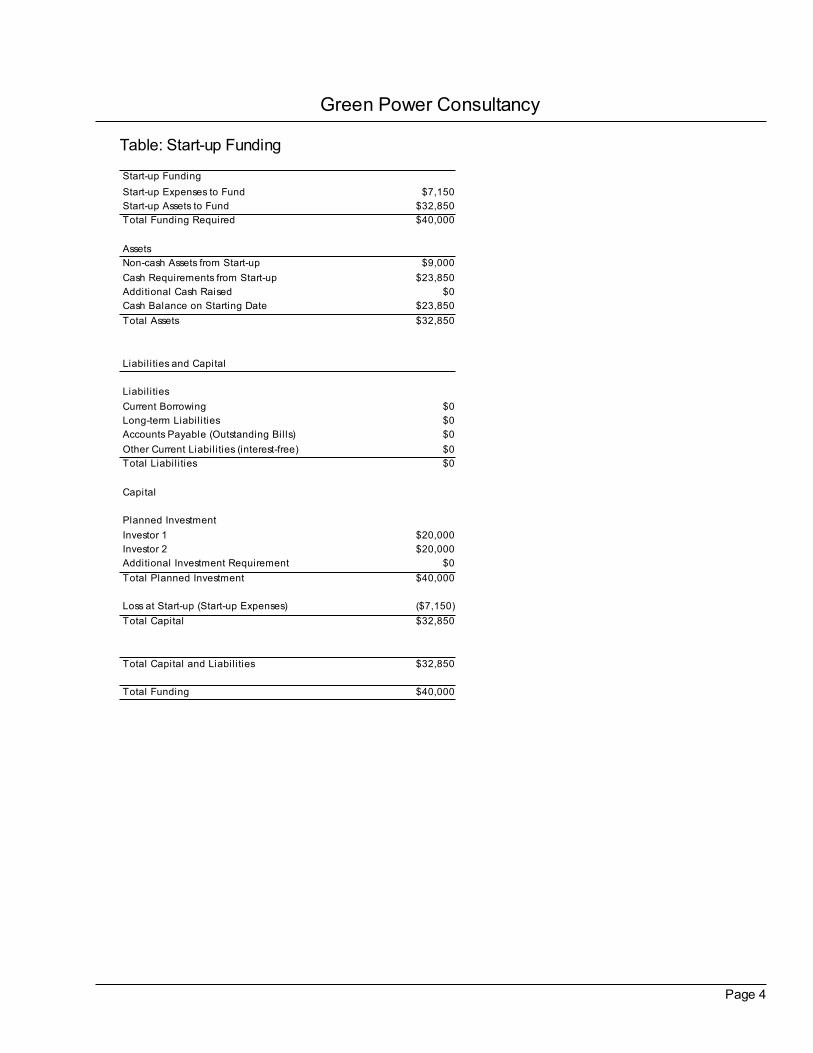
Table: Start-up Funding ..........................................................................................................4Chart: Start-up .........................................................................................................................5Table: Start-up .........................................................................................................................5
2.2 Company Ownership .................................................................................................................53.0 Services................................................................................................................................................54.0 Market Analysis Summary ..................................................................................................................6
4.1 Market Segmentation ................................................................................................................6Table: Market Analysis ...........................................................................................................7Chart: Market Analysis (Pie) ..................................................................................................8
4.2 Target Market Segment Strategy .............................................................................................84.3 Service Business Analysis........................................................................................................8
4.3.1 Competition and Buying Patterns................................................................................95.0 Strategy and Implementation Summary ............................................................................................9
5.1 Competitive Edge....................................................................................................................105.2 Marketing Strategy ..................................................................................................................105.3 Sales Strategy..........................................................................................................................10
5.3.1 Sales Forecast ............................................................................................................11Table: Sales Forecast.................................................................................................11Chart: Sales Monthly ...................................................................................................12Chart: Sales by Year ...................................................................................................12
5.4 Milestones ................................................................................................................................12Table: Milestones..................................................................................................................13Chart: Milestones ..................................................................................................................13
6.0 Web Plan Summary ..........................................................................................................................136.1 Website Marketing Strategy ...................................................................................................136.2 Development Requirements ...................................................................................................14
7.0 Management Summary ....................................................................................................................147.1 Personnel Plan .........................................................................................................................15
Table: Personnel ...................................................................................................................158.0 Financial Plan ....................................................................................................................................15
8.1 Important Assumptions............................................................................................................15Table: General Assumptions ...............................................................................................15
8.2 Break-even Analysis................................................................................................................16Chart: Break-even Analysis .................................................................................................16Table: Break-even Analysis .................................................................................................16
8.3 Projected Profit and Loss .......................................................................................................17Table: Profit and Loss ..........................................................................................................17Chart: Profit Monthly .............................................................................................................18Chart: Profit Yearly ................................................................................................................18Chart: Gross Margin Monthly ...............................................................................................19
Table of Contents
Page 2
Chart: Gross Margin Yearly..................................................................................................198.4 Projected Cash Flow ...............................................................................................................20
Table: Cash Flow ..................................................................................................................20Chart: Cash ...........................................................................................................................21
8.5 Projected Balance Sheet ........................................................................................................22Table: Balance Sheet ...........................................................................................................22
8.6 Business Ratios .......................................................................................................................23Table: Ratios .........................................................................................................................24
Table: Sales Forecast ...............................................................................................................................1Table: Personnel ........................................................................................................................................2Table: General Assumptions ....................................................................................................................3Table: Profit and Loss ...............................................................................................................................4Table: Cash Flow .......................................................................................................................................5Table: Balance Sheet ................................................................................................................................6
Green Power Consultancy
Page 1
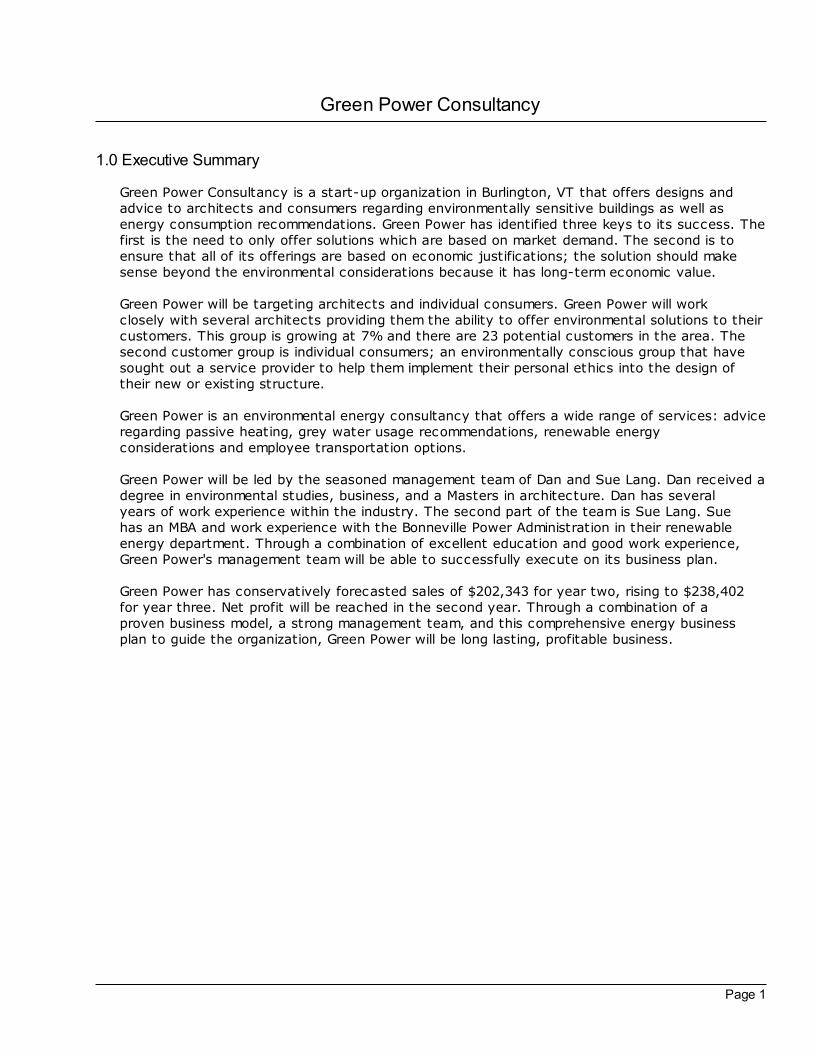
1.0 Executive Summary
Green Power Consultancy is a start-up organization in Burlington, VT that offers designs andadvice to architects and consumers regarding environmentally sensitive buildings as well asenergy consumption recommendations. Green Power has identified three keys to its success. Thefirst is the need to only offer solutions which are based on market demand. The second is toensure that all of its offerings are based on economic justifications; the solution should makesense beyond the environmental considerations because it has long-term economic value.
Green Power will be targeting architects and individual consumers. Green Power will workclosely with several architects providing them the ability to offer environmental solutions to theircustomers. This group is growing at 7% and there are 23 potential customers in the area. Thesecond customer group is individual consumers; an environmentally conscious group that havesought out a service provider to help them implement their personal ethics into the design oftheir new or existing structure.
Green Power is an environmental energy consultancy that offers a wide range of services: adviceregarding passive heating, grey water usage recommendations, renewable energyconsiderations and employee transportation options.
Green Power will be led by the seasoned management team of Dan and Sue Lang. Dan received adegree in environmental studies, business, and a Masters in architecture. Dan has severalyears of work experience within the industry. The second part of the team is Sue Lang. Suehas an MBA and work experience with the Bonneville Power Administration in their renewableenergy department. Through a combination of excellent education and good work experience,Green Power's management team will be able to successfully execute on its business plan.
Green Power has conservatively forecasted sales of $202,343 for year two, rising to $238,402for year three. Net profit will be reached in the second year. Through a combination of aproven business model, a strong management team, and this comprehensive energy businessplan to guide the organization, Green Power will be long lasting, profitable business.
Green Power Consultancy
Page 2
1.1 Mission
It is Green Power Consultancy's mission to provide the finest green energy solutions for newconstructions as well as existing building owners/lessors. Through careful analysis, attentivecustomer support, and cost effective solutions, Green Power will become a stable businessserving the Burlington community.
1.2 Keys to Success
Green Power has identified several keys to success that will be instrumental in creating asustainable business. If these keys are followed, the likelihood of success will significantlyincrease.
1. Offer solutions that are demanded by customers.2. Ensure all of the solutions have economic considerations built into the respective models.3. Only provide 100% customer satisfaction. All customers must have their expectations
exceeded.
1.3 Objectives
Green Power has identified three objectives that it will pursue for the long-term success of thebusiness:
· Proven cost-benefit analysis environmental approaches to structure building, maintenanceand energy consumption.
Green Power Consultancy
Page 3
· Become the premier environmental energy consultancy in the state within five years.· Reach profitability within three years.
2.0 Company Summary
Green Power is a Vermont-based L.L.C green energy consultancy. Green Power offers its servicesboth to architects who are constructing new businesses as well as existing building owners/userswho are looking to make their existing structure more environmentally sound.
2.1 Start-up Summary
Green Power will require the following equipment in order to begin operations:
· Computer system including three workstations, standard laser printer as well as a widemouth printer, Internet access, and assorted software such as Microsoft Office,QuickBooks and CadArchitect (the premier architect industry software).
· Three work areas including two drawing tables and the assorted office supplies for thestandard workdesks as well as the drawing tables.
· Various bookshelves, lights, and couches (for clients).· Bike storage unit/locker.· Refrigerator, microwave, and assorted utensils for the lunch room.
Green Power Consultancy
Page 4
Table: Start-up Funding
Start-up Funding
Start-up Expenses to Fund $7,150
Start-up Assets to Fund $32,850
Total Funding Required $40,000
Assets
Non-cash Assets from Start-up $9,000
Cash Requirements from Start-up $23,850
Additional Cash Raised $0
Cash Balance on Starting Date $23,850
Total Assets $32,850
Liabilities and Capital
Liabilities
Current Borrowing $0
Long-term Liabil ities $0
Accounts Payable (Outstanding Bills) $0
Other Current Liabil ities (interest-free) $0
Total Liabil ities $0
Capital
Planned Investment
Investor 1 $20,000
Investor 2 $20,000
Additional Investment Requirement $0
Total Planned Investment $40,000
Loss at Start-up (Start-up Expenses) ($7,150)
Total Capital $32,850
Total Capital and Liabil ities $32,850
Total Funding $40,000
Green Power Consultancy
Page 5
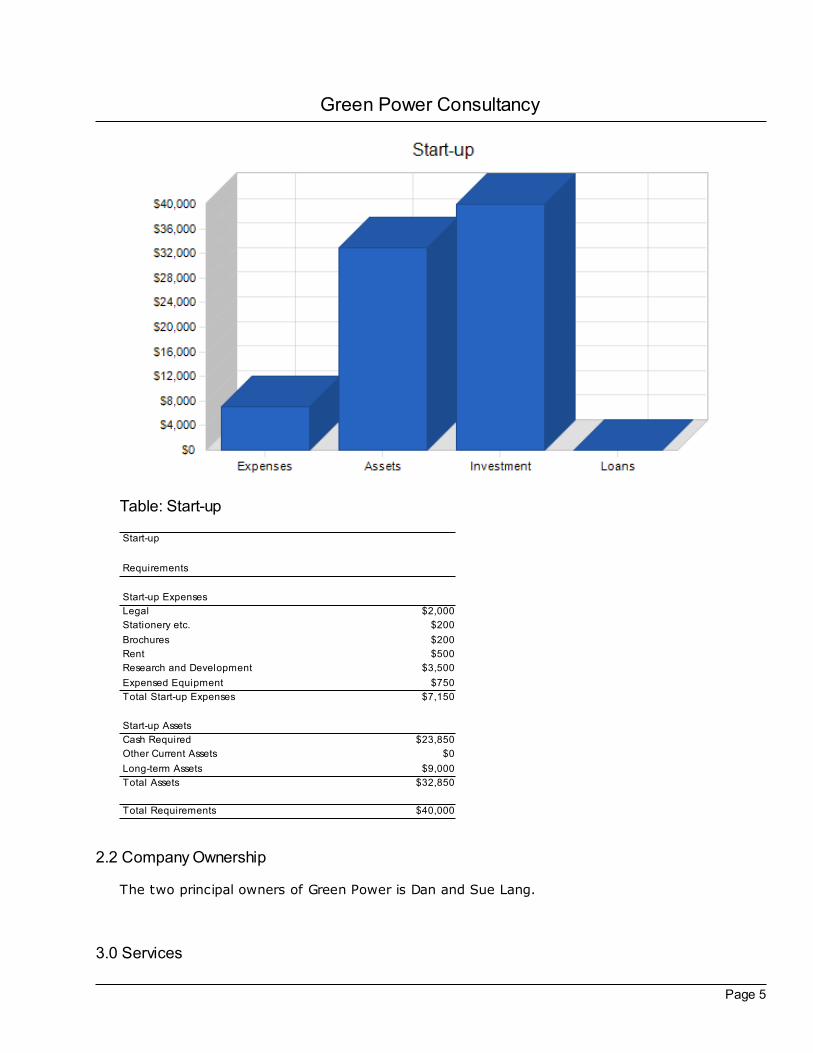
Table: Start-up
Start-up
Requirements
Start-up Expenses
Legal $2,000
Stationery etc. $200
Brochures $200
Rent $500
Research and Development $3,500
Expensed Equipment $750
Total Start-up Expenses $7,150
Start-up Assets
Cash Required $23,850
Other Current Assets $0
Long-term Assets $9,000
Total Assets $32,850
Total Requirements $40,000
2.2 Company Ownership
The two principal owners of Green Power is Dan and Sue Lang.
3.0 Services
Green Power Consultancy
Page 6
Green Power offers a wide range of environmentally-conscious energy solutions related to newand existing structures. The main areas of consulting that Green Power will offer are:
· Passive heating: This applies to the construction of the new structures, designing thestructure to capture and utilize heat that is either generated naturally or as a by-productof the building. Examples of passive heating include specific placement of the heatingvents, the design and placement of the building and the windows.
· Grey water: This is the capture and utilization of grey water. Grey water is water thathas been used for some other source such as in the faucets or rain water that can nolonger be offered as potable, but still can be used for toilet flushing or land irrigation.
· Renewable energy: This service offers customers the information needed to makeintelligent decisions regarding the use of renewable energy sources. Renewable energysources can be defined as sources of energy where the rate of energy depletion is notfaster than the production rate. Examples include: wind power, photovoltaics, hydropower, biomass, solar energy.
· Employee transportation: This service is to reduce the energy consumed by employeestraveling to work. Typical aspects of the plan are outlining public transportationoptions, developing a company subsidized public/alternative transportation voucher,building covered bicycle lockers and shower facilities as well as other activities designedto increase the number of employees using bicycles as their main source of transportationto work.
· Efficient building construction: This focuses on the use of local building materialsthereby decreasing energy needed for transportation as well as the utilization of recycledmaterials for construction decreasing energy demands for the manufacture of newbuilding materials.
4.0 Market Analysis Summary
Green Power has segmented the market into two distinct target market groups. The first group isarchitects who are building a structure either speculatively (infrequently) or for a client(generally). The second customer group is individual customers who desire environmentalelements designed into their building. The niche that Green Power has chosen to participate inis a fairly new field. Green Power faces competition from eco-architects as well as from thelocal utilities that may have a small department that offers green energy consultation advice.The industry often operates to satisfy clients; it is the end customer that typically requestsgreen energy designs and they either seek out a specific architect or they request theirarchitect to receive guidance from firms such as Green Power.
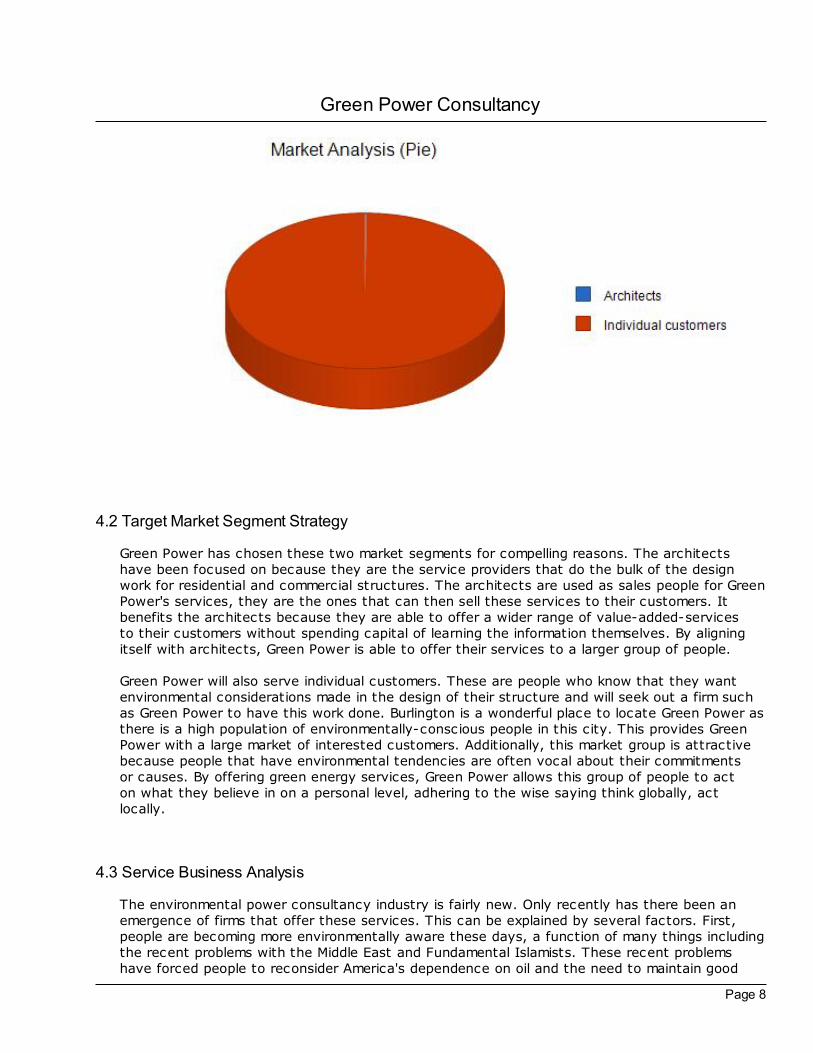
4.1 Market Segmentation
Green Power has segmented its target market into two different customer groups, both equallyattractive.
Architects
This customer group is made up of professional architects that design buildings and additionsfor clients. Architects have developed a strategic relationship with Green Power to offer value-added-services for their clients.
· The architect firms typically have two - nine partners.
Green Power Consultancy
Page 7
· Offer both residential and commercial design work, however 67% of their work iscommercial.
· The firms typically have only a handful of service providers that they work with. Thismeans that once they find someone they trust, they develop a long-term relationshipwith that service provider.
· Yearly revenue ranges from $200 thousand - $5 million.
Individual customers
This segment contains consumers who are either having a residential home, or a commercialstructure, designed. Due to their personal environmental concerns and a recognition thatit can be cost effective to have building decisions with environmental considerations, theyhave requested Green Power's assistance. They are generally working directly with GreenPower for their design needs and will likely then take this design criteria to their builder.
· The individual is an environmentalist and they take into account how their action willimpact the environment.
· The age range of clients is 35-49.· Average household income is $65,000. Please note that while the overriding concern in
using Green Power's services is the positive impact on the environment, a cost benefitanalysis indicates that in the long term it is cost effective to adopt green energyconsiderations.
· 89% of the group have at least an undergraduate degree, 26% have a graduate degree.
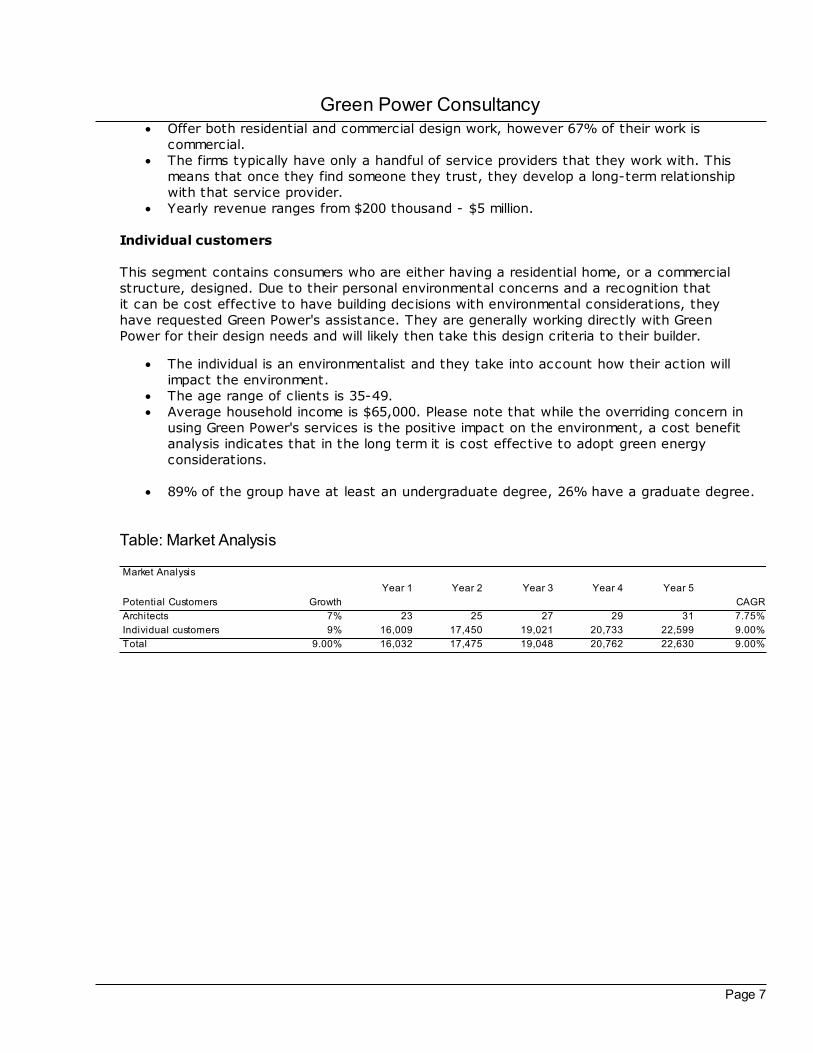
Table: Market Analysis
Market Analysis
Year 1 Year 2 Year 3 Year 4 Year 5
Potential Customers Growth CAGR
Architects 7% 23 25 27 29 31 7.75%
Individual customers 9% 16,009 17,450 19,021 20,733 22,599 9.00%
Total 9.00% 16,032 17,475 19,048 20,762 22,630 9.00%
Green Power Consultancy
Page 8
4.2 Target Market Segment Strategy
Green Power has chosen these two market segments for compelling reasons. The architectshave been focused on because they are the service providers that do the bulk of the designwork for residential and commercial structures. The architects are used as sales people for GreenPower's services, they are the ones that can then sell these services to their customers. Itbenefits the architects because they are able to offer a wider range of value-added-servicesto their customers without spending capital of learning the information themselves. By aligningitself with architects, Green Power is able to offer their services to a larger group of people.
Green Power will also serve individual customers. These are people who know that they wantenvironmental considerations made in the design of their structure and will seek out a firm suchas Green Power to have this work done. Burlington is a wonderful place to locate Green Power asthere is a high population of environmentally-conscious people in this city. This provides GreenPower with a large market of interested customers. Additionally, this market group is attractivebecause people that have environmental tendencies are often vocal about their commitmentsor causes. By offering green energy services, Green Power allows this group of people to acton what they believe in on a personal level, adhering to the wise saying think globally, actlocally.
4.3 Service Business Analysis
The environmental power consultancy industry is fairly new. Only recently has there been anemergence of firms that offer these services. This can be explained by several factors. First,people are becoming more environmentally aware these days, a function of many things includingthe recent problems with the Middle East and Fundamental Islamists. These recent problemshave forced people to reconsider America's dependence on oil and the need to maintain good
Green Power Consultancy
Page 9
relationships with Saudi Arabia only because of their oil. Another factor that has contributed tothe growth of green power is that it has become increasingly cost effective to make businessdecisions while taking into account the decisions impact on the environment. For years anenvironmental decision was based on personal consciousness and ethics, not overriding economicfactors. Now money can be saved when environmental impacts are taken into account. Pleaseread the following section which will indicate the different players within the industry.
4.3.1 Competition and Buying Patterns
The competition generally takes two different forms:
Eco-architectsThese are architects that specialize in environmental design considerations. Typically their entirepractice is based around structures that have environmental elements. Green Power couldactually be within this industry niche, however they are able to serve a larger customer baser,therefore earn more revenue as well as make a positive impact in our world by offering itsservices to both end consumers as well as regular architects as opposed to the business modelof only serving one set of customers.
Local utilityThe local utilities often have a department that offers free consultation for environmentaldesign considerations. There are incentives for the utilities to attempt to curb their customer'suse of their energy. These incentives take the form of not needing to make as many capitalexpenditures to develop the power delivery infrastructure to accommodate the increased load forenergy demands. Therefore, the more the utility is able to get their customers to conserve, theless money they have to spend on infrastructure improvements, the more money they earn. Thatbeing said, the utility often has a small department that offers tips on energy conservation.While these tips can be quite helpful, since they are offered for free for the power customers,they are not nearly as comprehensive as they could be. So while they provide good initial tips,the local utility is not a strong competitor to serve a client who is committed to making asmuch of a positive environmental difference as can be achieved by using a specialized firm.
The buying pattern for consumers is currently being defined as we speak, a function of hownew the industry is. Currently, purchasing decisions are based on customers typically makingrequests for these services from their architect or they do a bit of research to determine whooffers these services. As the industry becomes more mature, firms will become moreestablished and reputation and visibility/awareness will shape buying decisions. Since there isa wide range of options regarding implementation, price is less of a consideration for the decisionsince most of the service providers can offer a wide range of inexpensive to expensive options.
5.0 Strategy and Implementation Summary
Green Power's business strategy recognizes and will leverage the fact that a lot of businesswill be transacted through networking and word-of-mouth referrals. With this in mind, GreenPower will work diligently to build alliances with architects who can co-brand their serviceswith Green Power thereby increasing Green Power's potential qualified customers.
Green Power will rely on its competitive edge of adopting a cost effective environmentalsolution so in addition to meeting environmental concerns of the customer, Green Power'sservices will save the customer money over time.The marketing strategy will highlight both
Green Power Consultancy
Page 10
environmental attributes as well as economic ones.The marketing campaign will recognize theexistence of two distinct market customers. Lastly, the sales strategy will offer a compellingeconomic analysis of how the customer can save money by adopting Green Power's designs.
5.1 Competitive Edge
Green Power will use its competitive edge of economic justification to turn potential customersinto qualified sales customers. While some of the other similar companies often highlight thepositive environmental impact that their designs offer, Green Power will also offer economicjustifications for their designs. This is an important competitive edge as it provides evidence thatthe customer can save money in the long term and make a positive impact on theenvironment. Providing a cost benefit analysis for the green design is important because it makesthe potential market larger, moving from people that want to do good for the environment topeople that also want to save money. By offering an environmental solution that saves theperson or business money creates a compelling reason to adopt the suggestions. There are toofew people that will act only for environmental reasons, but when you save people money,there are far more people interested.
5.2 Marketing Strategy
The marketing strategy is based on developing an awareness regarding Green Power's services toboth architects and the end use consumers. Green Power will strongly use networking as ameans to develop relationships with many of the city's architects. Although Burlington is areasonably-sized city, the architect community is fairly close knit. If one wanted, it is easy todevelop active relationships with many of the different architects in Burlington. By developingthese relationships, Green Power will allow the firms to become familiar with not only the servicesoffered by Green Power, but also the personalities involved, recognizing that much of businessis transacted by who you know. Advertisements will be placed in the local architect newsletter.
To reach the end user customers, Green Power will use Advertisements in the local paper as wellas within the yellow pages. As a means of increasing visibility of Green Power, GP willparticipate in several community-based seminars that serve as a free source of information forthe citizens of Burlington. Green Power believes that participating in the seminars will be aneffective way of meeting many of the potential customers and allowing them to becomefamiliar with Green Power expertise.
5.3 Sales Strategy
The sales strategy implicitly and explicitly takes into account the philosophy that the reasonthat many of the people are attracted to Green Power is because of its personal environmentalethics. The sales strategy will leverage this desire with the fact that environmental decisionscan have positive economic impacts in the long term. Therefore the sales strategy will leveragethe competitive edge of economic justification as the method for turning sales leads intocustomers. For this strategy to be effective, Green Power will present customers case studiesand quantifiable data proving economic justification.
Green Power Consultancy
Page 11
5.3.1 Sales Forecast
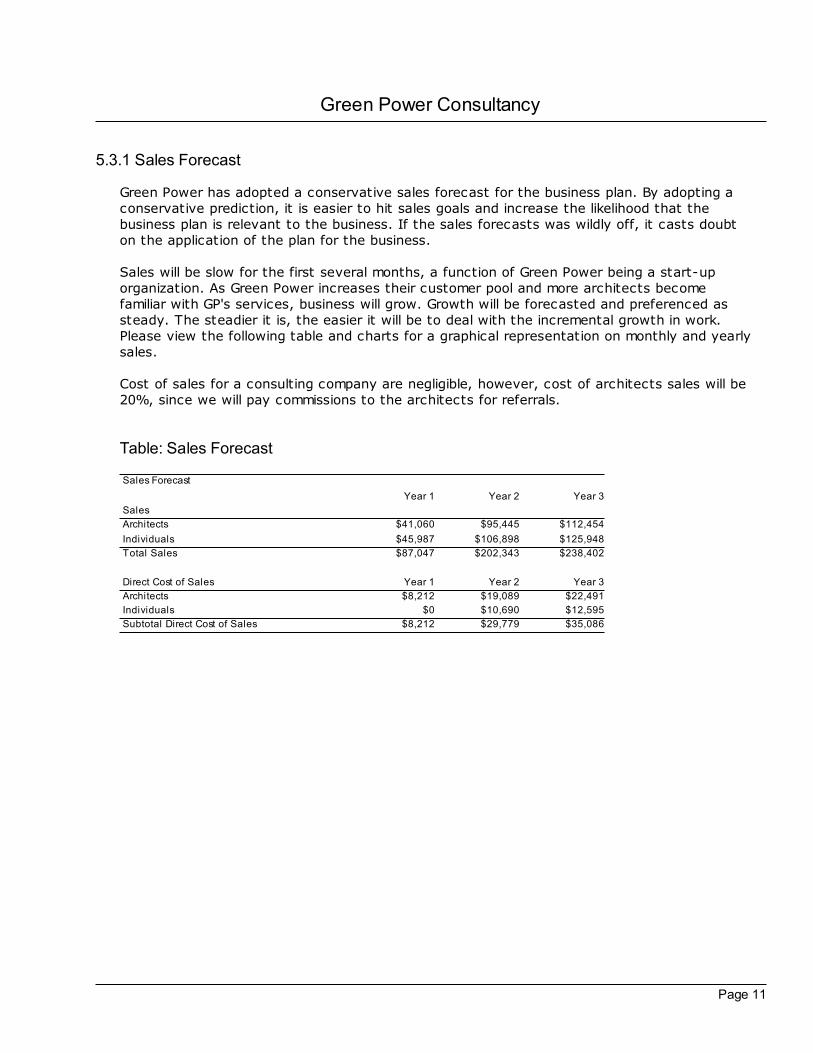
Green Power has adopted a conservative sales forecast for the business plan. By adopting aconservative prediction, it is easier to hit sales goals and increase the likelihood that thebusiness plan is relevant to the business. If the sales forecasts was wildly off, it casts doubton the application of the plan for the business.
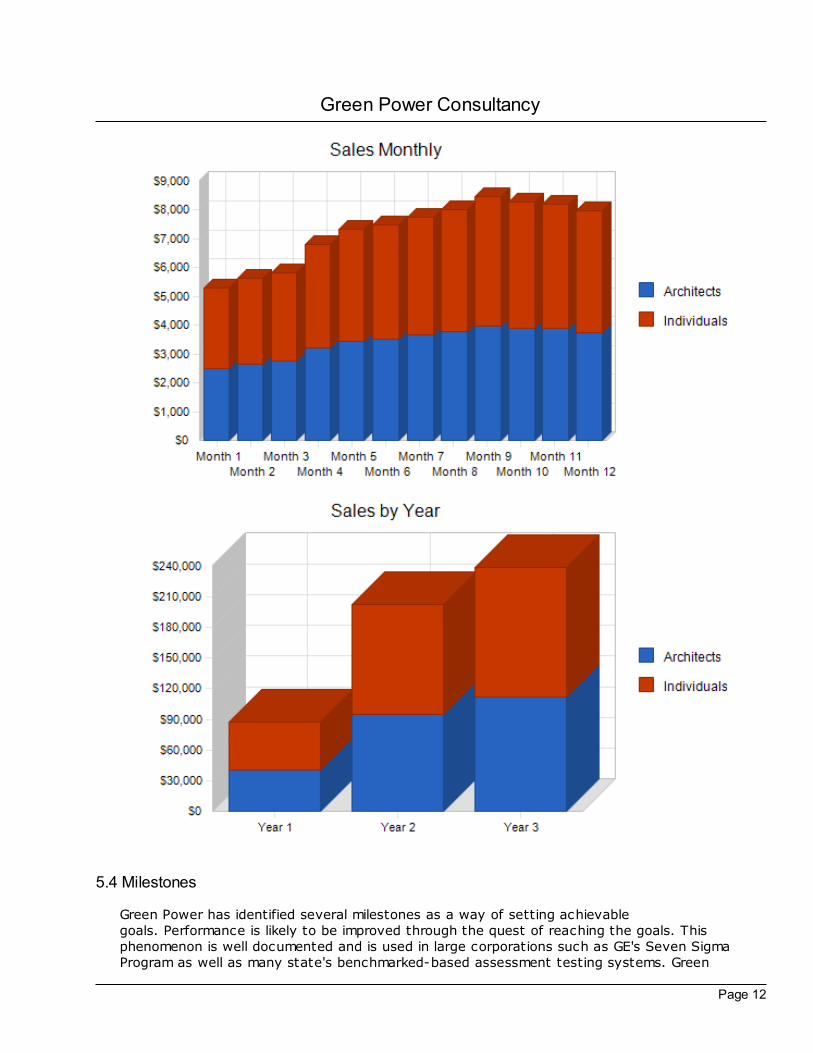
Sales will be slow for the first several months, a function of Green Power being a start-uporganization. As Green Power increases their customer pool and more architects becomefamiliar with GP's services, business will grow. Growth will be forecasted and preferenced assteady. The steadier it is, the easier it will be to deal with the incremental growth in work.Please view the following table and charts for a graphical representation on monthly and yearlysales.
Cost of sales for a consulting company are negligible, however, cost of architects sales will be20%, since we will pay commissions to the architects for referrals.
Table: Sales Forecast
Sales Forecast
Year 1 Year 2 Year 3
Sales
Architects $41,060 $95,445 $112,454
Individuals $45,987 $106,898 $125,948
Total Sales $87,047 $202,343 $238,402
Direct Cost of Sales Year 1 Year 2 Year 3
Architects $8,212 $19,089 $22,491
Individuals $0 $10,690 $12,595
Subtotal Direct Cost of Sales $8,212 $29,779 $35,086
Green Power Consultancy
Page 12
5.4 Milestones
Green Power has identified several milestones as a way of setting achievablegoals. Performance is likely to be improved through the quest of reaching the goals. Thisphenomenon is well documented and is used in large corporations such as GE's Seven SigmaProgram as well as many state's benchmarked-based assessment testing systems. Green
Green Power Consultancy
Page 13
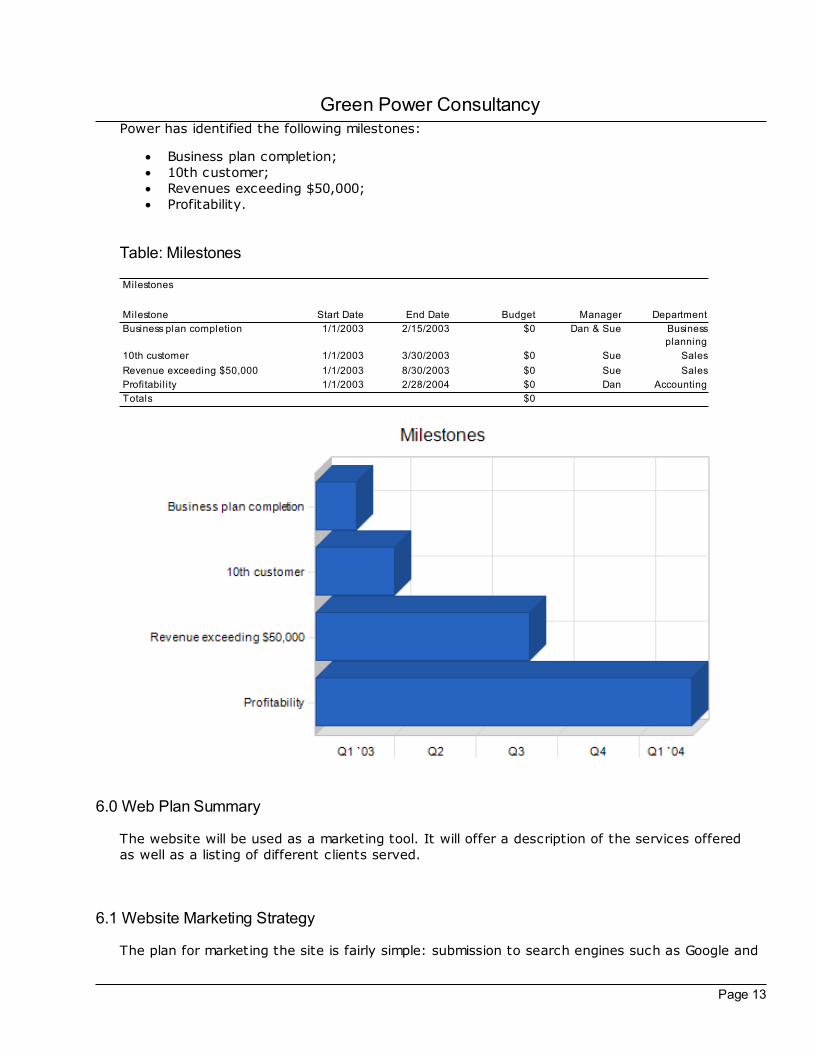
Power has identified the following milestones:
· Business plan completion;· 10th customer;· Revenues exceeding $50,000;· Profitability.
Table: Milestones
Milestones
Milestone Start Date End Date Budget Manager Department
Business plan completion 1/1/2003 2/15/2003 $0 Dan & Sue Business
planning
10th customer 1/1/2003 3/30/2003 $0 Sue Sales
Revenue exceeding $50,000 1/1/2003 8/30/2003 $0 Sue Sales
Profitabil ity 1/1/2003 2/28/2004 $0 Dan Accounting
Totals $0
6.0 Web Plan Summary
The website will be used as a marketing tool. It will offer a description of the services offeredas well as a listing of different clients served.
6.1 Website Marketing Strategy
The plan for marketing the site is fairly simple: submission to search engines such as Google and
Green Power Consultancy
Page 14
listing the website on all of the company's correspondence and printed marketing/sales media.
6.2 Development Requirements
Green Power will utilize a local programmer to build the site.
7.0 Management Summary
The company will be lead by the husband and wife team of Dan and Sue Lang. Dan grew up inOregon and attended the University of Oregon for his undergraduate education. Dan's majorwas environmental studies and business. After graduation Dan worked for a year at anenvironmental testing company. Through general networking, Dan was introduced to one of thethree principals of a company called The Seal Company. The business model for this companywas to make assessments for private and public companies as to their environmentalimpact. His position with The Seal Company provided him with wonderful insight into theindustry of environmental assessment and helped provide him with a foundation of knowledgeregarding green energy, just one of the areas of assessment. After a year of this Dan enrolledinto the University of Oregon's Master's Architect program, taking course work in environmentaldesign. This degree would provide Dan with the skills to make a larger impact in his community.
Sue went to the University of Burlington for undergrad and then moved out to Oregon toattend Willamette University's MBA program. After her degree Sue moved up to Portland andworked for the Bonneville Power Administration where she worked in their renewable resourcedivision. Much of her projects were marketing based, trying to gain public acceptance ofrenewable energy sources.
Green Power Consultancy
Page 15
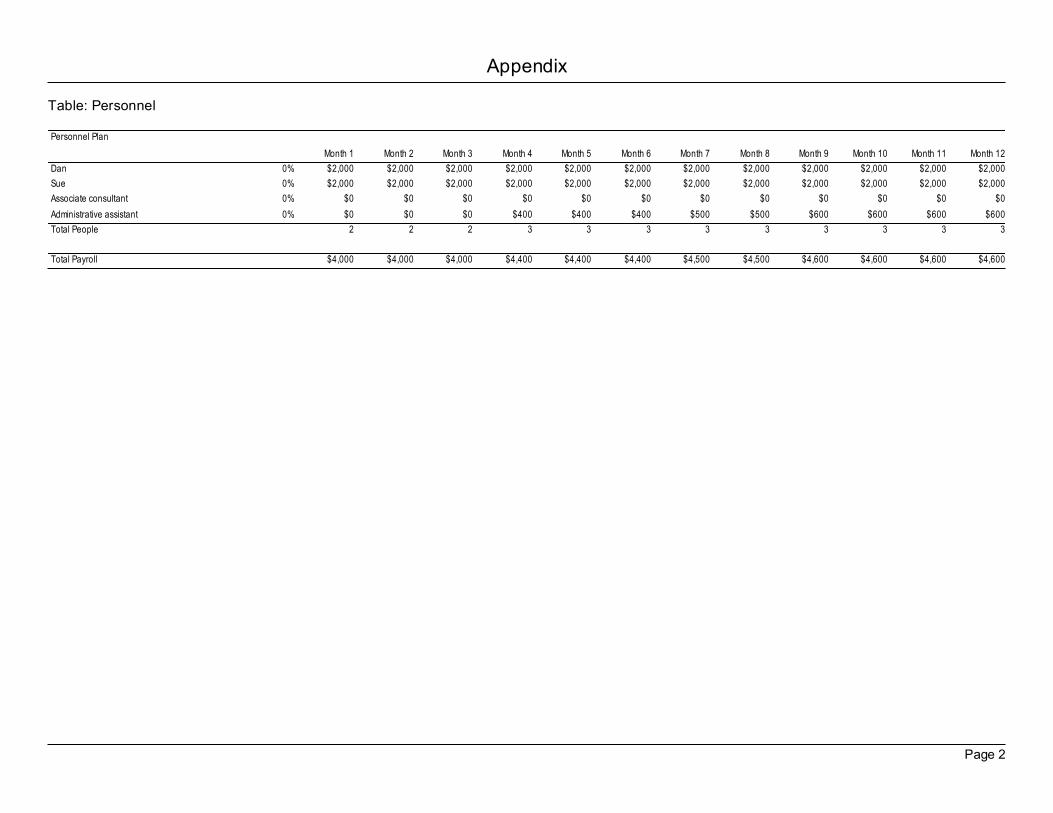
7.1 Personnel Plan
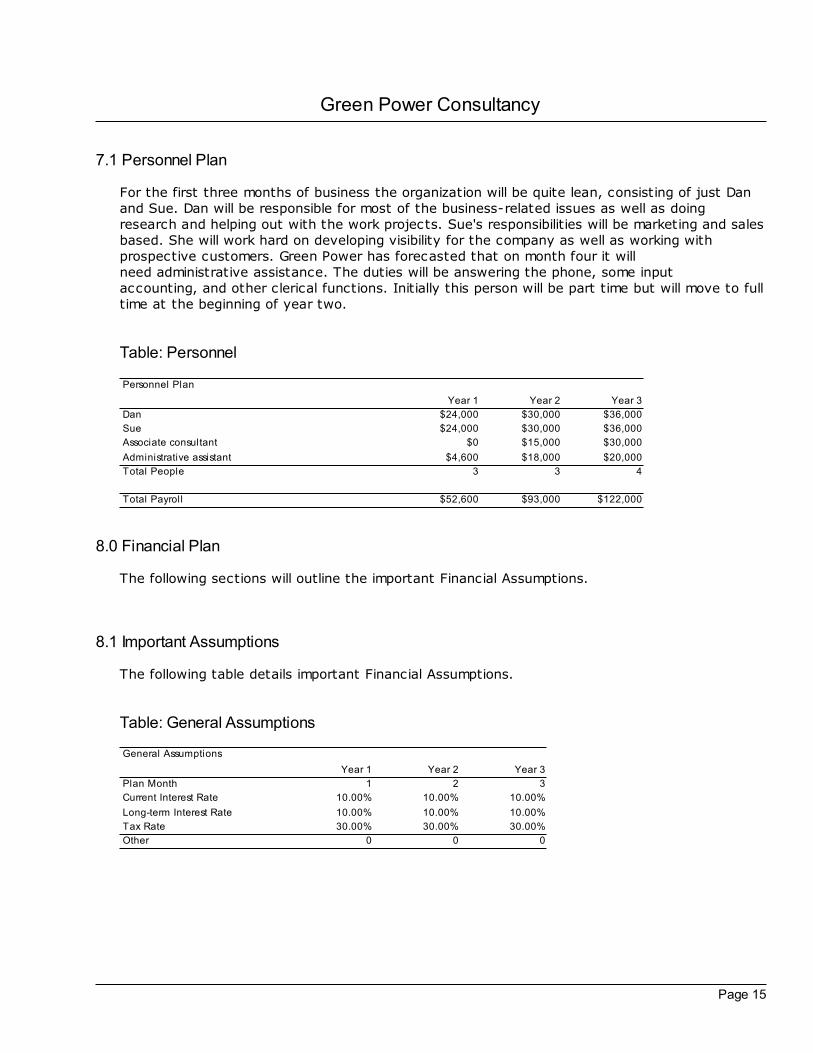
For the first three months of business the organization will be quite lean, consisting of just Danand Sue. Dan will be responsible for most of the business-related issues as well as doingresearch and helping out with the work projects. Sue's responsibilities will be marketing and salesbased. She will work hard on developing visibility for the company as well as working withprospective customers. Green Power has forecasted that on month four it willneed administrative assistance. The duties will be answering the phone, some inputaccounting, and other clerical functions. Initially this person will be part time but will move to fulltime at the beginning of year two.
Table: Personnel
Personnel Plan
Year 1 Year 2 Year 3
Dan $24,000 $30,000 $36,000
Sue $24,000 $30,000 $36,000
Associate consultant $0 $15,000 $30,000
Administrative assistant $4,600 $18,000 $20,000
Total People 3 3 4
Total Payroll $52,600 $93,000 $122,000
8.0 Financial Plan
The following sections will outline the important Financial Assumptions.
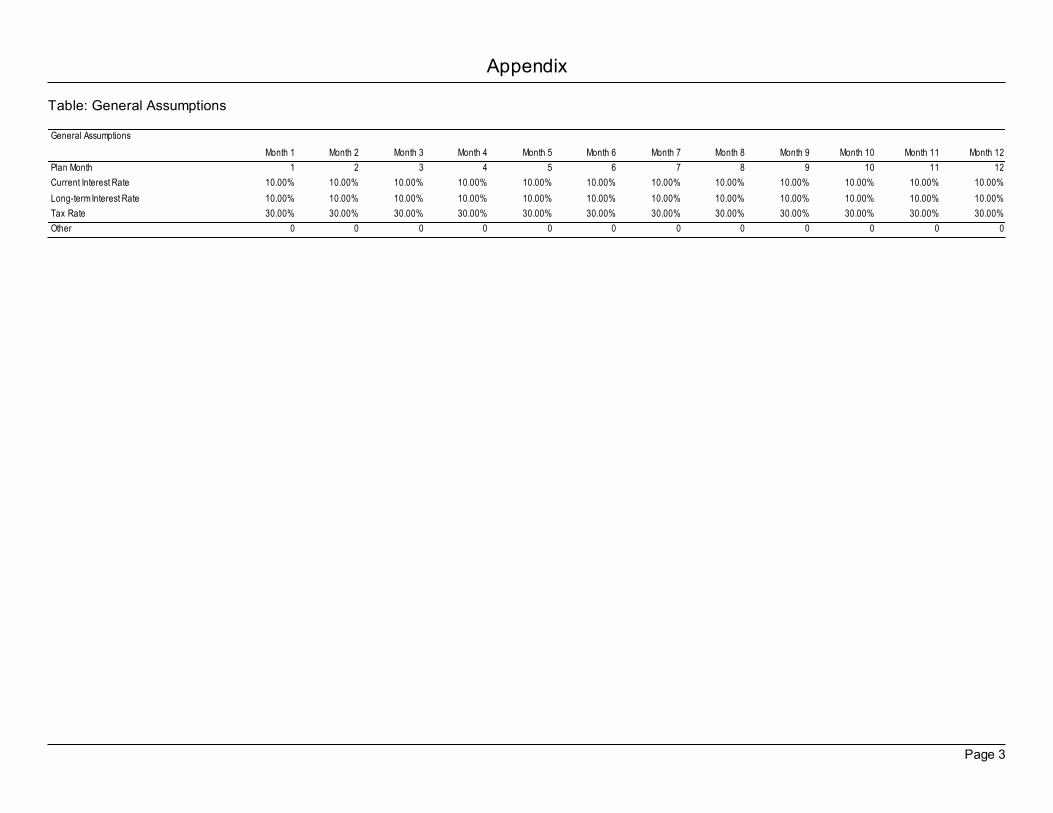
8.1 Important Assumptions
The following table details important Financial Assumptions.
Table: General Assumptions
General Assumptions
Year 1 Year 2 Year 3
Plan Month 1 2 3
Current Interest Rate 10.00% 10.00% 10.00%
Long-term Interest Rate 10.00% 10.00% 10.00%
Tax Rate 30.00% 30.00% 30.00%
Other 0 0 0
Green Power Consultancy
Page 16
8.2 Break-even Analysis
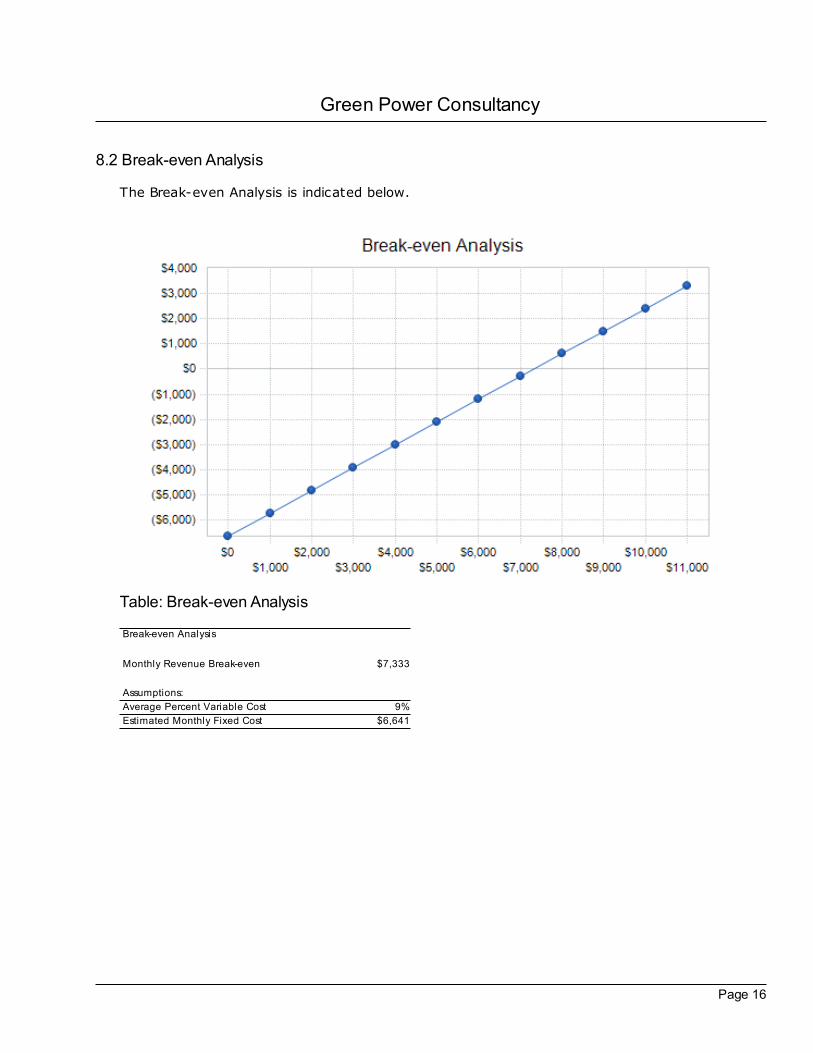
The Break-even Analysis is indicated below.
Table: Break-even Analysis
Break-even Analysis
Monthly Revenue Break-even $7,333
Assumptions:
Average Percent Variable Cost 9%
Estimated Monthly Fixed Cost $6,641
Green Power Consultancy
Page 17
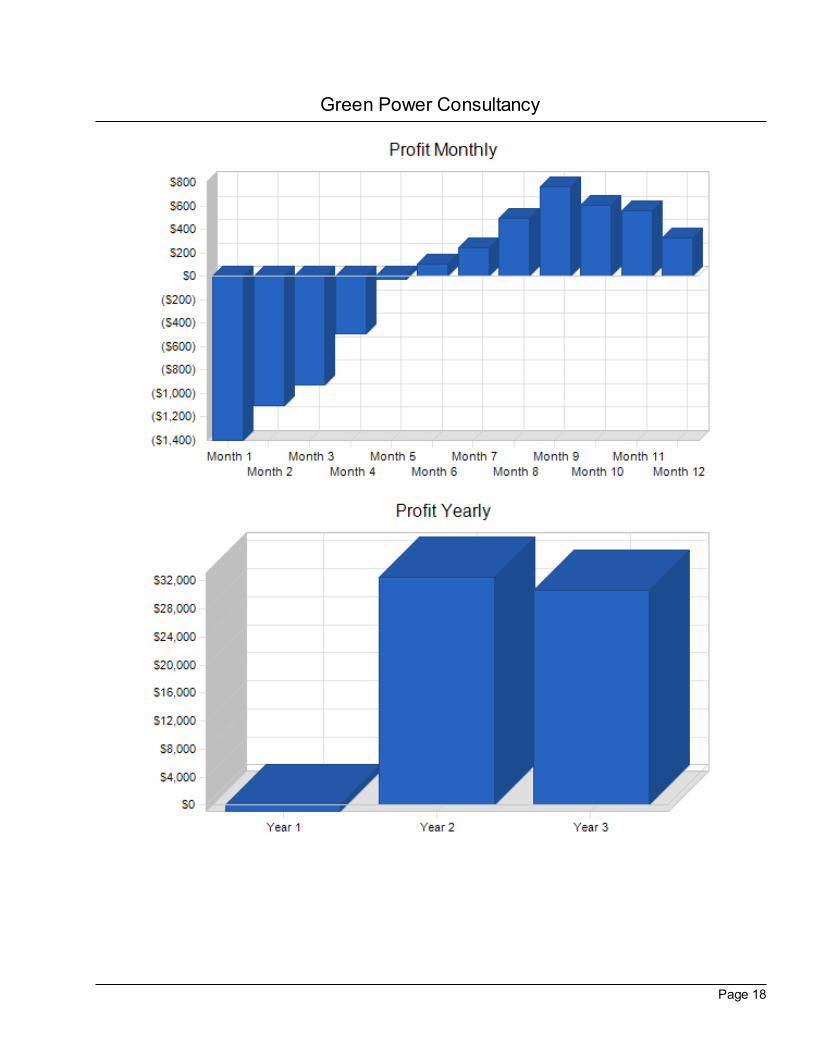
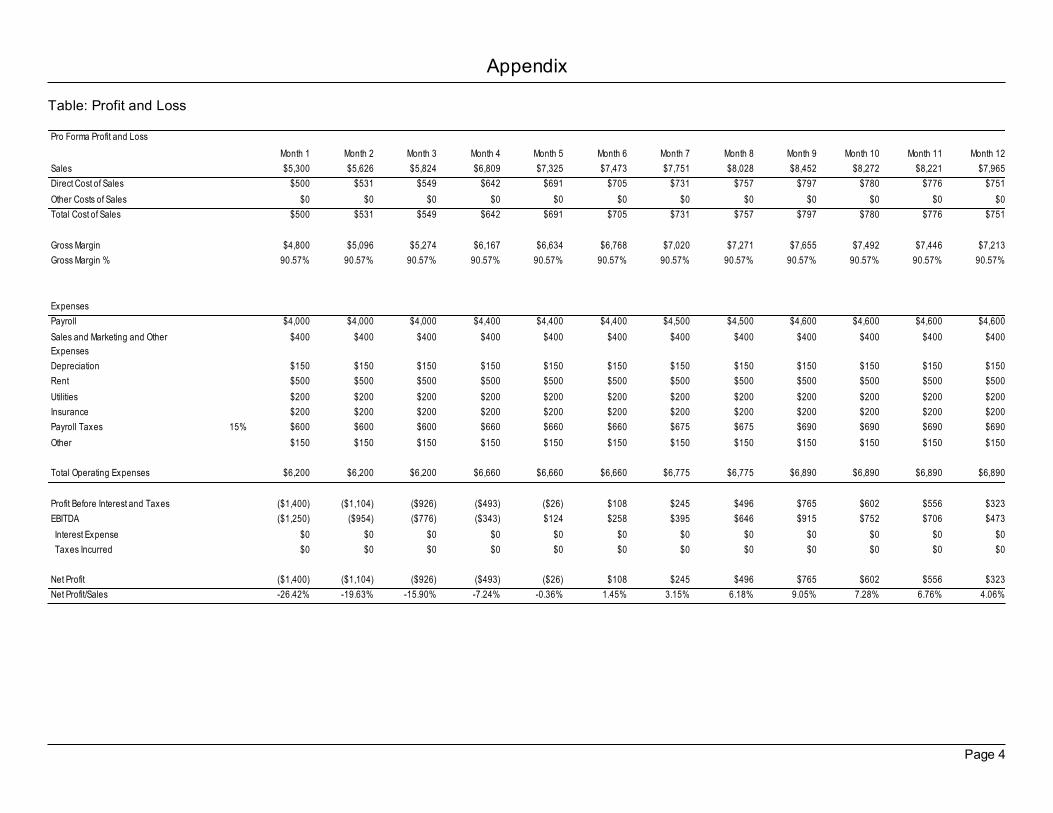
8.3 Projected Profit and Loss
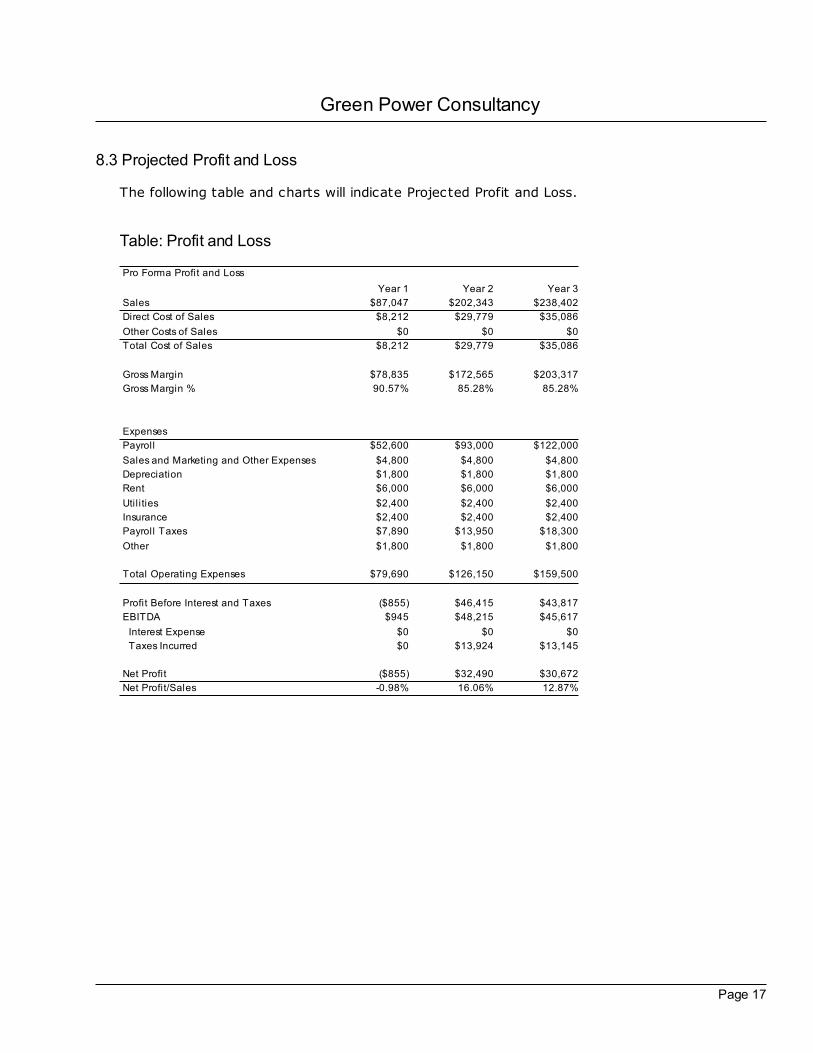
The following table and charts will indicate Projected Profit and Loss.
Table: Profit and Loss
Pro Forma Profit and Loss
Year 1 Year 2 Year 3
Sales $87,047 $202,343 $238,402
Direct Cost of Sales $8,212 $29,779 $35,086
Other Costs of Sales $0 $0 $0
Total Cost of Sales $8,212 $29,779 $35,086
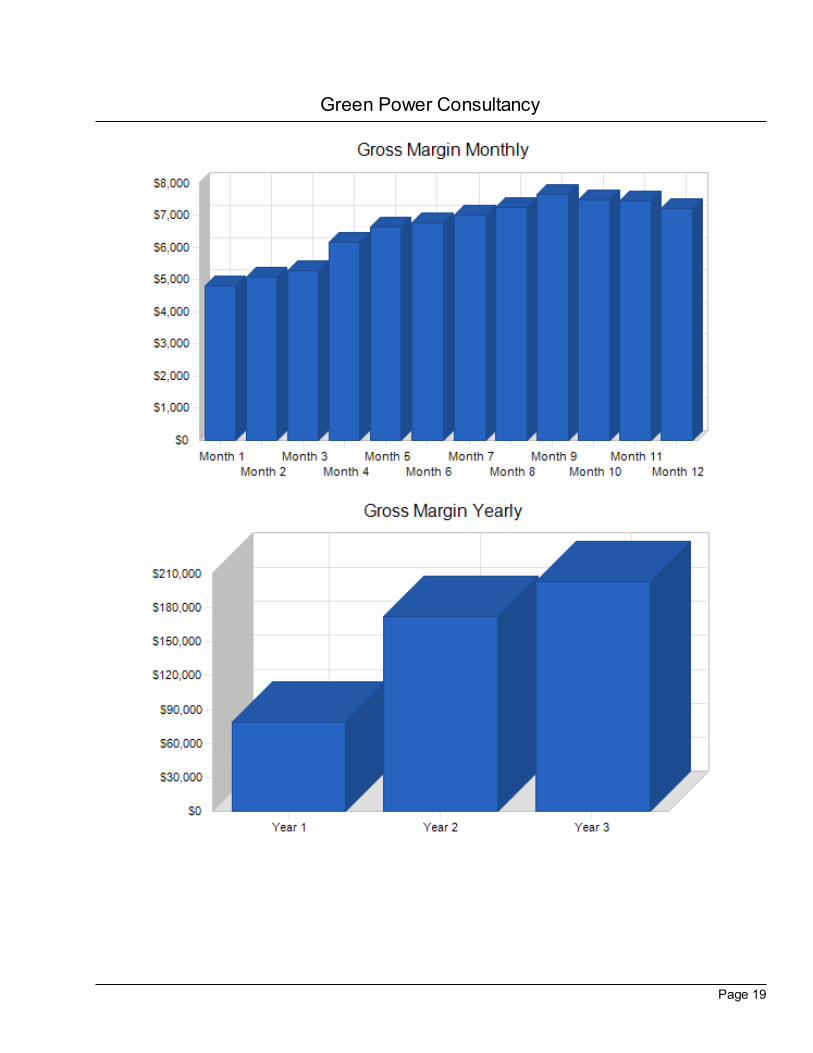
Gross Margin $78,835 $172,565 $203,317
Gross Margin % 90.57% 85.28% 85.28%
Expenses
Payroll $52,600 $93,000 $122,000
Sales and Marketing and Other Expenses $4,800 $4,800 $4,800
Depreciation $1,800 $1,800 $1,800
Rent $6,000 $6,000 $6,000
Util ities $2,400 $2,400 $2,400
Insurance $2,400 $2,400 $2,400
Payroll Taxes $7,890 $13,950 $18,300
Other $1,800 $1,800 $1,800
Total Operating Expenses $79,690 $126,150 $159,500
Profit Before Interest and Taxes ($855) $46,415 $43,817
EBITDA $945 $48,215 $45,617
Interest Expense $0 $0 $0
Taxes Incurred $0 $13,924 $13,145
Net Profit ($855) $32,490 $30,672
Net Profit/Sales -0.98% 16.06% 12.87%
Green Power Consultancy
Page 18
Green Power Consultancy
Page 19
Green Power Consultancy
Page 20
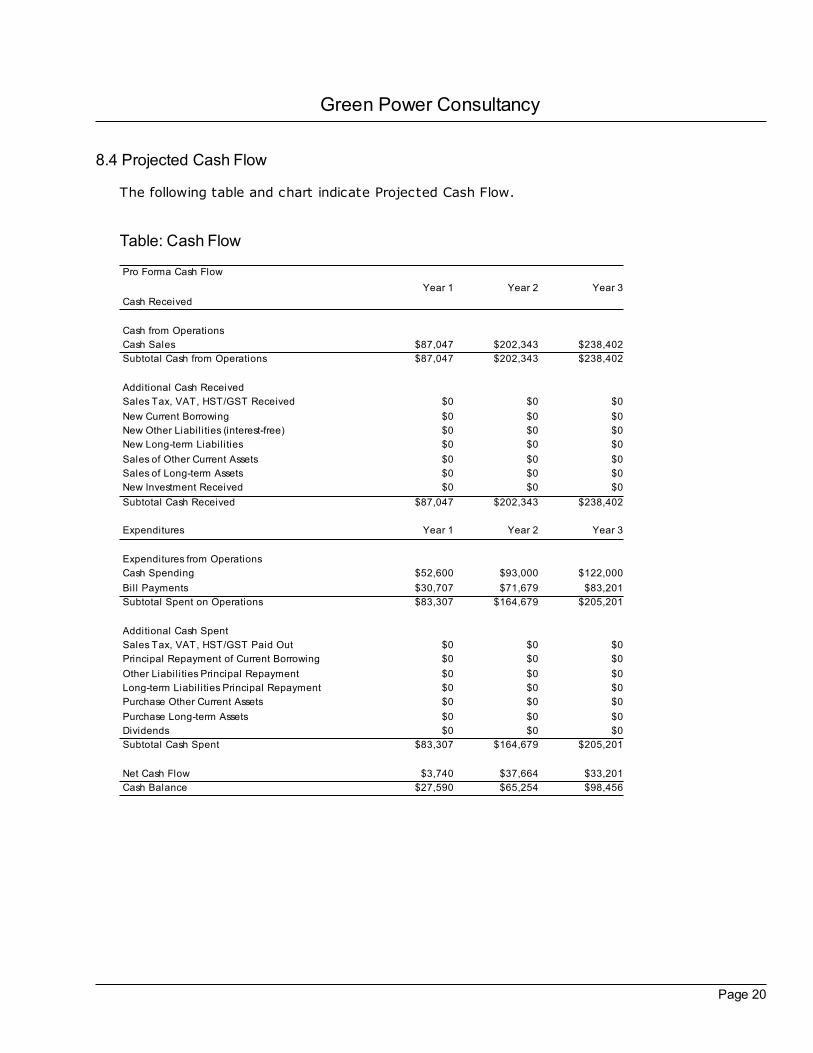
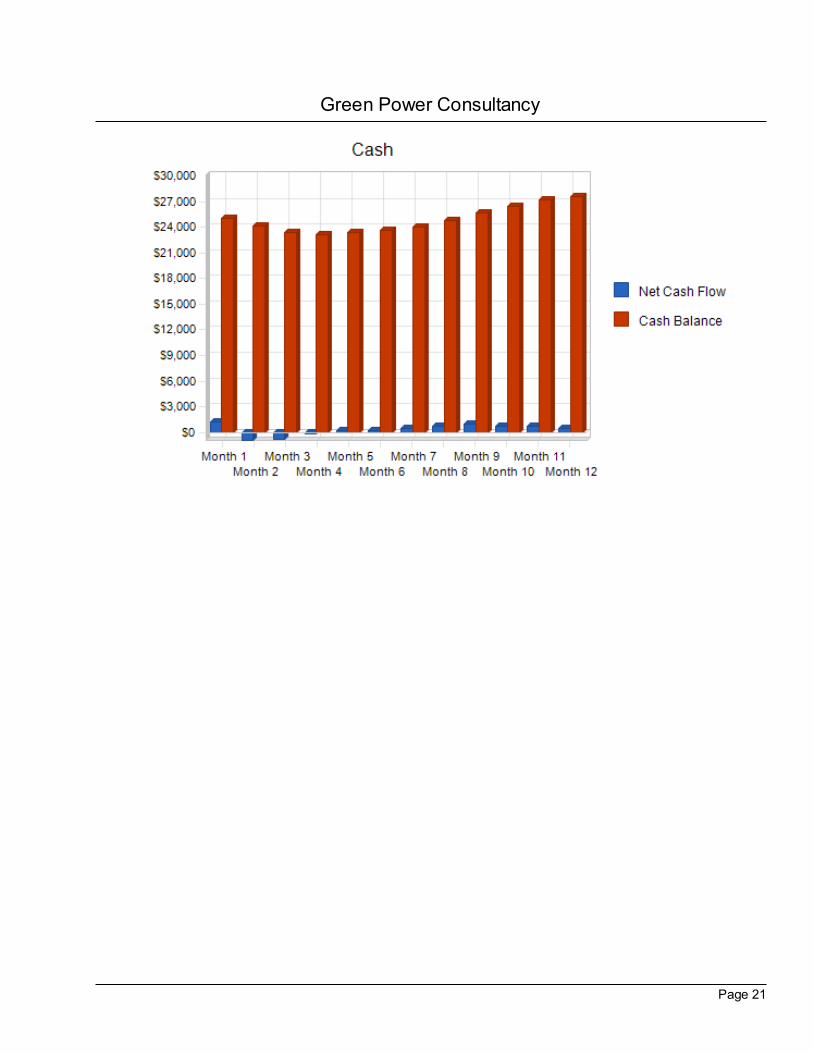
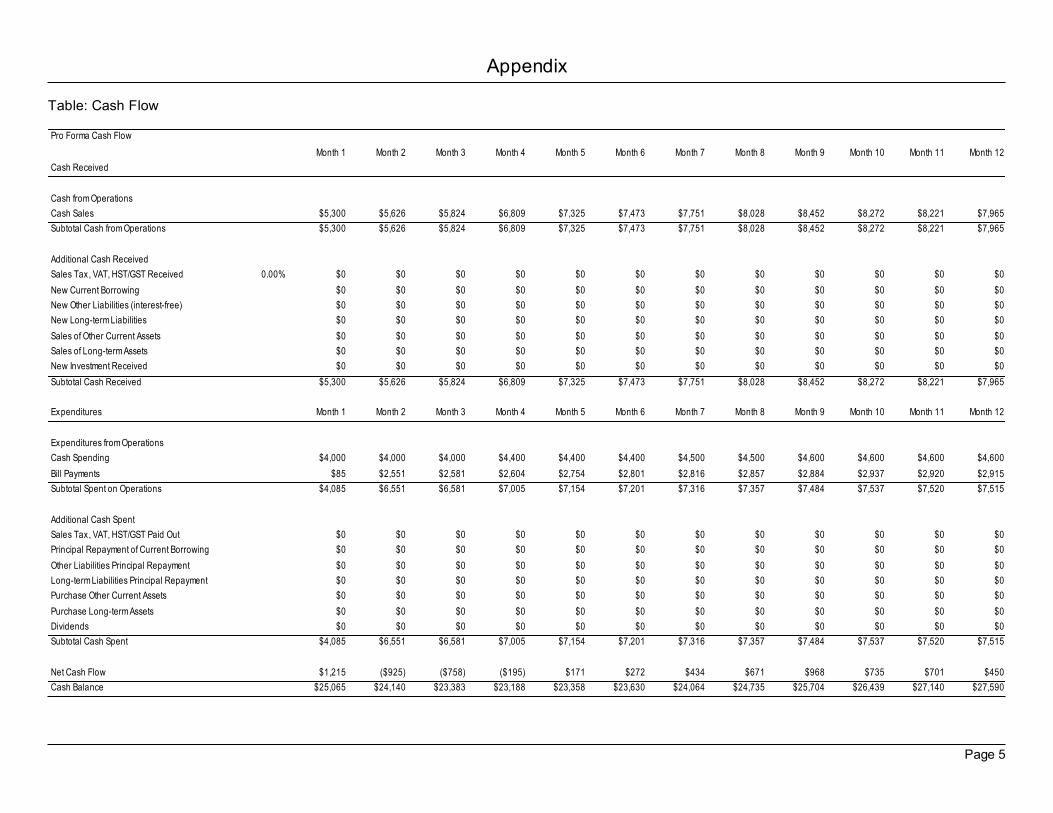
8.4 Projected Cash Flow
The following table and chart indicate Projected Cash Flow.
Table: Cash Flow
Pro Forma Cash Flow
Year 1 Year 2 Year 3
Cash Received
Cash from Operations
Cash Sales $87,047 $202,343 $238,402
Subtotal Cash from Operations $87,047 $202,343 $238,402
Additional Cash Received
Sales Tax, VAT, HST/GST Received $0 $0 $0
New Current Borrowing $0 $0 $0
New Other Liabil ities (interest-free) $0 $0 $0
New Long-term Liabil ities $0 $0 $0
Sales of Other Current Assets $0 $0 $0
Sales of Long-term Assets $0 $0 $0
New Investment Received $0 $0 $0
Subtotal Cash Received $87,047 $202,343 $238,402
Expenditures Year 1 Year 2 Year 3
Expenditures from Operations
Cash Spending $52,600 $93,000 $122,000
Bill Payments $30,707 $71,679 $83,201
Subtotal Spent on Operations $83,307 $164,679 $205,201
Additional Cash Spent
Sales Tax, VAT, HST/GST Paid Out $0 $0 $0
Principal Repayment of Current Borrowing $0 $0 $0
Other Liabilities Principal Repayment $0 $0 $0
Long-term Liabil ities Principal Repayment $0 $0 $0
Purchase Other Current Assets $0 $0 $0
Purchase Long-term Assets $0 $0 $0
Dividends $0 $0 $0
Subtotal Cash Spent $83,307 $164,679 $205,201
Net Cash Flow $3,740 $37,664 $33,201
Cash Balance $27,590 $65,254 $98,456
Green Power Consultancy
Page 21
Green Power Consultancy
Page 22
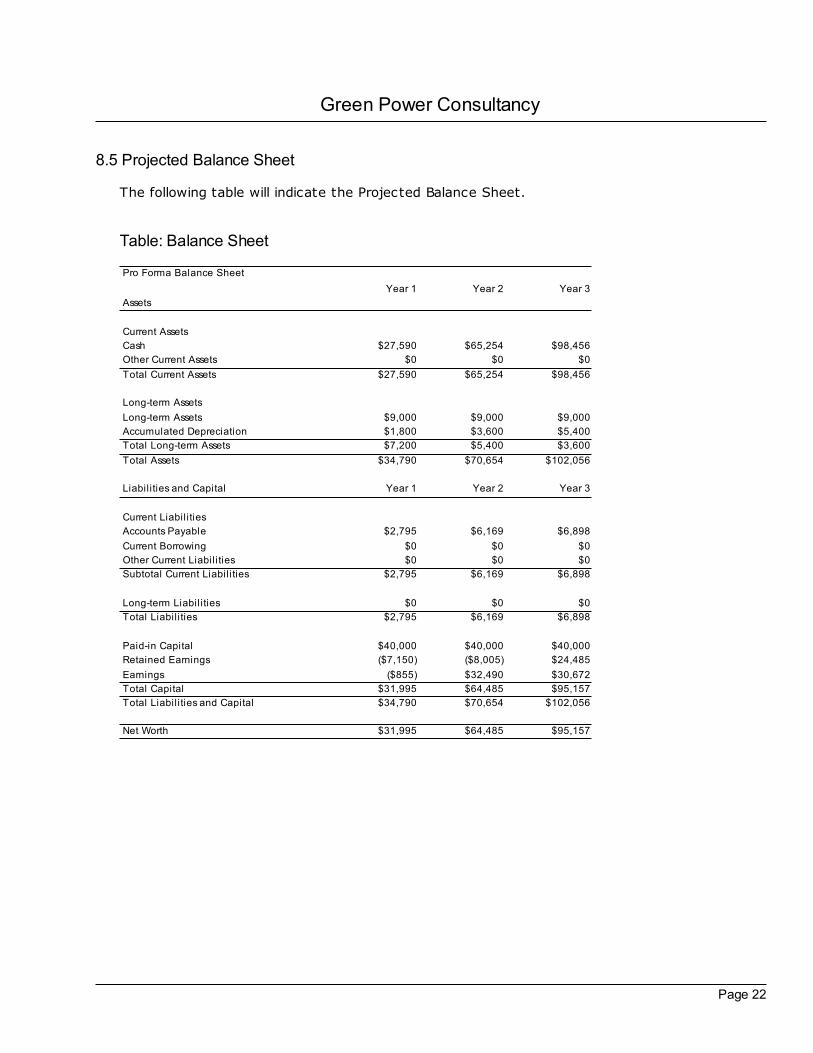
8.5 Projected Balance Sheet
The following table will indicate the Projected Balance Sheet.
Table: Balance Sheet
Pro Forma Balance Sheet
Year 1 Year 2 Year 3
Assets
Current Assets
Cash $27,590 $65,254 $98,456
Other Current Assets $0 $0 $0
Total Current Assets $27,590 $65,254 $98,456
Long-term Assets
Long-term Assets $9,000 $9,000 $9,000
Accumulated Depreciation $1,800 $3,600 $5,400
Total Long-term Assets $7,200 $5,400 $3,600
Total Assets $34,790 $70,654 $102,056
Liabilities and Capital Year 1 Year 2 Year 3
Current Liabil ities
Accounts Payable $2,795 $6,169 $6,898
Current Borrowing $0 $0 $0
Other Current Liabil ities $0 $0 $0
Subtotal Current Liabil ities $2,795 $6,169 $6,898
Long-term Liabil ities $0 $0 $0
Total Liabil ities $2,795 $6,169 $6,898
Paid-in Capital $40,000 $40,000 $40,000
Retained Earnings ($7,150) ($8,005) $24,485
Earnings ($855) $32,490 $30,672
Total Capital $31,995 $64,485 $95,157
Total Liabil ities and Capital $34,790 $70,654 $102,056
Net Worth $31,995 $64,485 $95,157
Green Power Consultancy
Page 23
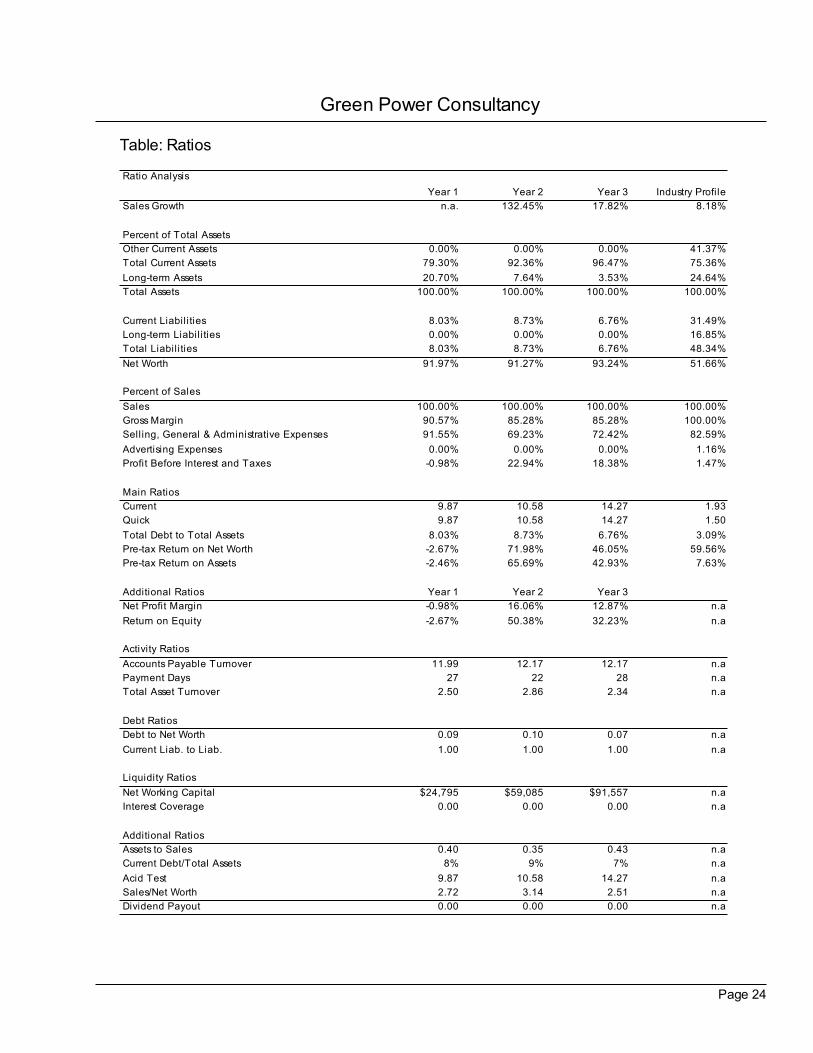
8.6 Business Ratios
The following table contains typical Business Ratios of both Green Power as well as theindustry as a whole.
Green Power Consultancy
Page 24
Table: Ratios
Ratio Analysis
Year 1 Year 2 Year 3 Industry Profile
Sales Growth n.a. 132.45% 17.82% 8.18%
Percent of Total Assets
Other Current Assets 0.00% 0.00% 0.00% 41.37%
Total Current Assets 79.30% 92.36% 96.47% 75.36%
Long-term Assets 20.70% 7.64% 3.53% 24.64%
Total Assets 100.00% 100.00% 100.00% 100.00%
Current Liabil ities 8.03% 8.73% 6.76% 31.49%
Long-term Liabil ities 0.00% 0.00% 0.00% 16.85%
Total Liabilities 8.03% 8.73% 6.76% 48.34%
Net Worth 91.97% 91.27% 93.24% 51.66%
Percent of Sales
Sales 100.00% 100.00% 100.00% 100.00%
Gross Margin 90.57% 85.28% 85.28% 100.00%
Selling, General & Administrative Expenses 91.55% 69.23% 72.42% 82.59%
Advertising Expenses 0.00% 0.00% 0.00% 1.16%
Profit Before Interest and Taxes -0.98% 22.94% 18.38% 1.47%
Main Ratios
Current 9.87 10.58 14.27 1.93
Quick 9.87 10.58 14.27 1.50
Total Debt to Total Assets 8.03% 8.73% 6.76% 3.09%
Pre-tax Return on Net Worth -2.67% 71.98% 46.05% 59.56%
Pre-tax Return on Assets -2.46% 65.69% 42.93% 7.63%
Additional Ratios Year 1 Year 2 Year 3
Net Profit Margin -0.98% 16.06% 12.87% n.a
Return on Equity -2.67% 50.38% 32.23% n.a
Activity Ratios
Accounts Payable Turnover 11.99 12.17 12.17 n.a
Payment Days 27 22 28 n.a
Total Asset Turnover 2.50 2.86 2.34 n.a
Debt Ratios
Debt to Net Worth 0.09 0.10 0.07 n.a
Current Liab. to Liab. 1.00 1.00 1.00 n.a
Liquidity Ratios
Net Working Capital $24,795 $59,085 $91,557 n.a
Interest Coverage 0.00 0.00 0.00 n.a
Additional Ratios
Assets to Sales 0.40 0.35 0.43 n.a
Current Debt/Total Assets 8% 9% 7% n.a
Acid Test 9.87 10.58 14.27 n.a
Sales/Net Worth 2.72 3.14 2.51 n.a
Dividend Payout 0.00 0.00 0.00 n.a
Appendix
Page 1
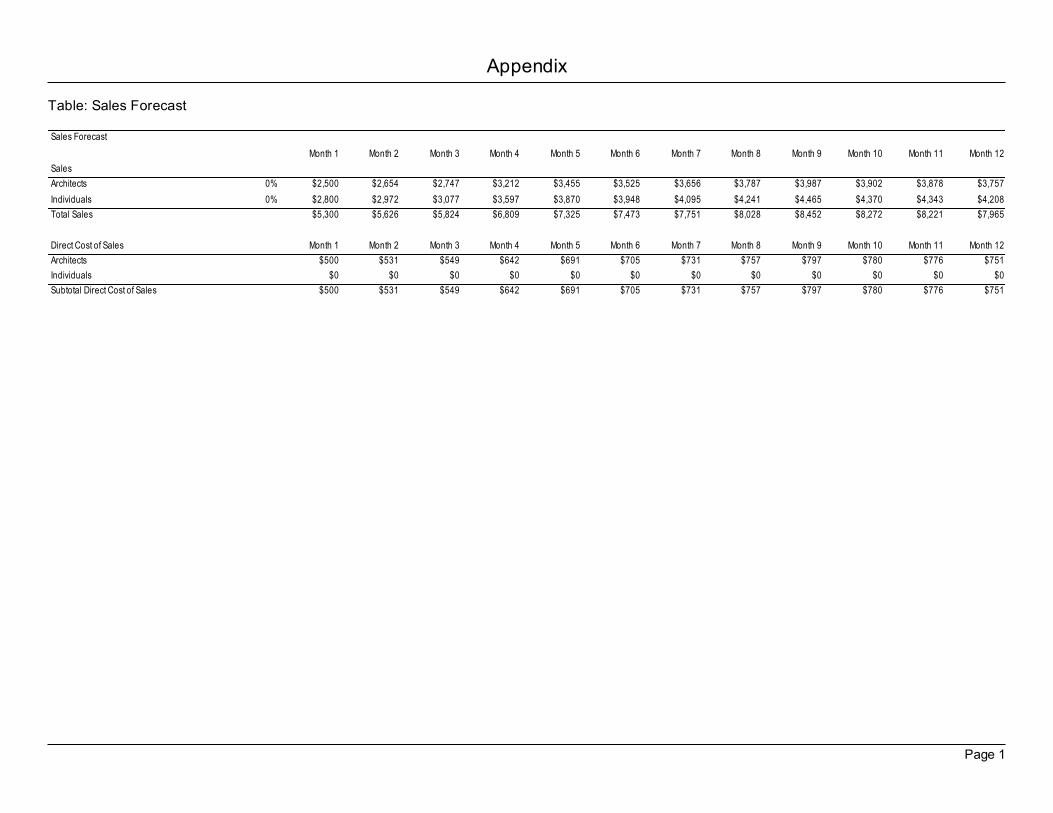
Table: Sales Forecast
Sales Forecast
Month 1 Month 2 Month 3 Month 4 Month 5 Month 6 Month 7 Month 8 Month 9 Month 10 Month 11 Month 12
Sales
Architects 0% $2,500 $2,654 $2,747 $3,212 $3,455 $3,525 $3,656 $3,787 $3,987 $3,902 $3,878 $3,757
Individuals 0% $2,800 $2,972 $3,077 $3,597 $3,870 $3,948 $4,095 $4,241 $4,465 $4,370 $4,343 $4,208
Total Sales $5,300 $5,626 $5,824 $6,809 $7,325 $7,473 $7,751 $8,028 $8,452 $8,272 $8,221 $7,965
Direct Cost of Sales Month 1 Month 2 Month 3 Month 4 Month 5 Month 6 Month 7 Month 8 Month 9 Month 10 Month 11 Month 12
Architects $500 $531 $549 $642 $691 $705 $731 $757 $797 $780 $776 $751
Individuals $0 $0 $0 $0 $0 $0 $0 $0 $0 $0 $0 $0
Subtotal Direct Cost of Sales $500 $531 $549 $642 $691 $705 $731 $757 $797 $780 $776 $751
Appendix
Page 2
Table: Personnel
Personnel Plan
Month 1 Month 2 Month 3 Month 4 Month 5 Month 6 Month 7 Month 8 Month 9 Month 10 Month 11 Month 12
Dan 0% $2,000 $2,000 $2,000 $2,000 $2,000 $2,000 $2,000 $2,000 $2,000 $2,000 $2,000 $2,000
Sue 0% $2,000 $2,000 $2,000 $2,000 $2,000 $2,000 $2,000 $2,000 $2,000 $2,000 $2,000 $2,000
Associate consultant 0% $0 $0 $0 $0 $0 $0 $0 $0 $0 $0 $0 $0
Administrative assistant 0% $0 $0 $0 $400 $400 $400 $500 $500 $600 $600 $600 $600
Total People 2 2 2 3 3 3 3 3 3 3 3 3
Total Payroll $4,000 $4,000 $4,000 $4,400 $4,400 $4,400 $4,500 $4,500 $4,600 $4,600 $4,600 $4,600
Appendix
Page 3
Table: General Assumptions
General Assumptions
Month 1 Month 2 Month 3 Month 4 Month 5 Month 6 Month 7 Month 8 Month 9 Month 10 Month 11 Month 12
Plan Month 1 2 3 4 5 6 7 8 9 10 11 12
Current Interest Rate 10.00% 10.00% 10.00% 10.00% 10.00% 10.00% 10.00% 10.00% 10.00% 10.00% 10.00% 10.00%
Long-term Interest Rate 10.00% 10.00% 10.00% 10.00% 10.00% 10.00% 10.00% 10.00% 10.00% 10.00% 10.00% 10.00%
Tax Rate 30.00% 30.00% 30.00% 30.00% 30.00% 30.00% 30.00% 30.00% 30.00% 30.00% 30.00% 30.00%
Other 0 0 0 0 0 0 0 0 0 0 0 0
Appendix
Page 4
Table: Profit and Loss
Pro Forma Profit and Loss
Month 1 Month 2 Month 3 Month 4 Month 5 Month 6 Month 7 Month 8 Month 9 Month 10 Month 11 Month 12
Sales $5,300 $5,626 $5,824 $6,809 $7,325 $7,473 $7,751 $8,028 $8,452 $8,272 $8,221 $7,965
Direct Cost of Sales $500 $531 $549 $642 $691 $705 $731 $757 $797 $780 $776 $751
Other Costs of Sales $0 $0 $0 $0 $0 $0 $0 $0 $0 $0 $0 $0
Total Cost of Sales $500 $531 $549 $642 $691 $705 $731 $757 $797 $780 $776 $751
Gross Margin $4,800 $5,096 $5,274 $6,167 $6,634 $6,768 $7,020 $7,271 $7,655 $7,492 $7,446 $7,213
Gross Margin % 90.57% 90.57% 90.57% 90.57% 90.57% 90.57% 90.57% 90.57% 90.57% 90.57% 90.57% 90.57%
Expenses
Payroll $4,000 $4,000 $4,000 $4,400 $4,400 $4,400 $4,500 $4,500 $4,600 $4,600 $4,600 $4,600
Sales and Marketing and Other
Expenses
$400 $400 $400 $400 $400 $400 $400 $400 $400 $400 $400 $400
Depreciation $150 $150 $150 $150 $150 $150 $150 $150 $150 $150 $150 $150
Rent $500 $500 $500 $500 $500 $500 $500 $500 $500 $500 $500 $500
Utilities $200 $200 $200 $200 $200 $200 $200 $200 $200 $200 $200 $200
Insurance $200 $200 $200 $200 $200 $200 $200 $200 $200 $200 $200 $200
Payroll Taxes 15% $600 $600 $600 $660 $660 $660 $675 $675 $690 $690 $690 $690
Other $150 $150 $150 $150 $150 $150 $150 $150 $150 $150 $150 $150
Total Operating Expenses $6,200 $6,200 $6,200 $6,660 $6,660 $6,660 $6,775 $6,775 $6,890 $6,890 $6,890 $6,890
Profit Before Interest and Taxes ($1,400) ($1,104) ($926) ($493) ($26) $108 $245 $496 $765 $602 $556 $323
EBITDA ($1,250) ($954) ($776) ($343) $124 $258 $395 $646 $915 $752 $706 $473
Interest Expense $0 $0 $0 $0 $0 $0 $0 $0 $0 $0 $0 $0
Taxes Incurred $0 $0 $0 $0 $0 $0 $0 $0 $0 $0 $0 $0
Net Profit ($1,400) ($1,104) ($926) ($493) ($26) $108 $245 $496 $765 $602 $556 $323
Net Profit/Sales -26.42% -19.63% -15.90% -7.24% -0.36% 1.45% 3.15% 6.18% 9.05% 7.28% 6.76% 4.06%
Appendix
Page 5
Table: Cash Flow
Pro Forma Cash Flow
Month 1 Month 2 Month 3 Month 4 Month 5 Month 6 Month 7 Month 8 Month 9 Month 10 Month 11 Month 12
Cash Received
Cash from Operations
Cash Sales $5,300 $5,626 $5,824 $6,809 $7,325 $7,473 $7,751 $8,028 $8,452 $8,272 $8,221 $7,965
Subtotal Cash from Operations $5,300 $5,626 $5,824 $6,809 $7,325 $7,473 $7,751 $8,028 $8,452 $8,272 $8,221 $7,965
Additional Cash Received
Sales Tax, VAT, HST/GST Received 0.00% $0 $0 $0 $0 $0 $0 $0 $0 $0 $0 $0 $0
New Current Borrowing $0 $0 $0 $0 $0 $0 $0 $0 $0 $0 $0 $0
New Other Liabilities (interest-free) $0 $0 $0 $0 $0 $0 $0 $0 $0 $0 $0 $0
New Long-term Liabilities $0 $0 $0 $0 $0 $0 $0 $0 $0 $0 $0 $0
Sales of Other Current Assets $0 $0 $0 $0 $0 $0 $0 $0 $0 $0 $0 $0
Sales of Long-term Assets $0 $0 $0 $0 $0 $0 $0 $0 $0 $0 $0 $0
New Investment Received $0 $0 $0 $0 $0 $0 $0 $0 $0 $0 $0 $0
Subtotal Cash Received $5,300 $5,626 $5,824 $6,809 $7,325 $7,473 $7,751 $8,028 $8,452 $8,272 $8,221 $7,965
Expenditures Month 1 Month 2 Month 3 Month 4 Month 5 Month 6 Month 7 Month 8 Month 9 Month 10 Month 11 Month 12
Expenditures from Operations
Cash Spending $4,000 $4,000 $4,000 $4,400 $4,400 $4,400 $4,500 $4,500 $4,600 $4,600 $4,600 $4,600
Bill Payments $85 $2,551 $2,581 $2,604 $2,754 $2,801 $2,816 $2,857 $2,884 $2,937 $2,920 $2,915
Subtotal Spent on Operations $4,085 $6,551 $6,581 $7,005 $7,154 $7,201 $7,316 $7,357 $7,484 $7,537 $7,520 $7,515
Additional Cash Spent
Sales Tax, VAT, HST/GST Paid Out $0 $0 $0 $0 $0 $0 $0 $0 $0 $0 $0 $0
Principal Repayment of Current Borrowing $0 $0 $0 $0 $0 $0 $0 $0 $0 $0 $0 $0
Other Liabilities Principal Repayment $0 $0 $0 $0 $0 $0 $0 $0 $0 $0 $0 $0
Long-term Liabilities Principal Repayment $0 $0 $0 $0 $0 $0 $0 $0 $0 $0 $0 $0
Purchase Other Current Assets $0 $0 $0 $0 $0 $0 $0 $0 $0 $0 $0 $0
Purchase Long-term Assets $0 $0 $0 $0 $0 $0 $0 $0 $0 $0 $0 $0
Dividends $0 $0 $0 $0 $0 $0 $0 $0 $0 $0 $0 $0
Subtotal Cash Spent $4,085 $6,551 $6,581 $7,005 $7,154 $7,201 $7,316 $7,357 $7,484 $7,537 $7,520 $7,515
Net Cash Flow $1,215 ($925) ($758) ($195) $171 $272 $434 $671 $968 $735 $701 $450
Cash Balance $25,065 $24,140 $23,383 $23,188 $23,358 $23,630 $24,064 $24,735 $25,704 $26,439 $27,140 $27,590
Appendix
Page 6
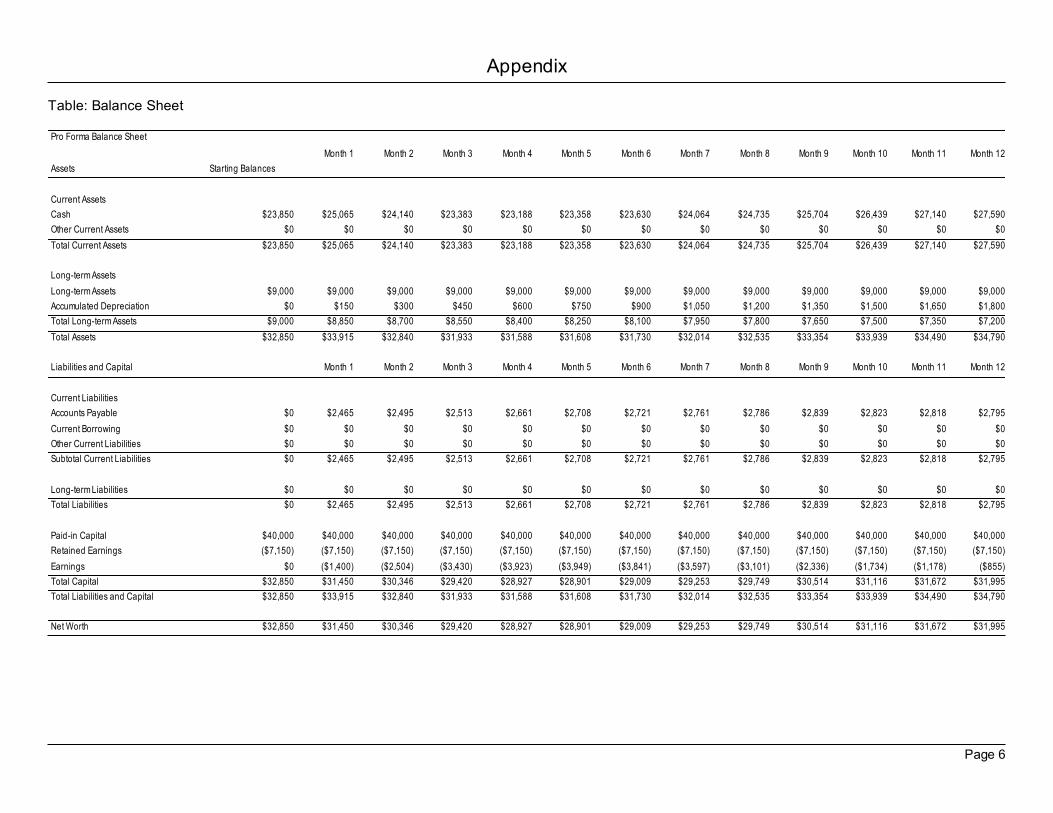
Table: Balance Sheet
Pro Forma Balance Sheet
Month 1 Month 2 Month 3 Month 4 Month 5 Month 6 Month 7 Month 8 Month 9 Month 10 Month 11 Month 12
Assets Starting Balances
Current Assets
Cash $23,850 $25,065 $24,140 $23,383 $23,188 $23,358 $23,630 $24,064 $24,735 $25,704 $26,439 $27,140 $27,590
Other Current Assets $0 $0 $0 $0 $0 $0 $0 $0 $0 $0 $0 $0 $0
Total Current Assets $23,850 $25,065 $24,140 $23,383 $23,188 $23,358 $23,630 $24,064 $24,735 $25,704 $26,439 $27,140 $27,590
Long-term Assets
Long-term Assets $9,000 $9,000 $9,000 $9,000 $9,000 $9,000 $9,000 $9,000 $9,000 $9,000 $9,000 $9,000 $9,000
Accumulated Depreciation $0 $150 $300 $450 $600 $750 $900 $1,050 $1,200 $1,350 $1,500 $1,650 $1,800
Total Long-term Assets $9,000 $8,850 $8,700 $8,550 $8,400 $8,250 $8,100 $7,950 $7,800 $7,650 $7,500 $7,350 $7,200
Total Assets $32,850 $33,915 $32,840 $31,933 $31,588 $31,608 $31,730 $32,014 $32,535 $33,354 $33,939 $34,490 $34,790
Liabilities and Capital Month 1 Month 2 Month 3 Month 4 Month 5 Month 6 Month 7 Month 8 Month 9 Month 10 Month 11 Month 12
Current Liabilities
Accounts Payable $0 $2,465 $2,495 $2,513 $2,661 $2,708 $2,721 $2,761 $2,786 $2,839 $2,823 $2,818 $2,795
Current Borrowing $0 $0 $0 $0 $0 $0 $0 $0 $0 $0 $0 $0 $0
Other Current Liabilities $0 $0 $0 $0 $0 $0 $0 $0 $0 $0 $0 $0 $0
Subtotal Current Liabilities $0 $2,465 $2,495 $2,513 $2,661 $2,708 $2,721 $2,761 $2,786 $2,839 $2,823 $2,818 $2,795
Long-term Liabilities $0 $0 $0 $0 $0 $0 $0 $0 $0 $0 $0 $0 $0
Total Liabilities $0 $2,465 $2,495 $2,513 $2,661 $2,708 $2,721 $2,761 $2,786 $2,839 $2,823 $2,818 $2,795
Paid-in Capital $40,000 $40,000 $40,000 $40,000 $40,000 $40,000 $40,000 $40,000 $40,000 $40,000 $40,000 $40,000 $40,000
Retained Earnings ($7,150) ($7,150) ($7,150) ($7,150) ($7,150) ($7,150) ($7,150) ($7,150) ($7,150) ($7,150) ($7,150) ($7,150) ($7,150)
Earnings $0 ($1,400) ($2,504) ($3,430) ($3,923) ($3,949) ($3,841) ($3,597) ($3,101) ($2,336) ($1,734) ($1,178) ($855)
Total Capital $32,850 $31,450 $30,346 $29,420 $28,927 $28,901 $29,009 $29,253 $29,749 $30,514 $31,116 $31,672 $31,995
Total Liabilities and Capital $32,850 $33,915 $32,840 $31,933 $31,588 $31,608 $31,730 $32,014 $32,535 $33,354 $33,939 $34,490 $34,790
Net Worth $32,850 $31,450 $30,346 $29,420 $28,927 $28,901 $29,009 $29,253 $29,749 $30,514 $31,116 $31,672 $31,995
Recommended