GENERAL DEMOGRAPHIC INFORMATION
Dr. H. Nolo Martínez
Director
Hispanic/Latino Affairs
Office of the Governor
NC Latino Growth in NC

In March 2000, 32.8 million Hispanics lived in the United States.
12% of the U.S. population is Hispanic.
People of Mexican origin comprise approximately 66% of the U.S. Hispanic population.
Population and Size Composition

Percent Distribution of Hispanic by Type: 2000
Mexican66%
Puerto Rican9%
Cuban4%
Central and South
American15%
Other Hispanic
6%

Age
One-third of Hispanics are under age 18.
Among Hispanics, Mexicans have the largest proportion of people under age 18 (38 percent).
The Hispanic population is younger than the non-Hispanic White population.

U.S. Immigration Data
The leading source countries for legal immigration are 1. Mexico (91,000), 2. Vietnam (78,000), 3. the Philippines (59,000), and 4. the republics of the former Soviet Union (44,000).*
Undocumented immigration total approx. 300,000 annually, according to the INS. 50% of these undocumented immigrants arrive in the U.S. legally and overstay their non-immigrant visa.

Current Occupation for Men by Hispanic Origin: 2000
Precision production
Technical, sales
Service
Farming
Managerial, professional
Operators, laborers
19%
9%
31%
21%
3%
17%
22%
15%
11%15%
8%
29%
Hispanic Non-Hispanic White
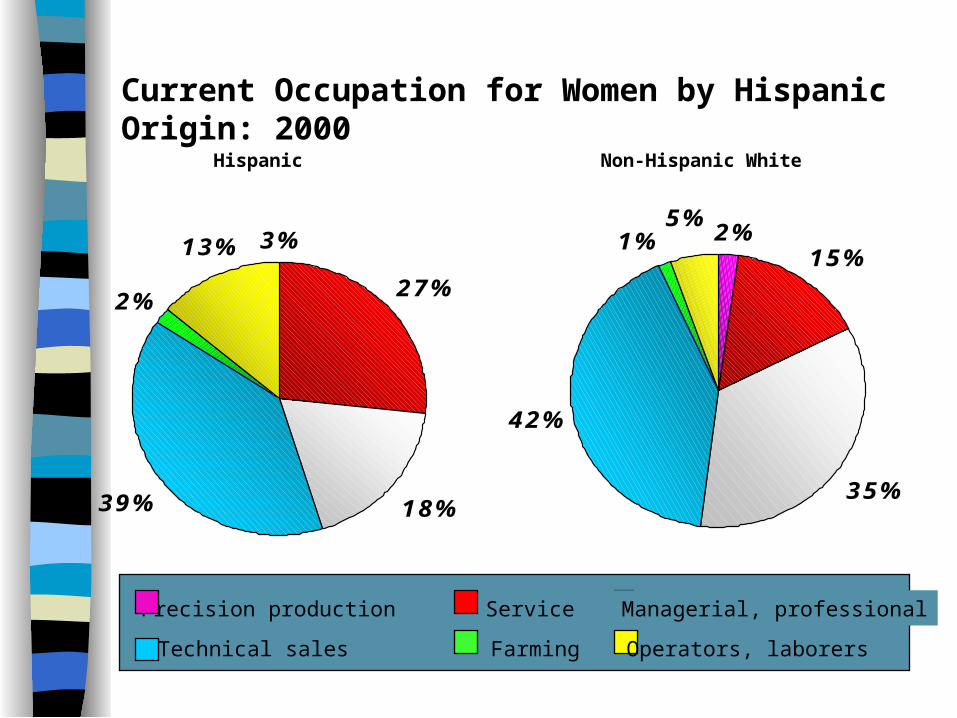
Current Occupation for Women by Hispanic Origin: 2000
ServicePrecision production
Farming
Managerial, professional
Technical sales Operators, laborers
2%15%
35%
42%
1%5%
27%
18%39%
2%
13% 3%
Hispanic Non-Hispanic White

Top States in Percentage Growth of Mexican Population
North Carolina 655%
Georgia 460%
Tennessee 457%
Arkansas 390%
South Carolina 379%
Alabama 368%
Delaware 321%
Kentucky 261%
New Jersey 258%
Nevada 235%
U.S.U.S. 53%53%

Large scale Immigration from Mexico 8 million in 2000 Highly concentrated: 78% in 4
states 22% of all HS dropouts in US labor
force were born in Mexico Most natives do not face significant
job competition from Mexican immigrants

NC Hispanic Demographic Growth
Hispanic population in NC has grown from 76,745 in 1990 to over 379,000 in 2000
NC Metro Growth (now) 44,000 Charlotte, 34,000 Raleigh, 100,000 Triangle
NC Rural Growth (future) LATINO POPULATION BY COUNTY IN
www.ayudate.org

Growth by Ethnic Group
0%
20%
40%
60%
80%
100%
120%
140%
160%
% Change
US South North Carolina
Rate of Population Growth by Ethnic Group 1990- 1997
White Black Hispanic American Indian Asian & Pacific Islander Total

NC Latinos by County

Education in North Carolina
4th fastest growing enrollment in US
160 languages
46,000 LEP students in Public Schools
In 2000, 41.4% of Hispanic w/ HS diploma

The New Melting Pot
State Growth1. North Carolina 73%2. Nevada 60%3. Kansas 54%4. Indiana 50%5. Minnesota 43%6. Virginia 40%7. Maryland 39%8. Arizona 35%9. Utah 31%10. Oregon 26%
Ranked by percentage increase of immigrants from 1995 to 1999**For states with a foreign-born pop. of at least 50,000 in 1995, Urban Institute
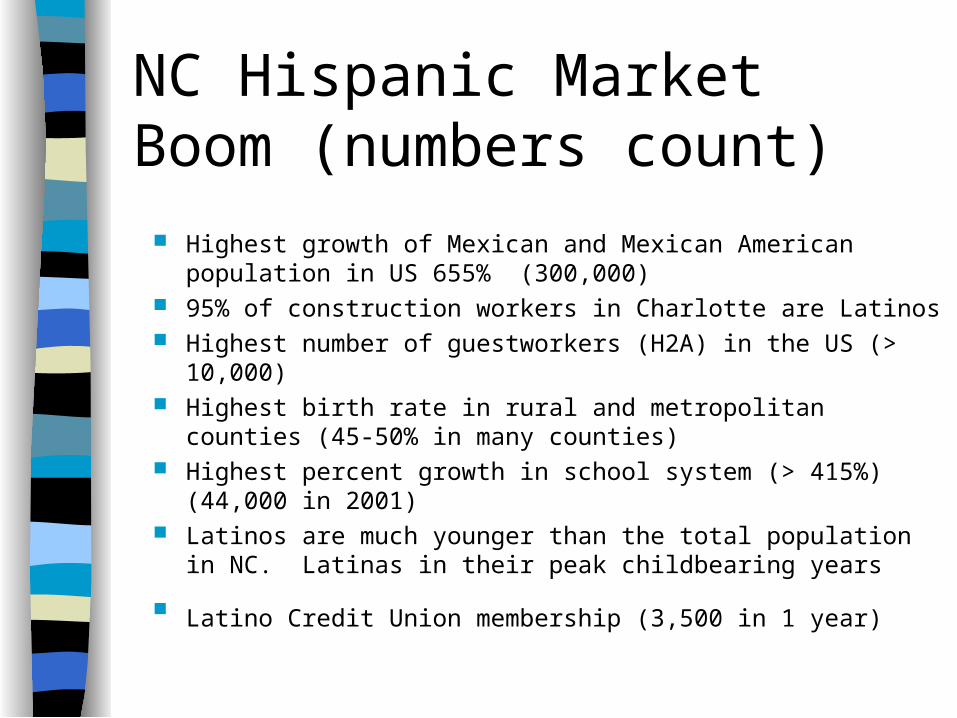
NC Hispanic Market Boom (numbers count)
Highest growth of Mexican and Mexican American population in US 655% (300,000)
95% of construction workers in Charlotte are Latinos Highest number of guestworkers (H2A) in the US (>
10,000) Highest birth rate in rural and metropolitan counties (45-
50% in many counties) Highest percent growth in school system (> 415%)
(44,000 in 2001) Latinos are much younger than the total population in NC.
Latinas in their peak childbearing years
Latino Credit Union membership (3,500 in 1 year)

$ Poder Hispano
National Latino buying power in 1998 was $404 billion annually - among top 20 largest consumer markets in the world
In 1997 Hispanic buying power in NC was $2.3 billion (pop. estimated at 100,00), a 177% jump from 1990
NC Hispanic buying power is increasing at the third highest rate in the nation

¿ Habla Español ?
Spanish is the first language of approximately 90% of Hispanics, the only language of about 60% of NC Hispanic workers
Hispanics prefer advertising messages in Spanish
English-only business is a barrier to attract Latino clients

single males
rural living
seasonal work
dynamic immigration
agriculture
no participation government
Military representation
developed stronger ties
rural community (church)
other industries tryouts
meat processing plants
economic opportunities
year round opportunities
First outreach experience (Public Sector)
Focus on interpreters
family reunification (permanent)
Public School growth
Latino Organizations CBO
Hispanic leadership in Government
Mexican Counsel (Historic)
Latino Legislative Agenda
Hispanic voting potential
Latino buying power interest
Essential Workers Support Professional bilingual searches
Period 70-80’s Period 80-90’s Period 90 - 2000
30 years: Latinos in NC30 years: Latinos in NC

The essentials
•
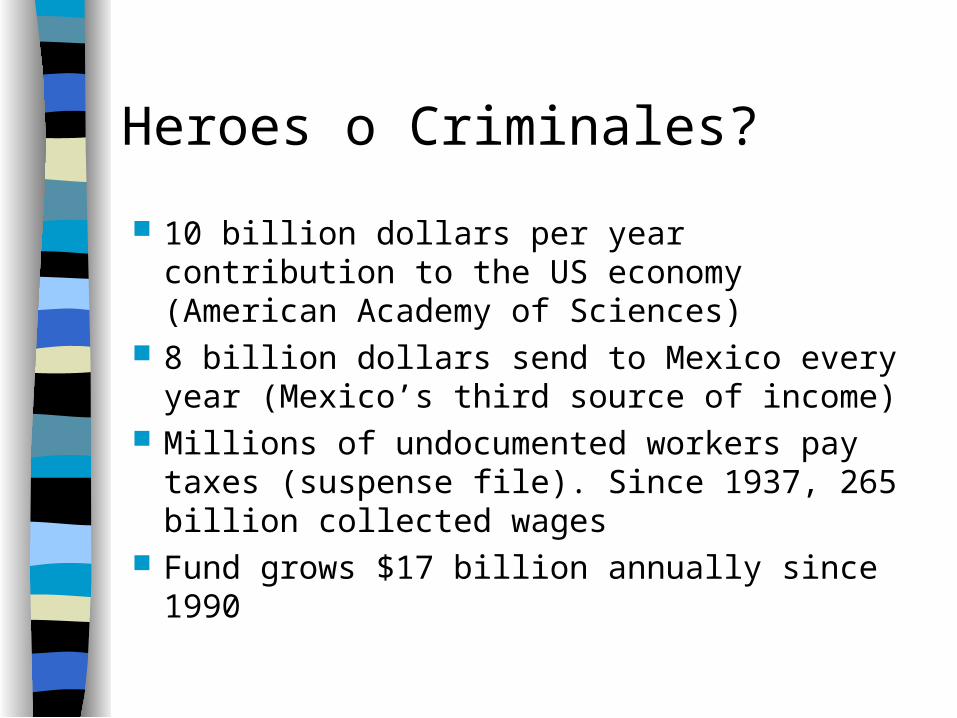
Heroes o Criminales?
10 billion dollars per year contribution to the US economy (American Academy of Sciences)
8 billion dollars send to Mexico every year (Mexico’s third source of income)
Millions of undocumented workers pay taxes (suspense file). Since 1937, 265 billion collected wages
Fund grows $17 billion annually since 1990

Heroes o criminales?
Keep inflation down (Allan Greenspan) Cheap labor (Only game in town Poultry
Federation) Best medicine for NC aging population Tom Ridge calls them “technically
criminals” Presidente V. Fox calls them “heroes”

The other illegals
Since 1986 is a crime to hire foreigners without documentation
According to INS, 75% of Latino workers in NC are illegal (Tom O'Connell, N&O)
No match letters. What % of illegal business/industry in NC?

Complete Story The “revolving door” is part of being an
illegal immigrant and an employer in NC The actions of one (illegal worker) do not
condone the actions of the other (illegal employer)
But media continues to focus on crime of the worker
Who are the offenders, why are these violating the law, how we can stop both parties from conducting criminal activity
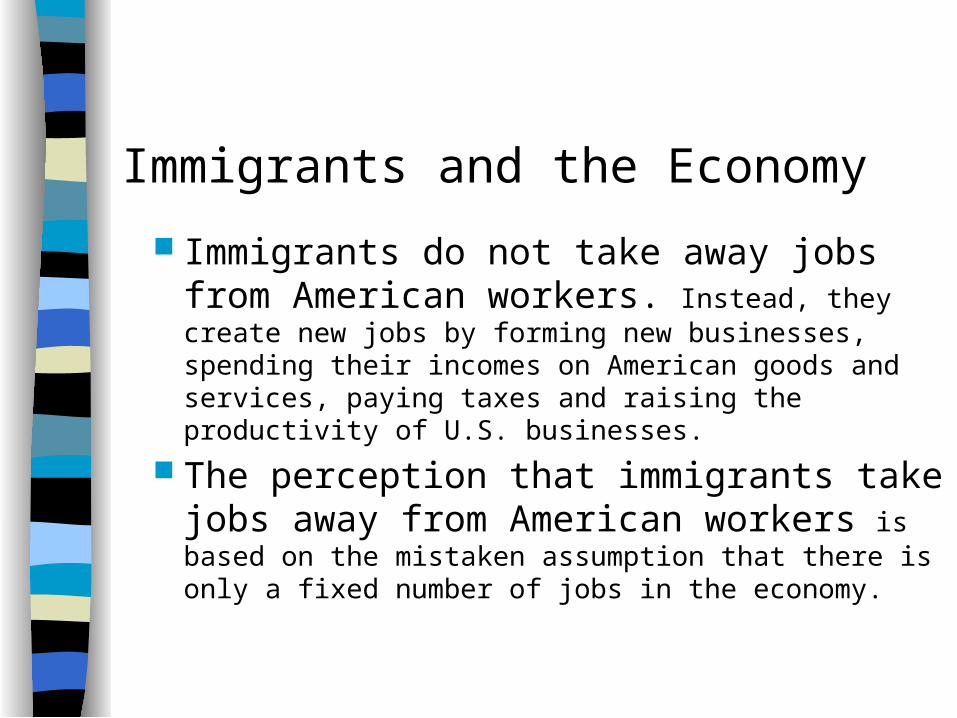
Immigrants and the Economy
Immigrants do not take away jobs from American workers. Instead, they create new jobs by forming new businesses, spending their incomes on American goods and services, paying taxes and raising the productivity of U.S. businesses.
The perception that immigrants take jobs away from American workers is based on the mistaken assumption that there is only a fixed number of jobs in the economy.

Immigrants and the Economy
Immigrants pay more than $90 billion in taxes every year and receive only $5 billion in welfare. Contributions to the public treasury added to the economy surplus.
International aid vs. Money transfers Law of Supply and Demand
Legal Status
Local communities are where the effects of immigration are felt most
Lack of documentation and insurance often deters Hispanic from seeking services
Fear of immigration authorities create great potential for confusion no matter what the system (QRT presence)
Pro-immigration Conditions (prior to 9.11.2001)
Unions and AFL-CIO Alan Greenspan Restoration of 245i Mexico-US Relations (Bush, Helms,
NC Commerce, NC Elected Officials, Mexican Consul in NC)
Elections (Jorge y Alberto)

Immigration Reform INS backlogs have skyrocketed, families
have been separated, businesses have lost valuable employees and eligible people must leave the country (often for years) in order to adjust.
Increase the number of Mexicans granted Temporary work permit
Put many of these workers on a path toward a green card, which provides permanent legal residence and is a step toward U.S. citizenship

Border Security (245i)
Some illegal immigrants stay in the US while their green card is being processed
Limited to Nov. 30, 2002 Border security tied to legislation Boost the pay of border patrol agents Hire more Establish foreign student tracking system After 2003 passports be tamper-resistant Visitor documents-machine readable with
biometrics

Current and Future Challenges (taxation without representation)
Mainstream NC vs. underground lifestyle Easy target (essential workers) In-state tuition for non-citizens Driver’s license issues Worker’s compensation Home ownership potential (the American
dream) Financial security State contracts “One North Carolina” vs. segregation

Enforcement bias (bad ideas)
Equate immigration enforcement with protecting national security
Deputize local police officers as agents of the Immigration and Naturalization
INS actively promoting such partnerships Federation for American Immigration
Reform INS agents have wider latitude
Recommended


![The Plea of Nolo Contendere - [email protected] Carey Law](https://img.pdfslide.us/doc/110x75/61fb45e22e268c58cd5c36f6/the-plea-of-nolo-contendere-emailprotected-carey-law.jpg)