International Journal of Energy and Environmental Research
Vol.4, No.3, pp.1-26, August 2016
___Published by European Centre for Research Training and Development UK (www.eajournals.org)
1 ISSN 2055-0197(Print), ISSN 2055-0200(Online)
FUEL WOOD COMMERCIALIZATION AND HOUSEHOLDS WELFARE IN THE
NORTHERN REGION OF GHANA: AN IMPLICATIONS FOR RURAL
LIVELIHOOD IMPROVEMENT
Jamal Mohammed1 and Anthony Kofi Osei-Fosu2
1Department of Liberal Studies, Faculty of Business and Management Studies, P.O. Box KF
981, Koforidua, Polytechnic, Koforidua, Ghana.
Email: [email protected]/[email protected]
2Department of Economics, University Post Office, Kwame Nkrumah University of Science
and Technology, Kumasi, Ghana.
Email: [email protected]/[email protected]
1Corresponding Author: [email protected]
ABSTRACT: Several national forestry policies in Ghana meet resistance and or failure;
particularly issues of natural and environment resources use within communities. This is
because of the highly dependent nature of people on the environment for sustenance and
welfare improvements. This paper examined the major facts which motivate households’
decisions to engage in commercialization of fuelwood; determined the most preferred fuel
wood species, and availability of income inequality among sampled districts and establish
fuelwood, commercialization and households’ welfare by the travel cost method. The study
sampled six districts in the Northern Region based on poverty and rural dependence mode. The
paper used the simple random sample along with a structured questionnaire to illicit
information from respondents. The results showed that, increased in travel cost and cost of
access to forested sites impact negatively on the number of visits for fuel wood. The study
further revealed that, benefits from fuel wood commercialization in terms of reducing income
inequality differ from district to district. The study recommended that, government and
international organizations should facilitate the cultivation forest sites solely for fuel wood
harvest to ensure environmental sustainability. In addition, fuel wood harvesters must be
taught forest management and conservation strategies in the Northern Region.
KEYWORDS: Fuel Wood, Commercialization, Households, Welfare, Inequality, Livelihood
INTRODUCTION
Fuel wood has been defined to be wood whose form is rough and could be branches of trees,
logs, sawdust, pellets and twigs mainly for energy generation (FAO, 2002). Fuel wood has
played significant role in domestic and commercial energy consumption world over. CIFOR
(2009) estimated approximately about two billion people world over use biomass in the form
of fuel wood and charcoal for cooking and heating. These people have depended on these
natural resources for their survival for a very long period of time.
Human beings have always had a close relationship with environmental resources and therefore
take their livelihood from it. Todaro and Smith (2011) put it that, more than half of the
developing world inhabitants who are considered very active depend in part or whole on the
environment which could be hunting, fishing, agriculture, forestry and so on. Forest and

International Journal of Energy and Environmental Research
Vol.4, No.3, pp.1-26, August 2016
___Published by European Centre for Research Training and Development UK (www.eajournals.org)
2 ISSN 2055-0197(Print), ISSN 2055-0200(Online)
environmental resources are considered to have played an important role in both rural and urban
livelihoods but particular reference is given to rural livelihood (Walelign, 2013). The rural
inhabitants often subsisted through dependence on forest resources and the environment.
Kiflu et al (2009) explained that, researchers on wood fuel use in developing regions of Africa,
Asia and Latin America believed that, wood fuel was a major factor in tropical deforestation
and thus, accounted for forests loss and widespread wood fuel shortages. However, other
studies disproved the notion that, wood fuel harvesting is a direct cause of deforestation since
most wood fuel demand is met by trees and shrubs growing outside of forest areas and from
farm clearance (Arnold, et al., 2006; Bensel, 2008 cited in Kiflu et al, 2009).
Arnold and Persson (2003) related that, fuel wood consumption in Africa was estimated to
increase to 544.8 million m3 for firewood and 46.1 million tons for charcoal by 2030.
Fuelwood is a renewable form of energy that has received substantial harvest in Ghana because
of its open source nature. As a de facto open-access resources, fuel wood commercialization is
often linked to people who do not require a long period of training and experience for harvest
knowledge and as such, harvest require simple tools and implements (Belcher et al., 2005; Fu
et al., 2009).
Ghana’s fuelwood consumption is been increasing for both urban and rural inhabitants. This
invariably has motivated many people to engage in commercial harvest of the fuel wood.
Estimates from the 2010 Ghana Population & Housing Census showed that, 73% of rural
households and 48% of urban households use firewood and charcoal respectively for cooking
in 2010 (Ghana Statistical Services, 2010).
The Northern Region of Ghana is homogenous in characteristics and one of the major
homogeneous characteristic is poverty. The incidence of poverty and poverty gap increases is
one in every two in the Northern region (50.4%) (GLSS 6, 2014). This therefore serve as a
motivation for the inhabitants to seek livelihood empowerments in fuel wood
commercialization.
Fuelwood is still widely used as a dominant energy among all classes of people across sub
Saharan Africa and Ghana is no exception (Amuah, 2011).
The problem of the study is manifested in two arguments: the issue that, some empirical
literature stressing the effects of fuel wood harvest on environmental degradation (Anang,
2011; Eco-discipline, 2012) and hence, fuel wood commercialization has therefore fallen prey
to the people. The other issue been that, households depend on dead trees, shrubs, and over
aged trees as fuel wood for commercialization and not standing tree; therefore, forestry has to
be redefined. Forestry in this era has been redefined, and much emphasis is placed on poverty
alleviation and livelihoods improvement (Vedeld et al, 2004; Belcher, 2005).
In 2006 then, Ghana Strategic Energy Plan - SNEP (2006 – 2020) is a nationally thought
through energy roadmap that provides the country’s energy programme was inaugurated
(Energy Commission of Ghana, 2006). The policy document was aimed at streamlining energy
usage and bringing to light the aspect of energy demand the public is not aware and how
effective and efficient utilization could be achieved. Despite this important roadmap document
to streamline energy demand in Ghana, usage of fuel wood as a component of the energy mix
has been on the increase for both rural and urban populace. IFAD (2001) asserted that, growing
population has resulted in harvest of fuelwood as business of potential for cash incomes from
International Journal of Energy and Environmental Research
Vol.4, No.3, pp.1-26, August 2016
___Published by European Centre for Research Training and Development UK (www.eajournals.org)
3 ISSN 2055-0197(Print), ISSN 2055-0200(Online)
planned cultivation and management of trees and natural resources; (from 1,820,806 in 2000
to 2, 479,461 in 2010 (2000 PHC; 2010 PHC; GSS, 2010). The complex nature of fuel wood
distribution across the actors in the society (harvesters, users, sellers, policymakers, etc) pose
a daunting challenges to particularly energy planners. Several surveys in Ghana has put the
Northern Region among the regions with high poverty incidence and rates (See GLSS 6, 2014)
and this invariably has made the inhabitants seeking alternative livelihoods to empower
themselves. The GLSS 5 survey showed that, approximate estimates of 50% of households in
Ghana depended both on non-traditional and traditional energy source (Ghana Statistical
Service, 2008).
Dominance in fuel wood commercialization has had gender dimension in Ghana both rural and
urban areas and could relate to gender dimension to poverty and livelihood alternatives.
Women in most cases in the rural settings in Ghana undertake major part of the farm activities
including walking to distant places to gather fuel wood. As Sesabo and Tol, (2005) put it,
gathering and collecting fuelwood alongside their farming activities involve women walking
long distances and this impact negatively on women.
Belcher (2005) related that, poverty has been defined to include materialistic definitions
focusing on income and wealth (welfare), to extended definitions that emphasised capabilities
and empowerment in addition to the monetary aspects of livelihoods. Belcher (2005) further
opined that, to achieve poverty reduction based on forest products, there has to be an increase
in the creation of wealth through forest products production, processing and marketing, and to
streamline mechanisms to guarantee that some of that wealth is captured by the intended
beneficiaries. Thus, commercialization of fuel wood perhaps could enhance welfare.
The motivation of this paper hinges on the following questions: what are the major factors
which motivate households’ decision to engage in commercialization of fuel wood in the
Northern Region of Ghana?; which are the most preferred fuel wood by households’ and are
there availability of income inequality among participating districts in the Northern Region of
Ghana?; how is the linkage between fuelwood commercialization and households’ welfare in
sampled districts in the Northern Region of Ghana with respect to travel cost method?
The general objective of the study was to assess fuel-wood commercialization and households’
welfare in the Northern Region of Ghana. The specific objectives were to: identify the major
factors which motivate households’ decision to engage in commercialization of fuel wood in
the Northern Region of Ghana. Determine the most preferred fuel wood specie by households
and availability of income inequality among participating districts in the Northern Region of
Ghana. Establish fuelwood commercialization and households’ welfare in sampled districts in
the Northern Region of Ghana using the travel cost method.
The study hypothesised that fuel wood commercialization and households’ welfare in the
Northern Region of Ghana are positively and significantly related.
The hypothesis postulation is that: travel cost by individual (household head) has no effect on
the number of visit for fuel wood in the Northern Region.
This paper is justified in that, it is an original application of the individual travel cost method
derived from cost of access instead of lump used of a model. It brings to bear the contribution
of forest income to poverty reduction and the combination Lorenz curves and Gini coefficient

International Journal of Energy and Environmental Research
Vol.4, No.3, pp.1-26, August 2016
___Published by European Centre for Research Training and Development UK (www.eajournals.org)
4 ISSN 2055-0197(Print), ISSN 2055-0200(Online)
to measure variation in income among households in the study area. A study of this nature is
timely as it provides an opportunity for increased body of knowledge in forest literature.
Empirical Literature
Quite a lot of studies have been done in this field. For example Manyatsi and Hlophe (2010)
studied the contribution of sale of firewood towards rural livelihood in Swaziland, and its
environmental sustainability. They used Landsat Enhanced Thematic Mapper for 1994 and
2006 for the study. The results of the study showed that, majority of the firewood harvesters
had permission from owners and management of the land to harvest. However, the harvesting
was not monitored. The sale of firewood to the livelihood of the sellers were between US $ 67
and US $ 133 per month. Their study stated that firewood had contributed to livelihood of the
population of Swaziland and this was enormous taken into consideration the poverty levels of
the people. Their study has a similarity with this current study in terms of welfare improvement
and enhancement in income of the households.
Aabeyir et al (2011) studied factors affecting sustainable commercial fuelwood collection in
the Kintampo North District of Ghana for the purposes of sustainable woodland management
and fuelwood collection. Using focus group discussion, pair-wise comparison to rank the
factors. The results showed that, land tenure and low producer price of fuelwood were ranked
first among the factors affecting commercial fuelwood collection; distant collection sites are
over 24km from settlements in the study areas. Land tenure system practised in the study area
promotes effective management system for sustainable fuelwood collection. However, the
study area characteristics differs from the Northern Region of Ghana because the nature of land
tenure system practiced there and also the harmonization of the land system.
In addition, Kuunibe et al (2013) employed the logit model to examine the factors determining
households’ decisions regarding wood-based biomass fuel for cooking purposes in the Upper
West region. The result of their study showed that, household size, price of wood, level of
education and income had a negative relationship with fuel choice. The study relates to the
current study as it sought to determine factors that influence households’ fuelwood preferences
in the Northern Region of Ghana. The differences however, lies in the methodological approach
and estimation procedure.
John et al (2013) undertook a study on charcoal production and household welfare in Uganda:
a quantile regression approach. They started their study making reference to empirical literature
which suggested that, forest-dependent households tend to be poorer than other groups, and
that extreme reliance on forest resources might constitute a poverty trap. They used charcoal
as an example of a non-timber forest product which appears to be providing a pathway out of
poverty for some rural households in Uganda. They took data from households living adjacent
to natural forests, some of whom engage in charcoal production. They then used a semi-
parametric method to identify the determinants of participation in charcoal production and a
quantile regression decomposition to measure the heterogeneous effect of participation on
household income. Their results revealed that, younger households with few productive assets
are more likely to engage in charcoal production and as a result charcoal producers are better
off than non-charcoal producers in terms of income, even though they are worse off in terms
of productive assets. This study has similarity with the current study, the distinction however
is reflected in the methodological approach.

International Journal of Energy and Environmental Research
Vol.4, No.3, pp.1-26, August 2016
___Published by European Centre for Research Training and Development UK (www.eajournals.org)
5 ISSN 2055-0197(Print), ISSN 2055-0200(Online)
Furthermore, a study by Azeez et al (2014) on the utilization pattern and economic evaluation
of fuelwood enterprise: A case study of some areas in Ibadan Metropolis, Oyo State to evaluate
the profitability and factors influencing fuelwood profitability among marketers in the study
area. They employed Descriptive and quantitative techniques in the analysis of the data. The
result showed that majority of households used fuel wood for cooking purposes and that the
marketing of this product is highly profitable. The average Profitability Index for all farms was
0.75, indicating that out of every N10 earned; about N7.5 accrue to the marketer as profit after
accounting for all cost. Therefore marketing of fuel wood holds a great potential for income
generation as it was found to be a very profitable business. This justifies for the current study
in this area considering the fact that, both locations have higher rates of employment.
Taiye and Emmanuel (2015) examined the sustainability of fuel wood harvesting from Afaka
Forest Reserve in Kaduna, Nigeria. They used field observation, physical measurement of
harvested wood diameters, photographing reporting and farmers’ interviews. The data was
analyzed, by means of descriptive statistics in order to estimate the quantity of wood harvested
per day, week, month and year; as well as the sizes of harvested trees and the harvesting
method. The results showed that, a daily average of 91.9 tons of wood was harvested from the
forest and transported into Kaduna through various classes of vehicles. Approximately, about
15% of the harvested wood had a diameter of less than 5cm, 40% (5.1–10 cm), 14% (10.1–15
cm), 16% (15.1–20 cm) and 15% (> 20 cm). They revealed harvesters did not use any specific
scientific method of harvesting and the rate of regeneration and/or replacement planting trees
were below the rate of harvesting. They viewed the demand for fuel wood, poverty level, the
harvesting cost, and availability of fuel alternatives would affect the rate of wood harvesting.
They recommended that, Government at all levels, NGO, CBO should expand the forest and
at the same time put in place a sustainable method of harvesting. This support the intent of the
current study as fuel wood harvesters in the Northern Region of Ghana share similar
characteristics.
The study is limited in scope to fuel wood commercialization and households’ welfare in the
sampled districts in the Northern Region of Ghana. Improvements in income, households’
ability to increase their expenditure on basic goods and services and other basic measurements
of welfare are the intended idea of the study. In terms of relevance, the study sought to lay the
groundwork as the first study on fuel wood commercialization and households’ welfare in the
Northern Region of Ghana. There is large information gap in connection with fuel wood
commercialization documentation, policymakers seem not to fully regulate the activities of
harvesters and those engaged in income generating activities that demand regular fuelwood
use. It is also important to put out the impact of the shortages of fuel wood on those whose
livelihood heavily depended on fuel wood trade. These arguments thus, stressed the relevance
of this particular study.
METHODOLOGY
Area of study, Method of Data Collection and Analysis
This particular study was carried out in some selected districts in the Northern Region of
Ghana. The majority of the inhabitants in the region are involved in agriculture (GSS, 2010).
According to the Ghana Statistical Service (2010) extreme poverty prevalence is found to be
high in rural Savannah and the Northern region is acknowledged to have a rural population

International Journal of Energy and Environmental Research
Vol.4, No.3, pp.1-26, August 2016
___Published by European Centre for Research Training and Development UK (www.eajournals.org)
6 ISSN 2055-0197(Print), ISSN 2055-0200(Online)
(69.7%) and thus, poverty in the Northern Region is a notable rural phenomenon. The Northern
region is Ghana’s largest region regarding land area (70,384 square kilometres), accounting for
30 percent of the Ghana’s land mass. The 2010 census data showed that the total number of
household heads in the Northern region is 318,119, made up of 270,488 male heads and 47,631
female heads. The data further revealed about 74.0 percent of the people are in unskilled
agricultural, forestry and fishery.
The research was a survey aimed at employing quantitative analysis to study the households.
Using the Ghana Statistical Service (2010) data, we sampled six (6) districts with high rural
dependence on fuel wood as their main source of energy for domestic use. The districts
included the Chereponi, East Mamprusi, Sawla-Tuna-Kalba, Karaga, Gushegu, and
Bunkpurugu-Yunyoo. The districts selected were homogeneous in terms of income and
education. Collaborated from the initial pilot survey, harvesters of fuel wood mentioned the
aforementioned districts as the origin of harvested fuel wood. The other motivation regarding
the selected districts included: the district level poverty, market access for fuel wood, and
households access to the forest for fuel wood (See GSS, 2010).
The data for the study was primary data obtained through the use of structured questionnaire
to illicit information from selected respondents. The sample size for the study was 285 by the
statistical formula; 21
Nn
N
Where: n is the sample size; N (991.027) is the target population and the sample frame
(5%) is the error margin and the confidence interval is 95%.
A total of 47 households were sampled from each district. Houses were selected randomly and
households’ heads were interviewed. The study produced a response rate of 99 percent with
two protest cases. The data analysis therefore captured 280 respondents instead of 282
respondents.
21
Nn
N
Where: n is the sample size
N (991.027) is the target population and the sample frame
(5%) is the error margin and the confidence interval is 95%.
Information on the fuel wood types were stated in Dagbani for uniformity. Dagbani is the
dominant language in the Northern Region. In the various districts, we employed the services
of literate inhabitants to translate into the local dialect for questionnaire administration. The
data was collected by five (5) trained research assistants in addition to the author. The period
for the data collection was November 2014 to April, 2015. This was the dry season period in
which fuel wood commercialization was evident. The analysis were based on descriptive
statistics including frequency distribution and regression analysis was also undertaken. The
Coefficient of Variance and the Gini coefficient were introduced to determine inequality
existence among sampled districts.

International Journal of Energy and Environmental Research
Vol.4, No.3, pp.1-26, August 2016
___Published by European Centre for Research Training and Development UK (www.eajournals.org)
7 ISSN 2055-0197(Print), ISSN 2055-0200(Online)
Model Specification
This study proved to be novel as it combines the travel cost method of evaluation along with
regression and the adoption of the Coefficient of Variation as a measure of inequality in income
in the study areas.
Travel Cost Method
Travel cost (TC) methods depends on information about the amount of money and time people
expend to access the site for fuel wood and a value is inferred for the site. This study considered
the Individual Travel Cost Method (ITCM) as the preferred method used by environmental
economists for evaluation of fuel wood compared with the Zonal Travel Cost Method (ZTCM).
The individual travel cost method captures the consumer surplus of households (welfare
measurement). The study considered the travel cost method for the fuel wood
commercialization study because, fuel wood has a used value (See Arcadio, 2005). The
estimated model was the ordinary least regression as favoured by many researchers (Creel and
Loomis, 1990; Prayaga et al, 2004 and Twerefou and Ababio, 2012).
Empirical Model
Following Twerefou and Ababio (2012), a regression was adapted and modified to observe the
impacts of the control variables on the dependent variable. This model is the main trip
generation function used for the study. The empirical model therefore takes the form:
V = β0+β1TC+β2 Y+β3AG+β4 SX+β5 ED+β6 ImD +β7 MR+β8 Alt+ ε -------- (1)
Where: V= number of visits for fuelwood commercialization by each individual i (Household
head), β0= intercept of the trip generation function, TC= travel cost for fuelwood
commercialization by each individual household head (expressed in cedis per visit), Y =
income from fuel wood commercialization by each individual household head (expressed in
cedis) , AG = age of each individual household head (expressed in years), SX = is the sex of
each individual household head (express as: 1=male, 2= female), ED= highest level of formal
education by each individual household head (years), ImD = is the highest number of
immediate dependents by each individual household head, MR = marital status of each
individual household head, Alt = Knowledge about existence of alternative site by each
individual household head (expressed as a dummy: 1 for knowledge and 0 for otherwise), ε =
error term, to capture error in the dependent variable; i= 1, 2,….280 household head.
The above model (1) has to work in line with a prior expectations, theory and experience. These
offers reliability, objectivity and validity for results of the study. The measurement of the
variables are that, all the independent variables in the model should have negative relationship
(impact negatively) with the number of visits for fuel wood commercialization with the
exception of the sex and marital status of the respondents. The sex and marital status of the
respondents may take a positive or negative dimension depending on the motivation. The
economic motivation is that, a researcher is able to place a value on forest resources like fuel
wood which are often neglected in developing countries account for GDP as a measure of
economic prosperity.

International Journal of Energy and Environmental Research
Vol.4, No.3, pp.1-26, August 2016
___Published by European Centre for Research Training and Development UK (www.eajournals.org)
8 ISSN 2055-0197(Print), ISSN 2055-0200(Online)
Coefficient of Variation and GINI Coefficient
The Coefficient of variation is the ratio between the standard deviation and the mean and thus
represented in a percentage form. The Gini coefficient is a lump up numerical estimates of
inequality from a point of zero (0) (perfect equality) to one (1) (perfect inequality). The idea
behind these measures is to provide consistency of the observations within a sample districts
and participation in fuel wood commercialization to guarantee consistency. Both the coefficient
of variation and the Gini Coefficient are measures of inequality (See Todaro and Smith, 2011
Pp. 210).
They are good approximation of inequality as they satisfied the four (4) major criteria:
anonymity, scale of independence, population dependence, and transfer principle (Todaro and
Smith, 2011). The anonymity principle refers to measure of inequality without regard to who
has the higher income. Scale of dependence measure explains that, inequality should be based
on how income of the economy is measured or the manner in which is income in the economy.
Population independence considers measurement of inequality as not limited to only the
number of recipients and the transfer principle referred to as “Pigou-Dalton Principle”
espoused that, ceteris paribus, in relation to other incomes, if we transfer some amount of
income from the rich person (not so much to make him worse off) to a poor person, the
emanating new income distribution is more equal (Pareto optimal).
The above principles reinforce the wider acceptability of the coefficient of variance and Gini
coefficients to explain the variations among sampled districts, household’s income and
participation for fuel wood commercialization in the Northern Region of Ghana.
The study used the Lorenz curve as a basic approximation of inequality among the participated
sampled districts household heads earned income from fuel wood commercialization.
𝑠𝑡𝑎𝑛𝑑𝑎𝑟𝑑 𝑑𝑒𝑣𝑖𝑎𝑡𝑖𝑜𝑛
𝑀𝑒𝑎𝑛100=CV
For analysis, a lesser coefficient of variation for one district compared with higher coefficient
of variation of another district represent some amount of inequality in terms of the individual
household heads involved in commercialization of fuel wood in the Northern Region of Ghana.
Gini coefficient
The Gladman and Muchapondwa (2013) Gini coefficient was adapted to approximate how each
sampled district was represented.
𝑮 =𝟐𝒄𝒐𝒗 (𝒚,𝒓𝒚)
𝒏𝒚¯ ………… (2)
Where cov (y,ry) is the covariance in relation to income (y) and ranks of all individual
household heads according to income ranking (ry) from the poorest individual (rank = 1) to the
richest (ranks =N) . N is the total number of individuals and 𝑦¯ been the mean income.
RESULTS AND DISCUSSIONS
Summary statistics of household heads on fuel wood commercialization is explained. This
study used a structured questionnaire to obtain information from household heads. Therefore,

International Journal of Energy and Environmental Research
Vol.4, No.3, pp.1-26, August 2016
___Published by European Centre for Research Training and Development UK (www.eajournals.org)
9 ISSN 2055-0197(Print), ISSN 2055-0200(Online)
the axiom is that, information provided by the head is a true reflection of the household. A
household here according to this study refer to a person or group of persons who eat from the
same pot and dwell under the care of a head. Table 1 provides the characteristics of the
household heads in the sampled communities.
Table 1: Descriptive Statistics for Sampled
Households (Households Characteristics)
Variable Frequency Percent
N= 280
Sex:
Male
Female
88
142
31.4}
68.6}
Age:
20yrs-34yrs
35yrs-44yrs
45yrs-54yrs
55yrs +
21
82
126
51
7.5
29.3
45.0
18.20
Immediate
Dependents:
1
2
3
4
5
6 above
21
21
57
63
57
61
7.5
7.5
20.4
22.5
20.4
21.8
Marital Status:
Single
Married
Divorced/Separated
Widow/Widower
21
202
21
36
7.5
72.1
7.5
12.9
Highest Level of
Formal
Education:
None
Middle/JSS
SSS
232
29
19
82.9
10.4
6.8
Employment
Status:
Full time
Part time
Seasonal
187
49
44
66.8
17.5
15.7
Source: Field Survey, 2015
Table 1 depicts information on households’ characteristics which are: sex, age, immediate
dependents, marital status, highest level of formal education and employment status along with
their frequencies, percentage, mean, and standard deviation. The results has shown that,
International Journal of Energy and Environmental Research
Vol.4, No.3, pp.1-26, August 2016
___Published by European Centre for Research Training and Development UK (www.eajournals.org)
10 ISSN 2055-0197(Print), ISSN 2055-0200(Online)
88(31.4%) of the results were males and 192(68.6%) were females. The age of the respondents
showed that, 126 (45.0%) are in the age 45-54 actively engaged in fuel wood commercialization
in the selected districts. Predominantly, 202 (72.1%) of the married had approximately four (4)
immediate dependents and this is supported by the GSS (2010) data that, the rural households
have high population growth rates. The results evidently also show high number of respondents
without formal education 232 (82.9%). Therefore, due to lack of employable skills as many as
187 (66.8%) decided to engaged in fuel wood commercialization as a full time business and
few are involved in other part time businesses. In the case of dominance in the fuel wood
commercialization business, the results revealed that, women were domination in the business
and this result is supported by Tabuti et al (2003) study which opined that, women are
dominating in fuel wood business.
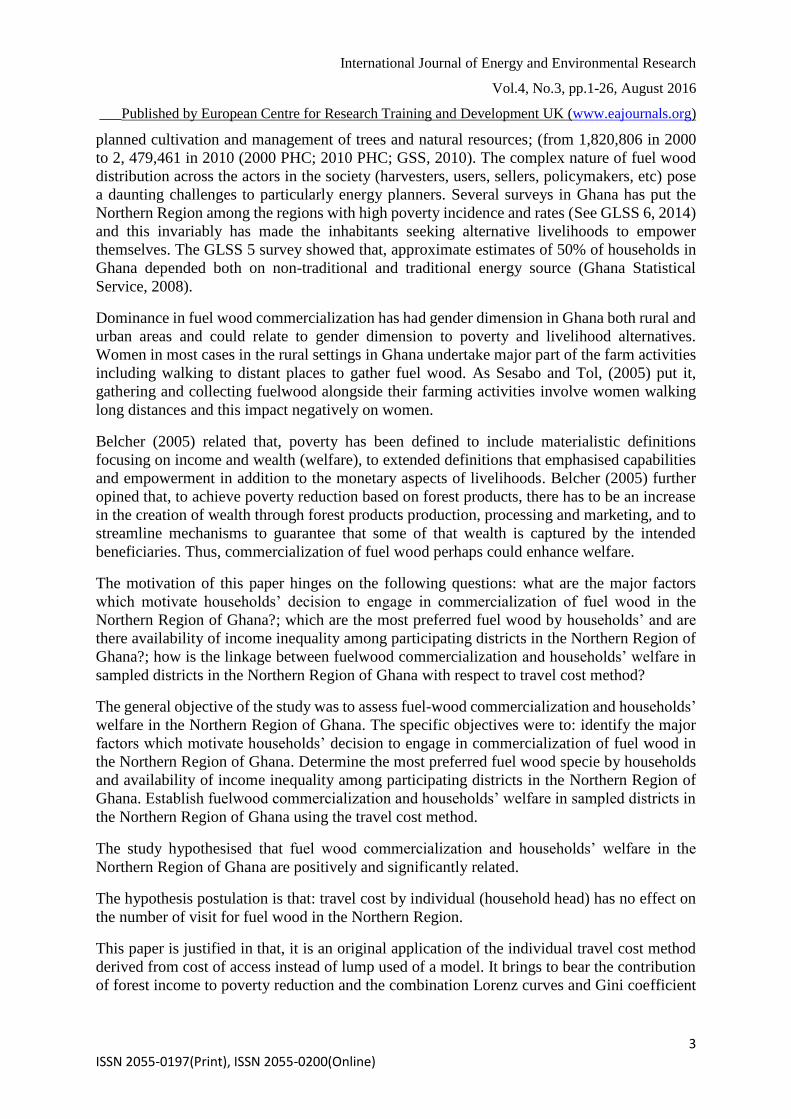
Sustainable harvest and Commercialization of Fuel wood
The study implicitly asked a sustainable implication of fuel wood harvest for
commercialization to collaborate the literature. The results in Table 2 was a cross tabulation
between the type of fuel wood harvested and the main source in which they harvest their fuel
wood.
Table 2: Harvesting and Sustainability
Main source of
obtaining fuel wood
Total
open
vegetatio
n
farm
gathering
Type of fuel
wood
harvested
dead dry trees 167 19 186
over aged trees 94 0 94
Total 261 19 280
Source: Field Survey, 2015
From the results on table 2, the main source that the sampled households obtained their fuel
wood was from open vegetation, 261 (93.2%). The trees they harvested for fuel wood was
mainly dead dry trees as shown on the table 186 (66.4%). With these two cross tabulation, there
exist a sustainability harvest idea in that, even though, the inhabitants harvested from open
vegetation which was obvious from the results, they were mindful to harvest significantly dead
dry trees. The study also related that, they also harvested over aged trees, 186 (33.6%) which
in terms of regeneration may not have been possible. The results on the table revealed
community members do obey the directives of the local authorities not to harvest wet standing
trees. The results regarding the implied sustainability harvesting is supported by Manyatsi and
Hlophe (2010). Many households perhaps would in future continue to be involved in fuel wood
commercialization owing to the fact that, it is an open access resources and not from the few
restricted forested areas in the Northern Region. In addition, fuel wood harvested are dead/dry
trees and household heads believed that, fuel wood harvested from restricted forested sites is
not a major challenge.

International Journal of Energy and Environmental Research
Vol.4, No.3, pp.1-26, August 2016
___Published by European Centre for Research Training and Development UK (www.eajournals.org)
11 ISSN 2055-0197(Print), ISSN 2055-0200(Online)
Factors that motivate Household heads to engaged in fuel wood commercialization
The study investigated the major factors which motivated sampled households to engage in
fuel wood commercialization as a business entity. Some of the sampled district had no major
forest and therefore existence of trees were few. Relying on this, thus triggered the question of
motivational factors. The distribution of the responses from the sampled household heads are
shown in figure 1.
Figure 1: Major factors Motivating Households Decision to engage in Fuel wood
Commercialization
Source: Field Survey, 2015
The results from Figure 1 showed that, 240 (85.7%) of the respondents said that, income
generation has been the reason for them engaging in fuel wood commercialization. Even
though, they had other non-fuel wood occupations and the income from fuel wood
commercialization is higher than other sources. Whereas 21(7.5%) said unemployment was a
factor which motivated them to engaged in fuel wood commercialization, and remaining 19
(6.8%) attributed their involvement in the business to seasonal nature of faming activities. This
result confirms the Ghana Statistical Service data (2010) and the GLSS 6 data (See GLSS 6,
2014).
As Tabuti et al (2003) noted, because households considered fuel wood to be available so they
easily involved in commercial activity related to fuel wood. The households however, have
preferences regarding the fuel wood they harvest for commercial purposes. The implication of
the figure 1 is that, household heads go into fuel wood commercialization due to income.
Composition of sampled Households Income
Respondents were asked to provide information regarding the main sources of their incomes.
This was to provide explanation regarding the composition of incomes from the sampled
districts. The responses are shown in Table 3.
240(85.7%)
21(7.5%) 19(6.8%)
0
50
100
150
200
250
300
income unemployment seasonality of farming
Motivation for Fuel wood Commercialization

International Journal of Energy and Environmental Research
Vol.4, No.3, pp.1-26, August 2016
___Published by European Centre for Research Training and Development UK (www.eajournals.org)
12 ISSN 2055-0197(Print), ISSN 2055-0200(Online)
Table 3: Source of Income for households
Frequency Percent
fuel wood 156 55.7
charcoal 60 21.4
hunting 31 11.1
Forest plant foods 33 11.8
Total 280 100.0
Source: Field Survey, 2015
Sources of income for households as shown in Table 3, proved that, majority of the sampled
households 156 (55.7%) obtained their income from fuel wood commercialization and the least
been proceeds from hunting. The results are further supported by empirical evidence that,
households do not only depend on fuel wood but other environmental resources for survival
(see Gladman and Muchapondwa, 2013; Kabubo-Mariara and Gachoki, 2008). This explained
the diversification of forest income (Vedeld et al., 2004; Angelsen and Wunder, 2003 cited in
Kabubo-Mariara, 2008).
Determinants of the most preferred fuel wood by household heads and income inequality
among districts.
(a)The study intended to find out which fuel wood species was preferred by sampled
households as a fuel wood for commercial purposes and the results are shown in the Table 4.
**** Ethnobotanical transcriptions sources are from Roger (2006)
Source: Field Survey, 2015
As one of the objective of the study was to investigate which of the tree species were preferred
by sampled households. This objective was necessitated to draw conclusion regarding SADA
Afforestation programme. The results showed that “Tanga”, popular among the sampled
locality, was the most preferred tree species for fuel wood with 113 (40.4%). This particular
tree, until recently, has been a fruit tree which has not been cultivated. It was often regarded as
a “wild” plant in the Northern Region. Currently, the interest of policymakers in making this
Frequency Percent
Nee(Pterocarpus erinaceus) 25 8.9
Korli (Terminalia avicennioides) 30 10.7
Kpariga(Heteranthera callifolia) 42 15
Sampeega(Crossopteryx
febrifuga) 21 7.5
Langena(Prospis africana) 34 12.1
Tanga(Vitellaria paradoxa) 113 40.4
other 15 5.4
Total 280 100
Tree Specie
Table 4: Preferred Fuel wood Harvested
International Journal of Energy and Environmental Research
Vol.4, No.3, pp.1-26, August 2016
___Published by European Centre for Research Training and Development UK (www.eajournals.org)
13 ISSN 2055-0197(Print), ISSN 2055-0200(Online)
tree which bores the shear nut an export commodity is worrying. The reasons is that, this
particular tree has a long gestation period and yet it is regarded as a preferred tree for fuel
wood. As Njiti and Kemcha (2007) explained that, household heads preferred fuel wood are
exploited when they have good attribute of good flame and gradual burn. This was explained
as good reason for increase consumer demand for a particular species.
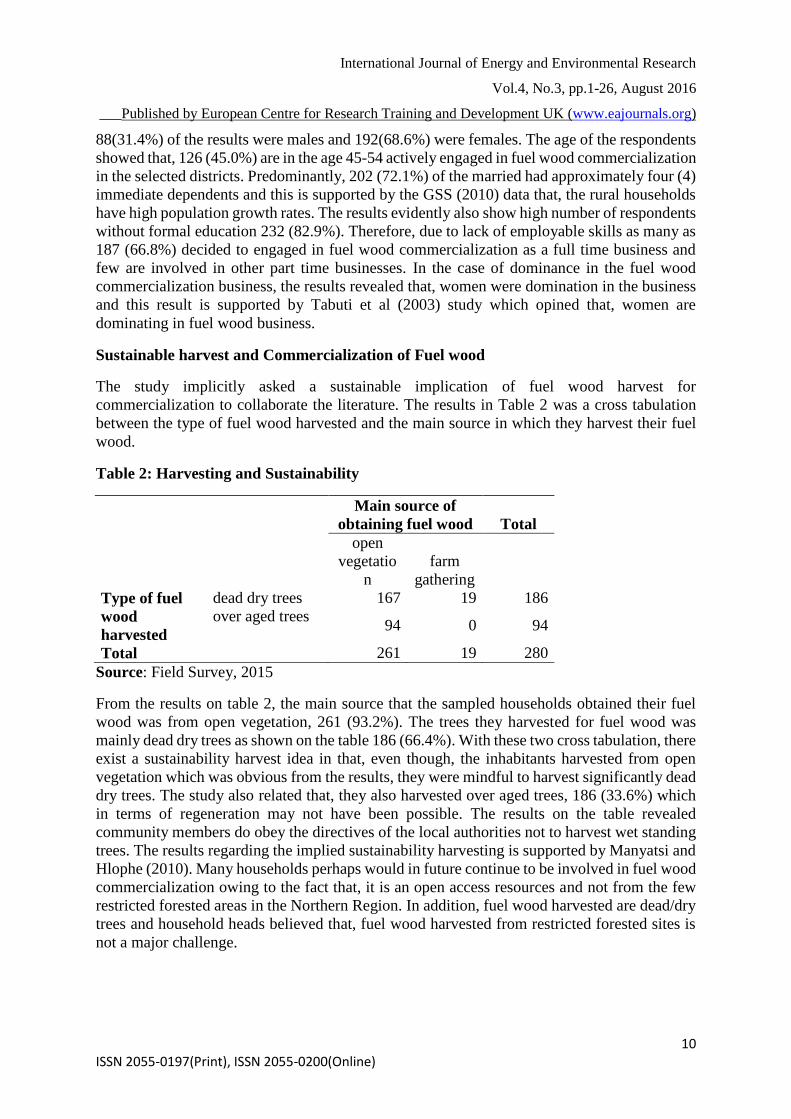
(b) Income inequality and variation of income within the districts
The study investigated the participation rates and the income earned from fuel wood
commercialization among sampled household heads in the districts. The aim of this
investigation was to make an inference regarding different rate of fuel wood commercialization
and the benefit of fuel wood commercialization to household heads in each specific district.
Figure 2: Inequality among sampled districts’ on fuel wood commercialization
Source: Field Survey, 2015
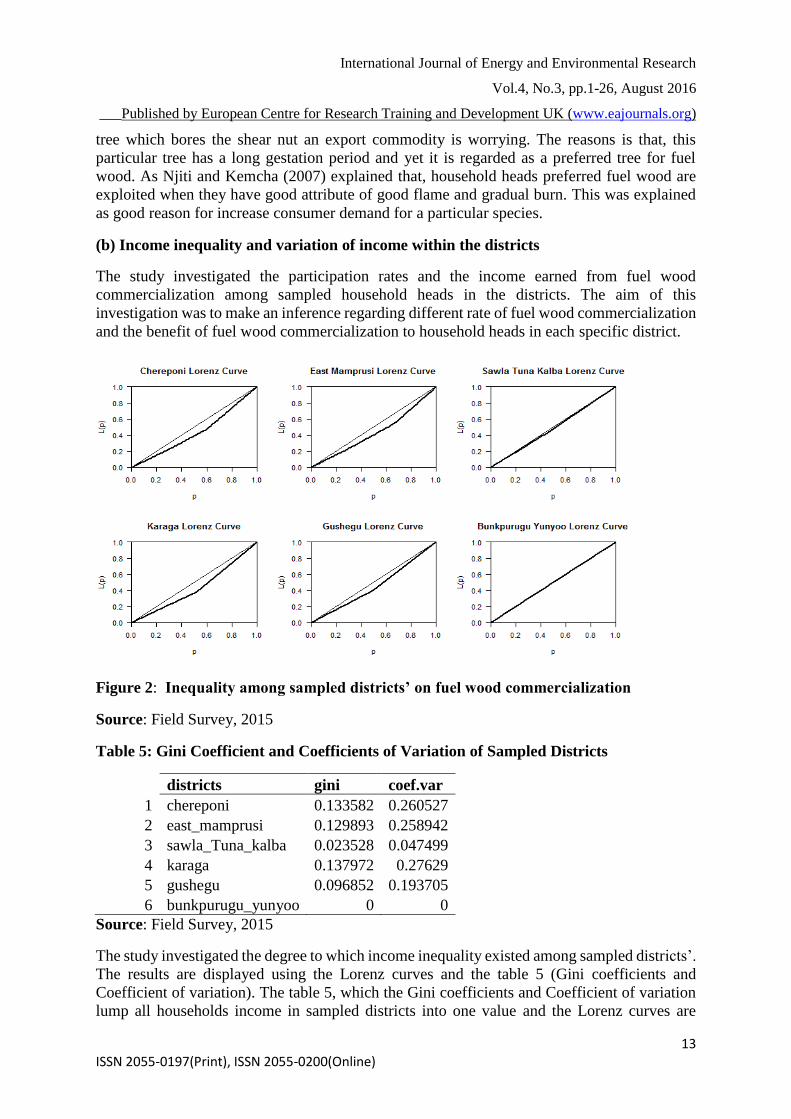
Table 5: Gini Coefficient and Coefficients of Variation of Sampled Districts
districts gini coef.var
1 chereponi 0.133582 0.260527
2 east_mamprusi 0.129893 0.258942
3 sawla_Tuna_kalba 0.023528 0.047499
4 karaga 0.137972 0.27629
5 gushegu 0.096852 0.193705
6 bunkpurugu_yunyoo 0 0
Source: Field Survey, 2015
The study investigated the degree to which income inequality existed among sampled districts’.
The results are displayed using the Lorenz curves and the table 5 (Gini coefficients and
Coefficient of variation). The table 5, which the Gini coefficients and Coefficient of variation
lump all households income in sampled districts into one value and the Lorenz curves are

International Journal of Energy and Environmental Research
Vol.4, No.3, pp.1-26, August 2016
___Published by European Centre for Research Training and Development UK (www.eajournals.org)
14 ISSN 2055-0197(Print), ISSN 2055-0200(Online)
produced from the same data to approximate inequality dominance among sampled districts.
The majority of the sampled districts showed inequality within a district as regarding income
earned from fuel wood commercialization. It is Bunkpurugu Yunyoo district which happens to
have perfect equality on income distribution on participation for fuel wood commercialization.
This is followed by Sawla Tuna Kalba district with marginal inequality. The study
demonstrated that, households are able improve their wellbeing from fuel wood
commercialization despite the inequality among sampled households in the district. What is
interesting is that, studies on income inequality in Ghana, have not so much integrated the
important role fuel wood income and thus left out of policy. Gladman and Muchapondwa
(2013) collaborated this study when, they opined that, environmental resource use impacts on
inequality reduction in income and yet has not been much appreciated by policymakers.
Fuelwood commercialization and households’ welfare using the travel cost method.
Forest has played immeasurable role in sustaining world population. Because of this important
role forest play to humankind, a lot of people found life in it (See MEA, 2005). In exploring
the linkage between fuel wood commercialization and household heads welfare, and thus
answers the hypothesis that travel cost by household heads has no effect on the number of visit
for fuel wood the study used the travel cost method.
Table 6: Derivation of Individual Visit
Average
Travel
Distance
(KM)
1
Frequency
2
Relative
Frequency
(%)
3
Target
Population
4
Visit Per
Year
5
Travel
Cost Per
Visit
6
Individual
Visit
7
1 7 2.50 25 133 2.30 5.30
3 36 12.86 127 900 3.00 7.10
7 111 39.64 393 7881 3.70 20.10
10 88 31.43 311 3872 4.30 12.50
12 29 10.36 103 2639 4.80 25.60
15 9 3.21 32 270 5.30 8.40
Total 280 100.00 991.027 15,695
***Individual Visitation = visits per year divided by population in each category
***Target Population size = Population of household heads in the sampled districts
(991.027).
Source: Field Survey, 2015
The derivation of the individual visitation from table 6 above stemmed from visits per year
over the population in each category who traveled for fuel wood. The derivation is supposed
to offer the insight into how sampled individuals made visit for fuel wood when access to the
forested sites are free. As the travel cost to the site increases, the study observed a reduction in
the number of visit for fuel wood, even though there exist a mixed results.
The pattern as observed above is responding to the law of demand that, the higher the price,
the lower the quantity demand, and holding other factors constant (the other computational

International Journal of Energy and Environmental Research
Vol.4, No.3, pp.1-26, August 2016
___Published by European Centre for Research Training and Development UK (www.eajournals.org)
15 ISSN 2055-0197(Print), ISSN 2055-0200(Online)
processes are obtained in the appendices). The results of expected visit from various scenario
are shown in Tables 7-9.
Table 7: Expected Visit I (Cost of Access GH ₵ 5.30)
Average
Travel
Distance (KM)
1
Target
Population
2
Travel Cost
+Cost of
Access of GH ₵
5.30
3
Visit Rate
4
Expected Visit
with cost of
access
introduction
5
1 25 7.60 0 0
3 127 8.30 1.80 229
7 393 9.00 14.80 5816
10 311 9.60 7.20 2239
12 103 10.10 20.30 2091
15 32 10.60 3.10 99
Total 991.027 10,474
Source: Field Survey, 2015
Table 8: Expected Visit II (Cost of Access GH ₵ 10.00)
Average
Travel
Distance (KM)
1
Target
Population
2
Travel Cost
+Cost of
Access of GH ₵
10.00
3
Visit Rate
4
Expected Visit
with cost of
access
introduction
5
1 25 12.30 0 0
3 127 13.00 0 0
7 393 13.70 10.10 3969
10 311 14.30 2.50 778
12 103 14.80 15.60 1607
15 32 15.30 0 0
Total 991.027 6,354
Source: Field Survey, 2015
Table 9: Expected Visit III (Cost of Access GH ₵ 25.00)
Average
Travel
Distance (KM)
1
Target
Population
2
Travel Cost
+Cost of
Access of GH ₵
10.00
3
Visit Rate
4
Expected Visit
with cost of
access
introduction
5
1 25 27.30 0 0
3 127 28.00 0 0
7 393 28.70 0 0
10 311 29.30 0 0
12 103 29.80 0.60 62
International Journal of Energy and Environmental Research
Vol.4, No.3, pp.1-26, August 2016
___Published by European Centre for Research Training and Development UK (www.eajournals.org)
16 ISSN 2055-0197(Print), ISSN 2055-0200(Online)
15 32 30.30 0 0
Total 991.027 62
Source: Field Survey, 2015
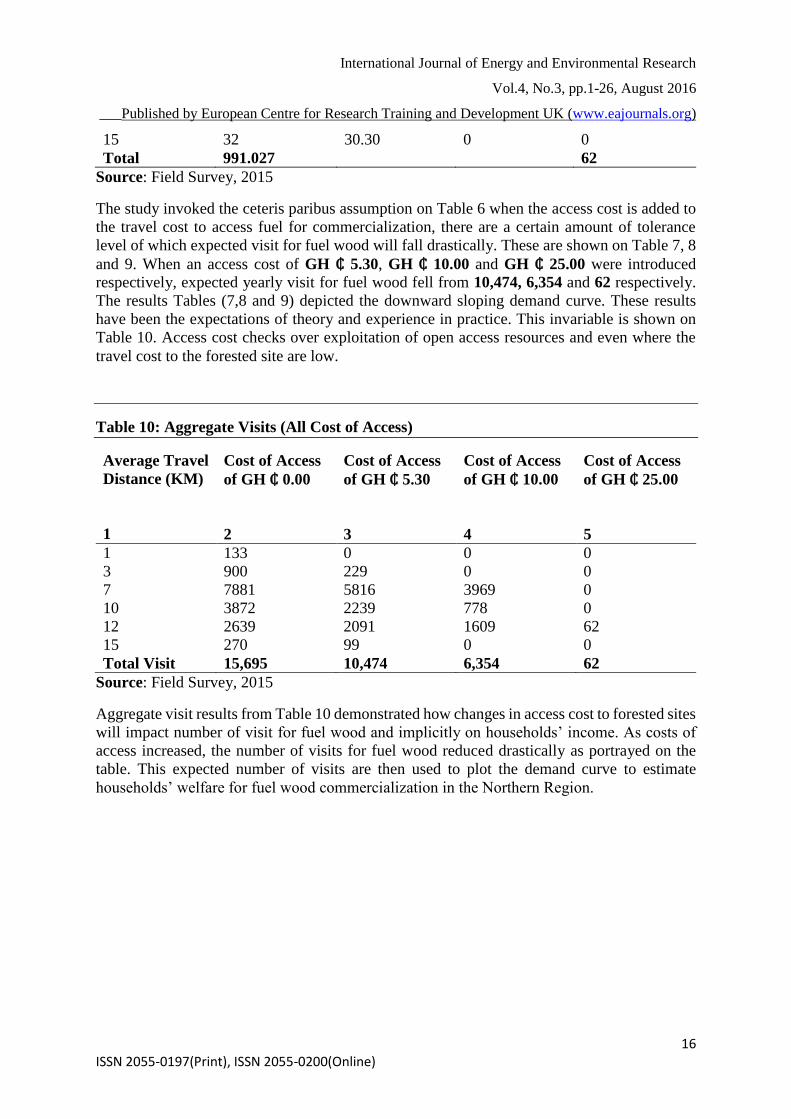
The study invoked the ceteris paribus assumption on Table 6 when the access cost is added to
the travel cost to access fuel for commercialization, there are a certain amount of tolerance
level of which expected visit for fuel wood will fall drastically. These are shown on Table 7, 8
and 9. When an access cost of GH ₵ 5.30, GH ₵ 10.00 and GH ₵ 25.00 were introduced
respectively, expected yearly visit for fuel wood fell from 10,474, 6,354 and 62 respectively.
The results Tables (7,8 and 9) depicted the downward sloping demand curve. These results
have been the expectations of theory and experience in practice. This invariable is shown on
Table 10. Access cost checks over exploitation of open access resources and even where the
travel cost to the forested site are low.
Table 10: Aggregate Visits (All Cost of Access)
Average Travel
Distance (KM)
1
Cost of Access
of GH ₵ 0.00
2
Cost of Access
of GH ₵ 5.30
3
Cost of Access
of GH ₵ 10.00
4
Cost of Access
of GH ₵ 25.00
5
1 133 0 0 0
3 900 229 0 0
7 7881 5816 3969 0
10 3872 2239 778 0
12 2639 2091 1609 62
15 270 99 0 0
Total Visit 15,695 10,474 6,354 62
Source: Field Survey, 2015
Aggregate visit results from Table 10 demonstrated how changes in access cost to forested sites
will impact number of visit for fuel wood and implicitly on households’ income. As costs of
access increased, the number of visits for fuel wood reduced drastically as portrayed on the
table. This expected number of visits are then used to plot the demand curve to estimate
households’ welfare for fuel wood commercialization in the Northern Region.

International Journal of Energy and Environmental Research
Vol.4, No.3, pp.1-26, August 2016
___Published by European Centre for Research Training and Development UK (www.eajournals.org)
17 ISSN 2055-0197(Print), ISSN 2055-0200(Online)
Source: Field Survey, 2015
The demand curve for fuel wood commercialization expresses the various total visits and their
access costs. The figure slopes downward from left to right, signaling that, an increase in access
cost leads to decrease to the number of visit for fuel wood. The study estimated the households’
welfare (total consumer surplus) by integrating under the demand curve (Mehmet and
Mustapha, 2006) or simply one divided by the coefficient of the travel cost (Twerefou and
Ababio, 2012).
The study computed the household heads welfare (total consumer surplus) to be GH₵ 142,985.
The value computed is the total welfare of all sampled households who engaged in fuel wood
commercialization. This becomes an implied opportunity cost for households in which they
must sacrifice something to obtain this value. The implication here is that, if there is a
government policy or an externality which makes this value (GH₵ 142,985) unavailable, the
household heads will be worst off by that amount of consumer surplus.

International Journal of Energy and Environmental Research
Vol.4, No.3, pp.1-26, August 2016
___Published by European Centre for Research Training and Development UK (www.eajournals.org)
18 ISSN 2055-0197(Print), ISSN 2055-0200(Online)
TABLE 11. MODEL’S REGRESSION RESULT
VARIABLES PARAMETER
VALUES
(COEFFICIENTS)
STANDARD
ERRORS
P-VALUES (Sig.)
(Constant) 1.956 0.494 0.000
Travel cost to
harvest fuel wood
-0.410 0.066 0.000
Level of yearly
income of
respondents
0.306 0.036 0.000
Age of respondents -0.440 0.045 0.000
Sex of respondents 1.027 0.118 0.000
Highest level of
formal education
-1.758 0.104 0.000
Number of
immediate
dependents
0.320 0.029 0.000
Marital status of
respondents
-0.637 0.057 0.000
Knowledge of
substitute site
-0.885 0.149 0.000
R Square 95%
Adjusted R Square 94%
Durbin-Watson 1.883
a. Dependent Variable: number of visitation for fuel wood
**significant at 5%
Source: Field Survey, 2015
V = 1.956-0.410TC+0.306 Y-0.440AG+1.027 SX -1.758ED +0.320 ImD -0.637MR -0.885Alt
The model’s result as shown in the table 11 provide the coefficients, the standard error and the
P-values. The p-values were all significant and imply the robustness of the model. The study
postulated the directions of all the variables with the exception of sex of respondents and
marital status. The results revealed that, travel cost (-0.410) to the forested sites negatively
related to the number of visits for fuel wood. In that, increased in travel cost will deter
households from increasing their visit rates. In terms of fuel wood demand theory, the
expectation is that, as households’ income increases, they tend to reduce fuel wood demand,
however, in the case of fuel wood commercialization, an increase in income serves as a
motivation for households to continue the harvest process (holding other factors constant). This
income result (0.306) from the table showed a positive relationship with the number of visits
for fuel wood. The result of the age of the respondent (-0.440) was negative and this was
expected, because as an individual ages, the strength reduces and since the harvest require the
physical strength, the said individual will reduce the number of visit. The sex of the respondent
(1.027) from the study was positive. The data coding process adopted, male =1 and female =
2, in addition, the results showed women were dominating in fuel wood commercialization in
International Journal of Energy and Environmental Research
Vol.4, No.3, pp.1-26, August 2016
___Published by European Centre for Research Training and Development UK (www.eajournals.org)
19 ISSN 2055-0197(Print), ISSN 2055-0200(Online)
the sampled districts. Therefore, the tendency for women according to data to be involved in
fuel wood commercialization is very high.
The highest level of education (-1.758) had a negative relationship with the number of visits
for fuel wood. The interpretation is that, educated people among the sampled households
perhaps tend to have more knowledge about forest conservation and preservation and therefore
will reduce their number of visit for fuel wood. In addition, higher education provide potential
for increase in income and therefore less dependence on forest income. The higher the number
of immediate dependents (0.320) the more likely would be an increase in the number of visits
for fuel wood. This indeed showed there is a positive correlation. Both the marital status and
the knowledge of availability of substitute were negative; -0.637 and -0.885 respectively. The
coefficient was negative. This could be explained that, married people have limitations as to
the number of times they could visit forested site because of other family demands. The result
of the knowledge of availability of alternative site was also negative. Empirically, Twerefou
and Ababio (2012) study supported the results of all the dependents variables with the
exception of the number of immediate dependents, even though the application of the
methodology differs.
Hypothesis
Ho: Travel cost by individual (household head) has no effect on the number of visit for fuel
wood in the Northern Region.
H1: Travel cost by individual (household head) has effect on the number of visit for fuel wood
in the Northern Region.
The study revealed that, increased in travel cost which includes the opportunity cost of time
has a negative impact on the number of visits for fuel wood at a 5% error level and ultimately
the livelihood of sampled household heads. At the same time, an increase in cost of access for
fuel wood impacted negatively on fuel wood commercialization. From the aforementioned
intuition, and the hypothesis stated, the study therefore reject the null hypothesis which stated
that, travel cost has no effect on the number of visits for fuel wood. In addition, the coefficient
of the travel cost is negative and therefore, the study rejected the null hypothesis and accepted
the alternative hypothesis.
CONTRIBUTION OF STUDY
This particular study has been a novel in environmental and development economics literature
and an original contribution to the travel cost methodology. This contribution emanated from
the fact that, in empirical literature, the estimation of travel cost is most often by regression
estimation, however, this study has provided a step- by- step data disaggregation process to
estimate the travel cost method. In addition, the study obtained a construct which is based on
the data to explain the marketing processes of fuel wood. Lastly, the study combined three
approaches (travel cost method, Gini coefficient and the Coefficient of variation) for this
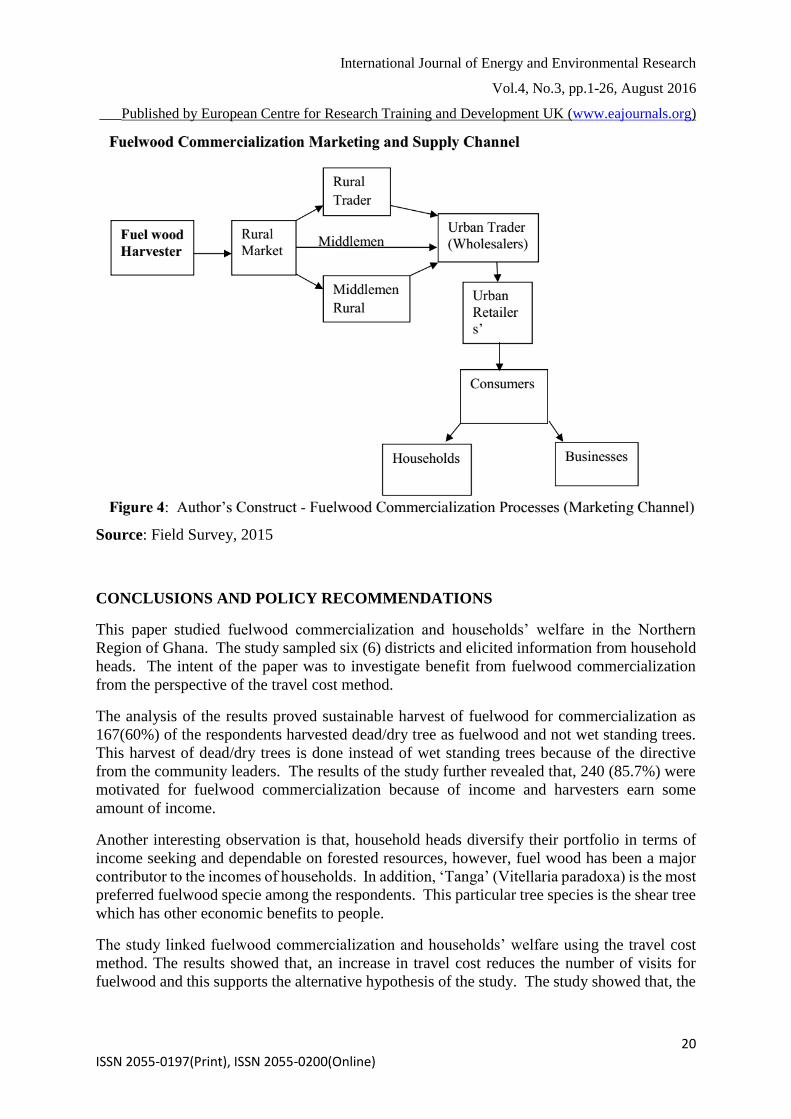
particular study. The study revealed the following channel of fuel wood commercialization
marketing and supply.
International Journal of Energy and Environmental Research
Vol.4, No.3, pp.1-26, August 2016
___Published by European Centre for Research Training and Development UK (www.eajournals.org)
20 ISSN 2055-0197(Print), ISSN 2055-0200(Online)
Source: Field Survey, 2015
CONCLUSIONS AND POLICY RECOMMENDATIONS
This paper studied fuelwood commercialization and households’ welfare in the Northern
Region of Ghana. The study sampled six (6) districts and elicited information from household
heads. The intent of the paper was to investigate benefit from fuelwood commercialization
from the perspective of the travel cost method.
The analysis of the results proved sustainable harvest of fuelwood for commercialization as
167(60%) of the respondents harvested dead/dry tree as fuelwood and not wet standing trees.
This harvest of dead/dry trees is done instead of wet standing trees because of the directive
from the community leaders. The results of the study further revealed that, 240 (85.7%) were
motivated for fuelwood commercialization because of income and harvesters earn some
amount of income.
Another interesting observation is that, household heads diversify their portfolio in terms of
income seeking and dependable on forested resources, however, fuel wood has been a major
contributor to the incomes of households. In addition, ‘Tanga’ (Vitellaria paradoxa) is the most
preferred fuelwood specie among the respondents. This particular tree species is the shear tree
which has other economic benefits to people.
The study linked fuelwood commercialization and households’ welfare using the travel cost
method. The results showed that, an increase in travel cost reduces the number of visits for
fuelwood and this supports the alternative hypothesis of the study. The study showed that, the

International Journal of Energy and Environmental Research
Vol.4, No.3, pp.1-26, August 2016
___Published by European Centre for Research Training and Development UK (www.eajournals.org)
21 ISSN 2055-0197(Print), ISSN 2055-0200(Online)
total consumer surplus (household heads welfare) was GH¢142,985 annually. Furthermore,
the regression results for the study generally supported a prior expectation.
The major conclusion drawn from the study is that, fuelwood commercialization at the study
areas contributed significantly to poverty reduction and welfare enhancement and a major
safety net; and that, the activity is sustainability and environmental friendly.
From policy recommendations, the findings does rely on the fact that, fuelwood
commercialization can potential move inhabitants of the Northern Region above the poverty
line as shown in the data. A policy intervention aimed at deliberate cultivation of forest for
fuelwood either from government, non-governmental organization or international donors
would better the lives of the people.
The accessed lands in the areas were mainly open vegetation, and harvesters did not need any
training to harvest, therefore, forest management and conservation strategies must be given a
serious attention within these areas by the forest commissions. Finally, policies put in place to
prevent or limit fuel wood commercialization should be done away, as the study has revealed
that, their activity do not cause any environmental degradations.
REFERENCES
Aabeyir, R., Quaye-Ballard, J. A., Van -Leeuwen, L. M. and Oduro, W. (2011). Analysis of
Factors Affecting Sustainable Commercial Fuelwood Collection in Dawadawa and
Kunsu in Kintampo North District of Ghana. The IIOAB Journal,
Amuah, N. E. E. H. (2011). The potential of Agroforestry in fuelwood production for
Domestic and income Generation Activities – A case study of three communities in the
Sunyani District of the Brong Ahafo Region, Ghana. Thesis, Kwame Nkrumah
University of science and Technology, Kumasi, Ghana.
Anang, B.T., Margret, A. A., and Aaron, A.A. (2011). Charcoal production in Gushegu
District, Northern Region, Ghana: Lessons for sustainable forest management.
International Journal of Environmental Sciences, Volume 1, No 7, 2011.
Angelsen, A., and Wunder, S. (2003).'Exploring the forest-poverty link: key concepts, issues
and research implications'. CIFOR Occasional Paper No. 40, Bogor, Indonesia: Center
for International Forestry Research.
Arcadio, C. (2005).Valuing Environmental and Natural Resources: ‘An introduction to the
Econometrics of Non-Market-ICPT’, Trieste, Italy.
Arnold, J. E. M., G. Kohlin and R. Persson (2006) 'Wood fuels, Livelihoods, and
Policy
Arnold, J. E. M., G. Kohlin and R. Persson (2006). 'Wood fuels, Livelihoods, and
Policy
Azeez, F. A., Ajayi C. A., Olarewaju T. O., Nosiru M. O., Farinola L. A.. The Utilization
Pattern and Economic Evaluation of Fuelwood Enterprise: A Case Study of Some Areas
in Ibadan Metropolis, Oyo State. International Journal of Agriculture, Forestry and
Fisheries. Vol. 2, No. 6, 2014, pp. 91-95.
Belcher, B., M. Ruiz-Perez and R. Achdiawan (2005). 'Global Patterns and Trends in the
Use and Management of Commercial NTFPs: Implications for Livelihoods and
Belcher, B.M. (2005). Forest Product Markets, Forests and Poverty Reduction. Paper
prepared for presentation at the “Forests, Wood and Livelihoods: Finding a Future for

International Journal of Energy and Environmental Research
Vol.4, No.3, pp.1-26, August 2016
___Published by European Centre for Research Training and Development UK (www.eajournals.org)
22 ISSN 2055-0197(Print), ISSN 2055-0200(Online)
All” conference conducted by the Crawford Fund for International Agricultural
Research, Parliament House, Canberra, Australia, August 16, 2005.
Bensel, T. (2008). Fuelwood, deforestation, and land degradation: 10 years of evidence
from cebu province, the Philippines. Land Degradation & Development, 19(6): 587-
605.
Cavendish, W. (2000). Empirical regularities in the poverty-environment relationship of
rural households: Evidence from Zimbabwe. World Development, 28, 1979–2003.
CIFOR (2009). Simply REDD. CIFOR’S guide to forests, climate chande and REDD.
Conservation', World Development 33(9): 1435-1452.
Creel, M.D. and Loomis (1990).Theoretical and empirical advantages of truncated count data
estimators for analysis of deer hunting in California. American Journal of Agricultural
Economics, 72 (2), 434-441.
Eco-discipline: http://www.eco-discipline.com/eco-discipline/2012
Energy Commision, Ghana (2006). Strategic National Energy Plan-Energy Demand sectors
of the Economy-Annex One of Four.
FAO's approach to support national forest assessments for Country Capacity
Building - Kotka IV: Expert Consultation on Global Forest Resources Assessments –
Linking National and International efforts. Kotka, Finland, 1-5 July 2002 - Background
paper 6.6
Fisher, M., (2004). Household welfare and forest dependence in Southern Malawi.
Environment and Development Economics, 9(2):135-154.
Fu, Y., Chen, J., Guo, H., Chen, A., Cui, J., and Hu, H (2009) “The role of non‐timber
forest products during agroecosystem shift in Xishuangbanna, southwestern China.
Forest Policy and Economics 11 (2009) 18–25
Ghana Private Road and Transport Union (2015). Currents Lorry Fares in the Tamale
Metropolitan Area. April.
Ghana Statistical Service (2000): Population and Housing Census.
Ghana statistical Service (2008, 2014). Ghana living standards survey report of the fifth and
sixth round (GLSS 5, 6), Accra.
Gladman, T. and Muchapondwa, E. (2013). Dependence on Environmental Resources and
Implications for household Welfare: Evidence from the Kalahari Drylands, South Africa.
ERSA Working Paper 370.
IFAD : Rural Poverty Report (2001). The Challenge of Ending Rural Poverty International
Fund for Agricultural Development, Rome.
Interventions: Changing Perspectives', World Development 34(3): 596-611.
Interventions: Changing Perspectives', World Development 34(3): 596-611.
John, H. A., Gerald, S. and Arild, A. (2013). Charcoal production and household welfare in
Uganda: a quantile regression approach. Environment and Development Economics, 18,
pp 537-558 doi: 10.1017/ S1355770X1300017X
Kabubo-Mariara,J. and Gachoki, C. (2008). Forest Dependence and Household Welfare:
Empirical Evidence from Kenya. CEEPA Discussion Paper Series, ISBN: 1-920160-01-
09.
Kiflu, H., Mats, S. and Kaba, U. (2009). Wood Fuel Demand and Sustainability of Supply in
South-Western Ethiopia, Case of Jimma Town. Research Journal of Forestry, 3: 29-42.
Kuunibe N, Issahaku H, Nkegbe P. K. (2013). Wood Based Biomass Fuel Consumption in
the Upper West region of Ghana: implications for environmental sustainability formal
of sustenance Development studies 3(2):181-198.

International Journal of Energy and Environmental Research
Vol.4, No.3, pp.1-26, August 2016
___Published by European Centre for Research Training and Development UK (www.eajournals.org)
23 ISSN 2055-0197(Print), ISSN 2055-0200(Online)
Manyatsi,A.M. and Hlophe, E.T. (2010). Contribution of Sale of Firewood Towards Rural
Livelihood in Swaziland, and its Environmental Sustainability. Current Research
Journal of Social Sciences 2 (4): Pp 226-232, ISSN: 2041-3246, Maxwell Scientific
Organization.
Mehmet, P. and Mustafa, F.T. (2006). Estimation of Recreational Use Value of Forest
Resources by Using Individual Travel Cost and Contingent Valuation Methods.
Journal of Applied Sciences 6 (1):1-5, 2006.
MILLENNIUM ECOSYSTEM ASSESSMENT (2005). Ecosystems and Human Well-Being:
Global Assessment Reports. Http://www.millenniumassessment.org/
Njiti, C.F. and Kemcha, G.M. (2003). Survey of fuel wood and service wood production and
consumption in the Sudano-Sahelian region of Central Africa: The case of Garoua,
Cameroon and its rural environs. In Savanes Africaines: Des Espaces en Mutation, des
Acteurs Face à de Nouveaux Défis. Actes du Colloque; Cirad-Prasac: Garoua,
Cameroun.
Prayaga, P., John, R. and Jack, S. (2004). Using the Travel Cost Method to Estimate the Value
of Special Events in Regional Areas. Melbourne, Australia.
Roger, B. (2006). Dagomba Plants Names-Preliminary Circulation Draft for Comment,
United Kingdom.
Sesabo, J.K. and Tol, R.S. (2005). Factors affecting Income Strategies among households in
Tanzanian Coastal Villages: Implications for Development-conservation initiatives,
Research unit Sustainability and Global Change, Hamburg University. Available at:
http://ideas.repec.org/p/sgc/wpaper/70.html [Accessed February 1, 2011].
Tabuti, J.R.S, K.A. Lye and S.S. Dhillion (2003). Fuelwood use in Bulamogi County,
Uganda: Species harvested and consumption patterns. Biomass & Bioenergy, 25: 581-
596.
Taiye, O. A. & Emmanuel, A. O. (2015). Sustainability of Fuel Wood Harvesting from Afaka
Forest Reserve,Kaduna State, Nigeria. Journal of Agricultural Science; Vol. 7, No. 1;
2015, ISSN 1916-9752 E-ISSN 1916-9760, Published by Canadian Center of Science
and Education..
Todaro, M.P. and Smith,S.C. (2011). Economics Development, 7th Edition, Pearson
Publishing.
Twerefou, D.K and Ababio, D. K. A. (2012). An economic valuation of the Kakum National
Park: An individual travel cost approach. African Journal of Environmental Science and
Technology Vol. 6(4), pp. 199-207. DOI: 10.5897/AJEST11.159, ISSN 1996-0786.
Vedeld, A., Angelsen, A., Sjaastad, E., and Kobugabe-Berg, G. (2004). Counting on the
Environment: Forest Incomes and the Rural Poor. The World Bank Environment
Department, Environmental Economics Series, Paper No. 98. Washington D.C.
Walelign, S. Z.(2013). Forests beyond income: the contribution of forest and environmental
resources to poverty incidence, depth and severity. International Journal of
AgriScience 2013 Vol. 3 No. 7 pp. 533-542.
Waris, V.S. and Antahal, P. C. (2014). Fuelwood Scarcity, Poverty and women: some
perspectives. IOSR formal of humanities and social sciences. Vol.19, issue 8, Ver II
(Aug.2014), Pp 21-33.

International Journal of Energy and Environmental Research
Vol.4, No.3, pp.1-26, August 2016
___Published by European Centre for Research Training and Development UK (www.eajournals.org)
24 ISSN 2055-0197(Print), ISSN 2055-0200(Online)
APPENDIX A
A COMPUTATION OF VISIT PER YEAR, TOTAL TRAVEL COST AND THE
TOTAL CONSUMER SURPLUS
HOW DATA ANALYSIS WAS UNDERTAKEN
COMPUTATION OF VISITS PER YEAR
Average Travel/ Visits Options/ Frequencies/ Visits per Year /Individual Visit
Distance
1 312 7×19= 133 5.32/5.30
3 260 36×25= 900 7.09/7.10
7 208 111×71= 7881 20.05 /20.10
10 156 88×44= 3872 12.45/12.50
12 104 29×91= 2639 25.62/25.60
15 52 9×30= 270 8.44/8.40
***Visit per year (zero access cost) = inverse of the visitation options (frequency) against the
average travel distance (frequency)
COMPUTATION OF TOTAL TRAVEL COST
Total travel cost = initial travel cost + opportunity cost
Where: initial travel cost = lorry fares
Opportunity cost – 1/3 of minimum wage (April, 2015)
Distance traveled fare one- third minimum wage travel cost + opp = ttc
1 0 1/3 x 7 = 2.33 0+2.33 = 2.30
3 0.70 1/3 x 7 = 2.33 0.70 + 2.33 = 3.03
7 1.40 1/3 x 7 = 2.33 1.40 + 2.33 = 3.73
10 2.00 1/3 x 7 = 2.33 2.0 + 2.33 = 4.33
12 2.50 1/3 x 7 = 2.33 2.50 + 2.33 = 4.83
15 3.0 1/3 x 7 = 2.33 3.0 + 2.33 = 5.33

International Journal of Energy and Environmental Research
Vol.4, No.3, pp.1-26, August 2016
___Published by European Centre for Research Training and Development UK (www.eajournals.org)
25 ISSN 2055-0197(Print), ISSN 2055-0200(Online)
TOTAL CONSUMER SURPLUS COMPUTATION (HOUSEHOLDS WELFARE)
1. Triangle (1
2base height ) 0.5(5,221×5.30)=13,836
2. Rectangle (Length×Breath) (4120×5.30) = 21,836
3. Triangle (1
2base height ) 0.5(4120×5.30)=10,918
4. Rectangle (Length×Breath) (6292×10) = 62,920
5. Triangle (1
2base height ) 0.5(6292×10)= 31,460
6. Rectangle (Length×Breath) (62×25)= 1,550
7. Triangle (1
2base height ) 0.5(62×15) = 465
TOTAL CONSUMER SURPLUS (Households Welfare) = 142,985
Relative Frequency frequency
samplesize ×100
Population in each Average Travel Distance Relativefrequency Population

International Journal of Energy and Environmental Research
Vol.4, No.3, pp.1-26, August 2016
___Published by European Centre for Research Training and Development UK (www.eajournals.org)
26 ISSN 2055-0197(Print), ISSN 2055-0200(Online)
APPENDIX B
COMPUTATION OF TARGET POPULATION AND SAMPLE SIZE
1. Chereponi 2.2% of 7,116 = 156.552
2. East Manprusi 1.7% of 13,895 = 236.215
3. Suo-Tuna-Kalba 1.6% of 14,906 = 238.496
4. Bunkpurugu-Yunyoo 0.8% of 117,621 = 140.968
5. Karaga 1.4% of 7,664 = 107.296
6. Gushiegu 1.0% of 11,150 = 111.50
991.027
Formula: u = N where u = sample size & (5%) is the error margin and the conference
interval is 95%.
1+N(x2)
U = 991.027
[1+991.027 (0.5)2]
U = 991.027
[1+991.027 (0.0025)]
U = 991.027 = 284.977
3.4775675
= 285
Source: Ghana Statistical Service (2010): Figure 1: Map of Northern Region
Recommended