Frasers Commercial Trust 1QFY18 Financial Results
22 January 2018

Important notice
Certain statements in this Presentation constitute “forward-looking statements”, including forward-looking financial information. Such forward-looking statement and financial information involve known and unknown risks, uncertainties and other factors which may cause the actual results, performance or achievements of FCOT or the Manager, or industry results, to be materially different from any future results, performance or achievements expressed or implied by such forward-looking statements and financial information. Such forward-looking statements and financial information are based on numerous assumptions regarding the Manager’s present and future business strategies and the environment in which FCOT or the Manager will operate in the future. Because these statements and financial information reflect the Manager’s current views concerning future events, these statements and financial information necessarily involve risks, uncertainties and assumptions. Actual future performance could differ materially from these forward-looking statements and financial information.
The Manager expressly disclaims any obligation or undertaking to release publicly any updates or revisions to any forward-looking statement or financial information contained in this Presentation to reflect any change in the Manager’s expectations with regard thereto or any change in events, conditions or circumstances on which any such statement or information is based, subject to compliance with all applicable laws and regulations and/or the rules of the SGX-ST and/or any other regulatory or supervisory body or agency.
The value of Frasers Commercial Trust units (“Units”) and the income derived from them, if any, may fall or rise. Units are not obligations of, deposits in, orguaranteed by, the Manager or any of its affiliates. An investment in Units is subject to investment risks, including the possible loss of the principal amountinvested. Investors should note that they have no right to request the Manager to redeem their Units while the Units are listed. It is intended that Unitholders mayonly deal in their Units through trading on the Singapore Exchange Securities Trading Limited (“SGX-ST”). Listing of the Units on the SGX-ST does not guarantee aliquid market for the Units.
This document is for information only and does not constitute an invitation or offer to acquire, purchase or subscribe for the Units. The past performance of REITand the Manager is not necessarily indicative of the future performance of Frasers Commercial Trust and the Manager.
This Presentation contains certain information with respect to the trade sectors of the Trust’s tenants. The Manager has determined the trade sectors in which the Trust’s tenants are primarily involved based on the Manager’s general understanding of the business activities conducted by such tenants. The Manager’s knowledge of the business activities of the Trust’s tenants is necessarily limited and such tenants may conduct business activities that are in addition to, or different from, those shown herein.
This Presentation includes market and industry data and forecast that have been obtained from internal survey, reports and studies, where appropriate, as well as market research, publicly available information and industry publications. Industry publications, surveys and forecasts generally state that the information they contain has been obtained from sources believed to be reliable, but there can be no assurance as to the accuracy or completeness of such included information. While the Manager has taken reasonable steps to ensure that the information is extracted accurately and in its proper context, the Manager has not independently verified any of the data from third party sources or ascertained the underlying economic assumptions relied upon therein.
Results
Capital Management
Portfolio Review
Asset Enhancement Initiatives and Acquisition
Appendix: Asset Details and Market Overview
Contents 3

Results

Results – 1QFY18 key highlights 5
1QFY18 distribution income of S$19.5 million1 was stable vs 4QFY17 and decreased 2.4% vs 1QFY17
1QFY18 DPU of 2.40 cents was stable vs 4QFY17
1 For 1QFY18, Unitholders’ distribution from capital returns includes S$2.0 million which relates to a portion of net consideration received from the disposal of the Hoteldevelopment rights at China Square Central in August 2015, which is classified as capital distribution from tax perspective. See accompanying 1QFY18 FinancialStatements announcement for more details, and refer to the Circular to Unitholders dated 3 June 2015 for details on the disposal of the Hotel development rights atChina Square Central in August 2015.
Distributable Income (S$’000)
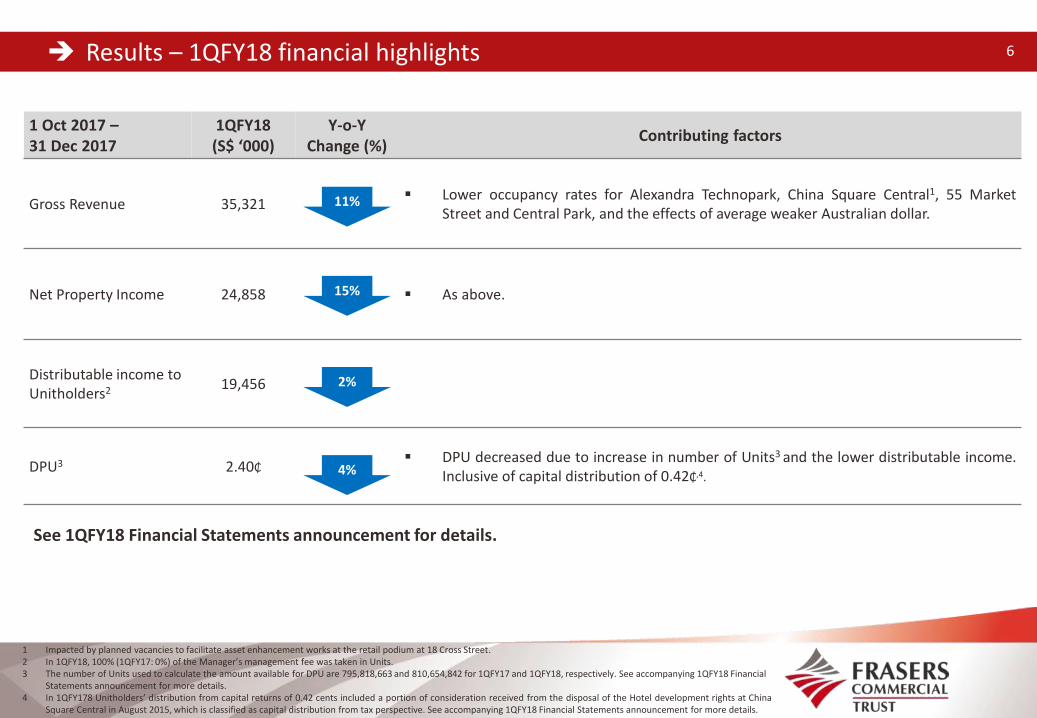
Results – 1QFY18 financial highlights 6
1 Oct 2017 –31 Dec 2017
1QFY18(S$ ‘000)
Y-o-YChange (%)
Contributing factors
Gross Revenue 35,321 Lower occupancy rates for Alexandra Technopark, China Square Central1, 55 Market
Street and Central Park, and the effects of average weaker Australian dollar.
Net Property Income 24,858 As above.
Distributable income to Unitholders2 19,456 -
DPU3 2.40₵ - DPU decreased due to increase in number of Units3 and the lower distributable income.
Inclusive of capital distribution of 0.42₵,4.
1 Impacted by planned vacancies to facilitate asset enhancement works at the retail podium at 18 Cross Street.2 In 1QFY18, 100% (1QFY17: 0%) of the Manager’s management fee was taken in Units. 3 The number of Units used to calculate the amount available for DPU are 795,818,663 and 810,654,842 for 1QFY17 and 1QFY18, respectively. See accompanying 1QFY18 Financial
Statements announcement for more details.4 In 1QFY178 Unitholders’ distribution from capital returns of 0.42 cents included a portion of consideration received from the disposal of the Hotel development rights at China
Square Central in August 2015, which is classified as capital distribution from tax perspective. See accompanying 1QFY18 Financial Statements announcement for more details.
11%
15%
2%
4%
See 1QFY18 Financial Statements announcement for details.
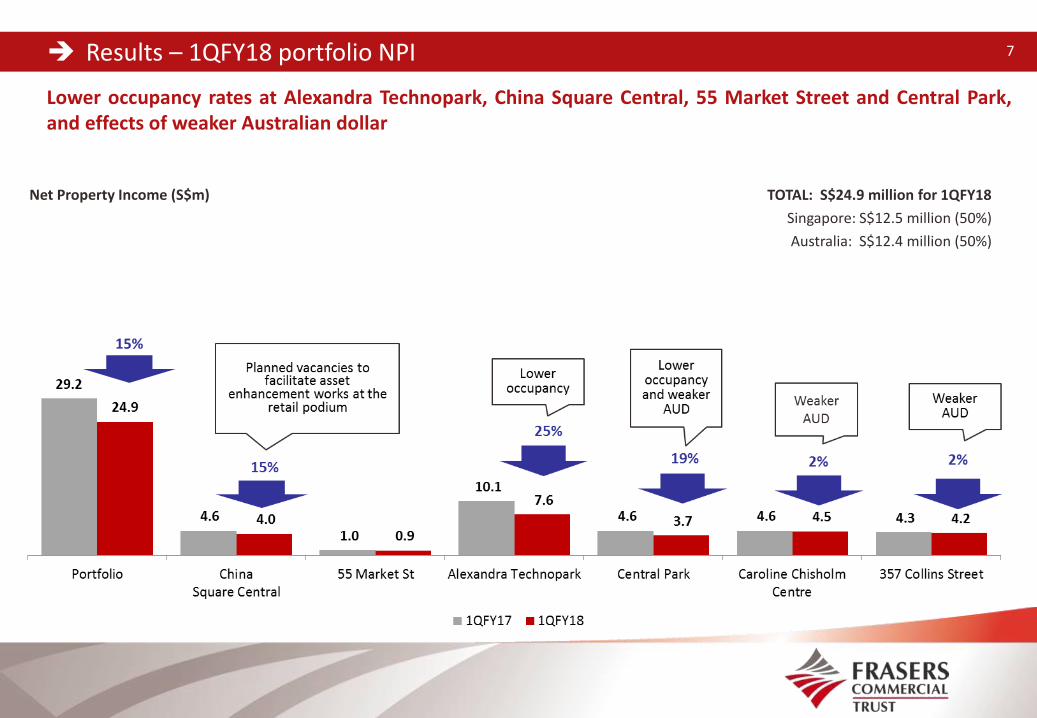
Net Property Income (S$m)
Results – 1QFY18 portfolio NPI
Lower occupancy rates at Alexandra Technopark, China Square Central, 55 Market Street and Central Park,and effects of weaker Australian dollar
7
TOTAL: S$24.9 million for 1QFY18
Singapore: S$12.5 million (50%)
Australia: S$12.4 million (50%)
15%

DPU profile
1QFY18 DPU was stable q-o-q
8
DPU (Cents)
FY17: 9.82 cents

Distribution Period 1 October 2017 to 31 December 2017
Ordinary Unit Distribution Rate
Distribution of 2.4000 cents per Unit comprising:
a) taxable income distribution of 1.5983 cents;
b) tax-exempt income distribution of 0.3831 cents; and
c) capital distribution of 0.4186 cents.
Last day of trading on “cum” basis Friday, 26 January 2018
Ex-distribution trading commence Monday, 29 January 2018
Distribution Books Closure Date Wednesday, 31 January 2018 at 5.00 pm
Cash distribution payment date Thursday, 1 March 2018
Credit of Units to Unitholders’ securities accounts/ listing of Units issued under the DRP on SGX-ST
Thursday, 1 March 2018
Distribution payment 9
DRP will be applied for the distribution for 1QFY18
See accompanying 1QFY18 Financial Statements announcement for more details.

Capital Management
11
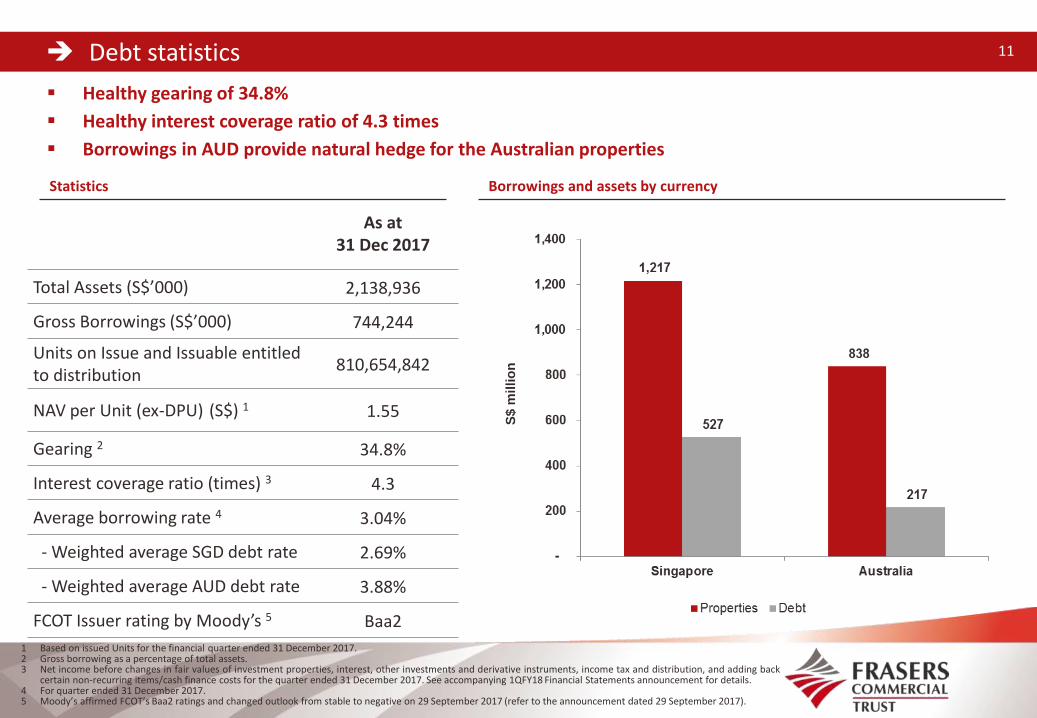
Healthy gearing of 34.8%
Healthy interest coverage ratio of 4.3 times
Borrowings in AUD provide natural hedge for the Australian properties
Debt statistics 11
1 Based on issued Units for the financial quarter ended 31 December 2017.2 Gross borrowing as a percentage of total assets.3 Net income before changes in fair values of investment properties, interest, other investments and derivative instruments, income tax and distribution, and adding back
certain non-recurring items/cash finance costs for the quarter ended 31 December 2017. See accompanying 1QFY18 Financial Statements announcement for details.4 For quarter ended 31 December 2017.5 Moody’s affirmed FCOT’s Baa2 ratings and changed outlook from stable to negative on 29 September 2017 (refer to the announcement dated 29 September 2017).
Statistics
As at 31 Dec 2017
Total Assets (S$’000) 2,138,936
Gross Borrowings (S$’000) 744,244
Units on Issue and Issuable entitled to distribution
810,654,842
NAV per Unit (ex-DPU) (S$) 1 1.55
Gearing 2 34.8%
Interest coverage ratio (times) 3 4.3
Average borrowing rate 4 3.04%
- Weighted average SGD debt rate 2.69%
- Weighted average AUD debt rate 3.88%
FCOT Issuer rating by Moody’s 5 Baa2
Borrowings and assets by currency
S$ m
illio
n
12
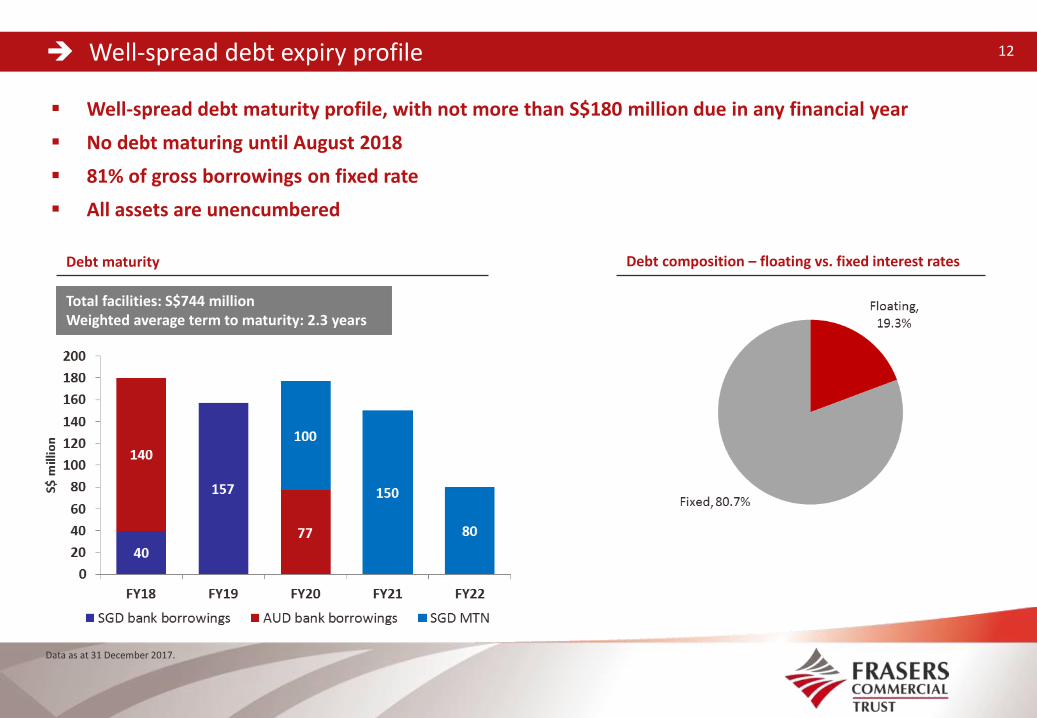
Well-spread debt maturity profile, with not more than S$180 million due in any financial year
No debt maturing until August 2018
81% of gross borrowings on fixed rate
All assets are unencumbered
Well-spread debt expiry profile 12
Debt maturity
Data as at 31 December 2017.
Debt composition – floating vs. fixed interest rates
Total facilities: S$744 million Weighted average term to maturity: 2.3 years
Portfolio Review
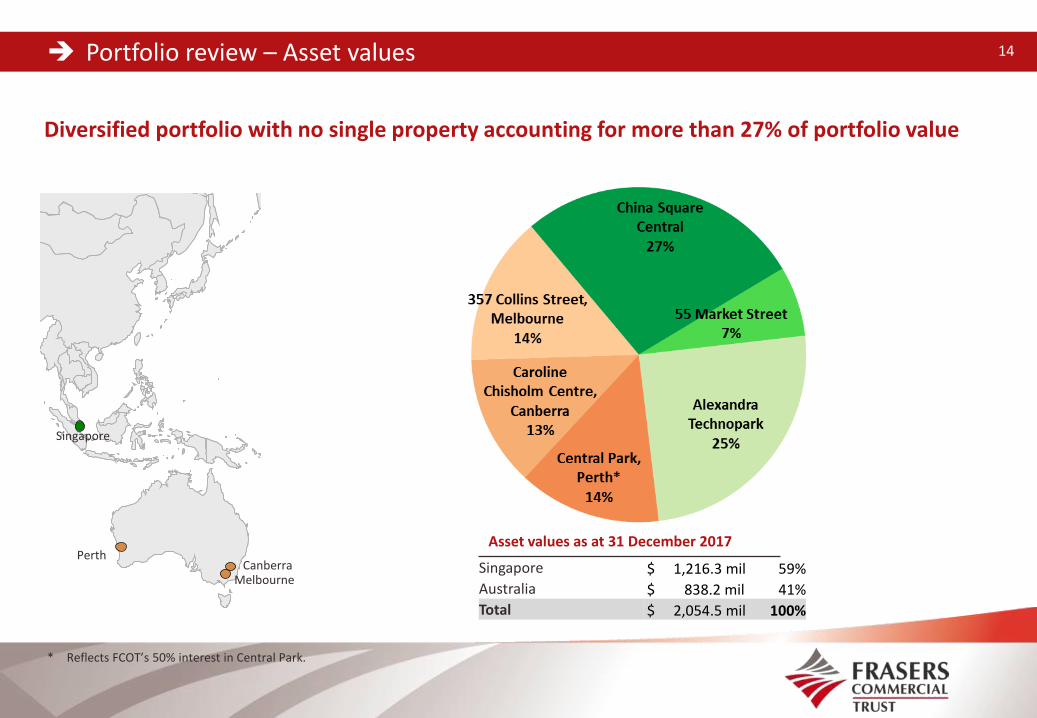
Diversified portfolio with no single property accounting for more than 27% of portfolio value
Portfolio review – Asset values 14
* Reflects FCOT’s 50% interest in Central Park.
Singapore $ 1,216.3 mil 59%
Australia $ 838.2 mil 41%
Total $ 2,054.5 mil 100%
Canberra
Singapore
Perth
Melbourne
Asset values as at 31 December 2017

Average committed occupancy rate of 86.6%
WALE of 3.6 years1,2
Portfolio review – Occupancy & WALE 15
Geographical occupancy and % NPI contribution
1 Excludes lease incentives and retail turnover rents, if any.2 Adjusted for, among other things, space committed by an entity of Rio Tinto Limited on a new 12-year lease commencing in FY18 and space that Rio Tinto Limited will be returning by
end-FY18 as part of its partial relocation to new premises under the new lease. In addition, the total NLA of the portfolio used in the computation of occupancy rate has excluded 18 Cross Street retail podium (NLA c. 64,000 sf) which is currently closed for asset enhancement.
3 Mainly affected by lease expiration for Hewlett-Packard Enterprise Singapore Pte Ltd and phased reduction in lease area by Hewlett-Packard Singapore Pte Ltd at Alexandra Technopark (refer to the announcements dated 22 September 2017 and 3 November 2017 for further details).
Key portfolio statistics As at 31 Dec 2017
Actual occupancy
Committed occupancy2
Ave Occupancy 80.3% 86.6%
Portfolio WALE by gross rental income1 2.8 years 3.6 years 3
Data as at 31 December 2017 and excluding lease incentives and retail turnover rents, if any. * Based on the space committed by an entity of Rio Tinto Limited on a new 12-year lease at Central Park commencing in FY18.~ Adjusted for, among other things, space committed by an entity of Rio Tinto Limited on a new 12-year lease commencing in FY18. In addition, the total NLA of the portfolio used in
the computation has excluded 18 Cross Street retail podium (NLA c. 64,000 sf) which is currently closed for asset enhancement# Pending confirmation of actual number of leases to be executed in respect of the overall space committed by an entity of Rio Tinto Limited under a Heads of Agreement.
Portfolio review – Lease expiry profile 16
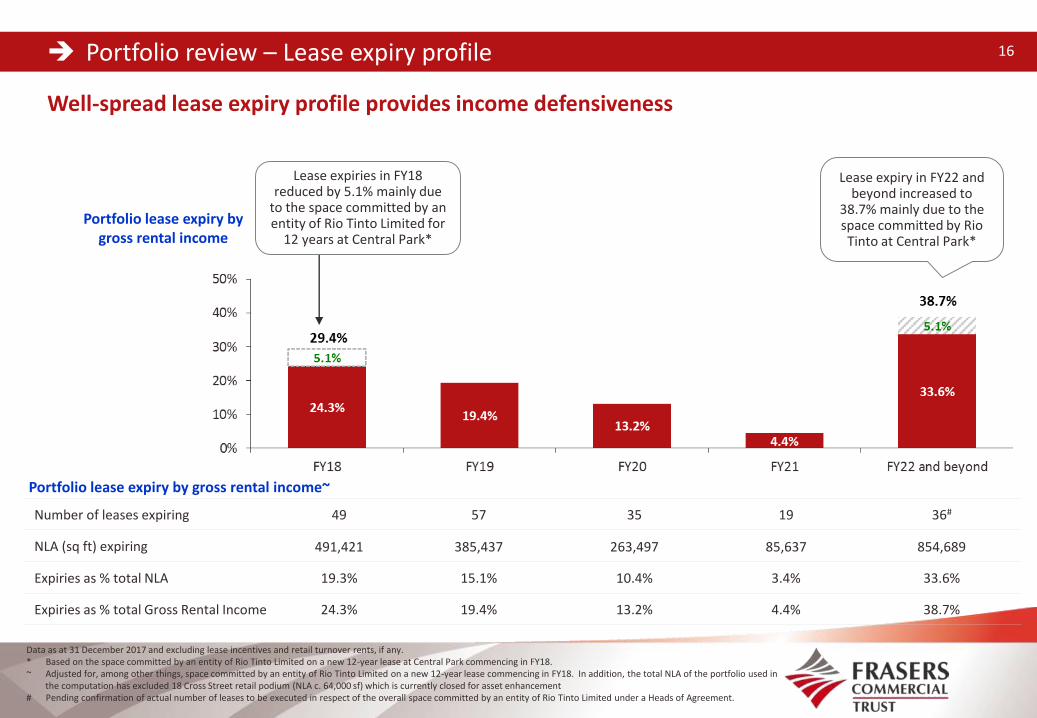
Well-spread lease expiry profile provides income defensiveness
Number of leases expiring 49 57 35 19 36#
NLA (sq ft) expiring 491,421 385,437 263,497 85,637 854,689
Expiries as % total NLA 19.3% 15.1% 10.4% 3.4% 33.6%
Expiries as % total Gross Rental Income 24.3% 19.4% 13.2% 4.4% 38.7%
Portfolio lease expiry by gross rental income
Portfolio lease expiry by gross rental income~
Lease expiry in FY22 and beyond increased to
38.7% mainly due to the space committed by Rio Tinto at Central Park*
Lease expiries in FY18 reduced by 5.1% mainly due
to the space committed by an entity of Rio Tinto Limited for
12 years at Central Park*
Portfolio review – Lease expiry profile 17
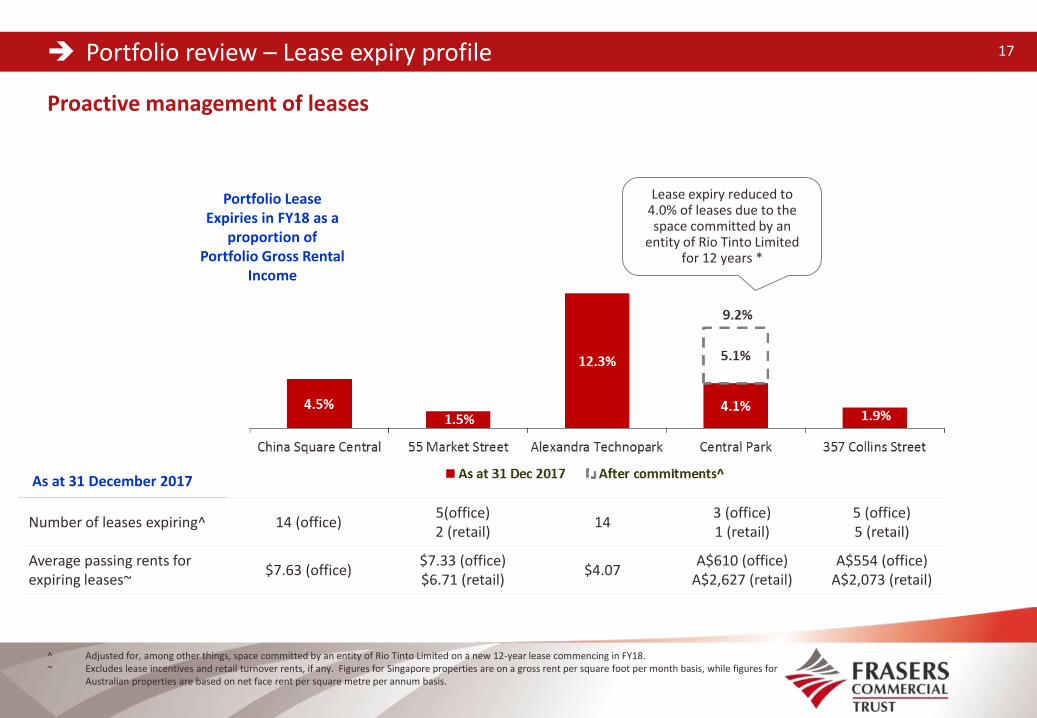
Proactive management of leases
^ Adjusted for, among other things, space committed by an entity of Rio Tinto Limited on a new 12-year lease commencing in FY18.~ Excludes lease incentives and retail turnover rents, if any. Figures for Singapore properties are on a gross rent per square foot per month basis, while figures for
Australian properties are based on net face rent per square metre per annum basis.
Portfolio Lease Expiries in FY18 as a
proportion of Portfolio Gross Rental
Income
Number of leases expiring^ 14 (office)5(office)2 (retail)
143 (office)1 (retail)
5 (office)5 (retail)
Average passing rents for expiring leases~
$7.63 (office)$7.33 (office)$6.71 (retail)
$4.07A$610 (office)
A$2,627 (retail)A$554 (office)
A$2,073 (retail)
As at 31 December 2017
Lease expiry reduced to 4.0% of leases due to the space committed by an
entity of Rio Tinto Limited for 12 years *
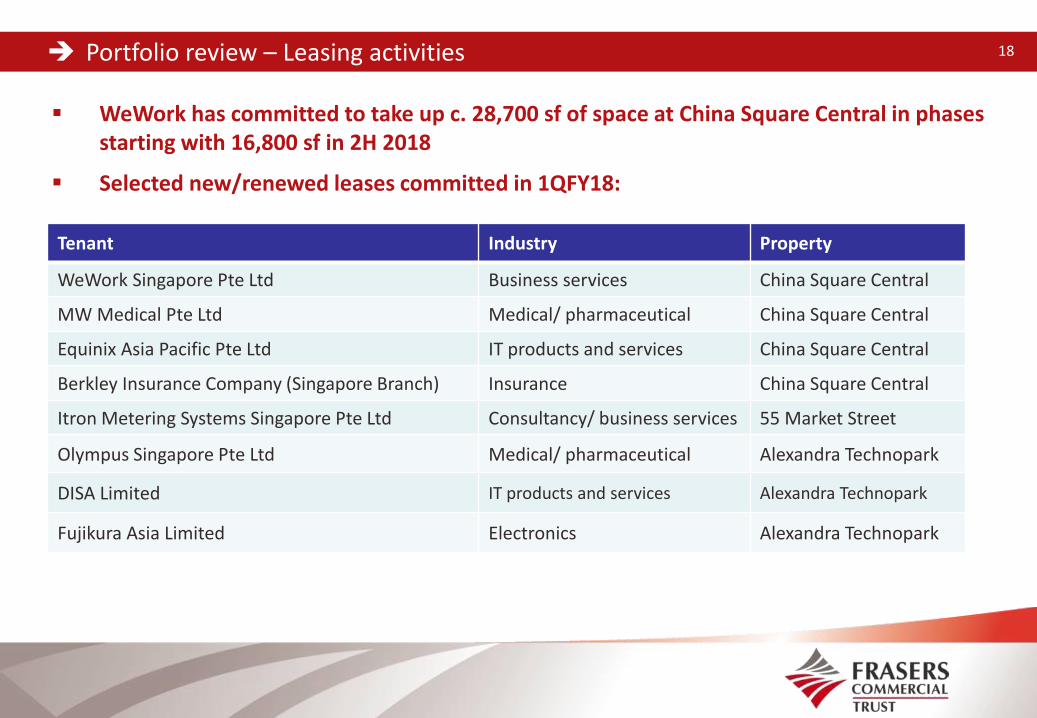
Portfolio review – Leasing activities 18
WeWork has committed to take up c. 28,700 sf of space at China Square Central in phases starting with 16,800 sf in 2H 2018
Selected new/renewed leases committed in 1QFY18:
Tenant Industry Property
WeWork Singapore Pte Ltd Business services China Square Central
MW Medical Pte Ltd Medical/ pharmaceutical China Square Central
Equinix Asia Pacific Pte Ltd IT products and services China Square Central
Berkley Insurance Company (Singapore Branch) Insurance China Square Central
Itron Metering Systems Singapore Pte Ltd Consultancy/ business services 55 Market Street
Olympus Singapore Pte Ltd Medical/ pharmaceutical Alexandra Technopark
DISA Limited IT products and services Alexandra Technopark
Fujikura Asia Limited Electronics Alexandra Technopark
19 Portfolio review – Mid-term rent reviews 19
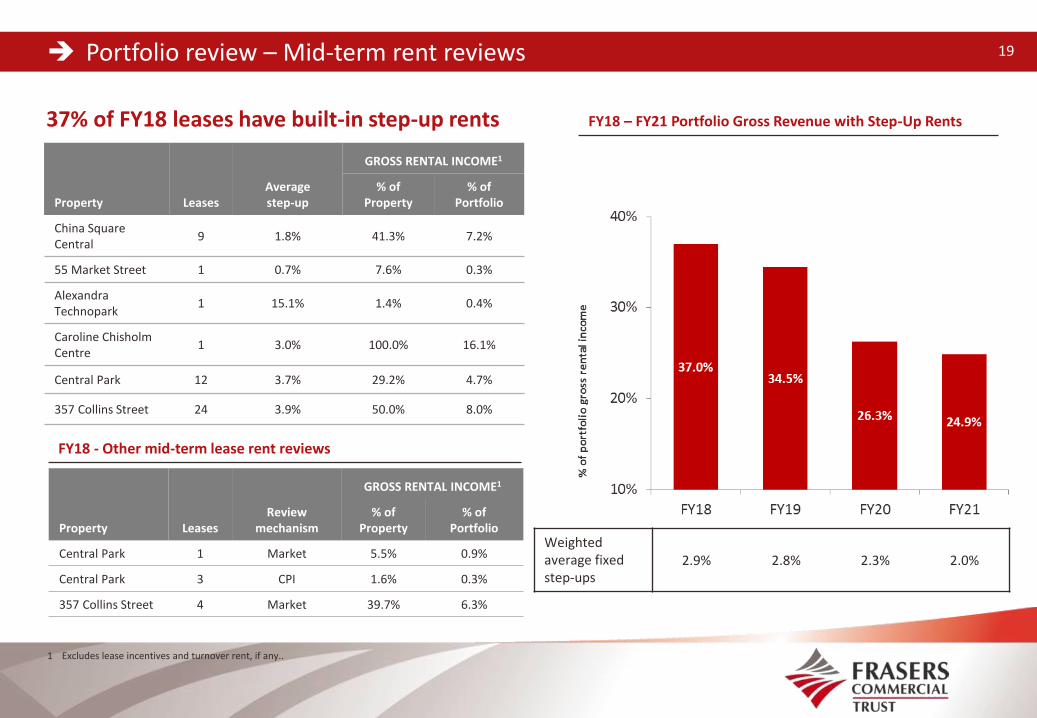
37% of FY18 leases have built-in step-up rents
Property LeasesReview
mechanism
GROSS RENTAL INCOME1
% of Property
% of Portfolio
Central Park 1 Market 5.5% 0.9%
Central Park 3 CPI 1.6% 0.3%
357 Collins Street 4 Market 39.7% 6.3%
FY18 - Other mid-term lease rent reviews
FY18 – FY21 Portfolio Gross Revenue with Step-Up Rents
1 Excludes lease incentives and turnover rent, if any..
Property LeasesAverage step-up
GROSS RENTAL INCOME1
% of Property
% of Portfolio
China Square Central
9 1.8% 41.3% 7.2%
55 Market Street 1 0.7% 7.6% 0.3%
Alexandra Technopark
1 15.1% 1.4% 0.4%
Caroline Chisholm Centre
1 3.0% 100.0% 16.1%
Central Park 12 3.7% 29.2% 4.7%
357 Collins Street 24 3.9% 50.0% 8.0%
Weighted average fixedstep-ups
2.9% 2.8% 2.3% 2.0%

Portfolio review – Top-10 tenants 20
Tenant Property Sector Lease Expiry
% (Gross Rental
Income)1
Commonwealth of Australia Caroline Chisholm Centre Government Jul-25 16.9%
Hewlett-Packard Singapore Pte Ltd
Alexandra Technopark IT Products & Services Jan-18 to Dec-18 11.1%
Rio Tinto Limited2 Central Park Mining/ resources Jun-18/ Jun-302 7.5%
Commonwealth Bank of Australia
357 Collins Street Banking, insurance & financial services
Dec-22 6.5%
GroupM Singapore Pte Ltd China Square Central Consultancy/ business services
Mar-19 3.6%
Service Stream Ltd 357 Collins Street Multimedia & Telecommunications
Dec-19 3.4%
Microsoft Operations Pte Ltd Alexandra Technopark IT Products & Services Jan-22 3.1%
Suntory Beverage & Food Asia Pte Ltd
China Square Central Food & beverage May-20 2.8%
Equinix Asia Pacific Pte Ltd China Square Central IT Products & Services Feb-21 1.4%
Nokia Solutions and Networks (S) Pte Ltd
Alexandra Technopark Multimedia & Telecommunications
Feb-21 1.3%
Total 57.6%
Top 10 tenants by gross rental income
1 Data as at 31 December 2017 and excludes lease incentives and retail turnover rents, if any. 2 Based on the space committed by an entity of Rio Tinto Limited on a new 12-year lease at Central Park commencing in FY18.
Top 10 tenants: MNCs, government department and public listed companies Established names and well diversified across various sectors Contribute 58% of portfolio gross rental income and have a WALE of 4.5 years as at 31 December 2017
Asset Enhancement Initiatives and Acquisition
Asset update – Asset enhancement at Alexandra Technopark 22
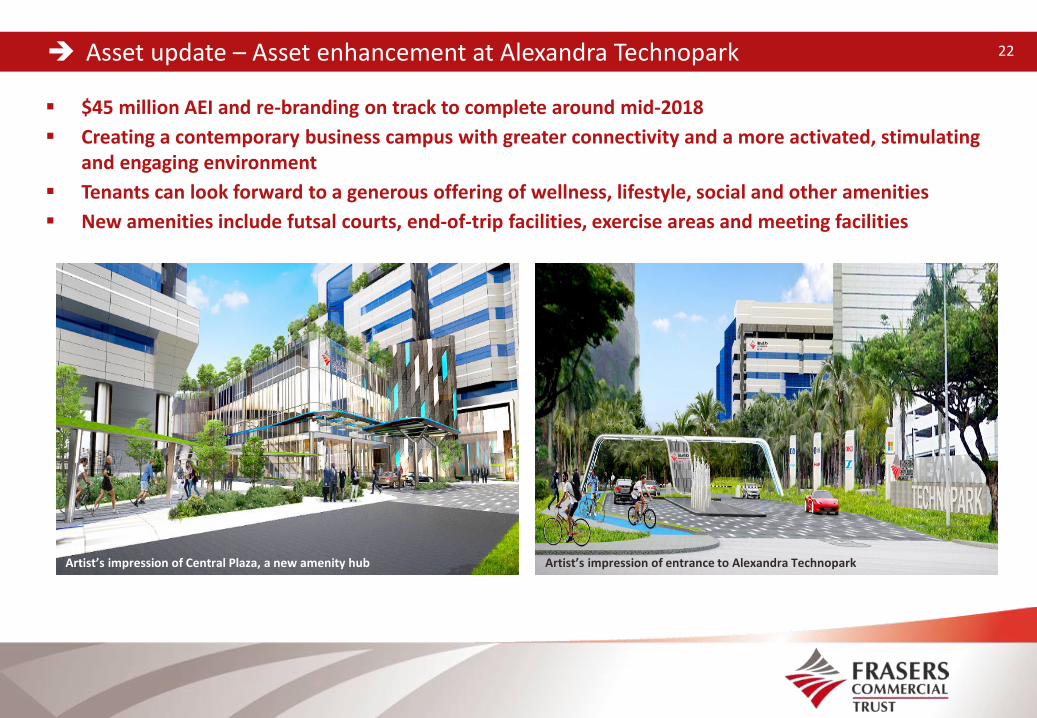
$45 million AEI and re-branding on track to complete around mid-2018
Creating a contemporary business campus with greater connectivity and a more activated, stimulating and engaging environment
Tenants can look forward to a generous offering of wellness, lifestyle, social and other amenities
New amenities include futsal courts, end-of-trip facilities, exercise areas and meeting facilities
Artist’s impression of Central Plaza, a new amenity hub Artist’s impression of entrance to Alexandra Technopark

Asset update – Developments at China Square Central 23
1 Undertaken by an entity of Frasers Centrepoint Limited. Refer to the Circular to Unitholders dated 3 June 2015 for details.
2 New spaces to be created from relocated spaces from part of the existing basement at 18 Cross Street and a section of 22 Cross Street. Refer to the Circular to Unitholders dated 3 June 2015 for details.
Construction works for the development of the 16-storey Hotel and Commercial Project1 are on track and expected to be completed by mid-2019
New retail and commercial spaces with better frontages and visibility will also be created2
The new Capri by Fraser hotel will bring increased activity to rejuvenate China Square Central
Artist’s impression of the Hotel
China Square Central Proposed Hotel
Hotel
Construction hoarding along Nankin Mall
Artist’s impression of the retail podium for illustration only
Asset update – Enhancement of China Square Central retail podium 24
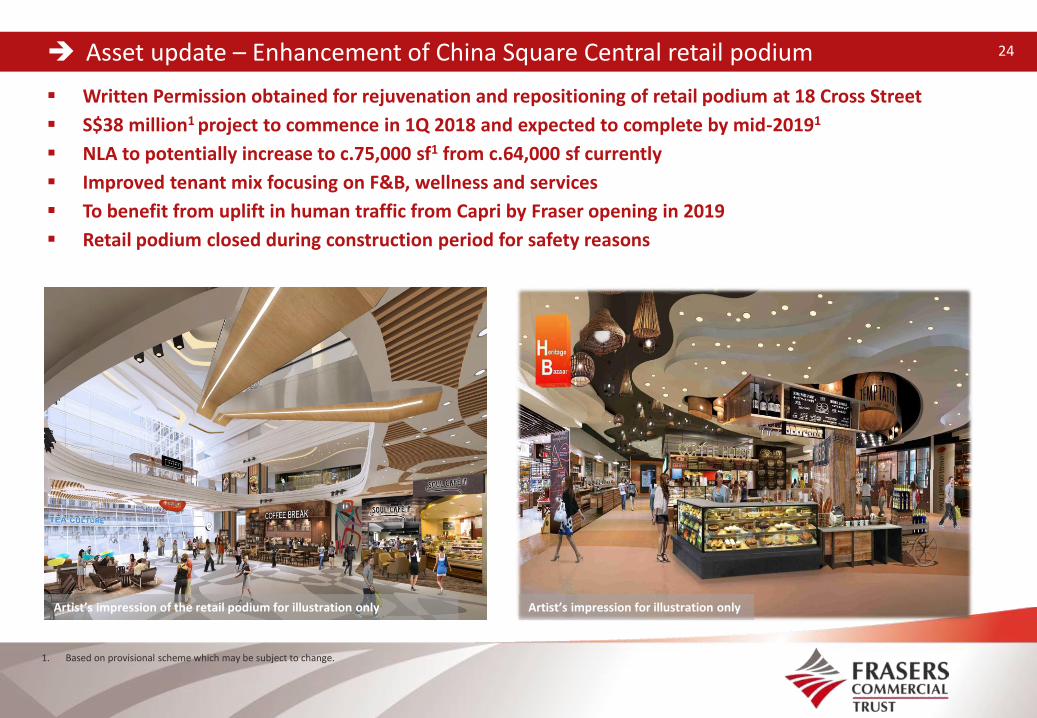
Written Permission obtained for rejuvenation and repositioning of retail podium at 18 Cross Street
S$38 million1 project to commence in 1Q 2018 and expected to complete by mid-20191
NLA to potentially increase to c.75,000 sf1 from c.64,000 sf currently
Improved tenant mix focusing on F&B, wellness and services
To benefit from uplift in human traffic from Capri by Fraser opening in 2019
Retail podium closed during construction period for safety reasons
1. Based on provisional scheme which may be subject to change.
Artist’s impression for illustration only

Acquisition of 50% interest in Farnborough Business Park, UK 25
FCOT expands investment mandate to Europe, with an initial focus on the UK, to enhance long-term growth potentialand diversification1
50:50 joint venture with sponsor, Frasers Centrepoint Limited (“FCL”), to acquire Farnborough Business Park (“FBP”) at aproperty value of £175 million expected to complete by end-January 20181
FBP is an award-winning business park with solid fundamentals in a well-connected location in Thames Valley
The acquisition is expected to be DPU-accretive based on the contemplated funding plan involving a combination of debtand equity
Future growth from more than S$4 billion2 acquisition pipeline from right of first refusal granted by FCL over relevantproperties in Singapore, Australia and the UK
1. Refer to announcement dated 14 December 2017.2. Source: Frasers Centrepoint Limited 2017 Annual Report and relevant announcements.
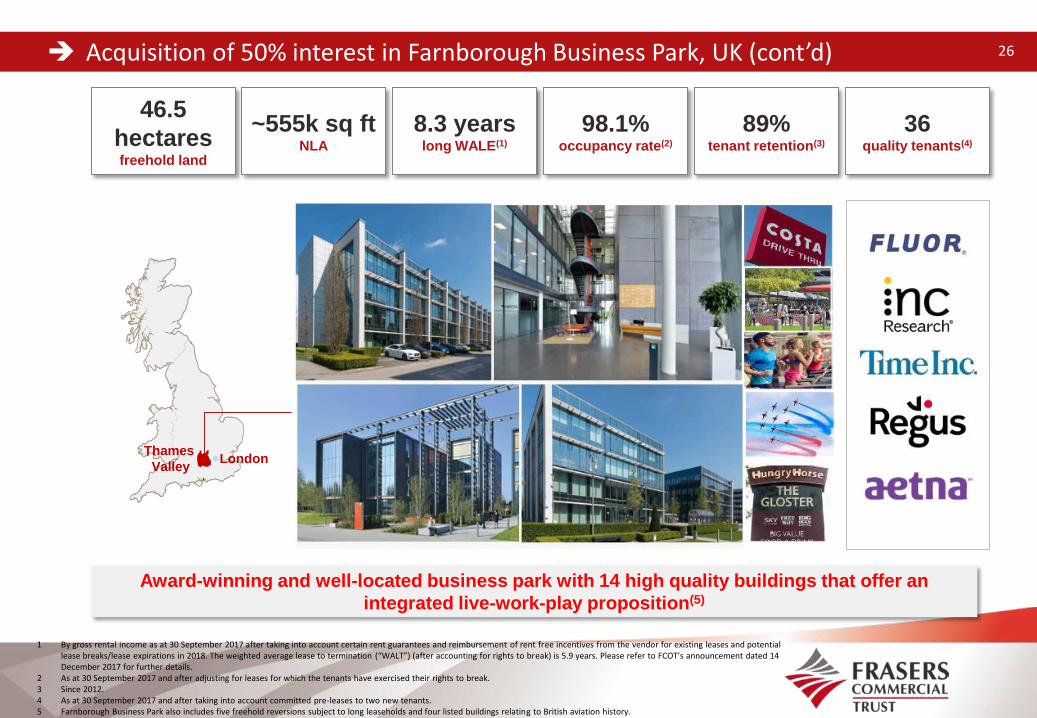
Acquisition of 50% interest in Farnborough Business Park, UK (cont’d) 26
1 By gross rental income as at 30 September 2017 after taking into account certain rent guarantees and reimbursement of rent free incentives from the vendor for existing leases and potential lease breaks/lease expirations in 2018. The weighted average lease to termination (“WALT”) (after accounting for rights to break) is 5.9 years. Please refer to FCOT’s announcement dated 14 December 2017 for further details.
2 As at 30 September 2017 and after adjusting for leases for which the tenants have exercised their rights to break.3 Since 2012.4 As at 30 September 2017 and after taking into account committed pre-leases to two new tenants.5 Farnborough Business Park also includes five freehold reversions subject to long leaseholds and four listed buildings relating to British aviation history.
~555k sq ftNLA
46.5
hectaresfreehold land
8.3 yearslong WALE(1)
98.1%occupancy rate(2)
89%tenant retention(3)
36quality tenants(4)
Thames
Valley
Award-winning and well-located business park with 14 high quality buildings that offer an
integrated live-work-play proposition(5)
London
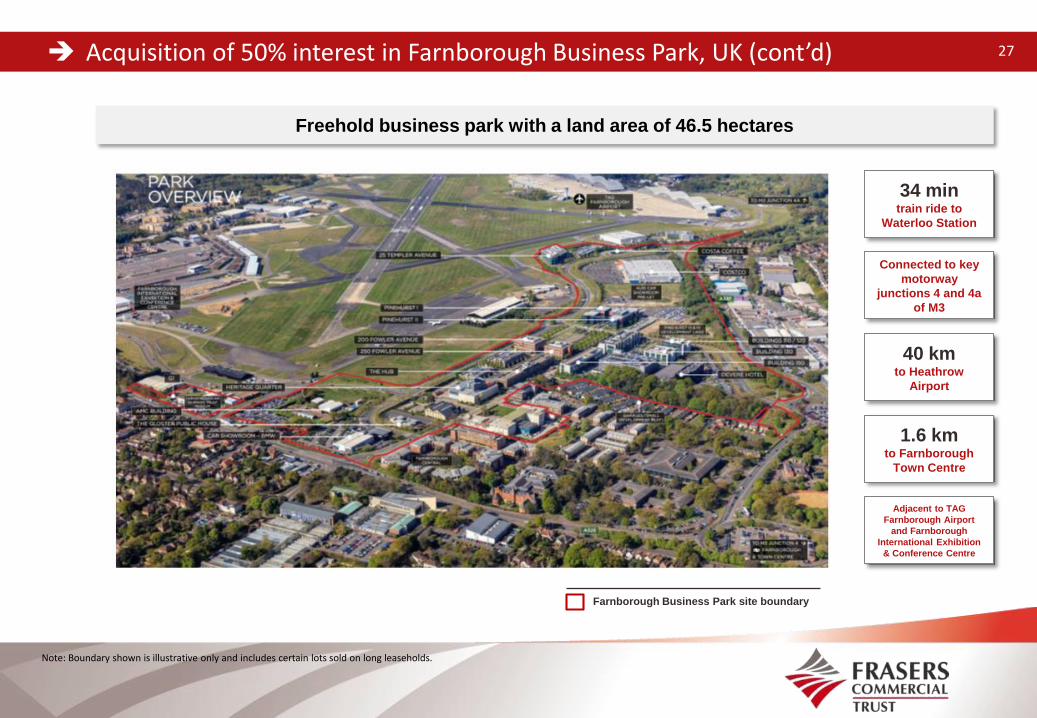
Acquisition of 50% interest in Farnborough Business Park, UK (cont’d) 27
Note: Boundary shown is illustrative only and includes certain lots sold on long leaseholds.
Farnborough Business Park site boundary
34 mintrain ride to
Waterloo Station
Connected to key
motorway
junctions 4 and 4a
of M3
40 kmto Heathrow
Airport
1.6 kmto Farnborough
Town Centre
Adjacent to TAG
Farnborough Airport
and Farnborough
International Exhibition
& Conference Centre
Freehold business park with a land area of 46.5 hectares
Acquisition of 50% interest in Farnborough Business Park, UK (cont’d) 28
Data as at 30 September 2017.
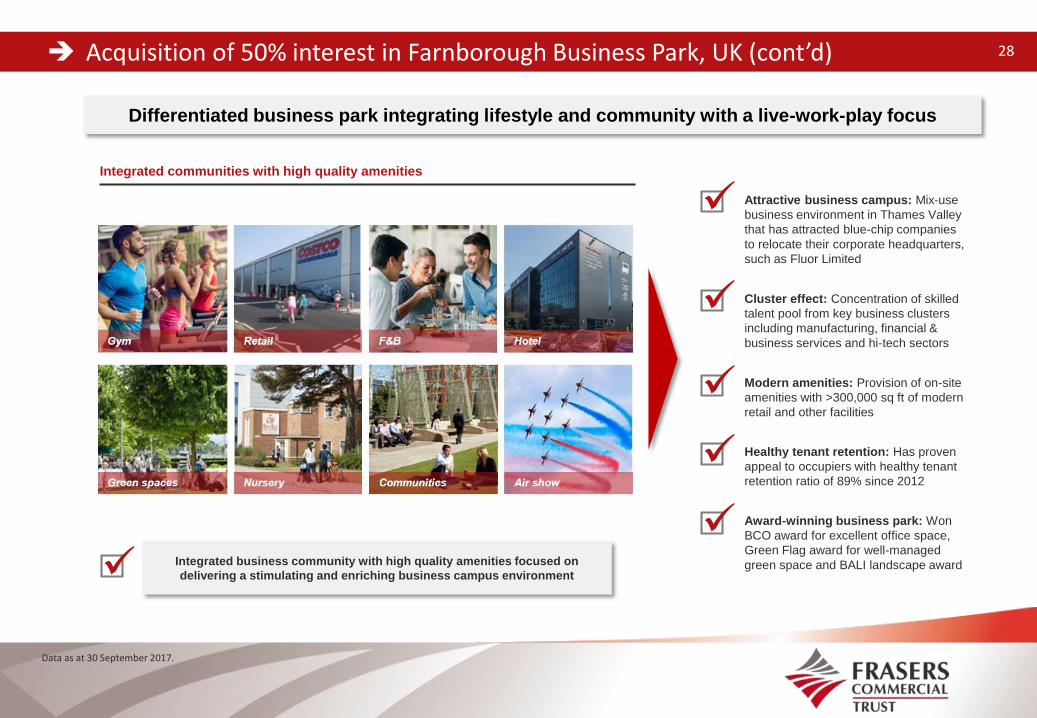
Differentiated business park integrating lifestyle and community with a live-work-play focus
Integrated communities with high quality amenities
Integrated business community with high quality amenities focused on
delivering a stimulating and enriching business campus environment
Modern amenities: Provision of on-site
amenities with >300,000 sq ft of modern
retail and other facilities
Healthy tenant retention: Has proven
appeal to occupiers with healthy tenant
retention ratio of 89% since 2012
Attractive business campus: Mix-use
business environment in Thames Valley
that has attracted blue-chip companies
to relocate their corporate headquarters,
such as Fluor Limited
Cluster effect: Concentration of skilled
talent pool from key business clusters
including manufacturing, financial &
business services and hi-tech sectors
Award-winning business park: Won
BCO award for excellent office space,
Green Flag award for well-managed
green space and BALI landscape award

ROFR pipeline 29
Expanded ROFR pipeline to more than S$4bn
Source: FCL 2016 annual report and announcements.(1) Currently under development.(2) Not owned by FCL as at date of announcement.
Selected Australia assets owned by FCL
1B HomebushBay Drive
1D HomebushBay Drive
Rhodes Corporate Park (Bldg F)
2 Southbank Boulevard
Frasers Tower(1)
Alexandra Point
51 CuppageRoad
Valley Point
Selected Singapore assets owned by FCL
WinnershTriangle
ChinehamPark
WatchmoorPark
Farnborough Business Park(2) (50%)
Selected UK assets owned by FCL

Appendix: Asset Details and Market Overview
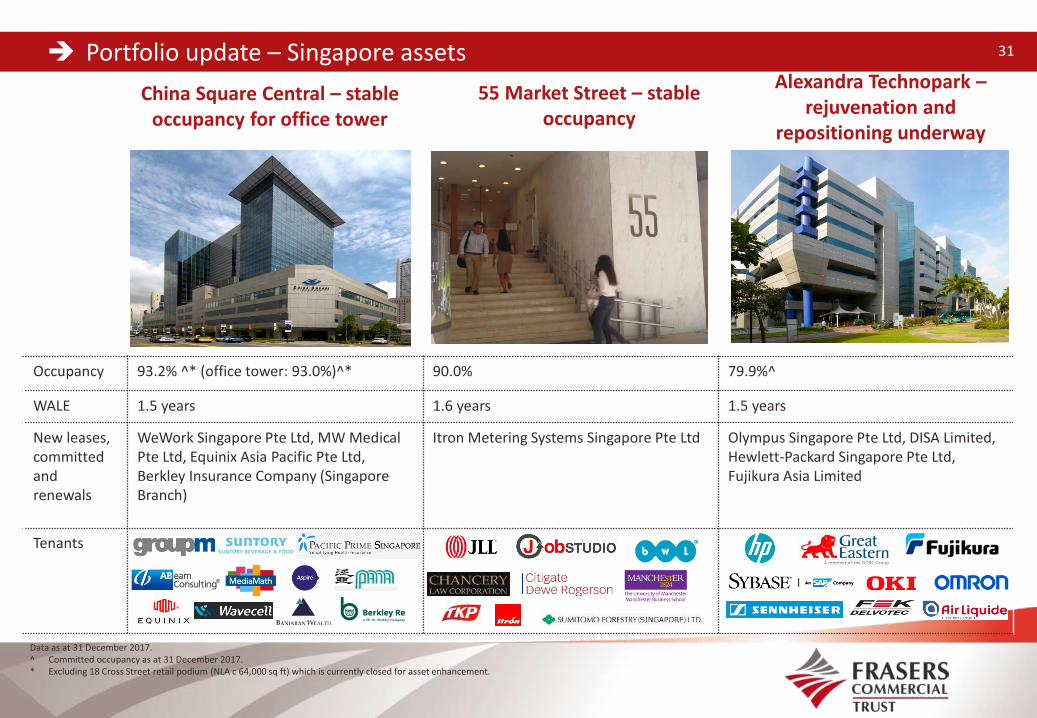
Portfolio update – Singapore assets 31
55 Market Street – stable occupancy
Central Park, Perth
Data as at 31 December 2017.^ Committed occupancy as at 31 December 2017. * Excluding 18 Cross Street retail podium (NLA c 64,000 sq ft) which is currently closed for asset enhancement.
Alexandra Technopark –rejuvenation and
repositioning underway
Occupancy 93.2% ^* (office tower: 93.0%)^* 90.0% 79.9%^
WALE 1.5 years 1.6 years 1.5 years
New leases, committed and renewals
WeWork Singapore Pte Ltd, MW Medical Pte Ltd, Equinix Asia Pacific Pte Ltd, Berkley Insurance Company (Singapore Branch)
Itron Metering Systems Singapore Pte Ltd Olympus Singapore Pte Ltd, DISA Limited, Hewlett-Packard Singapore Pte Ltd, Fujikura Asia Limited
Tenants
China Square Central – stable occupancy for office tower

Portfolio update – Australia assets 32
Caroline Chisholm Centre – full occupancy with
long WALE of 7.5 years
357 Collins Street – high occupancy in a strong
market
Occupancy 71.6%*# 100.0% 98.9%
WALE 1.7 years (6.7 years with new leases*) 7.5 years 3.4 years
New leases, committed and renewals
Rio Tinto Shared Services Pty Ltd Property occupied until July 2025by a single tenant, the Commonwealth of Australia (Aaa rated^)
FCL Property Management Services Pty Limited
Tenants
Central Park – long WALE of 6.7 years*
Data as at 31 December 2017. * Adjusted for, among other things, space committed by an entity of Rio Tinto Limited on a new 12-year lease commencing in FY18 and space that Rio Tinto Limited will
be returning by end-FY18 as part of its partial relocation to new premises under the new lease. Actual occupancy on 31 December 2017 was 64.6%. # Committed occupancy as at 31 December 2017. ^ Based on Moody’s rating in August 2017.
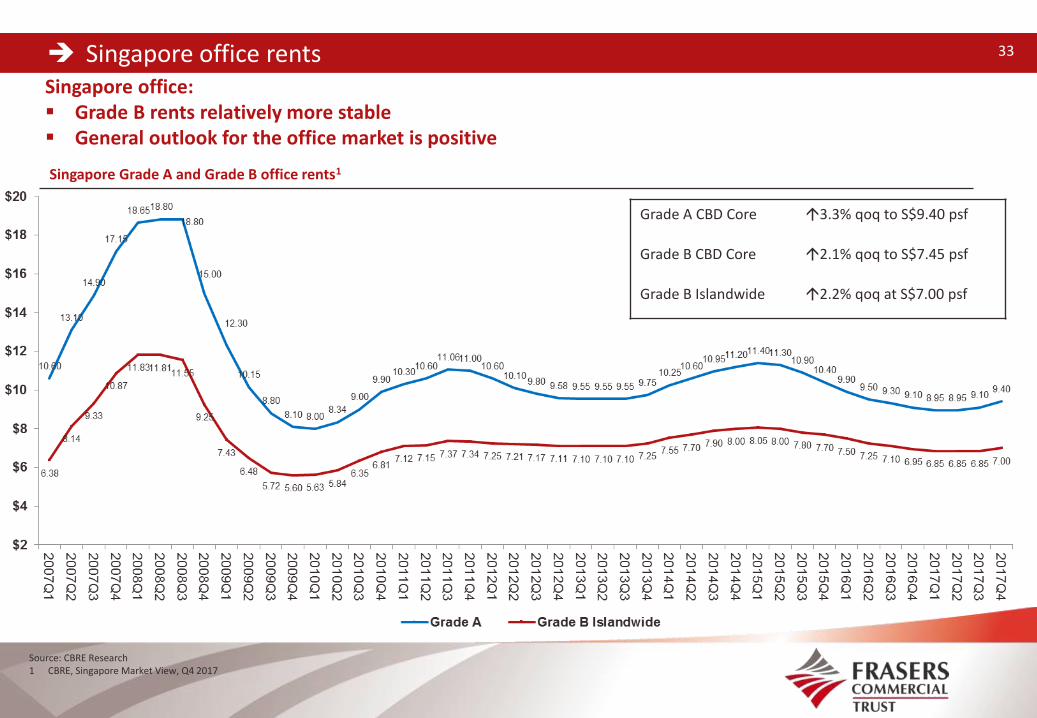
Singapore office rents 33
Source: CBRE Research1 CBRE, Singapore Market View, Q4 2017
Singapore Grade A and Grade B office rents1
Singapore office: Grade B rents relatively more stable General outlook for the office market is positive
Grade A CBD Core 3.3% qoq to S$9.40 psf
Grade B CBD Core 2.1% qoq to S$7.45 psf
Grade B Islandwide 2.2% qoq at S$7.00 psf

Demand, supply and outlook for Singapore CBD office market 34
1 CBRE, Singapore Market View, Q4 2017
Office supply-demand dynamics1
Generally more positive outlook underpinned bystronger economic conditions and lower quantumof new supply expected over the medium term
The office market ended 2017 on a high note witha total net absorption of 2.1 million sf
Island-wide vacancy decreased to 6.1% in Q4 2017from 7.4% in the previous quarter
Most of the leasing transactions in 4Q 2017 werefrom the co-working and technology firms
Co-working operators are now considering FringeCBD locations
CBRE is of the opinion that the expansion oftraditional industries such as banking, maritimeand energy will be needed to fuel future growth inthe office market
Office vacancy rates 1

Singapore business park rents 35
Singapore business parks – City fringe business park rents increased 0.9% qoq in Q4 20171
Source: CBRE Research1 CBRE, Singapore Market View, Q4 2017
Singapore Business Park (city fringe) rents1
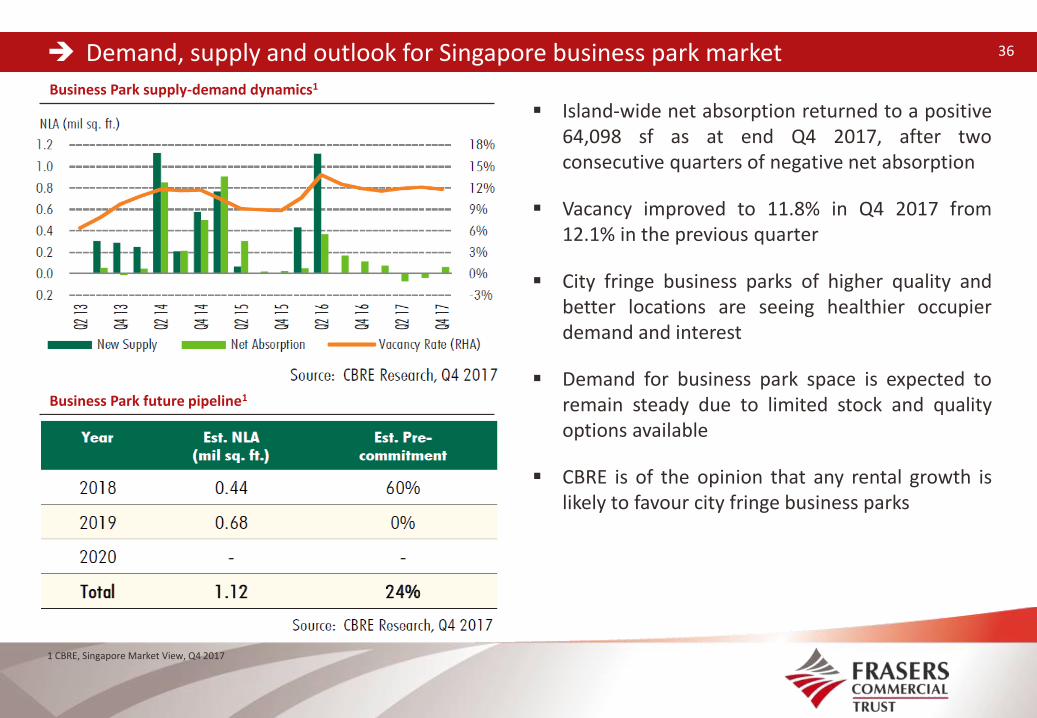
Demand, supply and outlook for Singapore business park market 36
1 CBRE, Singapore Market View, Q4 2017
Business Park supply-demand dynamics1
Island-wide net absorption returned to a positive64,098 sf as at end Q4 2017, after twoconsecutive quarters of negative net absorption
Vacancy improved to 11.8% in Q4 2017 from12.1% in the previous quarter
City fringe business parks of higher quality andbetter locations are seeing healthier occupierdemand and interest
Demand for business park space is expected toremain steady due to limited stock and qualityoptions available
CBRE is of the opinion that any rental growth islikely to favour city fringe business parks
Business Park future pipeline1

Perth CBD office supply and rents 37
Source: Knight Frank Research, Perth CBD Office Market Overview, September 2017.
Perth CBD office net absorption and vacancy rate (‘000 sqm and % per six-month period)
Perth CBD office market appears to have bottomed, overall vacancy fell to 21.1% as at July 2017 Net absorption of 25,130 sqm for the six months to July 2017 was the second positive half-yearly net
absorption recorded in the past two years, mainly driven by take-up of Prime Grade office space Prime Grade average net face rent was A$500 to A$700 per sqm per annum as at July 2017, with average
lease incentives between 45% and 50% Lease incentives appear to be tightening at the top end of the market
Perth CBD net absorption by grade (‘000 sqm)
Source: Knight Frank Research/PCA Source: Knight Frank Research/PCA
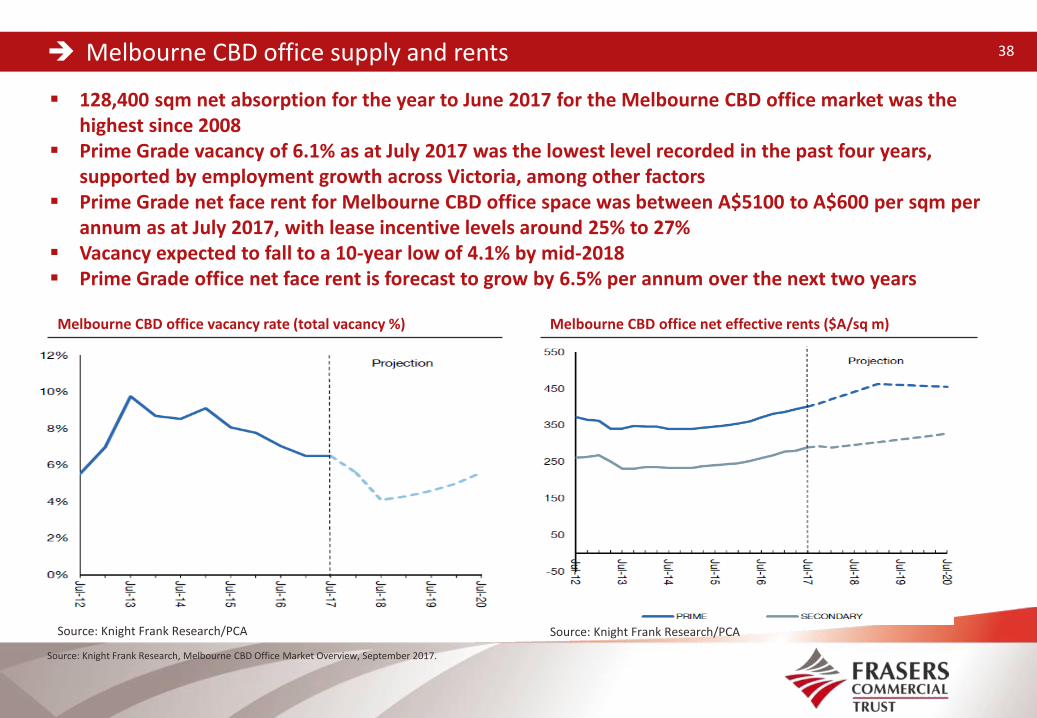
128,400 sqm net absorption for the year to June 2017 for the Melbourne CBD office market was the highest since 2008
Prime Grade vacancy of 6.1% as at July 2017 was the lowest level recorded in the past four years, supported by employment growth across Victoria, among other factors
Prime Grade net face rent for Melbourne CBD office space was between A$5100 to A$600 per sqm per annum as at July 2017, with lease incentive levels around 25% to 27%
Vacancy expected to fall to a 10-year low of 4.1% by mid-2018 Prime Grade office net face rent is forecast to grow by 6.5% per annum over the next two years
Melbourne CBD office supply and rents 38
Source: Knight Frank Research, Melbourne CBD Office Market Overview, September 2017.
Melbourne CBD office vacancy rate (total vacancy %) Melbourne CBD office net effective rents ($A/sq m)
Source: Knight Frank Research/PCASource: Knight Frank Research/PCA

Thank you
Frasers Centrepoint Asset Management (Commercial) Limited438 Alexandra Road | #21-00| Alexandra Point | Singapore 119958Tel: +65 6276 4882| Fax: +65 6276 8942| Email: [email protected]. fraserscommercialtrust.com
Recommended