Page 12nd International Warm Mix Conference, St. Louis, October 11–13, 2011
Laboratory assessment of mechanical performanceand fume emissions of LEA® HWMA (90°C)
vs. traditional HMA (160°C)
François Olard (EIFFAGE Travaux Publics)Vincent Gaudefroy (IFSTTAR-LUNAM)
Page 22nd International Warm Mix Conference, St. Louis, October 11–13, 2011
• Research of lower mixing temperature to target comparable HMA mechanical properties (at least « sufficient » for requested properties)
– Ladis Csanyi, Iowa introduced steam in hot bitumen in order to mix cold aggregates
– August Jacobi, 1928 in Germany patent foamed bitumen– real industrial tests happened in the 70’s in Australia– in France Jean Lefebvre (nowadays EUROVIA) in the 70’s tried to
realize surface dressings with foamed bitumen
Half warm mix process
Page 32nd International Warm Mix Conference, St. Louis, October 11–13, 2011
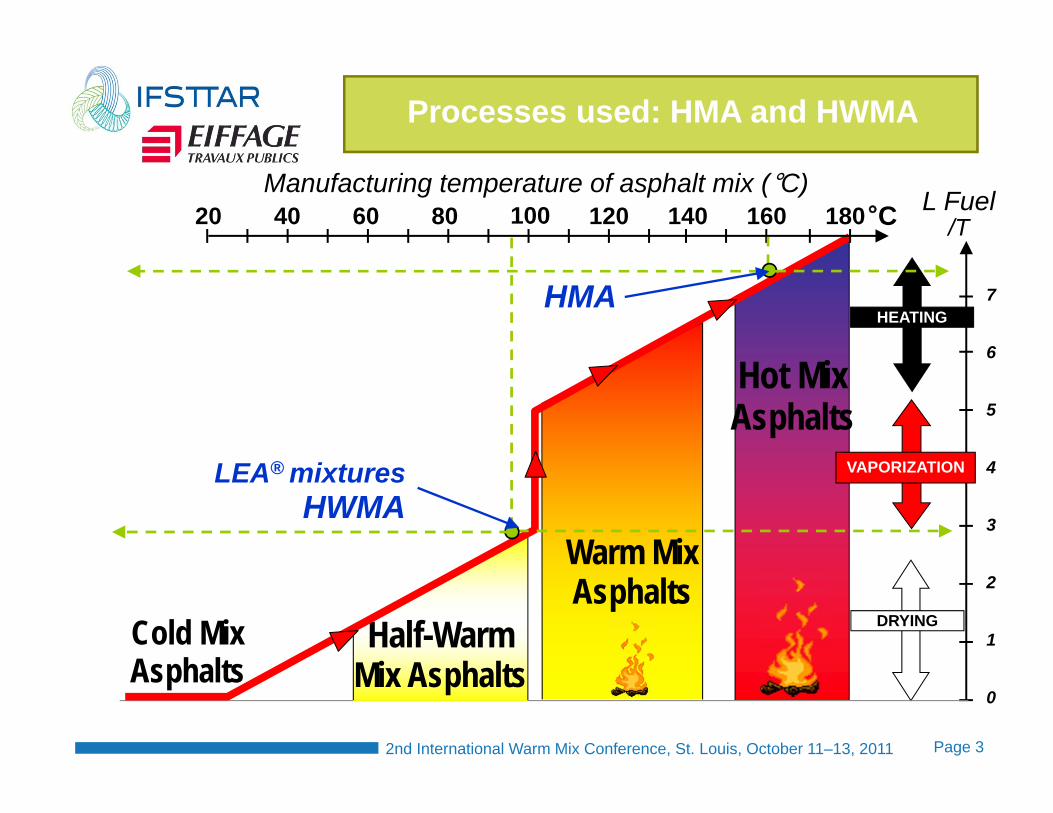
Processes used: HMA and HWMA
°C L Fuel/T
Warm MixAsphalts
Hot MixAsphalts
HEATING
VAPORIZATION
DRYINGHalf-Warm Mix Asphalts
20 40 60 80 100 120 140 160 180
7
6
5
4
3
2
1
0
Cold MixAsphalts
Manufacturing temperature of asphalt mix (°C)
HMA
LEA® mixturesHWMA
Page 42nd International Warm Mix Conference, St. Louis, October 11–13, 2011
Objectives of the study
– Study the effect of manufacturing temperature (HWMA LEA® and HMA) on mechanical and environmental properties
– Identify the effect of process on emissions (Total Organic Compounds quantity and Emission Potential)
Page 52nd International Warm Mix Conference, St. Louis, October 11–13, 2011
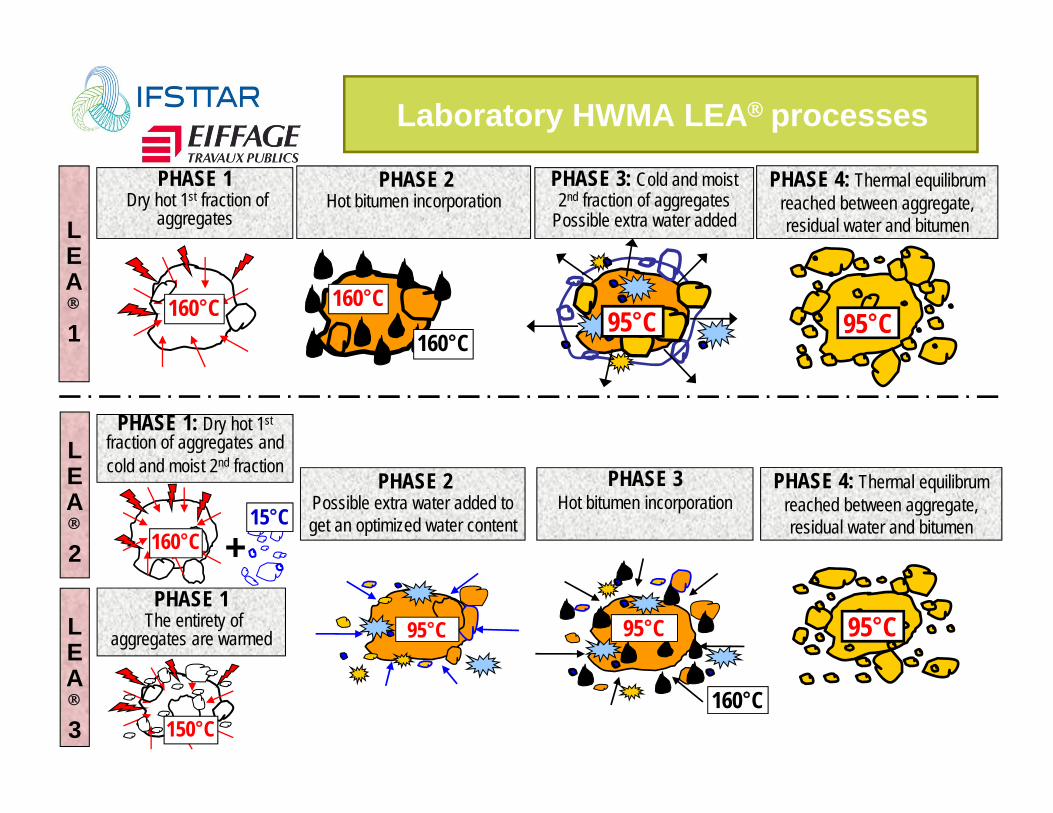
Laboratory HWMA LEA processes
PHASE 1Dry hot 1st fraction of
aggregatesLEA
1160°C
PHASE 2Hot bitumen incorporation
160°C
PHASE 3: Cold and moist 2nd fraction of aggregates
Possible extra water added
PHASE 4: Thermal equilibrum reached between aggregate, residual water and bitumen
95°C
LEA
2
LEA
3
+160°C15°C
PHASE 1: Dry hot 1st
fraction of aggregates and cold and moist 2nd fraction
95°C
PHASE 2Possible extra water added to get an optimized water content
PHASE 3 Hot bitumen incorporation
160°C
95°C 95°C
160°C95°C
PHASE 4: Thermal equilibrum reached between aggregate, residual water and bitumen
PHASE 1The entirety of
aggregates are warmed
150°C
Page 62nd International Warm Mix Conference, St. Louis, October 11–13, 2011
Formula Classical French dense asphalt mixture for base course ‘Grave Bitume’ GB 0/14 with a binder content of 4.2%
Aggregates diorite
Bitumen (35/50 pen-grade) Paraffinic : Pen-grade 42, R&B 52.6°C
Manufacturing temperature HMA: 160°C HWMA (LEA 1, 2 and 3): 95°C with 1.5% humidity by weight of dry aggregate
Additives 2 additives (vegetal origin) used (0.5% by weight of binder)
Materials used
Page 72nd International Warm Mix Conference, St. Louis, October 11–13, 2011
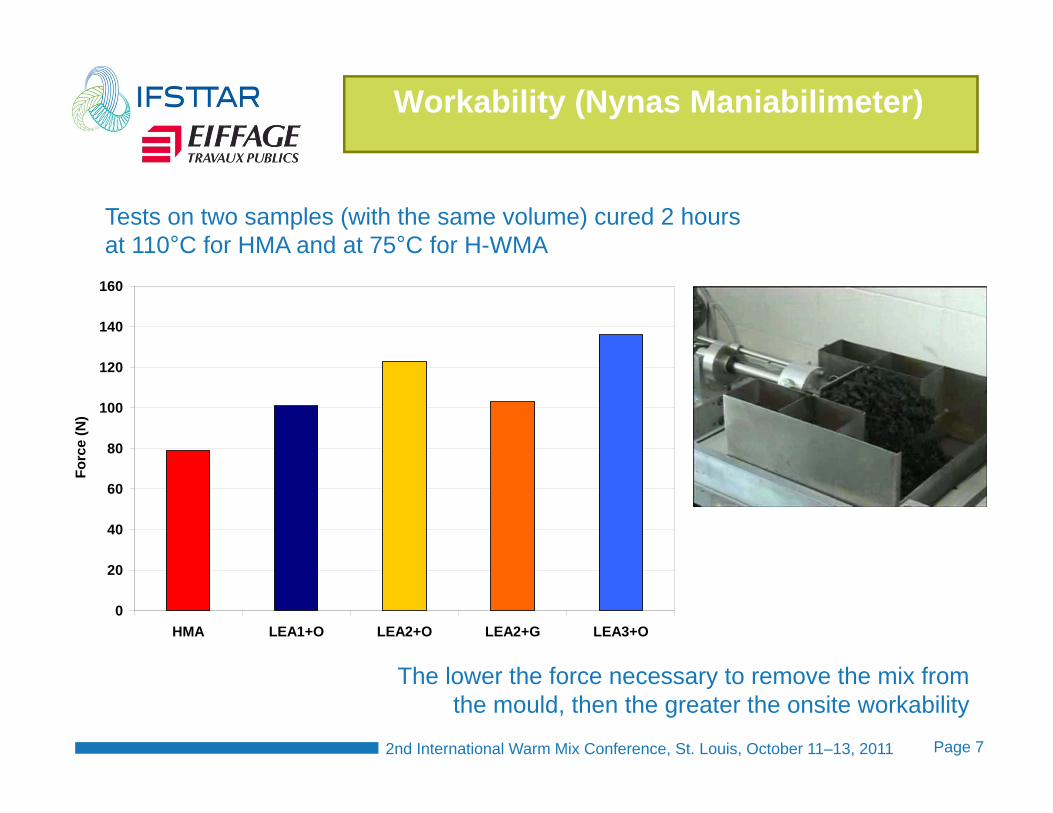
Workability (Nynas Maniabilimeter)
0
20
40
60
80
100
120
140
160
HMA LEA1+O LEA2+O LEA2+G LEA3+O
Forc
e (N
)
Tests on two samples (with the same volume) cured 2 hoursat 110°C for HMA and at 75°C for H-WMA
The lower the force necessary to remove the mix from the mould, then the greater the onsite workability
Page 82nd International Warm Mix Conference, St. Louis, October 11–13, 2011
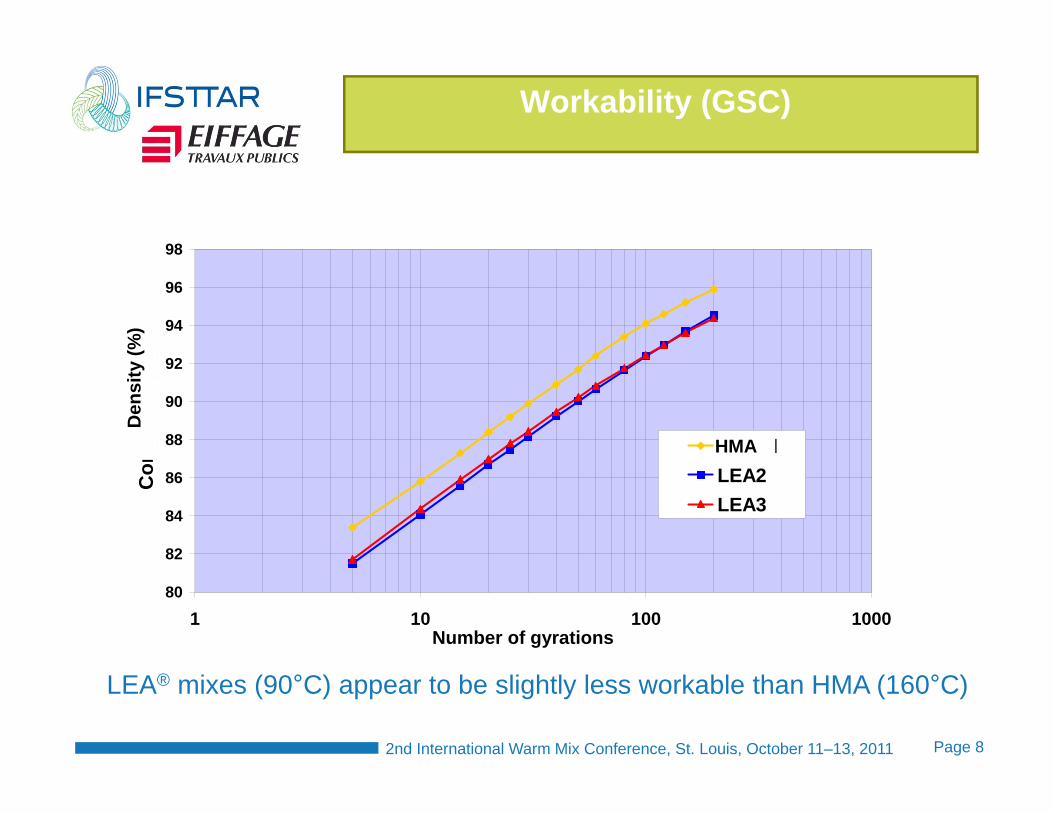
Workability (GSC)
Aptitude au compactage à la PCG
80
82
84
86
88
90
92
94
96
98
1 10 100 1000
Nombre de girations
Com
paci
té (%
)
ChaudLEA2LEA3
HMA
Number of gyrations
Den
sity
(%)
LEA® mixes (90°C) appear to be slightly less workable than HMA (160°C)
Page 92nd International Warm Mix Conference, St. Louis, October 11–13, 2011
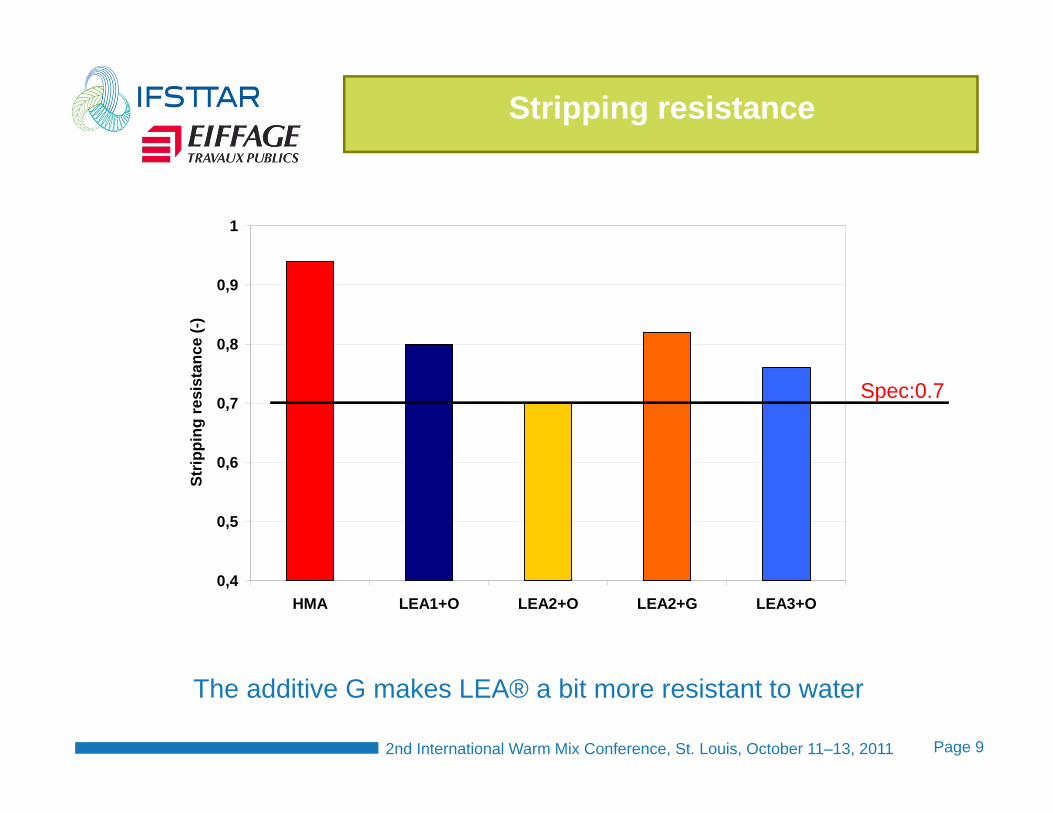
The additive G makes LEA® a bit more resistant to water
Stripping resistance
0,4
0,5
0,6
0,7
0,8
0,9
1
HMA LEA1+O LEA2+O LEA2+G LEA3+O
Strip
ping
resi
stan
ce (-
)
Spec:0.7
Page 102nd International Warm Mix Conference, St. Louis, October 11–13, 2011
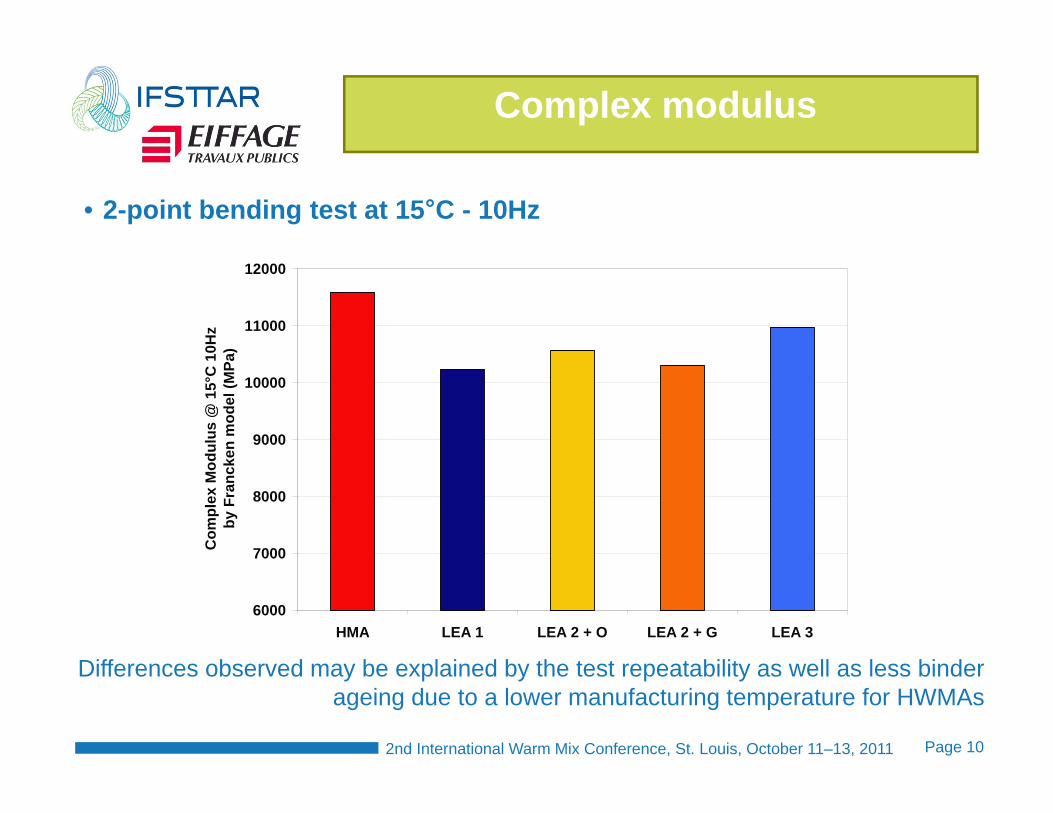
Complex modulus
6000
7000
8000
9000
10000
11000
12000
HMA LEA 1 LEA 2 + O LEA 2 + G LEA 3
Com
plex
Mod
ulus
@ 1
5°C
10H
zby
Fra
ncke
n m
odel
(MPa
)• 2-point bending test at 15°C - 10Hz
Differences observed may be explained by the test repeatability as well as less binder ageing due to a lower manufacturing temperature for HWMAs
Page 112nd International Warm Mix Conference, St. Louis, October 11–13, 2011
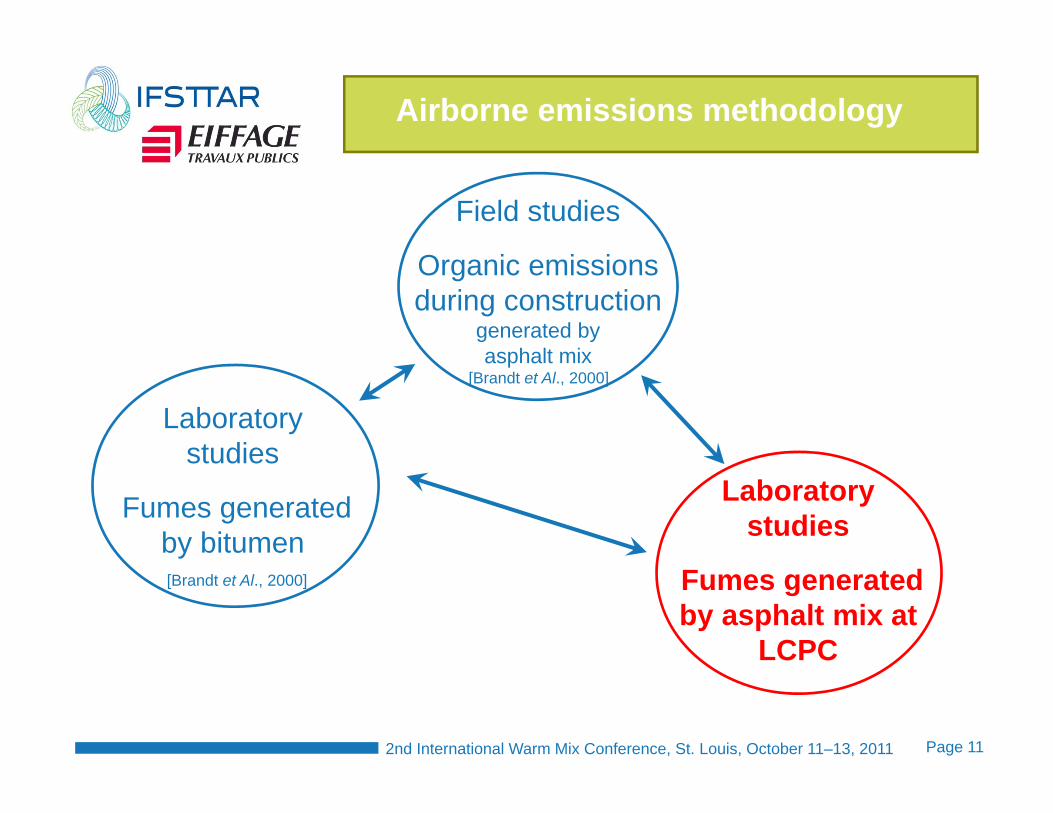
Airborne emissions methodology
Field studies
Organic emissionsduring construction
generated byasphalt mix
Laboratory studies
Fumes generatedby bitumen
Laboratory studies
Fumes generatedby asphalt mix at
LCPC
[Brandt et Al., 2000]
[Brandt et Al., 2000]
Page 122nd International Warm Mix Conference, St. Louis, October 11–13, 2011
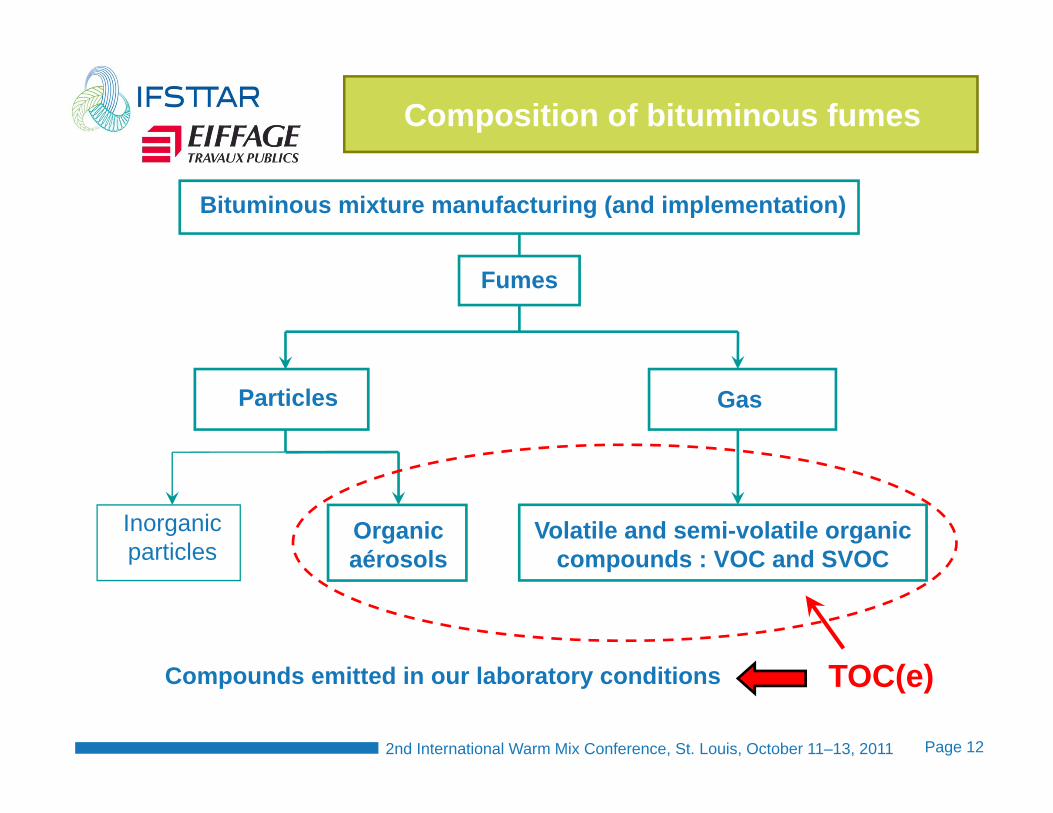
TOC(e)
Volatile and semi-volatile organic compounds : VOC and SVOC
Organic aérosols
Gas
Bituminous mixture manufacturing (and implementation)
Fumes
Inorganic particles
Particles
Compounds emitted in our laboratory conditions
Composition of bituminous fumes
Page 132nd International Warm Mix Conference, St. Louis, October 11–13, 2011
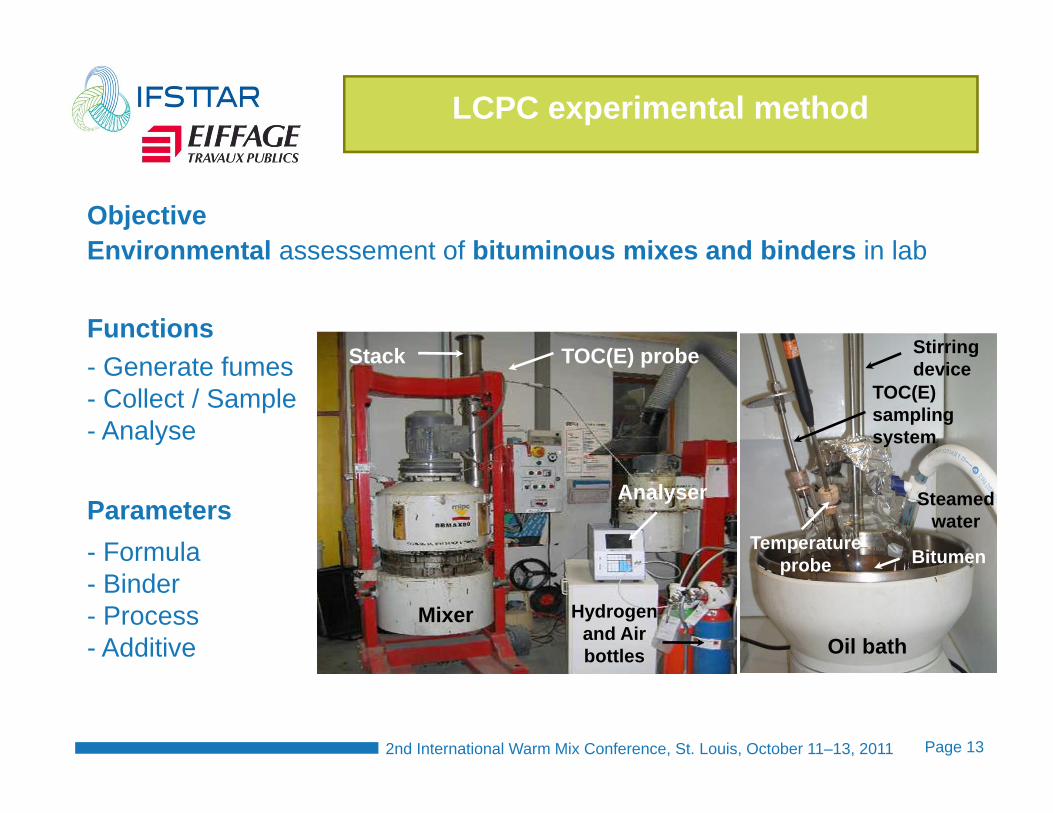
Mixer
TOC(E) probe
Hydrogen and Air bottles
Stack
Analyser
Oil bath
Bitumen
Steamed water
Temperature probe
Stirringdevice
TOC(E) sampling system
Functions- Generate fumes- Collect / Sample- Analyse
Parameters- Formula- Binder- Process- Additive
ObjectiveEnvironmental assessement of bituminous mixes and binders in lab
LCPC experimental method
Page 142nd International Warm Mix Conference, St. Louis, October 11–13, 2011
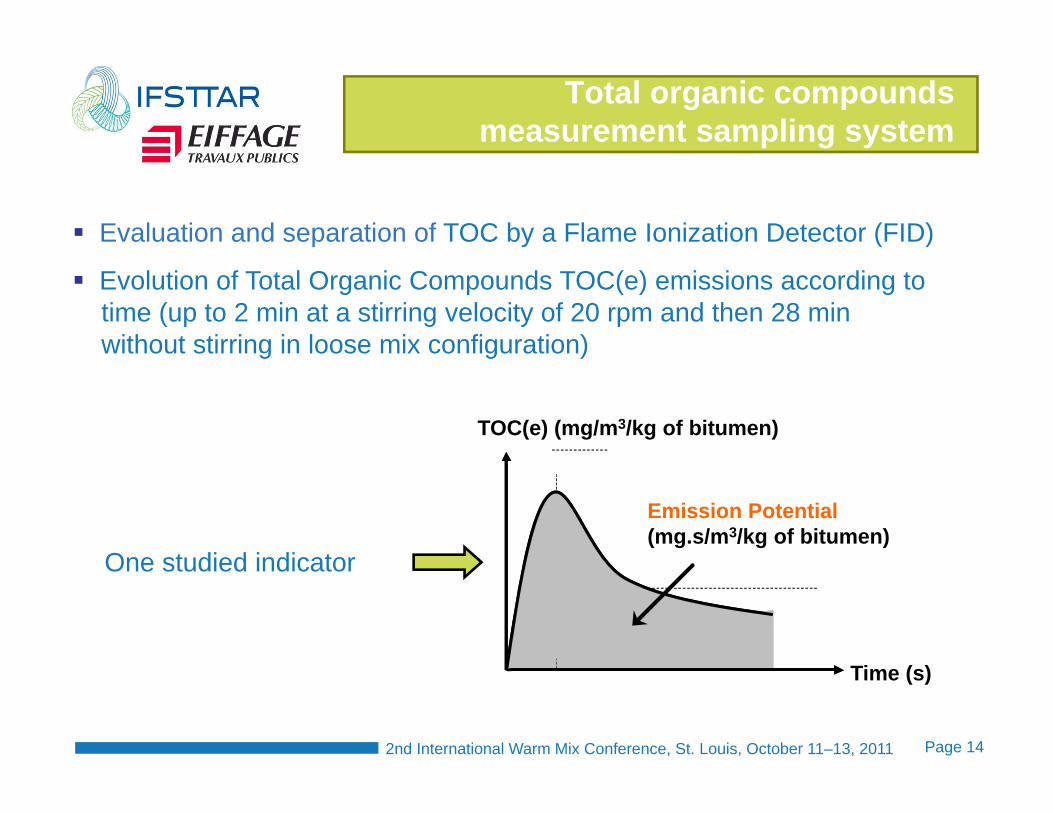
Total organic compounds measurement sampling system
Time (s)
Emission Potential(mg.s/m3/kg of bitumen)
TOC(e) (mg/m3/kg of bitumen)
Evaluation and separation of TOC by a Flame Ionization Detector (FID)
Evolution of Total Organic Compounds TOC(e) emissions according to time (up to 2 min at a stirring velocity of 20 rpm and then 28 min without stirring in loose mix configuration)
One studied indicator
Page 152nd International Warm Mix Conference, St. Louis, October 11–13, 2011
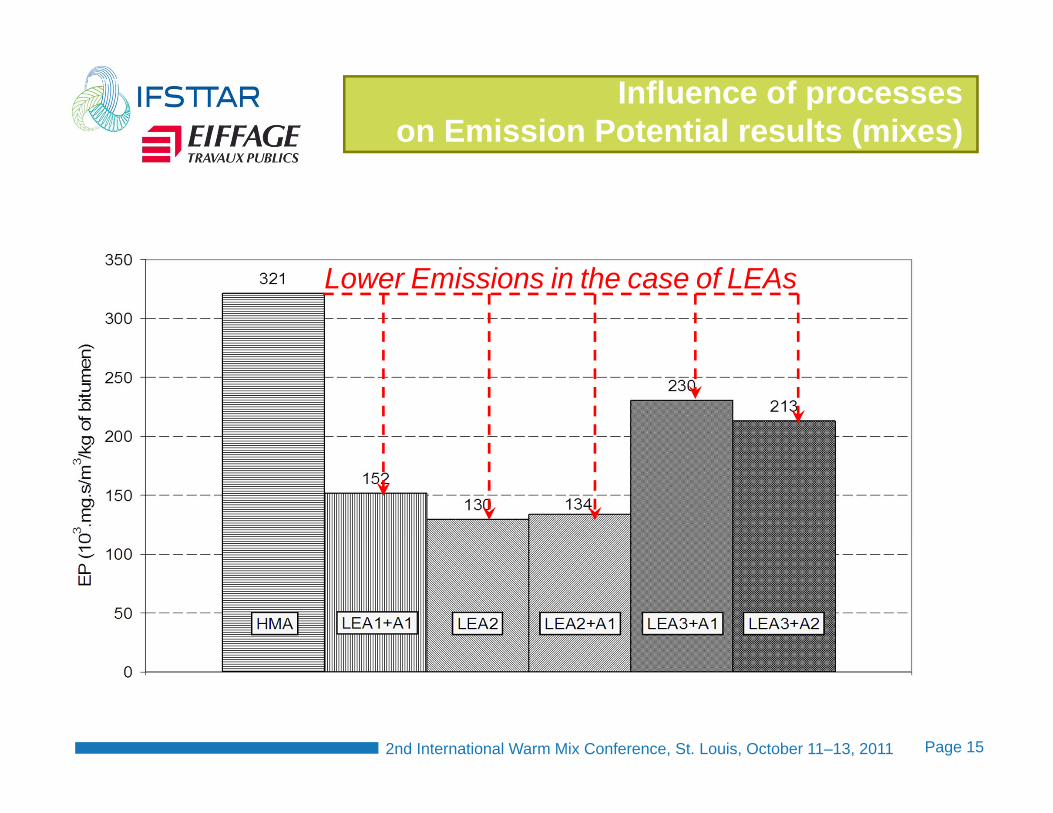
Effect of production process on Emission Potential
Lower Emissions in the case of LEAs
Influence of processes on Emission Potential results (mixes)
Page 162nd International Warm Mix Conference, St. Louis, October 11–13, 2011
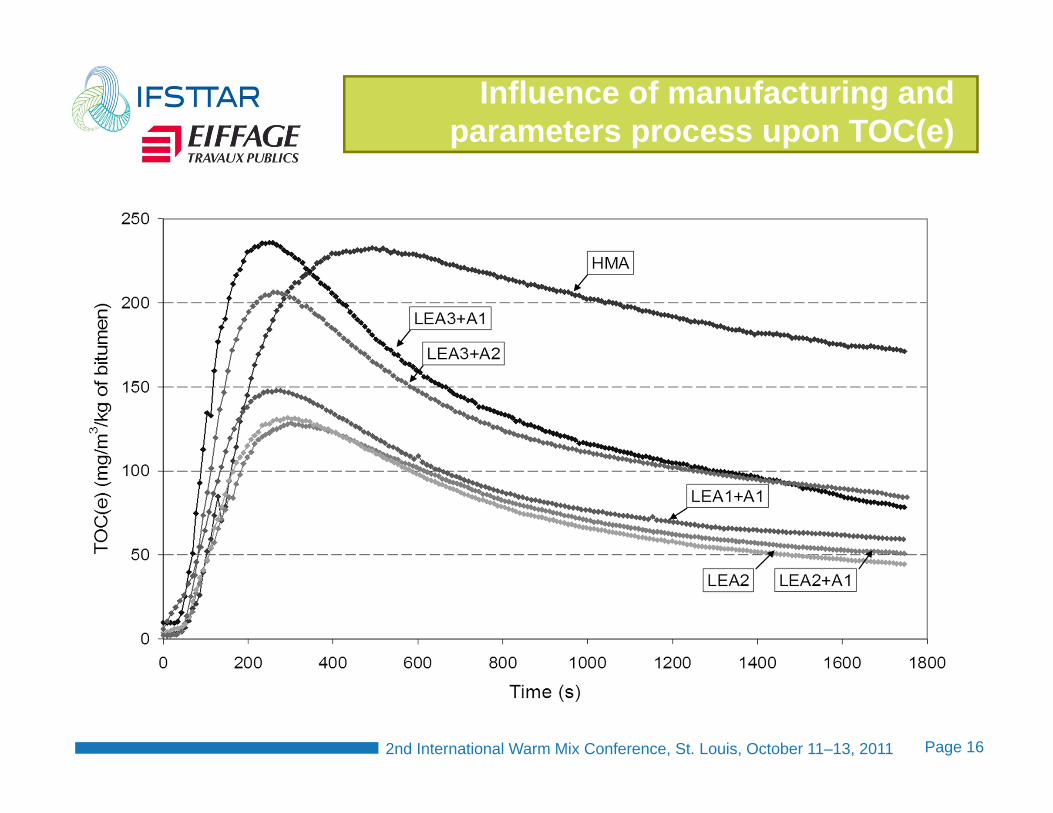
Influence of manufacturing and parameters process upon TOC(e)
emissions
Page 172nd International Warm Mix Conference, St. Louis, October 11–13, 2011
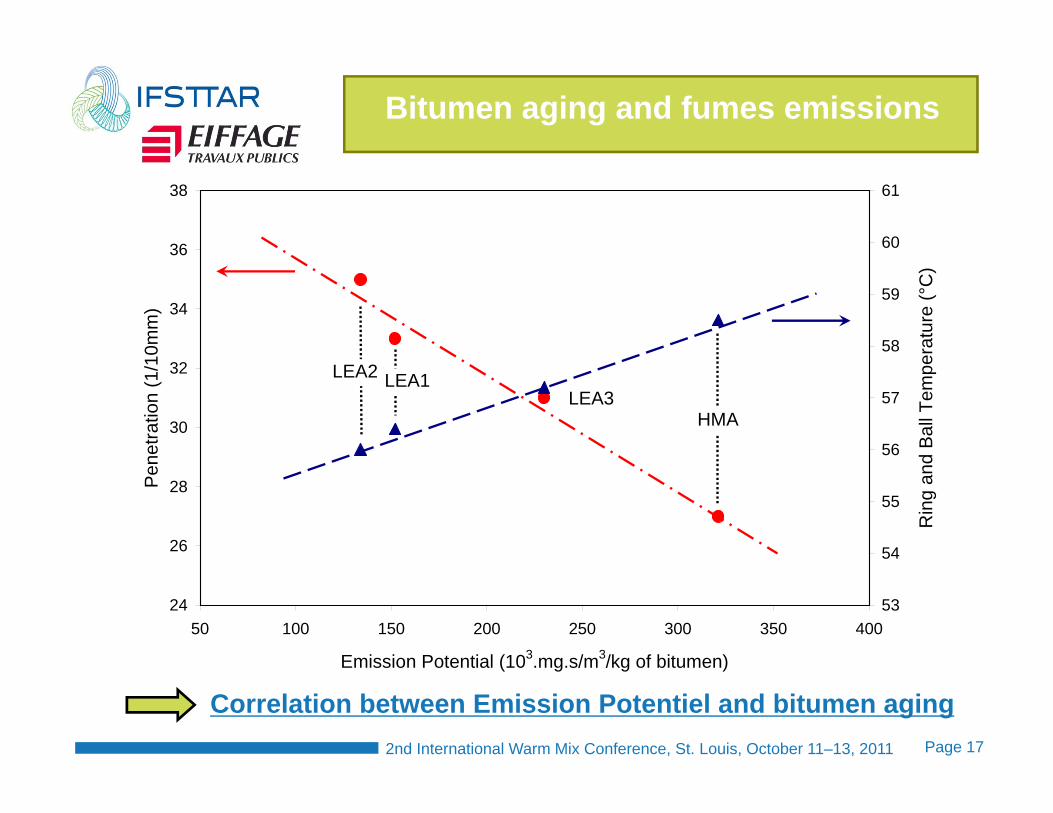
24
26
28
30
32
34
36
38
50 100 150 200 250 300 350 400
Emission Potential (103.mg.s/m3/kg of bitumen)
Pen
etra
tion
(1/1
0mm
)
53
54
55
56
57
58
59
60
61
Rin
g an
d B
all T
empe
ratu
re (°
C)
LEA3LEA2 LEA1
HMA
Bitumen aging and fumes emissions
Correlation between Emission Potentiel and bitumen aging
Page 182nd International Warm Mix Conference, St. Louis, October 11–13, 2011
• Main findings
– The values of stiffness modulus and fatigue resistance for the LEA mixes are very close to those obtained for HMA
– Use of experimental devices by IFSTTAR to assess environmental properties of asphalt mixes (Hot, Warm and Half-Warm mixes asphalt) and bitumen
– A lower manufacturing temperature leads to a global emission reduction in laboratory
– Mix composition and manufacturing conditions influence emissions
Conclusions
Recommended