www.fertilizerseurope.com
Forecast of Food, Farming and Fertilizer Use in EU 27
Meeting EUROSTAT - 7 and 8 October 2010

www.fertilizerseurope.com
Methodologies for a crop based approach
The EFMA
Forecast training

www.fertilizerseurope.com
The Fertilizers Europe forecast
The crop-based approach.
The « fertilizer consumption parameters »:Basic parameters :
• Crop areas.• Nutrients application rates.• Crop yield (or production).
>> Help to later assess the evolution of the application rates.When relevant : % of crop area fertilized.
>> To extrapolate actual fertilizer consumption from total area, whenonly effective application rates are known.
When collecting crop data:• Focus on main « fertilizer consuming crops », make assessment
when necessary.• Better to assess part of the market with reliable data, then to
extrapolate to 100% of the known fertilizer consumption

www.fertilizerseurope.com
The Fertilizers Europe forecast
The crop based approach (continued).
Main methodologies to achieve crop-based approach :
Agro-economic models adapted when :• Crop data is easily available to « feed » the model.• No major policy change (break in trend) is foreseen.
Expert based approach better adapted when :• Data availability is partial or critical.• Major policy changes are expected during the period.
>> This is often the situation in EU

www.fertilizerseurope.com
The Fertilizers Europe forecast
Particular requirements crop based / expert based
The forecast is made by « projection » and not byextrapolating time series (as in models), therefore :
A sound and solid basis is key :• Data for base year should be as solid (and reliable) as
possible.• Cross the estimated values for current year with known
market fertilizer consumption (sales).
A clear description of the future market conditions is alsoessential :
>> Defining a « scenario for the future » greatly facilitates the « projection » of the crop parameters, and help to justifythe foreseen evolution.

www.fertilizerseurope.com
The objectives, principles and main steps
of Fertilizers Europe methodology
The Fertilizers Europe forecast

www.fertilizerseurope.com
Objectives, principles and main steps of ourmethodology
Objectives & principles
Long term consumption forecast :
Parallel and convergent with sales forecast:« Full convergence » by campaign n-2/n-3.
An expert based approach
A « bottom-up » procedure, step by step :Per country.Crop acreage forecast, considering :
• Global and European Agro-economic trends.• Agricultural policies.
Application rate forecast, considering : • Evolution of technologies and agricultural practices.• Environmental policies.
Short term to long term forecast :5 Campaigns : n-2/n-1, n-1/n, n/n+1, n+4/n+5, n+9/n+10
Based on « scenarios for the future » :General agro-economic trends, global and European.National projections.

www.fertilizerseurope.com
Time schedule
Various stages of the process : an expert approach
1/ Building a scenario : MarchThe « European context », prepared by the leader of the WG :
• Agro-economic series & trends, world & Europe.• Agricultural & Environmental policies.
2/ Our scenario for a European agriculture. AprilThe impact on fertilizer use, as foreseen by the forecast WG.
3/ Adapting our scenario to national level. MayThe impact of national situation and policies >> the « country report ».
4/ Making the national forecast. May- June
5/ Finalizing the European approach. JuneCritical approach of the forecast WG on each national scenario.
6/ Finalizing the EU forecast : integration of all nationals. July
7/ Publishing and circulating the forecast. September
www.fertilizerseurope.com
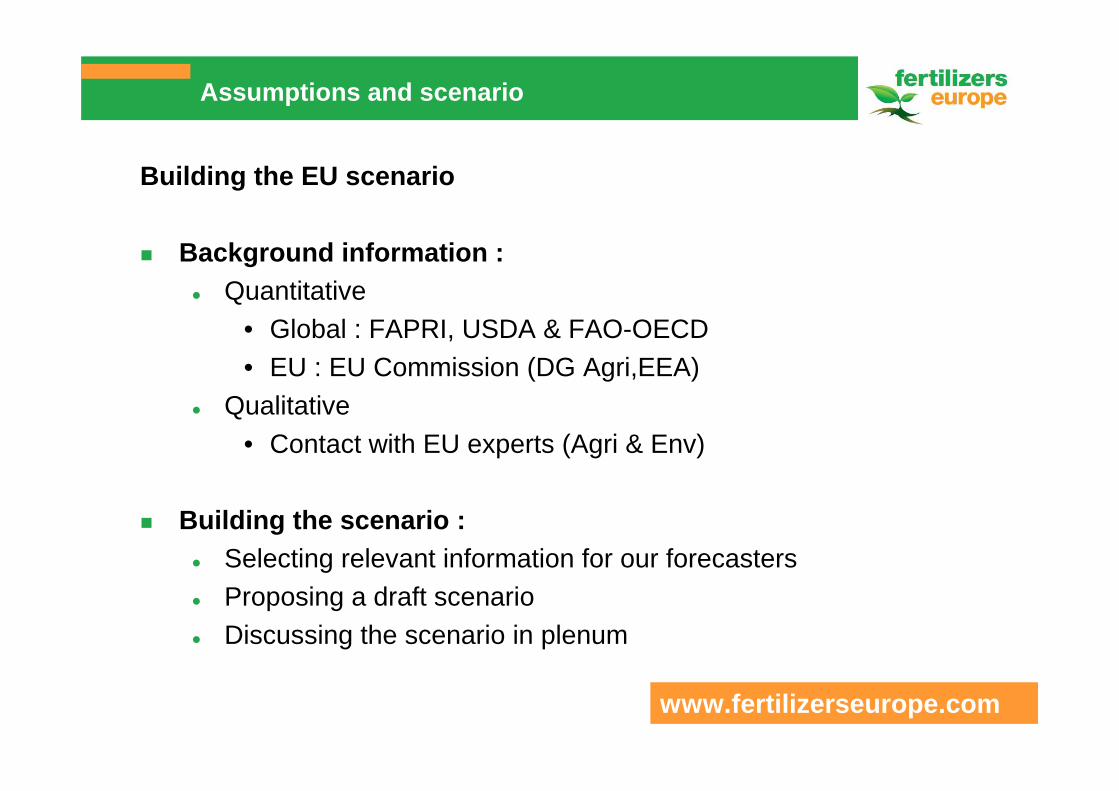
Assumptions and scenario
Building the EU scenario
Background information :Quantitative
• Global : FAPRI, USDA & FAO-OECD• EU : EU Commission (DG Agri,EEA)
Qualitative• Contact with EU experts (Agri & Env)
Building the scenario :Selecting relevant information for our forecastersProposing a draft scenarioDiscussing the scenario in plenum

www.fertilizerseurope.com
Background information for the EU scenario
Commodity market development in EuropeFertilizers Europe Forecast 2009/2019

www.fertilizerseurope.com
Commodity market development in EuropeFertilizers Europe Forecast 2009/2019
Background information for the EU scenario
EC Prospects for Agric Markets & Income in the EU, 2008-2015

www.fertilizerseurope.com
The National approach
Developing the Expertise
Example: Sources of information for Application rate
Crop needs (- nutrients from other sources).Advisory service, consultants.Publications (scientific, “Farmers weekly”).Your control calculation.Watch “other nutrient sources” (National budget !) :
farmyard manure, slurrysewage sludgeothers

www.fertilizerseurope.com
http://statistics.defra.gov.uk/esg/publications/auk/2007/default.asp
http://www.defra.gov.uk/farm/environment/land-manage/nutrient/pdf/bsfp2007.pdf
Statistical yearbook.Newspapers, journals, etc…News agencies e.g. Agra Europe.Press releases :
- Ministry of Agriculture.- Growers associations.- Newspaper / journal for merchants.- International produce traders.- Plant breeders / -associations.
The National approach
Sources of information for Crop area planted :
The Fertilizers Europe forecast

www.fertilizerseurope.com
Implementation of EU-rules and –programmes.National programmes.National / regional limitations.points of discussion (conferences, media).Intensity of discussions (conferences, media).Direct contacts (ministry, NGOs, administration).
The National approach
Sources of information for Environmental policy :
The Fertilizers Europe forecast

www.fertilizerseurope.com
« Forecast of Food, Farming and Fertilizer use in EU »
Three main outputs :
The Fertilizers Europe forecast data book (internal use).
The Fertilizers Europe forecast leaflet (public circulation).
The Fertilizers Europe forecast presentation.
( A new leaflet in project )
The Fertilizers Europe forecast

www.fertilizerseurope.com
Outcome example – Forecast 2009/2019
Forecast changes in farming food crops in EU27
barley
grain maize
rye, oats, rice
potato
wheat
sugarbeet
oilseedrape
-30% -20% -10% 0% 10% 20% 30% 40% 50% 60%
Area (ha)
Yield (q/ha)
Forecast changes : 2018/19 - Ref. **

www.fertilizerseurope.com
0.000
2.000
4.000
6.000
8.000
10.000
12.000
14.000
16.000
1927
1932
1937
1942
1947
1952
1957
1962
1967
1972
1977
1982
1987
1992
1997
2002
2007
2012
2017
N P2O5 K2O
Fertilizer nutrient consumption in the European Union 27
Nutrient (million tonnes)
+ 3.0
- 4.4
- 9.7
Reference Reference
2009 2007
+ 4.1
+ 7.7
+ 3.9
Forecast 2009/2019 – evolution with 2009 and 2007 reference
www.fertilizerseurope.com
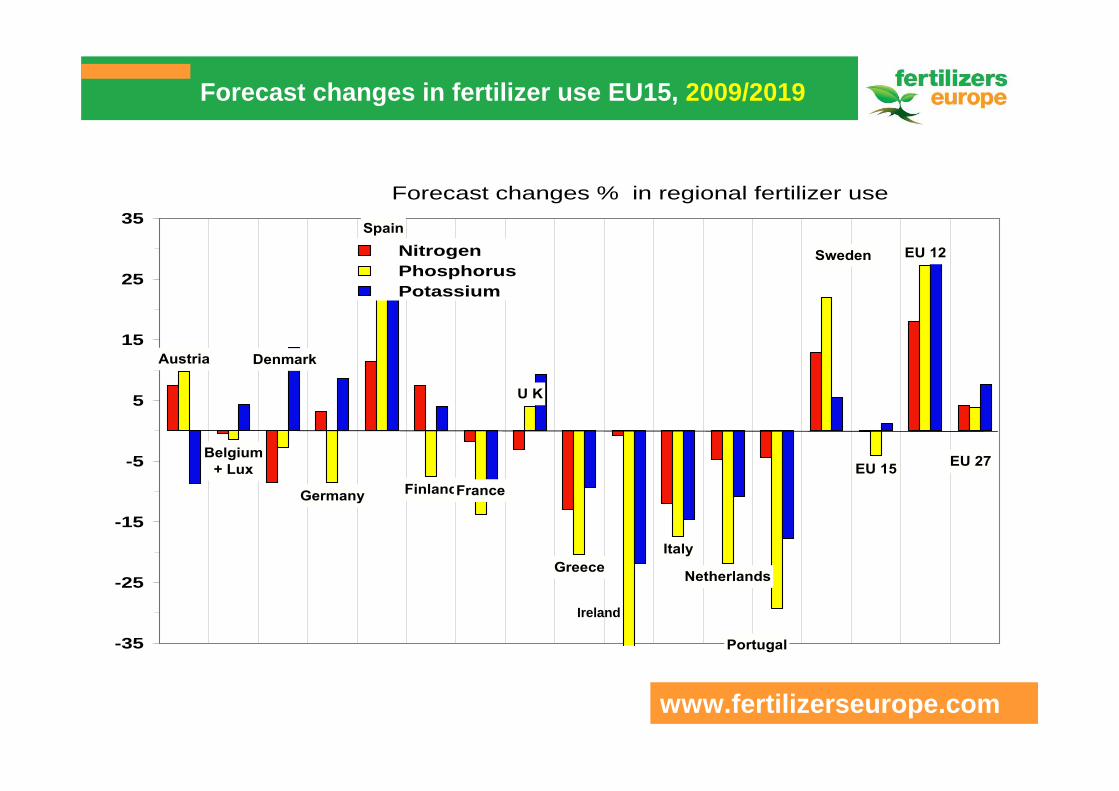
Forecast changes in fertilizer use EU15, 2009/2019
Austria
Germany Finland
U K
GreeceItaly
Netherlands
EU 15
EU 12
EU 27
Denmark
France
Spain
Portugal
Sweden
Belgium+ Lux
-35
-25
-15
-5
5
15
25
35
Nitrogen Phosphorus Potassium
Forecast changes % in regional fertilizer use
Ireland

www.fertilizerseurope.com
The Fertilizers Europe forecast
Fertilizers Europe Forecast of Food, Farming and Fertilizer Use,
a reference in EU
www.fertilizerseurope.com
The Fertilizers Europe forecast
Fertilizers Europe Forecast, a reference in EU.
Organizations:IFA and FAOEU Commission: DG AGRI, DG ENV, DG TRENEUROSTATEEAIIASA (International Institute for Applied Systems Analysis)COPA COGECAEISA (European Initiative for Sustainable development in Agriculture)
Studies, preparation of legislationsCAPRI modelNEC directiveWells to Wheels >> 2008 Directive on Renewable EnergyGothenburg Protocol (UN ECE)Revision ECCP 1
Recommended