N H A N E S S u m m a r y D a t a R e p o r t
For the Vision & Eye Health Surveillance
System
LAST UPDATED:
6/19/2018
PRESENTED TO:
Jinan Saaddine,
Division of Diabetes Translation,
Centers for Disease Control and
Prevention
PRESENTED BY:
John Wittenborn,
Emily Phillips
NORC at the University of Chicago

NORC | NHANES Summary Data Report
VISION & EYE HEALTH SURVEILLANCE SYSTEM | I
Table of Contents
Dataset Description .................................................................................................................. 1
Purpose: ............................................................................................................................. 1
Sample Design: .................................................................................................................. 1
Data Collection Procedures: ............................................................................................... 1
Analysis Process and Suppression ......................................................................................... 3
Vision-related Variables: ..................................................................................................... 3
Stratification Variables: ....................................................................................................... 5
Internal Validation ..................................................................................................................... 7
Sample Size ........................................................................................................................ 7
Validating Responses ......................................................................................................... 7
Limitations ................................................................................................................................. 8
Summary Outcome Measures .................................................................................................. 9

NORC | NHANES Summary Data Report
VISION & EYE HEALTH SURVEILLANCE SYSTEM | II
List of Tables
Table 1. Overview of included NHANES vision questions ..................................................... 4
Table 2. Overview of included NHANES eye examination based measures ......................... 5
Table 3. NHANES Stratification Variable Frequencies .......................................................... 6
Table 4. Self-reported eye disease diagnosis and exam rates .............................................. 7
Table 5. National Estimates of Prevalence of AMD 2005-2008, based on self-reported diagnosis ................................................................................................................ 9
Table 6. National Estimates of Prevalence of AMD 2005-2008, based on examination ...... 10
Table 7. National Estimates of Prevalence of Glaucoma 2005-2008, based on self-reported diagnosis .............................................................................................................. 11
Table 8. National Estimates of Prevalence of Glaucoma 2005-2008, based on examination .......................................................................................................... 12
Table 9. National Estimates of Prevalence of Diabetic Retinopathy 2005-2008, based on self-reported diagnosis (per overall US population) ............................................... 13
Table 10. National Estimates of Prevalence of Diabetic Retinopathy 2005-2008, based on examination data .................................................................................................. 14
Table 11. National Estimates of Prevalence of Cataract Surgery 2005-2008, based on self-report .................................................................................................................... 15
Table 12. National Estimates of Prevalence of Normal Vision (≤20/30 best-corrected acuity in the better-seeing eye), 1999-2008 ........................................................................ 16
Table 14. National Estimates of Prevalence of Any Vision Loss (≤20/40 best-corrected acuity in the better-seeing eye, 1999-2008 ...................................................................... 17
Table 15. National Estimates of Prevalence of Visual Impairment (20/40- >20/200 best-corrected acuity in the better-seeing eye, 1999-2008 ............................................ 18
Table 16. National Estimates of Prevalence of Blindness (≤20/200 best-corrected acuity in the better-seeing eye, 1999-2008 ......................................................................... 19
Table 17. National Estimates of Prevalence of Monocular Vision Loss (≤20/40 best-corrected acuity in either eye, 1999-2008 ............................................................................. 20
Table 18. National Estimates of Prevalence of Presenting Normal Vision (≤20/30 presenting acuity in the better-seeing eye), 1999-2008 .......................................................... 21
Table 19. National Estimates of Prevalence of Presenting Vision Loss (≤20/40 presenting acuity in the better-seeing eye, 1999-2008 ........................................................... 22
Table 20. National Estimates of Prevalence of Presenting Visual Impairment (20/40- >20/200 presenting acuity in the better-seeing eye, 1999-2008 .......................................... 23

NORC | NHANES Summary Data Report
VISION & EYE HEALTH SURVEILLANCE SYSTEM | III
Table 21. National Estimates of Prevalence of Presenting Blindness (≤20/200 presenting acuity in the better-seeing eye, 1999-2008 ........................................................... 24
Table 22. National Estimates of Prevalence of Presenting Monocular Vision Loss (≤20/40 presenting acuity in either eye, 1999-2008 ............................................................ 25
Table 23. National Estimates of Uncorrected Refractive Error (≤20/50 presenting acuity in the better-seeing eye, improving to <20/40 with correction), 1999-2008 ..................... 26
DISCLAIMER: The findings and conclusions in this report are those of the authors and do not necessarily represent the official position of NORC at the University of Chicago or the Centers for Disease Control and Prevention.
This report is currently undergoing Section 508 compliance review.

NORC | NHANES Summary Data Report
VISION & EYE HEALTH SURVEILLANCE SYSTEM | 1
Dataset Description
Purpose:
The National Health and Nutrition Examination Survey (NHANES) is a program of studies designed to
assess the health and nutritional status of adults and children in the United States. The survey is unique in
that it combines interviews and physical examinations. NHANES is a major program of the National
Center for Health Statistics (NCHS). NCHS is part of the Centers for Disease Control and Prevention
(CDC) and has the responsibility for producing vital health statistics for the nation. In 1999, the survey
became a continuous program that has a changing focus on a variety of health and nutrition measurements
to meet emerging needs.
Sample Design:
The survey examines a nationally representative sample of about 5,000 people per round, with 2-year data
sets available for analysis. The sample for the survey is selected to represent the US population of all
ages, and is sampled from 15 counties per year. To produce reliable statistics, NHANES over-samples
people aged 60 years and older, African Americans, Hispanics, and low-income non-Hispanic White and
Other Race adults. In 1999–2006, NHANES oversampled Mexican-Americans, African Americans, low-
income White and Other Race people, adolescents aged 12-19, and non-Hispanic White and Other Race
adults aged 70 and over. A supplemental sample included pregnant women. In 2007–2008, NHANES
oversampled Hispanics, non-Hispanic African Americans, low-income non-Hispanic White and Other
Race adults, and non-Hispanic White and Other Race adults aged 80 and over. NHANES generally top-
codes age at 85 years, but top-coded at age 80 years in the 2007-2008 data. We therefore top-code all
NHANES data at age 80.
Data Collection Procedures:
The NHANES interview includes demographic, socioeconomic, dietary, and health-related questions. The
examination component consists of medical, dental, and physiological measurements, as well as
laboratory tests administered by highly trained medical personnel.
All participants visit the physician. Dietary interviews and body measurements are included for everyone.
All but the very young have a blood sample taken and have a dental screening. Depending on the age of
the participant, the rest of the examination includes tests to assess various aspects of health. In general,
the older the individual, the more extensive the examination.
Health interviews are conducted in respondents’ homes. Health measurements are performed in specially-
designed and equipped mobile centers, which travel to locations throughout the country. The study team
consists of a physician, medical and health technicians, and dietary and health interviewers. Many of the
study staff are bilingual (English/Spanish).

NORC | NHANES Summary Data Report
VISION & EYE HEALTH SURVEILLANCE SYSTEM | 2
NHANES included visual examinations from 1999–2008. From 2005–2008 NHANES included
ophthalmology examinations, including retinal imaging and Frequency Doubling Technology (FDT) tests
for visual field loss from eye diseases. NHANES has not included visual health content since 2008.

NORC | NHANES Summary Data Report
VISION & EYE HEALTH SURVEILLANCE SYSTEM | 3
Analysis Process and Suppression
For the VEHSS team, NORC estimated the prevalence rate and sample size for each survey instrument
selected for inclusion. We merged samples from the 1999–2008 and 2005–2008 rounds for analysis to
maximize the available sample sizes for more detailed levels of stratification.
For binary response questions included in the analysis, prevalence rate was defined as the number of
people who gave an affirmative response to the question divided by the total number of respondents who
gave an affirmative or negative response. The result was then multiplied by 100 to obtain a percentage.
For scaled responses (e.g., mild, moderate, severe), the data value was the proportion of respondents that
selected one of the possible response options, and all responses should sum to 100%. We estimated upper
and lower confidence intervals and the relative standard error (RSE) of the prevalence estimate using the
Clopper-Pearson method.1 The respondent sample size was reported for each response.
Estimates were calculated using the SAS Surveyfreq command to account for the weights and complex
sample design of NHANES. Estimates that were based on a sample size less than 30 and/or with a RSE
greater than 30% were suppressed.
Vision-related Variables:
NHANES contained a number of vision-related questions and examinations from 1999 to 2008. VEHSS
selected several for analysis. Tables 1 and 2 presents details on each question and examination included
in this analysis, including the VEHSS indicator topic and category, NHANES variable name, the year(s)
survey data are available, the survey question/examination classification, and the response options.
Estimates for Uncorrected Refractive Error (URE) were calculated based on NHANES visual acuity
examination measures. Respondents were classified as having URE if they had presenting acuity in the
worse eye of 20/50 or worse, and their acuity improved to better than 20/40 with correction by an auto
refractor.
1 Parker JD, Talih M, Malec DJ, et al. (2017). National Center for Health Statistics Data Presentation Standards for Proportions.
National Center for Health Statistics. Vital Health Stat 2(175).

NORC | NHANES Summary Data Report
VISION & EYE HEALTH SURVEILLANCE SYSTEM | 4
Table 1. Overview of included NHANES vision questions
NHANES eye health questions and response options
VEHSS Indicator Topic
VEHSS Indicator Category
NHANES Variable Name
Years Available Question
Response Options
Visual Function Blind or Difficulty Seeing
VIQ017
2005-2008 Are you/Is survey participant blind in both eyes?
1 Yes
2 No
Service Utilization Cataract Surgery VIQ071 2005-2008 Have you/Has survey participant ever had a cataract operation?
1 Yes
2 No
Eye Health Conditions
Self-report glaucoma VIQ090 2005-2008 Have you/Has survey participant ever been told by an eye doctor that {you have/s/he has} glaucoma (gla-co-ma), sometimes called high pressure in {your/his/her} eyes?
1 Yes
2 No
Eye Health Conditions
Self-report age related macular degeneration
VIQ310 2005-2008 Have you/Has survey participant ever been told by an eye doctor that {you have/s/he has} age-related macular (mac-u-lar) degeneration?
1 Yes
2 No
Eye Health Conditions
Self-report diabetic retinopathy
DIQ080 2005-2008 Has a doctor ever told you/survey participant that diabetes has affected {your/his/her} eyes or that {you/s/he} had retinopathy (ret-in-op-ath-ee)?
1 Yes
2 No

NORC | NHANES Summary Data Report
VISION & EYE HEALTH SURVEILLANCE SYSTEM | 5
Table 2. Overview of included NHANES eye examination based measures
NHANES eye health questions and response options
VEHSS Indicator Topic VEHSS Indicator Category NHANES Variables Used Years Available
Eye Health Conditions Exam-based glaucoma OPASCST2 - Exam status;
OPXDGLAU - Glaucoma, right eye;
OPXSGLAU - Glaucoma, left eye
2005-2008
Eye Health Conditions Exam-based age related macular degeneration
OPDUARMA - Any retinopathy, worse eye
2005-2008
Eye Health Conditions Exam-based diabetic retinopathy
DIQ010 - Doctor told you have diabetes;
LBXGH - Glycohemoglobin (%);
OPDURET - Retinopathy level, worse eye
2005-2008
Visual Acuity Measures* Presenting Visual Acuity
VIDRVA - Right visual acuity, presenting; VIDLVA - Left visual acuity, presenting
VIQ017-Blind in both eyes*
1999-2008
Visual Acuity Measures* Best-corrected Visual Acuity
VIDROVA - Right visual acuity, w/ obj. refraction;
VIDLOVA - Left visual acuity, w/ obj. refraction
VIQ017-Blind in both eyes*
1999-2008
Visual Acuity Measures Uncorrected Refractive Error
VIDRVA - Right visual acuity, presenting;
VIDLVA - Left visual acuity, presenting;
VIDROVA - Right visual acuity, w/ obj. refraction;
VIDLOVA - Left visual acuity, w/ obj. refraction
1999-2008
*Self-reported blind people were included as blind
Stratification Variables:
We stratified the vision-related prevalence rates by age, sex, race/ethnicity, and health risk factor. This
report includes estimates for each stratification factor. The VEHSS data visualization and data portal
includes NHANES estimates for the included variables by all combinations of stratification variables.
We merged multiple years of data to maximize available sample size. Visual acuity examination results
were available from 1999-2008 (1999-00, 2001-02, 2003-04, 2005-06, 2007-08 rounds), while the
selected eye health questions were available from 2005-2008 (2005-06, 2007-08 rounds).
Participant ages ranged from 12 to 85 (NHANES only reported ages to 85 years in the 1999-2006 rounds
and to 80 years in the 2007-2008 round) and were recoded into the following categories: 12-17 years, 18-
NORC | NHANES Summary Data Report
VISION & EYE HEALTH SURVEILLANCE SYSTEM | 6
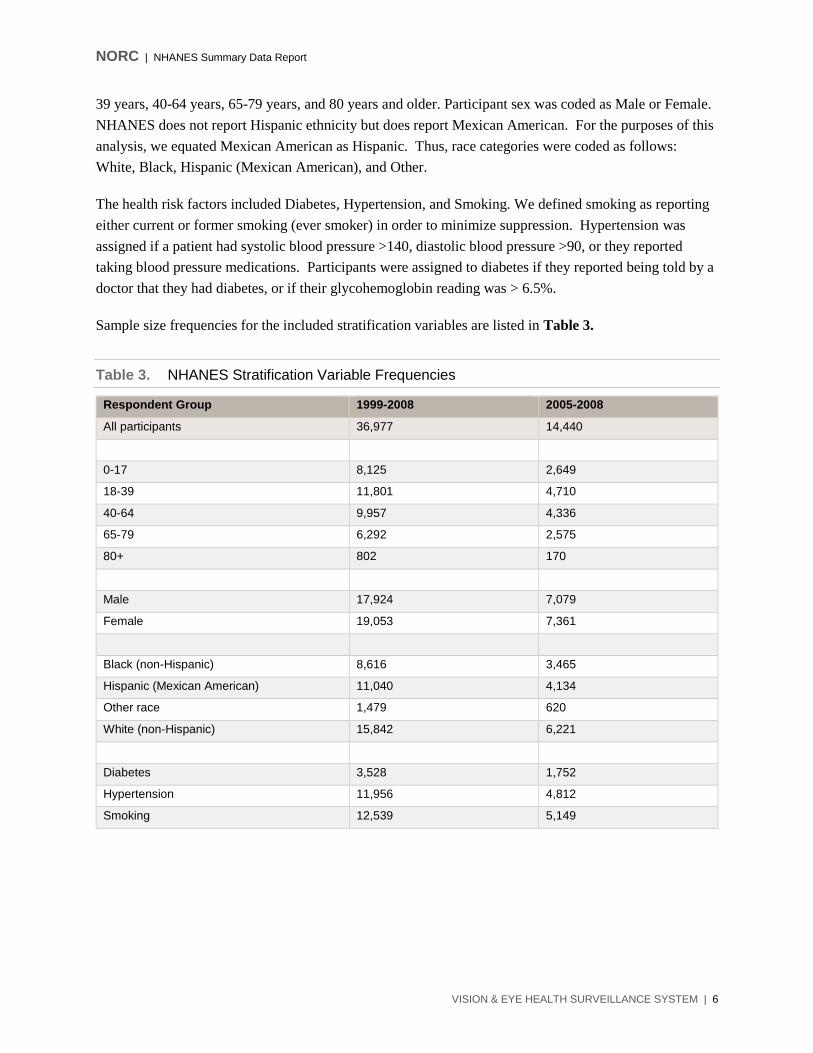
39 years, 40-64 years, 65-79 years, and 80 years and older. Participant sex was coded as Male or Female.
NHANES does not report Hispanic ethnicity but does report Mexican American. For the purposes of this
analysis, we equated Mexican American as Hispanic. Thus, race categories were coded as follows:
White, Black, Hispanic (Mexican American), and Other.
The health risk factors included Diabetes, Hypertension, and Smoking. We defined smoking as reporting
either current or former smoking (ever smoker) in order to minimize suppression. Hypertension was
assigned if a patient had systolic blood pressure >140, diastolic blood pressure >90, or they reported
taking blood pressure medications. Participants were assigned to diabetes if they reported being told by a
doctor that they had diabetes, or if their glycohemoglobin reading was > 6.5%.
Sample size frequencies for the included stratification variables are listed in Table 3.
Table 3. NHANES Stratification Variable Frequencies
Respondent Group 1999-2008 2005-2008
All participants 36,977 14,440
0-17 8,125 2,649
18-39 11,801 4,710
40-64 9,957 4,336
65-79 6,292 2,575
80+ 802 170
Male 17,924 7,079
Female 19,053 7,361
Black (non-Hispanic) 8,616 3,465
Hispanic (Mexican American) 11,040 4,134
Other race 1,479 620
White (non-Hispanic) 15,842 6,221
Diabetes 3,528 1,752
Hypertension 11,956 4,812
Smoking 12,539 5,149

NORC | NHANES Summary Data Report
VISION & EYE HEALTH SURVEILLANCE SYSTEM | 7
Internal Validation
Sample Size
Due to the relatively small sample size in each round, we pooled all available data to create prevalence
estimates. Pooling data reduces statistical uncertainty (95% confidence interval and RSE) and therefore
also reduces suppression. Most cross-tabulations would be suppressed without pooling data based on the
VEHSS suppression algorithm. The visual acuity results were pooled across 10 years of observations.
We found no significant trend of acuity outcomes over this period. All values for the self-report blind
question were suppressed due to small sample sizes.
Validating Responses
We reviewed the internal validity of responses where possible. The only vision question included in this
analysis was self-reported blind. Those with a positive response were not given vision exams, and
therefore responses to this question cannot be validated internally. In future updates, VEHSS plans to
include additional NHANES questions for analysis.
We are able to compare self-report response rates to exam results for AMD, diabetic retinopathy, and
glaucoma. For all three conditions, among respondents reporting a diagnosis, the majority were not
confirmed by the NHANES retinal image results. Such a result could be due to reporting error, or lack of
sensitivity in the NHANES retinal exam.
Also for all three conditions, among respondents identified with eye disease in the NHANES exam, the
majority did not report a history of a diagnosis, implying that most cases of these eye diseases may be
undiagnosed.
Table 4. Self-reported eye disease diagnosis and exam rates
Age related macular degeneration
Diabetic retinopathy*
Glaucoma
Missing diagnosis response or examination result*
53.98% 94.93% 53.90%
No diagnosis in either self-report or exam 42.25% 2.84% 43.48%
Self-reported diagnosis, confirmed by exam 0.54% 0.50% 0.41%
Self-reported diagnosis, not confirmed by exam
0.74% 0.56% 1.65%
Undiagnosed (positive exam, no self-report) 2.48% 1.17% 0.55%
*Persons without diabetes included in ‘Missing diagnosis response or examination result’

NORC | NHANES Summary Data Report
VISION & EYE HEALTH SURVEILLANCE SYSTEM | 8
Limitations
This analysis includes a number of limitations. NHANES collected self-report and examination data on
vision and eye health outcomes from 1999-2008. Most vision self-report measures and examinations
were limited to 2005-2008. We did not include self-report vision measures in this analysis because such
data is available in larger and more recent surveys analyzed as part of the VEHSS project. NHANES is
the only nationally representative source of examination data, but this data suffers from small sample size,
was not based on a gold standard dilated eye exam, and is now 10-14 years old. NHANES has a very
small sample for older adults, top-codes age at 80 starting in the 2007-2008 round, and does not include
institutionalized persons. It is also possible that blind persons in the community may be less likely to
participate in NHANES due to difficulty traveling to the examination site. Thus, NHANES likely does
not fully capture the populations with the highest burden of vision loss.
NORC | NHANES Summary Data Report
VISION & EYE HEALTH SURVEILLANCE SYSTEM | 9
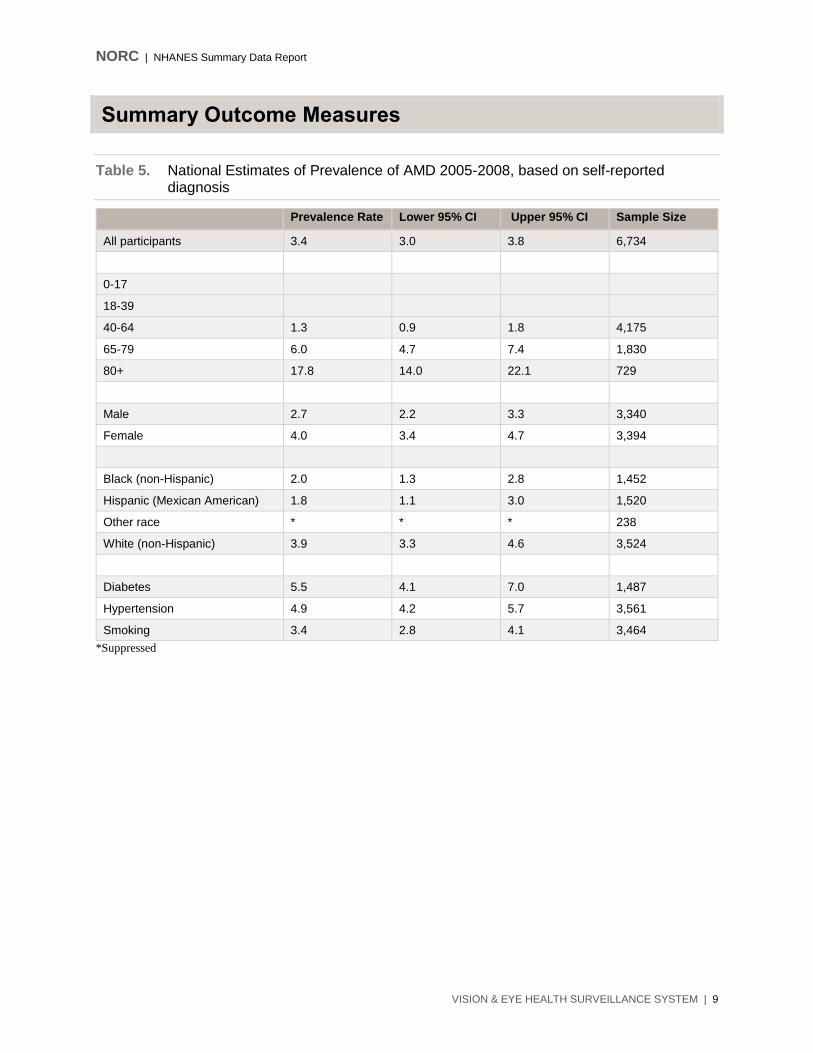
Summary Outcome Measures
Table 5. National Estimates of Prevalence of AMD 2005-2008, based on self-reported diagnosis
Prevalence Rate Lower 95% CI Upper 95% CI Sample Size
All participants 3.4 3.0 3.8 6,734
0-17
18-39
40-64 1.3 0.9 1.8 4,175
65-79 6.0 4.7 7.4 1,830
80+ 17.8 14.0 22.1 729
Male 2.7 2.2 3.3 3,340
Female 4.0 3.4 4.7 3,394
Black (non-Hispanic) 2.0 1.3 2.8 1,452
Hispanic (Mexican American) 1.8 1.1 3.0 1,520
Other race * * * 238
White (non-Hispanic) 3.9 3.3 4.6 3,524
Diabetes 5.5 4.1 7.0 1,487
Hypertension 4.9 4.2 5.7 3,561
Smoking 3.4 2.8 4.1 3,464
*Suppressed

NORC | NHANES Summary Data Report
VISION & EYE HEALTH SURVEILLANCE SYSTEM | 10
Table 6. National Estimates of Prevalence of AMD 2005-2008, based on examination
Prevalence Rate Lower 95% CI Upper 95% CI Sample Size
All participants 6.6 5.6 7.7 5,604
0-17
18-39
40-64 3.1 2.3 3.9 3,634
65-79 12.5 10.6 14.5 1,506
80+ 34.4 30.1 38.9 464
Male 6.5 5.4 7.8 2,811
Female 6.6 5.5 7.9 2,793
Black (non-Hispanic) 2.6 1.7 3.7 1,139
Hispanic (Mexican American) 4.8 3.7 6.2 1,265
Other race * * * 183
White (non-Hispanic) 7.4 6.2 8.8 3,017
Diabetes 7.9 6.4 9.7 1,146
Hypertension 9.1 7.3 11.1 2,801
Smoking 7.3 6.2 8.5 2,954
*Suppressed
NORC | NHANES Summary Data Report
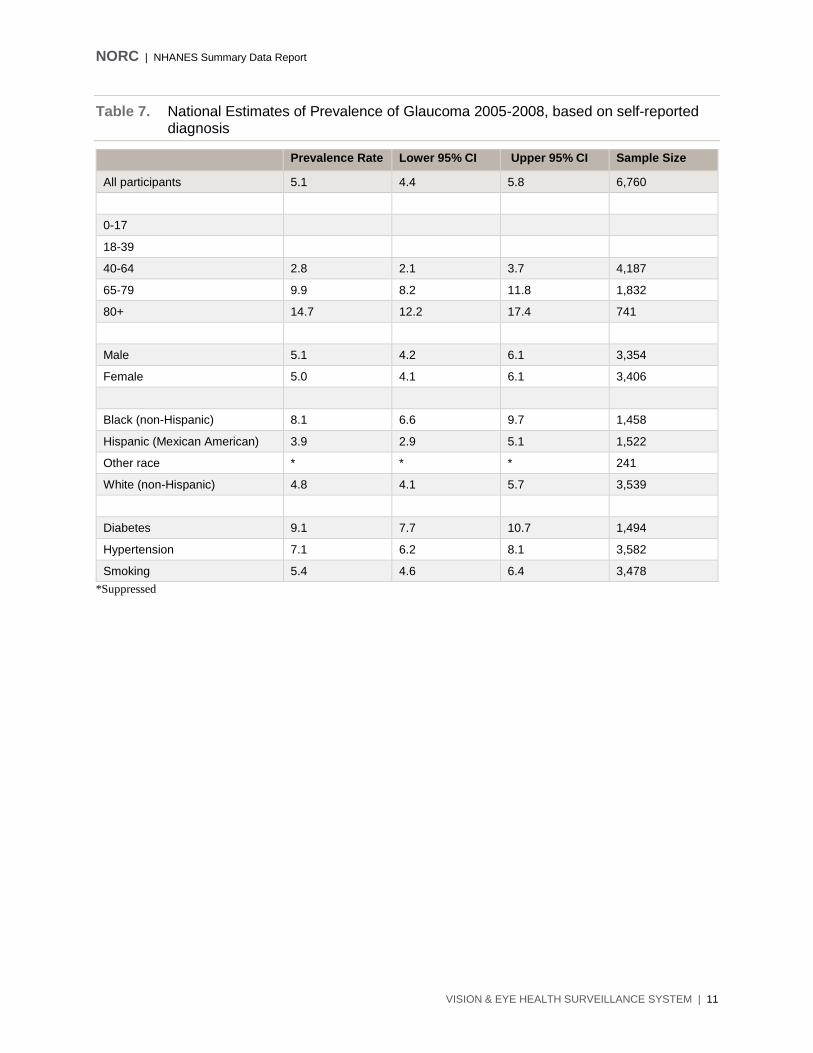
VISION & EYE HEALTH SURVEILLANCE SYSTEM | 11
Table 7. National Estimates of Prevalence of Glaucoma 2005-2008, based on self-reported diagnosis
Prevalence Rate Lower 95% CI Upper 95% CI Sample Size
All participants 5.1 4.4 5.8 6,760
0-17
18-39
40-64 2.8 2.1 3.7 4,187
65-79 9.9 8.2 11.8 1,832
80+ 14.7 12.2 17.4 741
Male 5.1 4.2 6.1 3,354
Female 5.0 4.1 6.1 3,406
Black (non-Hispanic) 8.1 6.6 9.7 1,458
Hispanic (Mexican American) 3.9 2.9 5.1 1,522
Other race * * * 241
White (non-Hispanic) 4.8 4.1 5.7 3,539
Diabetes 9.1 7.7 10.7 1,494
Hypertension 7.1 6.2 8.1 3,582
Smoking 5.4 4.6 6.4 3,478
*Suppressed
NORC | NHANES Summary Data Report
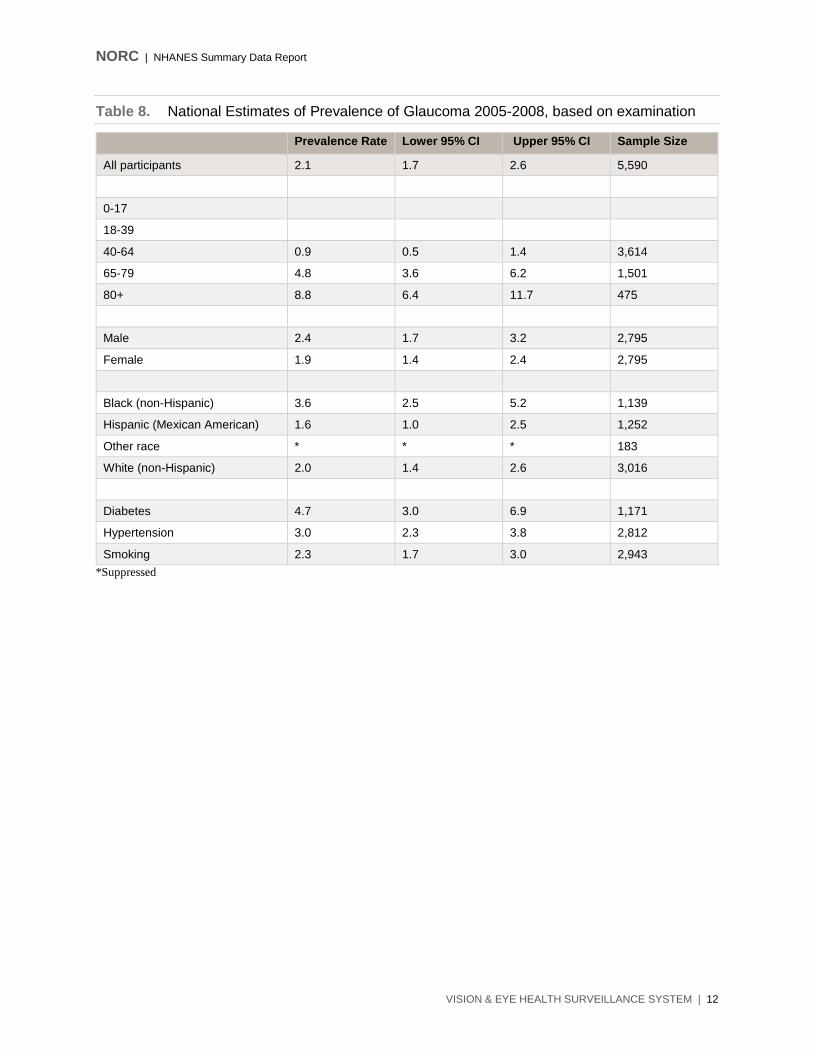
VISION & EYE HEALTH SURVEILLANCE SYSTEM | 12
Table 8. National Estimates of Prevalence of Glaucoma 2005-2008, based on examination
Prevalence Rate Lower 95% CI Upper 95% CI Sample Size
All participants 2.1 1.7 2.6 5,590
0-17
18-39
40-64 0.9 0.5 1.4 3,614
65-79 4.8 3.6 6.2 1,501
80+ 8.8 6.4 11.7 475
Male 2.4 1.7 3.2 2,795
Female 1.9 1.4 2.4 2,795
Black (non-Hispanic) 3.6 2.5 5.2 1,139
Hispanic (Mexican American) 1.6 1.0 2.5 1,252
Other race * * * 183
White (non-Hispanic) 2.0 1.4 2.6 3,016
Diabetes 4.7 3.0 6.9 1,171
Hypertension 3.0 2.3 3.8 2,812
Smoking 2.3 1.7 3.0 2,943
*Suppressed

NORC | NHANES Summary Data Report
VISION & EYE HEALTH SURVEILLANCE SYSTEM | 13
Table 9. National Estimates of Prevalence of Diabetic Retinopathy 2005-2008, based on self-reported diagnosis (per overall US population)
Prevalence Rate Lower 95% CI Upper 95% CI Sample Size
All participants 22.9 20.1 25.9 1,210
0-17
18-39 13.1 7.0 21.6 94
40-64 23.7 18.8 29.1 567
65-79 27.0 22.2 32.3 416
80+ 17.5 11.1 25.6 120
Male 23.2 19.4 27.5 592
Female 22.6 18.4 27.3 618
Black (non-Hispanic) 26.5 22.0 31.5 378
Hispanic (Mexican American) 17.7 12.8 23.4 328
Other race * * * 39
White (non-Hispanic) 22.2 18.5 26.3 465
Diabetes 22.9 20.1 25.9 1,210
Hypertension 24.8 21.6 28.3 860
Smoking 21.8 18.5 25.3 606
*Suppressed

NORC | NHANES Summary Data Report
VISION & EYE HEALTH SURVEILLANCE SYSTEM | 14
Table 10. National Estimates of Prevalence of Diabetic Retinopathy 2005-2008, based on examination data
Prevalence Rate Lower 95% CI Upper 95% CI Sample Size
All participants 9.7 8.8 10.8 5,704
0-17
18-39
40-64 8.5 7.2 9.9 3,673
65-79 12.6 10.8 14.7 1,547
80+ 16.2 13.0 19.8 484
Male 11.3 10.1 12.6 2,856
Female 8.3 7.2 9.6 2,848
Black (non-Hispanic) 15.9 13.4 18.6 1,174
Hispanic (Mexican American) 13.6 11.6 15.7 1,287
Other race 9.3 4.7 16.2 184
White (non-Hispanic) 8.6 7.5 9.8 3,059
Diabetes 26.5 23.3 29.9 1,200
Hypertension 13.2 11.6 14.9 2,867
Smoking 9.9 8.5 11.4 3,013

NORC | NHANES Summary Data Report
VISION & EYE HEALTH SURVEILLANCE SYSTEM | 15
Table 11. National Estimates of Prevalence of Cataract Surgery 2005-2008, based on self-report
Prevalence Rate Lower 95% CI Upper 95% CI Sample Size
All participants 7.0 6.3 7.8 10,472
0-17
18-39
40-64 2.5 2.0 3.1 4,200
65-79 23.8 21.4 26.4 1,844
80+ 62.7 58.5 66.7 746
Male 5.4 4.5 6.3 5,074
Female 8.5 7.8 9.4 5,398
Black (non-Hispanic) 4.1 3.2 5.1 2,272
Hispanic (Mexican American) 3.1 2.3 4.0 2,722
Other race 5.5 3.2 8.7 426
White (non-Hispanic) 8.3 7.5 9.1 5,052
Diabetes 17.5 15.2 20.0 1,646
Hypertension 15.0 13.2 16.8 4,076
Smoking 7.4 6.3 8.5 4,942

NORC | NHANES Summary Data Report
VISION & EYE HEALTH SURVEILLANCE SYSTEM | 16
Table 12. National Estimates of Prevalence of Normal Vision (≤20/30 best-corrected acuity in the better-seeing eye), 1999-2008
Prevalence Rate Lower 95% CI Upper 95% CI Sample Size
All participants 98.3 98.1 98.4 32,034
12-17 98.5 98.1 98.8 7,564
18-39 98.9 98.6 99.2 10,421
40-64 99.3 99.1 99.5 8,802
65-79 95.8 95.0 96.5 3,872
80+ 84.3 82.2 86.3 1,375
Male 98.5 98.3 98.7 15,678
Female 98.0 97.8 98.2 16,356
Black (non-Hispanic) 97.8 97.5 98.2 7,471
Hispanic (Mexican American) 97.6 97.1 98.0 9,584
Other race 98.3 97.3 99.0 1,236
White (non-Hispanic) 98.5 98.2 98.7 13,743
Diabetes 95.9 95.1 96.6 2,827
Hypertension 97.0 96.5 97.4 8,432
Smoking 98.3 98.1 98.6 10,670

NORC | NHANES Summary Data Report
VISION & EYE HEALTH SURVEILLANCE SYSTEM | 17
Table 14. National Estimates of Prevalence of Any Vision Loss (≤20/40 best-corrected acuity in the better-seeing eye, 1999-2008
Prevalence Rate Lower 95% CI Upper 95% CI Sample Size
All participants 1.7 1.6 1.9 32,034
12-17 1.5 1.2 1.9 7,564
18-39 1.1 0.8 1.4 10,421
40-64 0.7 0.5 0.9 8,802
65-79 4.2 3.5 5.0 3,872
80+ 15.7 13.7 17.8 1,375
Male 1.5 1.3 1.7 15,678
Female 2.0 1.8 2.2 16,356
Black (non-Hispanic) 2.2 1.8 2.5 7,471
Hispanic (Mexican American) 2.4 2.0 2.9 9,584
Other race 1.7 1.0 2.7 1,236
White (non-Hispanic) 1.5 1.3 1.8 13,743
Diabetes 4.1 3.4 4.9 2,827
Hypertension 3.0 2.6 3.5 8,432
Smoking 1.7 1.4 1.9 10,670
NORC | NHANES Summary Data Report
VISION & EYE HEALTH SURVEILLANCE SYSTEM | 18
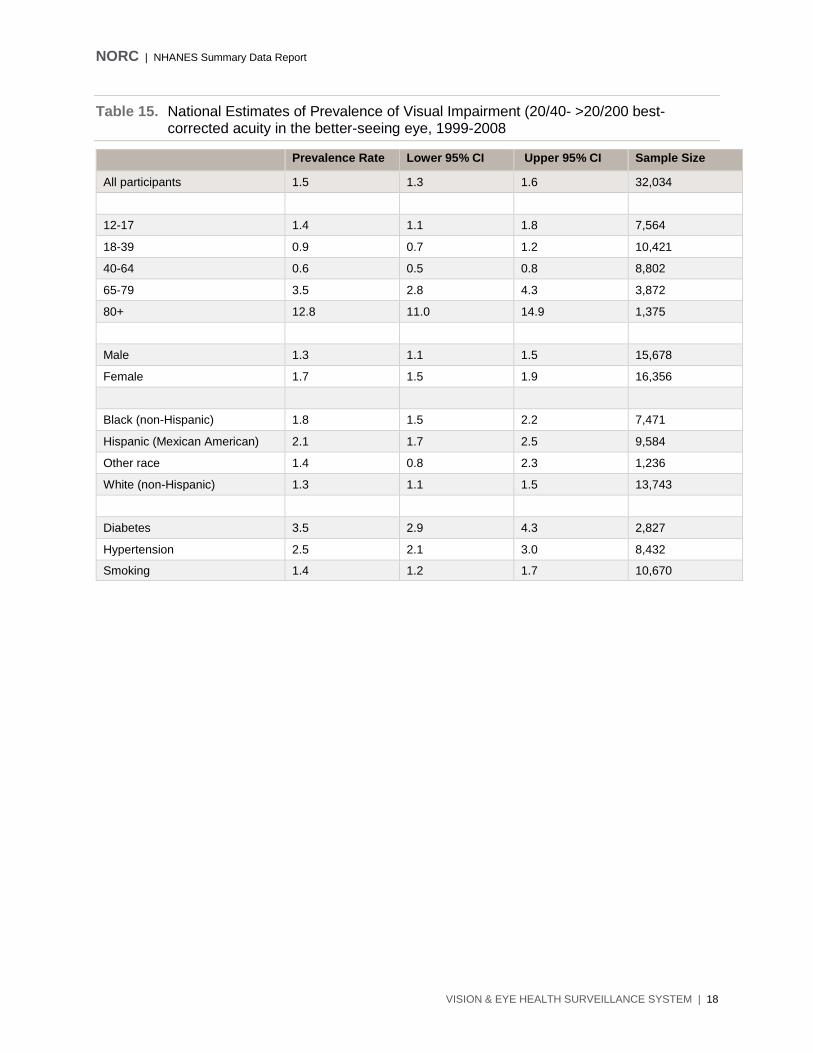
Table 15. National Estimates of Prevalence of Visual Impairment (20/40- >20/200 best-corrected acuity in the better-seeing eye, 1999-2008
Prevalence Rate Lower 95% CI Upper 95% CI Sample Size
All participants 1.5 1.3 1.6 32,034
12-17 1.4 1.1 1.8 7,564
18-39 0.9 0.7 1.2 10,421
40-64 0.6 0.5 0.8 8,802
65-79 3.5 2.8 4.3 3,872
80+ 12.8 11.0 14.9 1,375
Male 1.3 1.1 1.5 15,678
Female 1.7 1.5 1.9 16,356
Black (non-Hispanic) 1.8 1.5 2.2 7,471
Hispanic (Mexican American) 2.1 1.7 2.5 9,584
Other race 1.4 0.8 2.3 1,236
White (non-Hispanic) 1.3 1.1 1.5 13,743
Diabetes 3.5 2.9 4.3 2,827
Hypertension 2.5 2.1 3.0 8,432
Smoking 1.4 1.2 1.7 10,670

NORC | NHANES Summary Data Report
VISION & EYE HEALTH SURVEILLANCE SYSTEM | 19
Table 16. National Estimates of Prevalence of Blindness (≤20/200 best-corrected acuity in the better-seeing eye, 1999-2008
Prevalence Rate Lower 95% CI Upper 95% CI Sample Size
All participants 0.3 0.2 0.3 32,034
12-17 * * * 7,564
18-39 * * * 10,421
40-64 * * * 8,802
65-79 0.7 0.4 1.1 3,872
80+ 2.8 2.0 3.9 1,375
Male 0.2 0.1 0.3 15,678
Female 0.3 0.2 0.4 16,356
Black (non-Hispanic) 0.3 0.2 0.5 7,471
Hispanic (Mexican American) 0.3 0.2 0.5 9,584
Other race * * * *
White (non-Hispanic) 0.2 0.2 0.3 13,743
Diabetes 0.6 0.3 0.9 2,827
Hypertension 0.5 0.4 0.7 8,432
Smoking 0.2 0.1 0.3 10,670
*Suppressed

NORC | NHANES Summary Data Report
VISION & EYE HEALTH SURVEILLANCE SYSTEM | 20
Table 17. National Estimates of Prevalence of Monocular Vision Loss (≤20/40 best-corrected acuity in either eye, 1999-2008
Prevalence Rate Lower 95% CI Upper 95% CI Sample Size
All participants 5.5 5.1 5.8 35,090
12-17 3.4 2.8 4.0 7,890
18-39 3.2 2.7 3.7 11,258
40-64 3.9 3.5 4.4 9,539
65-79 14.4 13.0 15.8 4,483
80+ 23.8 21.4 26.3 1,920
Male 5.2 4.8 5.5 17,063
Female 5.8 5.3 6.3 18,027
Black (non-Hispanic) 5.6 4.9 6.2 8,283
Hispanic (Mexican American) 5.9 5.3 6.6 10,542
Other race 4.6 3.4 6.0 1,375
White (non-Hispanic) 5.4 5.0 5.9 14,890
Diabetes 12.5 11.3 13.8 3,333
Hypertension 9.6 8.8 10.4 10,069
Smoking 6.2 5.8 6.6 11,833

NORC | NHANES Summary Data Report
VISION & EYE HEALTH SURVEILLANCE SYSTEM | 21
Table 18. National Estimates of Prevalence of Presenting Normal Vision (≤20/30 presenting acuity in the better-seeing eye), 1999-2008
Prevalence Rate Lower 95% CI Upper 95% CI Sample Size
All participants 90.2 89.8 90.6 32,642
12-17 86.6 85.5 87.7 7,582
18-39 91.4 90.7 92.1 10,475
40-64 93.1 92.5 93.7 8,908
65-79 86.5 85.0 87.9 4,085
80+ 66.2 63.7 68.5 1,592
Male 90.7 90.2 91.2 15,987
Female 89.7 89.0 90.3 16,655
Black (non-Hispanic) 86.0 84.9 87.0 7,603
Hispanic (Mexican American) 85.6 84.4 86.8 9,744
Other race 87.8 85.4 90.0 1,259
White (non-Hispanic) 91.9 91.4 92.4 14,036
Diabetes 84.1 82.5 85.6 2,996
Hypertension 87.7 86.9 88.4 8,824
Smoking 90.8 90.1 91.4 10,972

NORC | NHANES Summary Data Report
VISION & EYE HEALTH SURVEILLANCE SYSTEM | 22
Table 19. National Estimates of Prevalence of Presenting Vision Loss (≤20/40 presenting acuity in the better-seeing eye, 1999-2008
Prevalence Rate Lower 95% CI Upper 95% CI Sample Size
All participants 9.8 9.4 10.2 32,642
12-17 13.4 12.3 14.5 7,582
18-39 8.6 7.9 9.3 10,475
40-64 6.9 6.3 7.5 8,908
65-79 13.5 12.1 15.0 4,085
80+ 33.8 31.5 36.3 1,592
Male 9.3 8.8 9.8 15,987
Female 10.3 9.7 11.0 16,655
Black (non-Hispanic) 14.0 13.0 15.1 7,603
Hispanic (Mexican American) 14.4 13.2 15.6 9,744
Other race 12.2 10.0 14.6 1,259
White (non-Hispanic) 8.1 7.6 8.6 14,036
Diabetes 15.9 14.4 17.5 2,996
Hypertension 12.3 11.6 13.1 8,824
Smoking 9.2 8.6 9.9 10,972

NORC | NHANES Summary Data Report
VISION & EYE HEALTH SURVEILLANCE SYSTEM | 23
Table 20. National Estimates of Prevalence of Presenting Visual Impairment (20/40- >20/200 presenting acuity in the better-seeing eye, 1999-2008
Prevalence Rate Lower 95% CI Upper 95% CI Sample Size
All participants 8.8 8.4 9.2 32,642
12-17 11.7 10.8 12.8 7,582
18-39 7.6 7.0 8.3 10,475
40-64 6.4 5.8 7.0 8,908
65-79 12.3 11.0 13.7 4,085
80+ 29.2 26.8 31.7 1,592
Male 8.4 7.9 8.9 15,987
Female 9.2 8.6 9.8 16,655
Black (non-Hispanic) 12.3 11.3 13.3 7,603
Hispanic (Mexican American) 12.6 11.5 13.8 9,744
Other race 10.6 8.7 12.8 1,259
White (non-Hispanic) 7.4 6.9 8.0 14,036
Diabetes 14.3 12.7 15.9 2,996
Hypertension 11.2 10.5 12.0 8,824
Smoking 8.4 7.8 9.1 10,972

NORC | NHANES Summary Data Report
VISION & EYE HEALTH SURVEILLANCE SYSTEM | 24
Table 21. National Estimates of Prevalence of Presenting Blindness (≤20/200 presenting acuity in the better-seeing eye, 1999-2008
Prevalence Rate Lower 95% CI Upper 95% CI Sample Size
All participants 1.0 0.9 1.1 32,642
12-17 1.6 1.3 2.0 7,582
18-39 1.0 0.8 1.2 10,475
40-64 0.5 0.3 0.6 8,908
65-79 1.2 0.8 1.6 4,085
80+ 4.6 3.6 5.8 1,592
Male 0.9 0.7 1.0 15,987
Female 1.1 0.9 1.3 16,655
Black (non-Hispanic) 1.7 1.4 2.2 7,603
Hispanic (Mexican American) 1.8 1.5 2.2 9,744
Other race * * * *
White (non-Hispanic) 0.7 0.5 0.8 14,036
Diabetes 1.7 1.2 2.2 2,996
Hypertension 1.1 0.9 1.4 8,824
Smoking 0.8 0.6 1.0 10,972
*Suppressed

NORC | NHANES Summary Data Report
VISION & EYE HEALTH SURVEILLANCE SYSTEM | 25
Table 22. National Estimates of Prevalence of Presenting Monocular Vision Loss (≤20/40 presenting acuity in either eye, 1999-2008
Prevalence Rate Lower 95% CI Upper 95% CI Sample Size
All participants 13.9 13.3 14.5 35,090
12-17 12.2 11.0 13.4 7,890
18-39 10.3 9.5 11.1 11,258
40-64 13.4 12.4 14.3 9,539
65-79 24.6 23.2 26.0 4,483
80+ 27.9 25.8 30.0 1,920
Male 13.0 12.4 13.7 17,063
Female 14.7 13.9 15.4 18,027
Black (non-Hispanic) 13.3 12.5 14.3 8,283
Hispanic (Mexican American) 14.0 12.8 15.3 10,542
Other race 14.4 12.5 16.5 1,375
White (non-Hispanic) 13.9 13.2 14.6 14,890
Diabetes 21.7 20.0 23.5 3,333
Hypertension 17.9 16.8 19.0 10,069
Smoking 14.4 13.6 15.2 11,833

NORC | NHANES Summary Data Report
VISION & EYE HEALTH SURVEILLANCE SYSTEM | 26
Table 23. National Estimates of Uncorrected Refractive Error (≤20/50 presenting acuity in the better-seeing eye, improving to <20/40 with correction), 1999-2008
Prevalence Rate Lower 95% CI Upper 95% CI Sample Size
All participants 5.3 5.0 5.7 31,350
12-17 9.3 8.4 10.3 7,413
18-39 5.5 5.0 6.0 10,267
40-64 3.8 3.4 4.3 8,692
65-79 5.0 4.2 6.0 3,736
80+ 10.1 8.4 12.1 1,242
Male 5.3 4.9 5.8 15,352
Female 5.3 4.9 5.8 15,998
Black (non-Hispanic) 8.2 7.4 9.0 7,301
Hispanic (Mexican American) 8.7 7.8 9.7 9,330
Other race 7.6 5.8 9.7 1,219
White (non-Hispanic) 4.1 3.7 4.5 13,500
Diabetes 6.6 5.4 8.0 2,707
Hypertension 5.1 4.6 5.7 8,144
Smoking 4.6 4.2 5.1 10,415
Recommended