FMI’s Construction OutlookFirst Quarter Report

Q1 Outlook Report 2018
1
FMI CONSTRUCTION FORECAST
FMI Construction Outlook 2018First Quarter Report
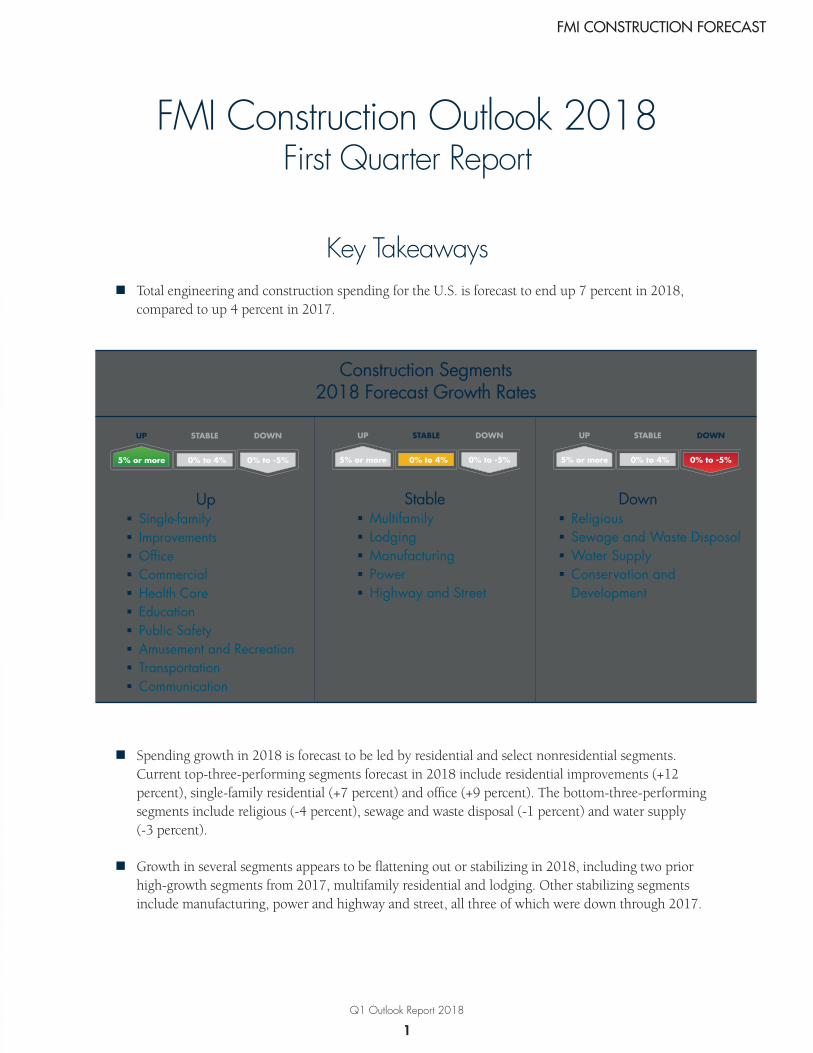
Key Takeaways � Total engineering and construction spending for the U.S. is forecast to end up 7 percent in 2018,
compared to up 4 percent in 2017.
� Spending growth in 2018 is forecast to be led by residential and select nonresidential segments. Current top-three-performing segments forecast in 2018 include residential improvements (+12 percent), single-family residential (+7 percent) and office (+9 percent). The bottom-three-performing segments include religious (-4 percent), sewage and waste disposal (-1 percent) and water supply (-3 percent).
� Growth in several segments appears to be flattening out or stabilizing in 2018, including two prior high-growth segments from 2017, multifamily residential and lodging. Other stabilizing segments include manufacturing, power and highway and street, all three of which were down through 2017.
Construction Segments2018 Forecast Growth Rates
Up � Single-family � Improvements � Office � Commercial � Health Care � Education � Public Safety � Amusement and Recreation � Transportation � Communication
Stable � Multifamily � Lodging � Manufacturing � Power � Highway and Street
Down � Religious � Sewage and Waste Disposal � Water Supply � Conservation and Development
0% to 4%5% or more 0% to -5%
STABLEUP DOWN
0% to 4%5% or more 0% to -5%
STABLEUP DOWN
0% to 4%
STABLE
5% or more
UP
0% to -5%
DOWN
Q1 Outlook Report 2018
2
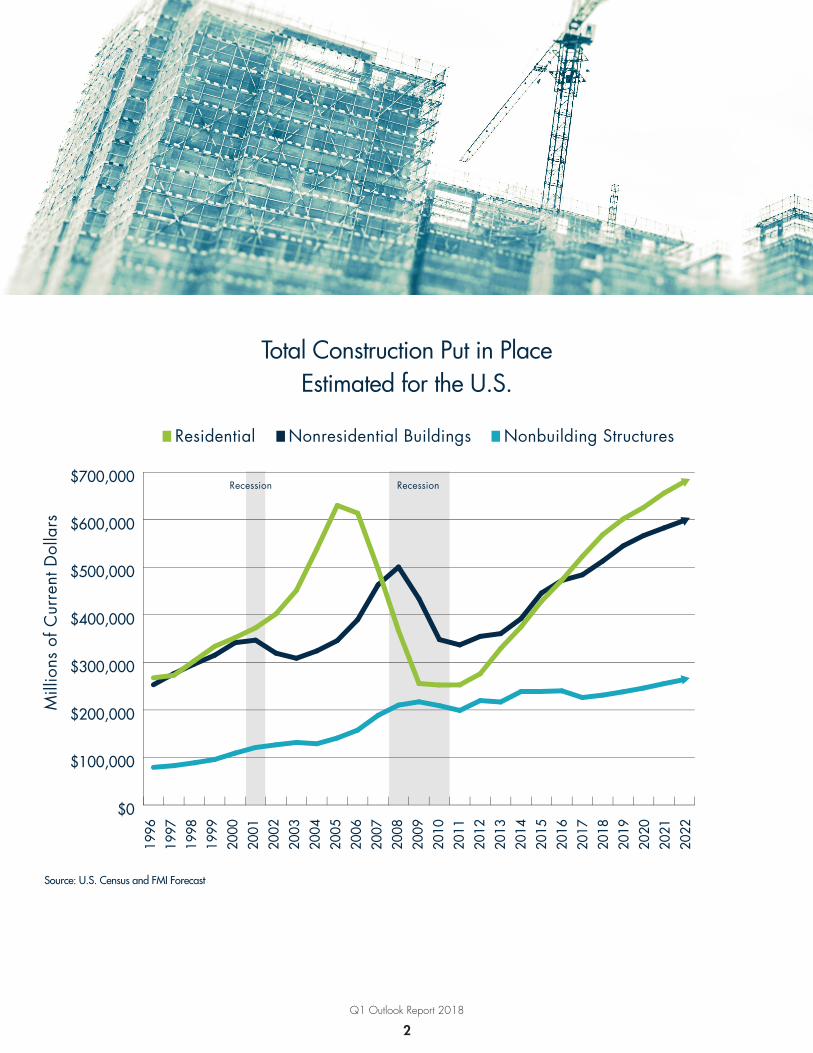
Total Construction Put in PlaceEstimated for the U.S.
Source: U.S. Census and FMI Forecast
$0
$100,000
$200,000
$300,000
$400,000
$500,000
$600,000
$700,000
Mill
ions
of C
urre
nt D
olla
rs
1996
1997
1998
1999
2000
2001
2002
2003
2004
2005
2006
2007
2008
2009
2010
2011
2012
2013
2014
2015
2016
2017
2018
2019
2020
2021
2022
RecessionRecession
Residential Nonresidential Buildings Nonbuilding Structures
Q1 Outlook Report 2018
3
FMI CONSTRUCTION FORECAST
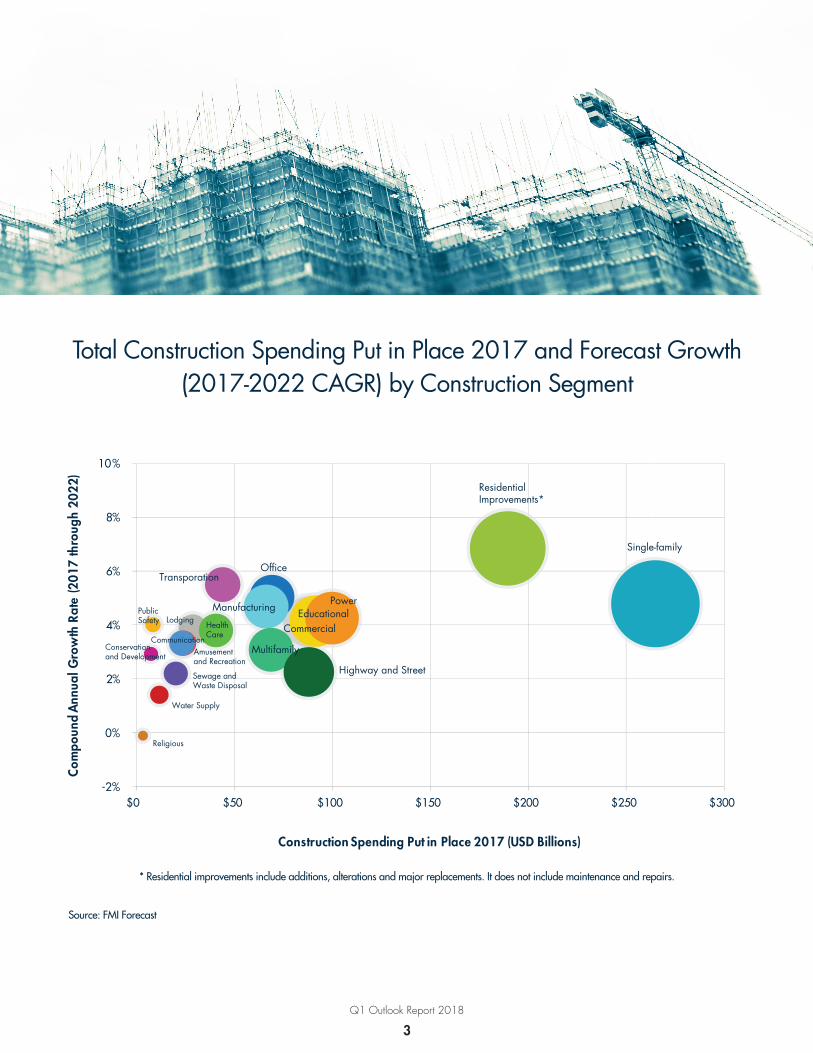
Total Construction Spending Put in Place 2017 and Forecast Growth (2017-2022 CAGR) by Construction Segment
-2%
0%
2%
4%
6%
8%
10%
$0 $50 $100 $150 $200 $250 $300
Com
poun
d A
nnua
l Gro
wth
Rat
e (2
017
thro
ugh
2022
)
Construction Spending Put in Place 2017 (USD Billions)
Single-family
ResidentialImprovements*
PowerEducational
Commercial
Office
Manufacturing
Transporation
Highway and Street
Multifamily
HealthCare
Lodging
CommunicationAmusementand Recreation
PublicSafety
Conservationand Development
Sewage andWaste Disposal
Water Supply
Religious
* Residential improvements include additions, alterations and major replacements. It does not include maintenance and repairs.
Source: FMI Forecast
Q1 Outlook Report 2018
4
FMI CONSTRUCTION FORECASTFMI CONSTRUCTION FORECAST
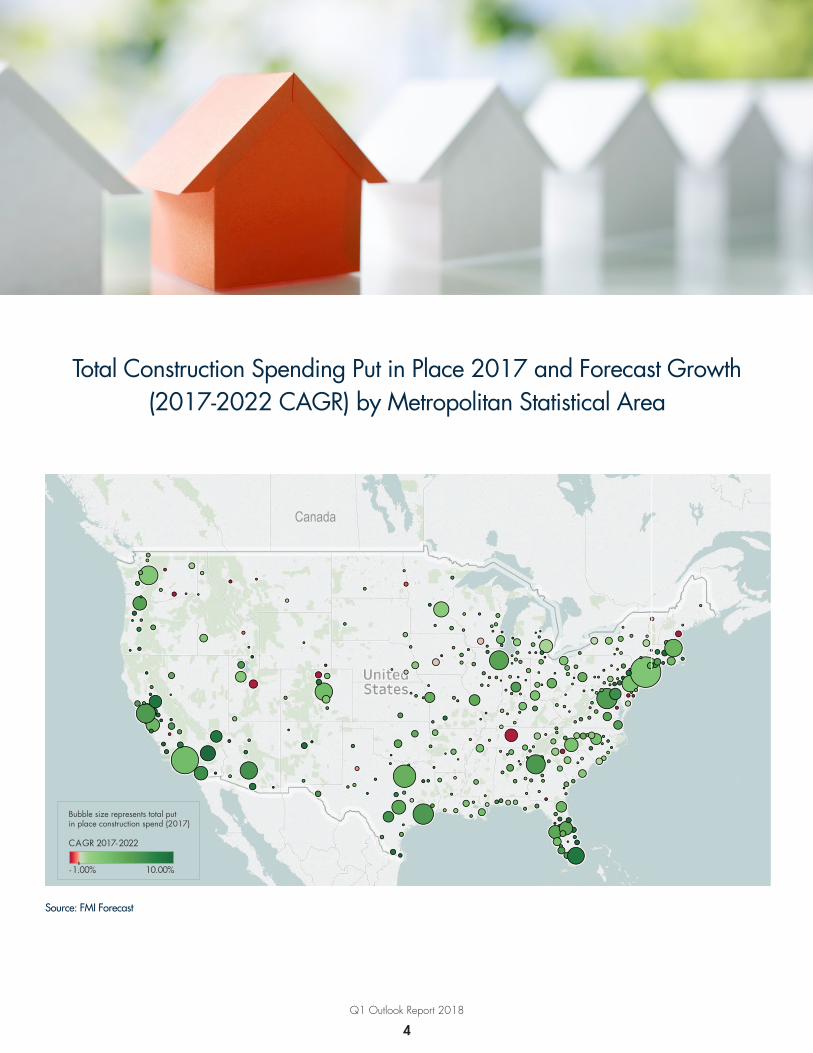
Total Construction Spending Put in Place 2017 and Forecast Growth (2017-2022 CAGR) by Metropolitan Statistical Area
Canada
- 1.00% 10.00%
CAGR 2017-2022
Bubble size represents total putin place construction spend (2017)
Source: FMI Forecast
Q1 Outlook Report 2018
5
FMI CONSTRUCTION FORECAST
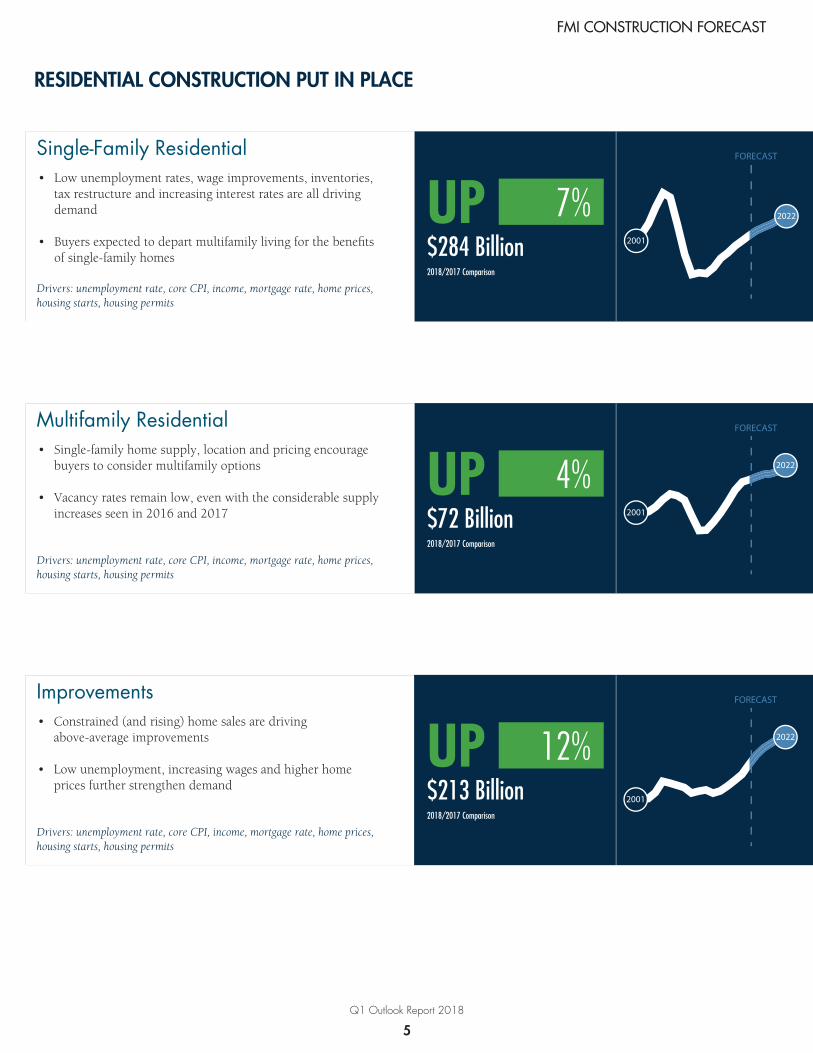
RESIDENTIAL CONSTRUCTION PUT IN PLACE
Single-Family Residential Low unemployment rates, wage improvements, inventories, tax restructure and increasing interest rates are all driving demand
Buyers expected to depart multifamily living for the bene�ts of single-family homes
•
•
Drivers: unemployment rate, core CPI, income, mortgage rate, home prices, housing starts, housing permits
UP 7%$284 Billion2018/2017 Comparison
2001
FORECAST
2022
Multifamily ResidentialSingle-family home supply, location and pricing encourage buyers to consider multifamily options
Vacancy rates remain low, even with the considerable supply increases seen in 2016 and 2017
•
•
Drivers: unemployment rate, core CPI, income, mortgage rate, home prices, housing starts, housing permits
UP 4%$72 Billion2018/2017 Comparison
FORECAST
2001
2022
ImprovementsConstrained (and rising) home sales are driving above-average improvements
Low unemployment, increasing wages and higher home prices further strengthen demand
•
•
Drivers: unemployment rate, core CPI, income, mortgage rate, home prices, housing starts, housing permits
UP 12%$213 Billion2018/2017 Comparison
FORECAST
2001
2022
Q1 Outlook Report 2018
6
FMI CONSTRUCTION FORECAST
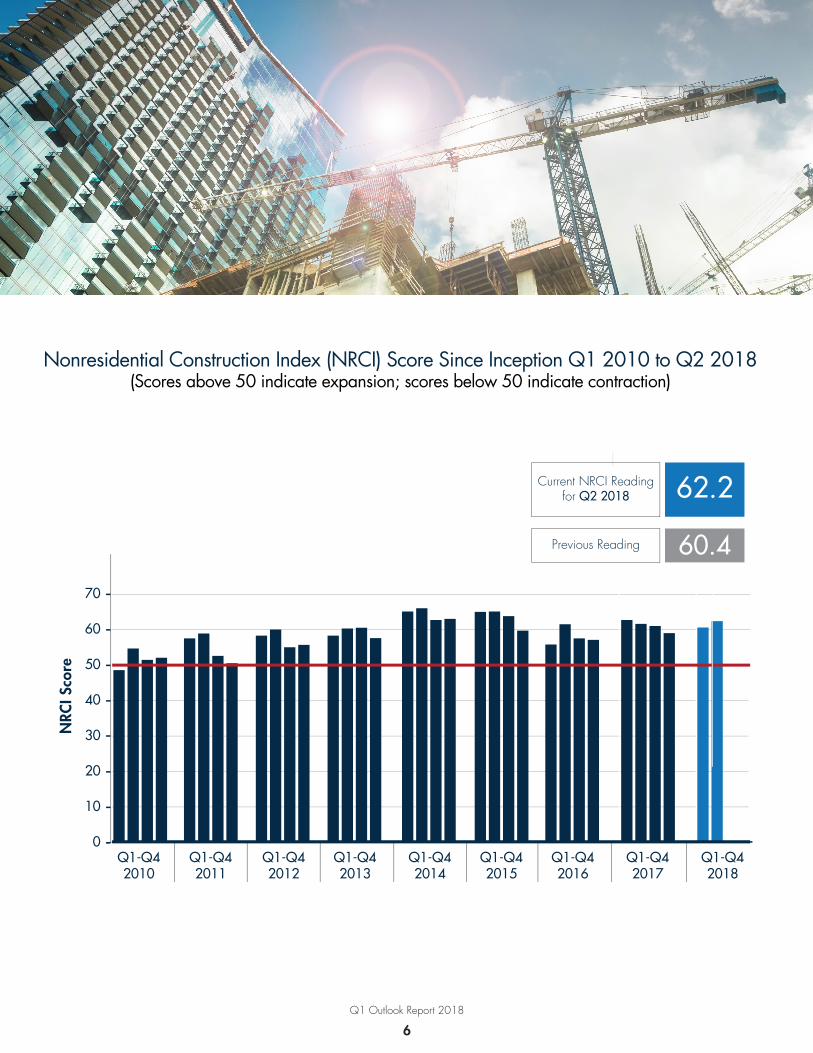
Current NRCI Readingfor Q2 2018 62.2
Previous Reading 60.4
Q1-Q42010
NRC
I Sco
re
0
10
20
30
40
50
60
70
Q1-Q42011
Q1-Q42012
Q1-Q42013
Q1-Q42014
Q1-Q42015
Q1-Q42016
Q1-Q42017
Q1-Q42018
0.000.000.000.000.00
Nonresidential Construction Index (NRCI) Score Since Inception Q1 2010 to Q2 2018(Scores above 50 indicate expansion; scores below 50 indicate contraction)
Current NRCI Readingfor Q2 2018 62.2
Previous Reading 60.4
Q1-Q42010
NRC
I Sco
re
0
10
20
30
40
50
60
70
Q1-Q42011
Q1-Q42012
Q1-Q42013
Q1-Q42014
Q1-Q42015
Q1-Q42016
Q1-Q42017
Q1-Q42018
0.000.000.000.000.00
Q1 Outlook Report 2018
7
FMI CONSTRUCTION FORECAST
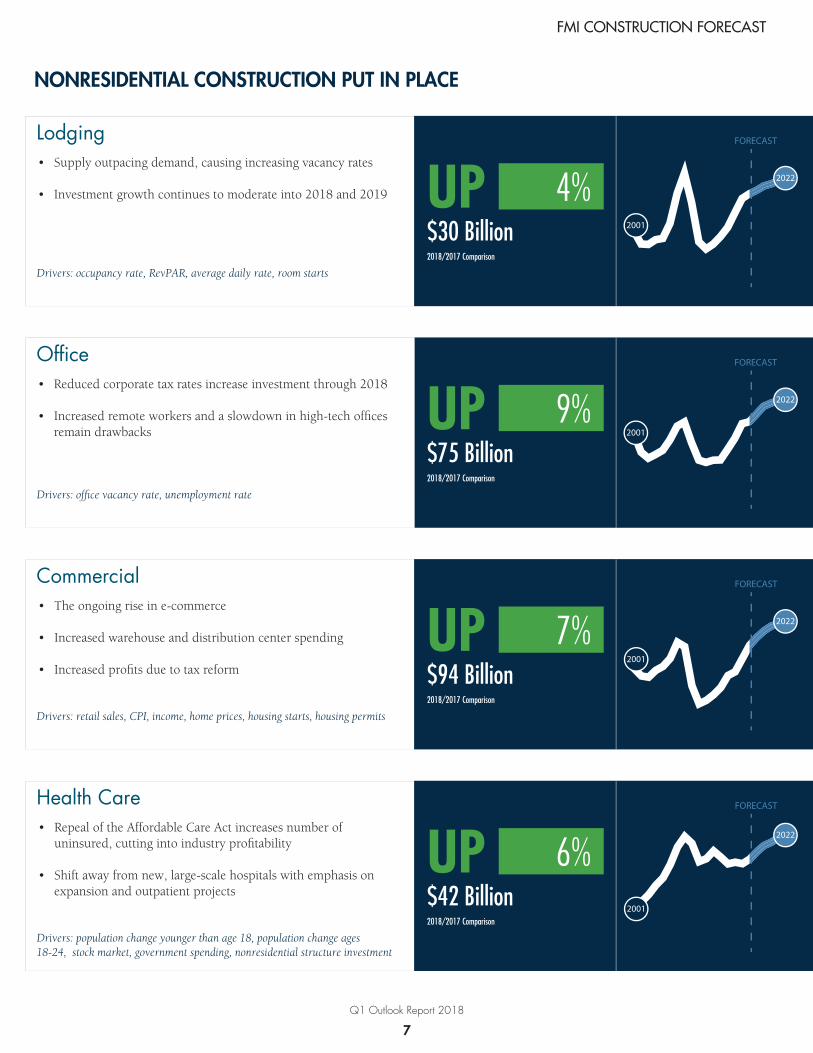
LodgingSupply outpacing demand, causing increasing vacancy rates
Investment growth continues to moderate into 2018 and 2019
•
•
Drivers: occupancy rate, RevPAR, average daily rate, room starts
UP 4%$30 Billion2018/2017 Comparison
FORECAST
2001
2022
OfficeReduced corporate tax rates increase investment through 2018
Increased remote workers and a slowdown in high-tech of�ces remain drawbacks
•
•
Drivers: of�ce vacancy rate, unemployment rate
UP 9%$75 Billion2018/2017 Comparison
FORECAST
2001
2022
NONRESIDENTIAL CONSTRUCTION PUT IN PLACE
CommercialThe ongoing rise in e-commerce
Increased warehouse and distribution center spending
Increased prots due to tax reform
•
•
•
Drivers: retail sales, CPI, income, home prices, housing starts, housing permits
UP 7%$94 Billion2018/2017 Comparison
FORECAST
2001
2022
Health CareRepeal of the Affordable Care Act increases number of uninsured, cutting into industry pro�tability
Shift away from new, large-scale hospitals with emphasis on expansion and outpatient projects
•
•
Drivers: population change younger than age 18, population change ages 18-24, stock market, government spending, nonresidential structure investment
UP 6%$42 Billion2018/2017 Comparison
FORECAST
2001
2022
Q1 Outlook Report 2018
8
FMI CONSTRUCTION FORECAST
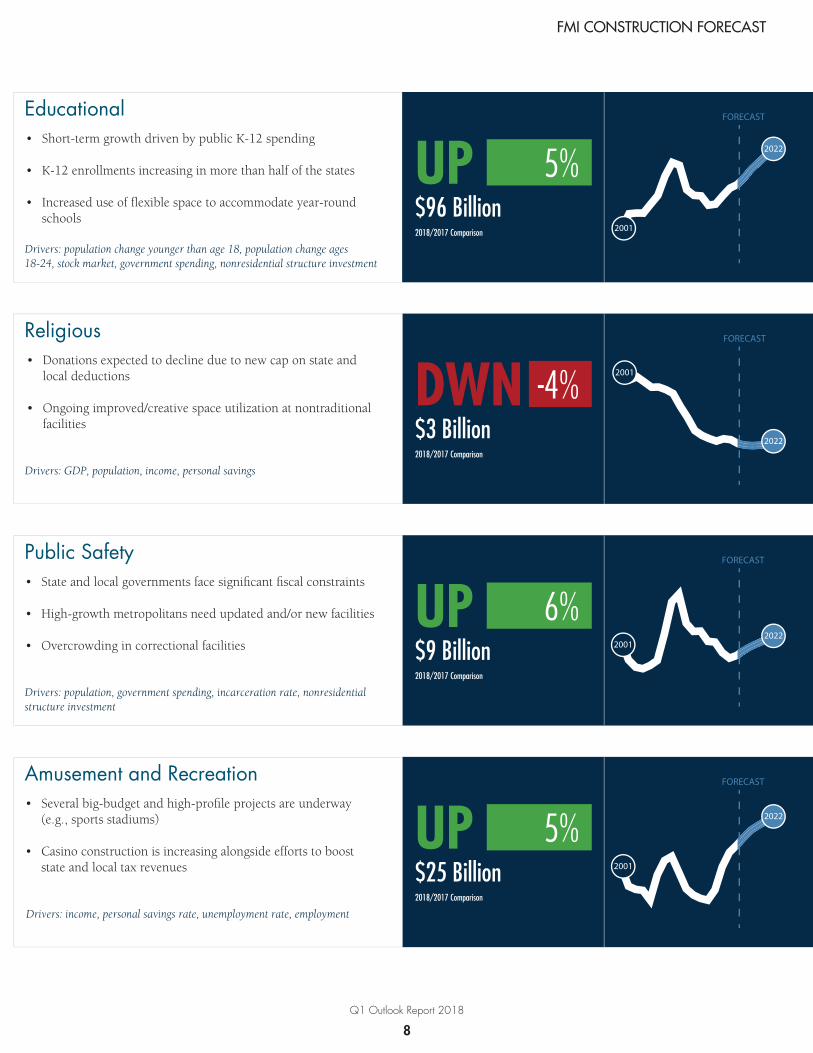
EducationalShort-term growth driven by public K-12 spending
K-12 enrollments increasing in more than half of the states
Increased use of �exible space to accommodate year-round schools
•
•
•
Drivers: population change younger than age 18, population change ages 18-24, stock market, government spending, nonresidential structure investment
FORECAST
2001
2022UP 5%$96 Billion2018/2017 Comparison
ReligiousDonations expected to decline due to new cap on state and local deductions
Ongoing improved/creative space utilization at nontraditional facilities
•
•
Drivers: GDP, population, income, personal savings
DWN$3 Billion2018/2017 Comparison
-4%
FORECAST
2001
2022
Public SafetyState and local governments face signi�cant �scal constraints
High-growth metropolitans need updated and/or new facilities
Overcrowding in correctional facilities
•
•
•
Drivers: population, government spending, incarceration rate, nonresidential structure investment
FORECAST
20012022
UP 6%$9 Billion2018/2017 Comparison
Amusement and RecreationSeveral big-budget and high-pro le projects are underway (e.g., sports stadiums)
Casino construction is increasing alongside efforts to boost state and local tax revenues
•
•
Drivers: income, personal savings rate, unemployment rate, employment
UP 5%$25 Billion2018/2017 Comparison
FORECAST
2001
2022
Q1 Outlook Report 2018
9
FMI CONSTRUCTION FORECAST
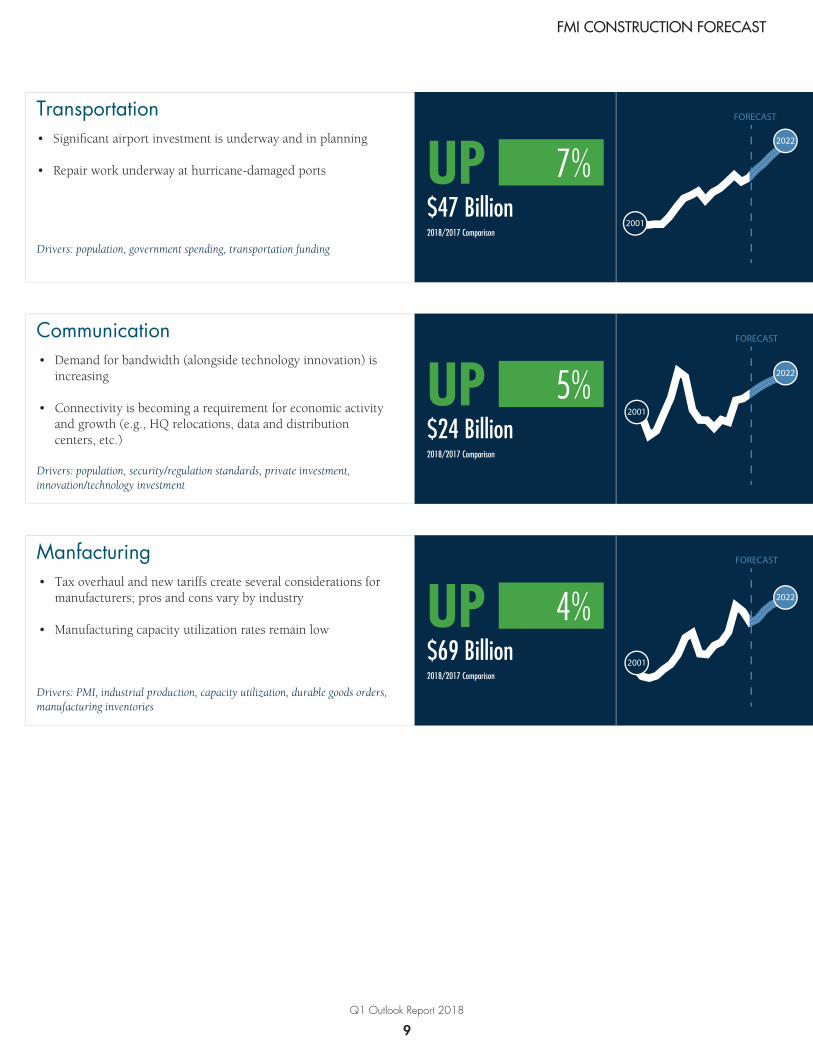
TransportationSigni�cant airport investment is underway and in planning
Repair work underway at hurricane-damaged ports
•
•
Drivers: population, government spending, transportation funding
UP 7%$47 Billion2018/2017 Comparison
FORECAST
2001
2022
CommunicationDemand for bandwidth (alongside technology innovation) is increasing
Connectivity is becoming a requirement for economic activity and growth (e.g., HQ relocations, data and distribution centers, etc.)
•
•
Drivers: population, security/regulation standards, private investment, innovation/technology investment
UP 5%$24 Billion2018/2017 Comparison
FORECAST
2001
2022
ManfacturingTax overhaul and new tariffs create several considerations for manufacturers; pros and cons vary by industry
Manufacturing capacity utilization rates remain low
•
•
Drivers: PMI, industrial production, capacity utilization, durable goods orders, manufacturing inventories
FORECAST
2001
2022UP 4%$69 Billion2018/2017 Comparison
Q1 Outlook Report 2018
10
FMI CONSTRUCTION FORECAST
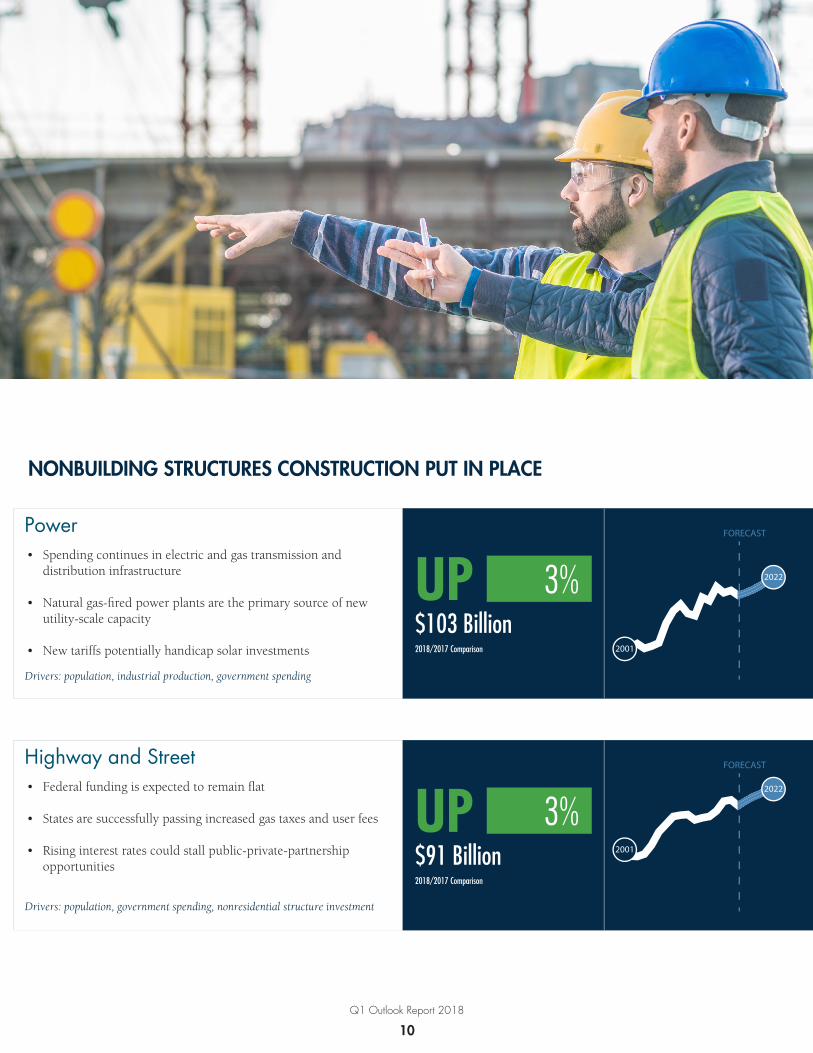
NONBUILDING STRUCTURES CONSTRUCTION PUT IN PLACE
PowerSpending continues in electric and gas transmission and distribution infrastructure
Natural gas-red power plants are the primary source of new utility-scale capacity
New tariffs potentially handicap solar investments
•
•
•
Drivers: population, industrial production, government spending
FORECAST
2001
2022UP 3%$103 Billion2018/2017 Comparison
Highway and StreetFederal funding is expected to remain �at
States are successfully passing increased gas taxes and user fees
Rising interest rates could stall public-private-partnership opportunities
•
•
•
Drivers: population, government spending, nonresidential structure investment
FORECAST
2001
2022
UP 3%$91 Billion2018/2017 Comparison
Q1 Outlook Report 2018
11
FMI CONSTRUCTION FORECAST
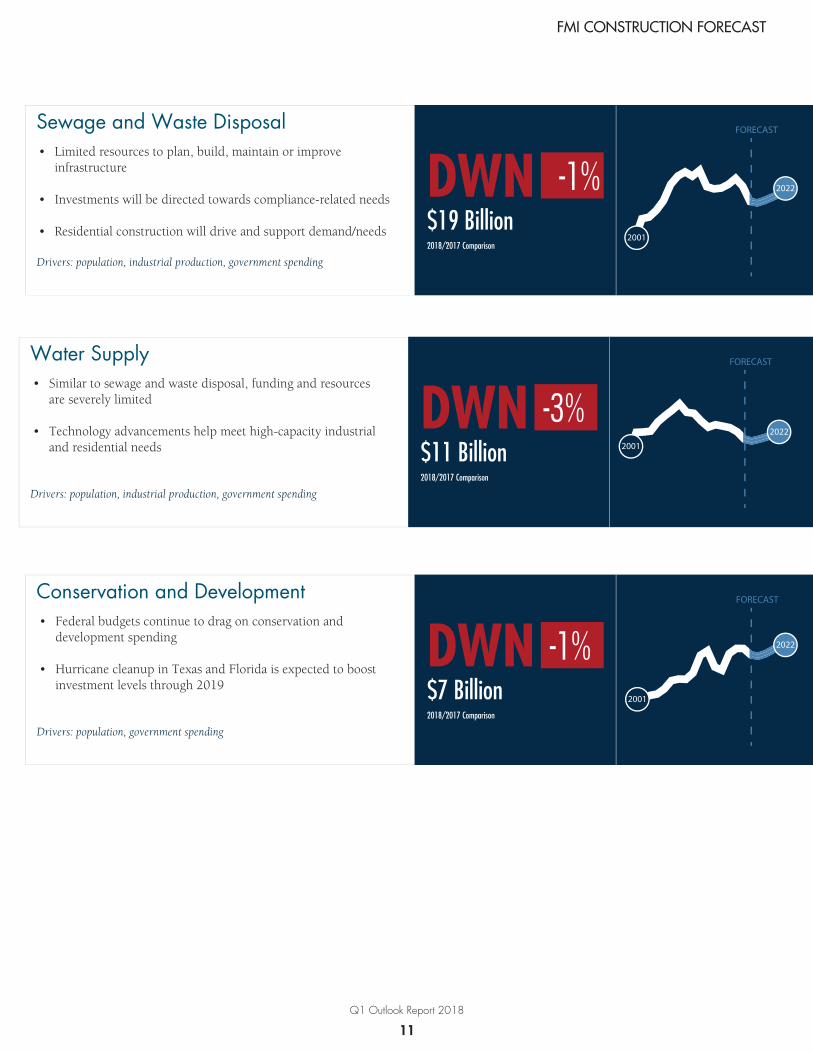
Sewage and Waste DisposalLimited resources to plan, build, maintain or improve infrastructure
Investments will be directed towards compliance-related needs
Residential construction will drive and support demand/needs
•
•
•
Drivers: population, industrial production, government spending
DWN$19 Billion2018/2017 Comparison
-1%
FORECAST
2001
2022
Water SupplySimilar to sewage and waste disposal, funding and resources are severely limited
Technology advancements help meet high-capacity industrial and residential needs
•
•
Drivers: population, industrial production, government spending
DWN$11 Billion2018/2017 Comparison
-3%
FORECAST
2001
2022
Conservation and DevelopmentFederal budgets continue to drag on conservation and development spending
Hurricane cleanup in Texas and Florida is expected to boost investment levels through 2019
•
•
Drivers: population, government spending
DWN$7 Billion2018/2017 Comparison
-1%
FORECAST
2001
2022
Q1 Outlook Report 2018
12
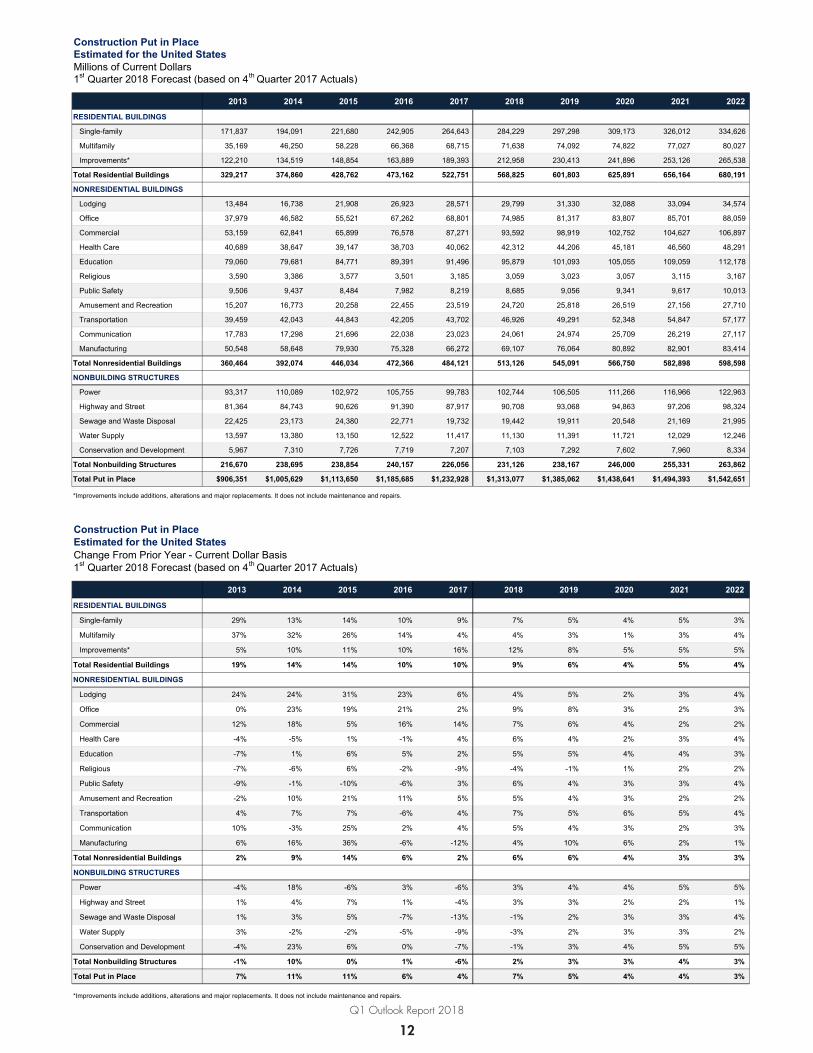
Construction Put in PlaceEstimated for the United States Millions of Current Dollars1st Quarter 2018 Forecast (based on 4th Quarter 2017 Actuals)
2013 2014 2015 2016 2017 2018 2019 2020 2021 2022
RESIDENTIAL BUILDINGS
Single-family 171,837 194,091 221,680 242,905 264,643 284,229 297,298 309,173 326,012 334,626
Multifamily 35,169 46,250 58,228 66,368 68,715 71,638 74,092 74,822 77,027 80,027
Improvements* 122,210 134,519 148,854 163,889 189,393 212,958 230,413 241,896 253,126 265,538
Total Residential Buildings 329,217 374,860 428,762 473,162 522,751 568,825 601,803 625,891 656,164 680,191
NONRESIDENTIAL BUILDINGS
Lodging 13,484 16,738 21,908 26,923 28,571 29,799 31,330 32,088 33,094 34,574
Office 37,979 46,582 55,521 67,262 68,801 74,985 81,317 83,807 85,701 88,059
Commercial 53,159 62,841 65,899 76,578 87,271 93,592 98,919 102,752 104,627 106,897
Health Care 40,689 38,647 39,147 38,703 40,062 42,312 44,206 45,181 46,560 48,291
Education 79,060 79,681 84,771 89,391 91,496 95,879 101,093 105,055 109,059 112,178
Religious 3,590 3,386 3,577 3,501 3,185 3,059 3,023 3,057 3,115 3,167
Public Safety 9,506 9,437 8,484 7,982 8,219 8,685 9,056 9,341 9,617 10,013
Amusement and Recreation 15,207 16,773 20,258 22,455 23,519 24,720 25,818 26,519 27,156 27,710
Transportation 39,459 42,043 44,843 42,205 43,702 46,926 49,291 52,348 54,847 57,177
Communication 17,783 17,298 21,696 22,038 23,023 24,061 24,974 25,709 26,219 27,117
Manufacturing 50,548 58,648 79,930 75,328 66,272 69,107 76,064 80,892 82,901 83,414
Total Nonresidential Buildings 360,464 392,074 446,034 472,366 484,121 513,126 545,091 566,750 582,898 598,598
NONBUILDING STRUCTURES
Power 93,317 110,089 102,972 105,755 99,783 102,744 106,505 111,266 116,966 122,963
Highway and Street 81,364 84,743 90,626 91,390 87,917 90,708 93,068 94,863 97,206 98,324
Sewage and Waste Disposal 22,425 23,173 24,380 22,771 19,732 19,442 19,911 20,548 21,169 21,995
Water Supply 13,597 13,380 13,150 12,522 11,417 11,130 11,391 11,721 12,029 12,246
Conservation and Development 5,967 7,310 7,726 7,719 7,207 7,103 7,292 7,602 7,960 8,334
Total Nonbuilding Structures 216,670 238,695 238,854 240,157 226,056 231,126 238,167 246,000 255,331 263,862
Total Put in Place $906,351 $1,005,629 $1,113,650 $1,185,685 $1,232,928 $1,313,077 $1,385,062 $1,438,641 $1,494,393 $1,542,651
*Improvements include additions, alterations and major replacements. It does not include maintenance and repairs.
Construction Put in PlaceEstimated for the United States Change From Prior Year - Current Dollar Basis1st Quarter 2018 Forecast (based on 4th Quarter 2017 Actuals)
2013 2014 2015 2016 2017 2018 2019 2020 2021 2022
RESIDENTIAL BUILDINGS
Single-family 29% 13% 14% 10% 9% 7% 5% 4% 5% 3%
Multifamily 37% 32% 26% 14% 4% 4% 3% 1% 3% 4%
Improvements* 5% 10% 11% 10% 16% 12% 8% 5% 5% 5%
Total Residential Buildings 19% 14% 14% 10% 10% 9% 6% 4% 5% 4%
NONRESIDENTIAL BUILDINGS
Lodging 24% 24% 31% 23% 6% 4% 5% 2% 3% 4%
Office 0% 23% 19% 21% 2% 9% 8% 3% 2% 3%
Commercial 12% 18% 5% 16% 14% 7% 6% 4% 2% 2%
Health Care -4% -5% 1% -1% 4% 6% 4% 2% 3% 4%
Education -7% 1% 6% 5% 2% 5% 5% 4% 4% 3%
Religious -7% -6% 6% -2% -9% -4% -1% 1% 2% 2%
Public Safety -9% -1% -10% -6% 3% 6% 4% 3% 3% 4%
Amusement and Recreation -2% 10% 21% 11% 5% 5% 4% 3% 2% 2%
Transportation 4% 7% 7% -6% 4% 7% 5% 6% 5% 4%
Communication 10% -3% 25% 2% 4% 5% 4% 3% 2% 3%
Manufacturing 6% 16% 36% -6% -12% 4% 10% 6% 2% 1%
Total Nonresidential Buildings 2% 9% 14% 6% 2% 6% 6% 4% 3% 3%
NONBUILDING STRUCTURES
Power -4% 18% -6% 3% -6% 3% 4% 4% 5% 5%
Highway and Street 1% 4% 7% 1% -4% 3% 3% 2% 2% 1%
Sewage and Waste Disposal 1% 3% 5% -7% -13% -1% 2% 3% 3% 4%
Water Supply 3% -2% -2% -5% -9% -3% 2% 3% 3% 2%
Conservation and Development -4% 23% 6% 0% -7% -1% 3% 4% 5% 5%
Total Nonbuilding Structures -1% 10% 0% 1% -6% 2% 3% 3% 4% 3%
Total Put in Place 7% 11% 11% 6% 4% 7% 5% 4% 4% 3%
*Improvements include additions, alterations and major replacements. It does not include maintenance and repairs.
FMI CONSTRUCTION FORECAST
Jay Bowman is a principal with FMI. Jay assists a broad range of stakeholders in the
construction industry, from program managers and general contractors to specialty trades
and materials producers, with the identification and assessment of the risks influencing the
strategic and tactical decisions they face. In this role, Jay’s primary responsibilities include
research design and interpretation, based on developing an understanding of the context
within which these organizations operate. Jay can be reached at [email protected].
About the Authors
Brian Strawberry is a senior economist with FMI. Brian’s expertise is in economic and
statistical modeling. He leads FMI’s efforts in market sizing, forecasting, and building
product/construction material pricing and consumption trends. Brian’s combination of
analytical skills and creative problem-solving abilities have proven valuable for many
contractors, owners and private equity groups as well as industry associations and internal
research initiatives. Brian can be reached at [email protected].
Industry Focus. Powerful Results.™
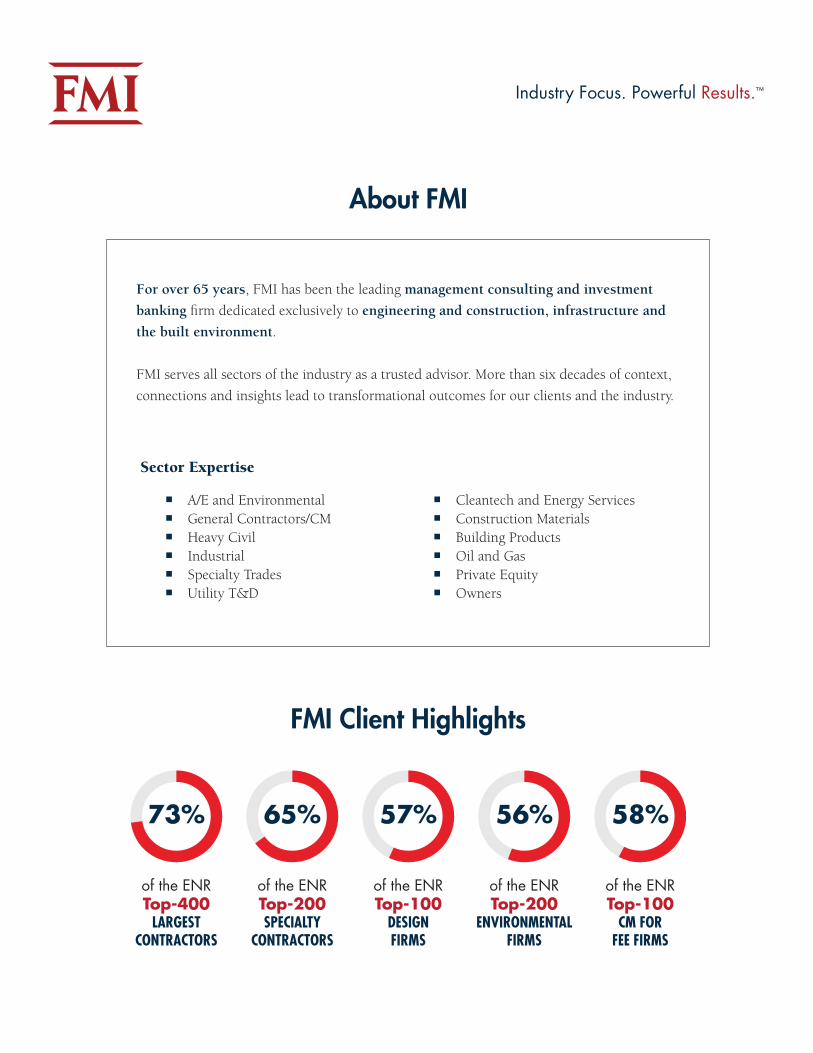
About FMI
For over 65 years, FMI has been the leading management consulting and investment
banking fi rm dedicated exclusively to engineering and construction, infrastructure and
the built environment.
FMI serves all sectors of the industry as a trusted advisor. More than six decades of context,
connections and insights lead to transformational outcomes for our clients and the industry.
Sector Expertise
A/E and Environmental General Contractors/CM Heavy Civil Industrial Specialty Trades Utility T&D
Cleantech and Energy Services Construction Materials Building Products Oil and Gas Private Equity Owners
FMI Client Highlights
56%57% 58%65%73%
of the ENRTop-400
LARGESTCONTRACTORS
of the ENRTop-200SPECIALTY
CONTRACTORS
of the ENRTop-100
DESIGNFIRMS
of the ENRTop-200
ENVIRONMENTALFIRMS
of the ENRTop-100
CM FORFEE FIRMS
Industry Focus. Powerful Results.TM
www.fminet.com
Raleigh (headquarters) 5171 Glenwood AvenueSuite 200Raleigh, NC 27612919.787.8400
Tampa308 South BoulevardTampa, FL 33606813.636.1364
Houston1301 McKinney StreetSuite 2000Houston TX 77010713.936.5400
Phoenix 7639 East Pinnacle Peak RoadSuite 100Scottsdale, AZ 85255602.381.8108
EdmontonEdmonton, AB780.850.2693
Denver210 University BoulevardSuite 800Denver, CO 80206303.377.4740
Recommended