Embed Size (px)
Citation preview

European Construction OutlookEuropean Construction Outlook
Laura Hanlon
Product Manager, Global Construction Outlook
June 23, 2009

Copyright © 2009 IHS Global Insight. All Rights Reserved.
What This Means for You
• Like most of the developed world, Europe will also be hit with the steepest decline in construction spend in at least 20 years
• The financial crisis has hit Western Europe hard, in part due tobanks’ high leverage and exposure to Eastern Europe
• Fiscal stimulus, together with financial rescue from the IMF, will gradually ease the credit crunch and improve the construction outlook
• Bottom Line: The European construction market is unlikely to recover before 2011, and recovery in the medium-term will lag the rest of the world

Copyright © 2009 IHS Global Insight. All Rights Reserved.
-6
-4
-2
0
2
Germany U.K. France Italy Spain
2008 2009 2010 2011
(Real GDP, percent change)
Recessions in Western Europe
Likely to Linger into 2010

Copyright © 2009 IHS Global Insight. All Rights Reserved.
Western European
Total Construction Outlook
• Western Europe will endure the second-worst market conditions this year and is expected to experience the worst recovery going forward
-8%
-6%
-4%
-2%
0%
2%
4%
6%
8%
10%
2000 2002 2004 2006 2008 2010 2012 2014 2016 2018
Ye
ar-
Ov
er-
Ye
ar
Gro
wth
World
WesternEurope

Copyright © 2009 IHS Global Insight. All Rights Reserved.
Western Europe Losing Share of
Global Construction Market
2018
Asia
43%
North America
18%
South America
4%
Western Europe
26%
MidEast and
Africa
4%
Eastern Europe
5%
2008
Asia
34%
Eastern Europe
5%
MidEast and
Africa
4%
North America
20%
South America
4%
Western Europe
33%

Copyright © 2009 IHS Global Insight. All Rights Reserved.
Dominant Western European
Construction Markets
Allocation of Western European Construction Spend, 2008
Note: Rest of Region includes Austria, Belgium, Denmark, Finland, Greece, Ireland, Norway, Portugal, Sweden, Switzerland, and Turkey — each which make up 2-3% of Western European total construction.
United
Kingdom
15%
Spain
16%
France
15%Italy
13%
Germany
13%
Rest of Region
23%
Netherlands
6%

Copyright © 2009 IHS Global Insight. All Rights Reserved.
Dominant Western European
Construction Market Outlooks
• The construction market lags that of the economic cycle
-16%
-14%
-12%
-10%
-8%
-6%
-4%
-2%
0%
2%
4%
6%
United
Kingdom
Spain France Netherlands Italy Germany
2009 2010 2011 2012

Copyright © 2009 IHS Global Insight. All Rights Reserved.
Total Construction Outlook
Regional Comparison
0.3%
-0.3%
-0.3%
-0.3%
-0.5%
-2.6%
-4.4%
-1.1%
2.1%
-5% -4% -3% -2% -1% 0% 1% 2% 3%
Rest of Region*
Netherlands
Germany
France
Italy
Spain
United Kingdom
Western Europe
World
Compound Annual Growth Rate 2008-13
• Deteriorating economic conditions, paired with the unrelenting high value of the euro, have created a meager and expensive environment for construction

Copyright © 2009 IHS Global Insight. All Rights Reserved.
-50 -25 0 25 50 75 100 125 150 175 200
Japan
Hong Kong
Canada
United States
Italy
Sweden
United Kingdom
France
Australia
Spain
Ireland
2007 Q4 - 2008 Q4 1997-2008
Housing Prices Soared
in Many Countries
Source: The Economist, December 6, 2008
• Some of the worst contractions are seen in Western Europe

Copyright © 2009 IHS Global Insight. All Rights Reserved.
Residential Construction Outlook
Regional Comparison
-1.7%
-0.7%
-1.4%
-1.7%
-3.0%
-10.8%
-8.0%
-3.9%
0.5%
-13% -12% -11% -10% -9% -8% -7% -6% -5% -4% -3% -2% -1% 0% 1% 2%
Rest of Region*
Netherlands
Italy
Germany
France
Spain
United Kingdom
Western Europe
World
Compound Annual Growth Rate 2008-13
• Housing bubble bursts are taking the heaviest tolls on the United Kingdom and Spain

Copyright © 2009 IHS Global Insight. All Rights Reserved.
Structures Construction Outlook
Regional Comparison
-0.1%
-0.1%
-0.4%
-0.5%
-4.4%
-4.2%
-4.8%
-2.1%
1.3%
-6% -5% -4% -3% -2% -1% 0% 1% 2%
Rest of Region*
Netherlands
France
Italy
Germany
Spain
United Kingdom
Western Europe
World
Compound Annual Growth Rate 2008-13
• While Germany avoided the real estate bubble, the collapse of exports hasreally affected the nonresidential construction market

Copyright © 2009 IHS Global Insight. All Rights Reserved.
Composition of Nonresidential
Structures Construction Markets
28%
24%23%
25%
UK
18%
28%
18%
36%
Spain
22%
17%
43%
18%
Germany
20%
38%
15%
27%
Italy
28%
21%20%
31%
Office
Commercial
Institutional
Industrial
France

Copyright © 2009 IHS Global Insight. All Rights Reserved.
Infrastructure Construction
Outlook Regional Comparison
3.9%
0.3%
1.6%
4.6%
6.1%
6.8%
7.1%
4.8%
5.1%
-1% 0% 1% 2% 3% 4% 5% 6% 7% 8%
Rest of Region*
Netherlands
Italy
France
United Kingdom
Spain
Germany
Western Europe
World
Compound Annual Growth Rate 2008-13
Copyright © 2009 IHS Global Insight. All Rights Reserved.
Sources of Infrastructure Growth
In Western Europe
•Country-specific stimulus packages
•Large transport programs co-funded by EC in the context of the development of the trans-European transport network (TEN-T)
•City traffic de-congestion a priority for most countries
•Environmental concerns push investment in energy, railways and urban transport
•London Olympics in 2012 — program focuses on rail systems

Copyright © 2009 IHS Global Insight. All Rights Reserved.
Western European
Stimulus Packages
• Slower recoveries in Europe are in part a function of less-aggressive stimulus policies
5% energy efficient construction
80% public works infrastructure10.5 billion14.4 billionSpain
100% infrastructure projects5 billion114 billionItaly
4% other transport infrastructure
10% housing construction
80% rail and energy infrastructure6.3 billion34.5 billionFrance
9% other transport infrastructure
13% energy efficient construction
20% education construction
55% road and rail repair32.4 billion81 billionGermany
24% motorways and roads
26% housing investment
27% education construction
4.6 billion31 billionUnited Kingdom
Construction Stimulus Details (Approximation)Construction StimulusTotal StimulusCountry

Copyright © 2009 IHS Global Insight. All Rights Reserved.
Scandinavian Countries See
Slightly More Modest Declines
• The region is gradually becoming more distressed by the global credit squeeze as business and consumer investment continue to weaken �
The construction outlook follows accordingly:
-8%
-6%
-4%
-2%
0%
2%
4%
6%
Denmark Finland Norway Sweden
2009 2010 2011 2012

Copyright © 2009 IHS Global Insight. All Rights Reserved.
Infrastructure LeadsScandinavian Construction Outlook
4.0%
0.3%
-1.5%
0.6%
-4% -3% -2% -1% 1% 2% 3% 4% 5%
Infrastructure
Structures
Residential
Total
Compound Annual Growth Rate 2008-13

Copyright © 2009 IHS Global Insight. All Rights Reserved.
Eastern European Construction Fares Better than Western Europe
-6%
-4%
-2%
0%
2%
4%
6%
8%
10%
12%
14%
16%
18%
2004 2006 2008 2010 2012 2014 2016 2018
Ye
ar-
Ov
er-
Ye
ar
Gro
wth
World
EasternEurope

Copyright © 2009 IHS Global Insight. All Rights Reserved.
But Eastern Europe Still Facing
Challenges in the Near-Term
• Main export markets are in recession
• Tight credit conditions threaten domestic demand which has been driven by credit expansion based largely on foreign borrowing
• Business and consumer confidence has eroded
• Lower oil prices inflict even more pain

Copyright © 2009 IHS Global Insight. All Rights Reserved.
-6
-4
-2
0
2
4
6
8
Russia Turkey Poland Czech
Republic
Hungary Romania
2008 2009 2010 2011
Real GDP Growth in Emerging Europe
(Percent change)

Copyright © 2009 IHS Global Insight. All Rights Reserved.
Eastern European Countries
Construction Market Outlook
(Percent change)
-20%
-15%
-10%
-5%
0%
5%
10%
15%
20%
Romania Poland Russia Bulgaria Slovakia Czech
Republic
Hungary Ukraine
2008 2009 2010 2011

Copyright © 2009 IHS Global Insight. All Rights Reserved.
Infrastructure Leads EasternEuropean Construction Markets
4.9%
1.1%
-0.6%
2.0%
-2% -1% 1% 2% 3% 4% 5% 6%
Infrastructure
Structures
Residential
Total Construction
Compound Annual Growth Rate 2008-13

Copyright © 2009 IHS Global Insight. All Rights Reserved.
IMF Programs in Eastern Europe
August 2008 – May 2009
Not yet specifiedNot yet approved*estimate:
US$25,000Stand-byTurkey
18,35755,993Total
5-May-106-May-09013,690Flexible Credit
LinePoland
ERBD: U.S. $60 million36 monthsNot yet approved*01,010Stand-byBosnia
EU: U.S.$6.76 billion, World Bank: U.S.$1.35 billion, EBRD and others: U.S.$1.35 billion3-May-114-May-094,37011,400Stand-byRomania
5-Jun-116-Mar-09162368
Stand-by/ Emergency FinancingArmenia
14-May-1115-May-097022,620Stand-bySerbia
15-Apr-1016-Jan-090351Stand-bySerbia**
11-Apr-1012-Jan-095181,618Stand-byBelarus
EU, EBRD, and EU member countries: U.S. $8.8 billion22-Mar-1123-Dec-085351,522Stand-byLatvia
Two loans from World Bank (U.S.$400 and US$500 million)4-Nov-105-Nov-084,90011,000Stand-byUkraine
EU and EU member countries: U.S. $9.1 billion5-Apr-106-Nov-086,32310,538Stand-byHungary
Northern European countries: U.S. $2.5 billion18-Nov-1019-Nov-085601,400
Stand-by/ Emergency FinancingIceland
15-Mar-1015-Sep-08288477Stand-byGeorgia
Complementary Lending to the Sovereign from other SourcesDate of Expiration
Date of Arrangement
Amount Drawn
Amount
Approved*Type of ProgramCountry
*By IMF board of Directors
** Initial program was enhanced and replaced Sources: IMF, IHS Global Insight
All data in million SDR, unless otherwise stated (U.S.$1=0.672592 SDR)

Copyright © 2009 IHS Global Insight. All Rights Reserved.
Special Focus: Russia
• Declines in commodity prices will hurt export income, a key driver of consumer and business spending
• Oil exports are declining due to capacity limits and rising domestic needs
• Expansionary monetary policies have fueled inflation
• The global financial crisis has exacerbated the stock market correction, international capital flight, and the ruble’s collapse

Copyright © 2009 IHS Global Insight. All Rights Reserved.
Crude Oil Output and Exports
Now in Decline
-10
0
10
20
2002 2003 2004 2005 2006 2007 2008
Crude Oil Output Crude Oil Exports
(Percent change from a year earlier)

Copyright © 2009 IHS Global Insight. All Rights Reserved.
-3
0
3
6
9
12
2000 2002 2004 2006 2008 2010 2012
Real GDP Growth (%)
Russia Not Expected to Recover
to 2008 Growth in Near-Term
Copyright © 2009 IHS Global Insight. All Rights Reserved.
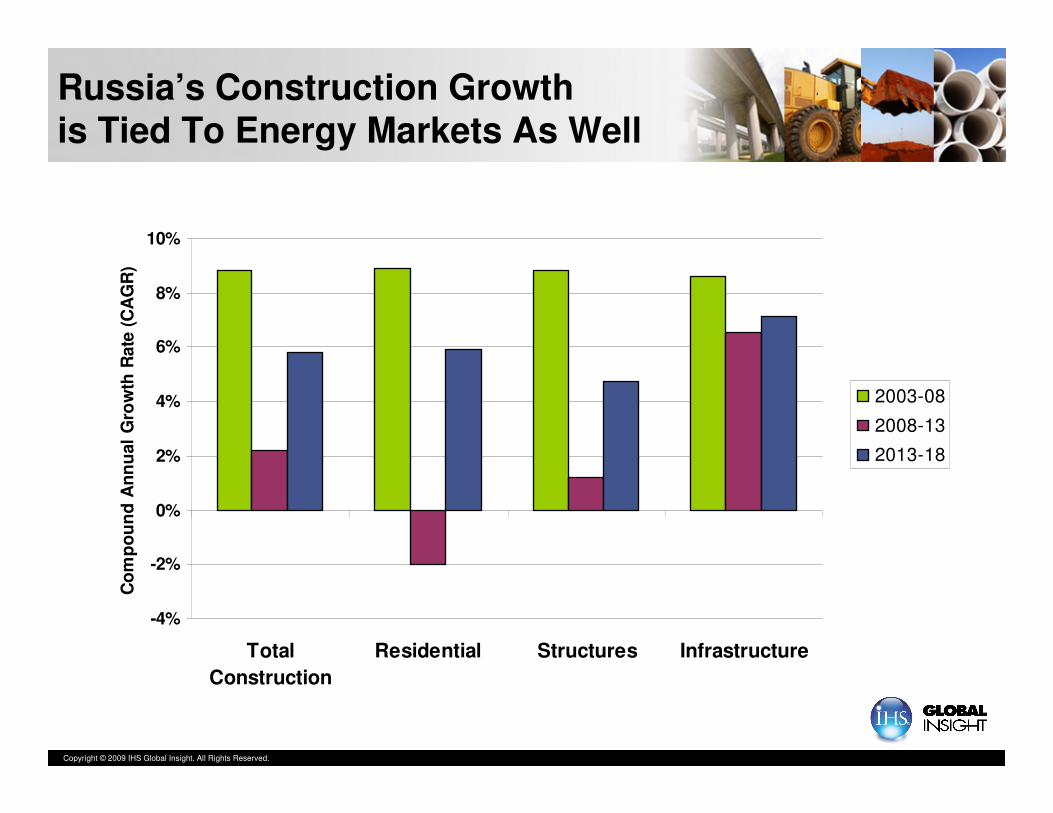
Russia’s Construction Growth is Tied To Energy Markets As Well
-4%
-2%
0%
2%
4%
6%
8%
10%
Total
Construction
Residential Structures Infrastructure
Co
mp
ou
nd
An
nu
al
Gro
wth
Rate
(C
AG
R)
2003-08
2008-13
2013-18

Copyright © 2009 IHS Global Insight. All Rights Reserved.
Summary Tables: Western Europe
12(-1.1%)(-3.9%)(-7.5%)1788.02Western Europe
13(-6.7%)(-7.8%)(-26.0%)26.07Ireland
11(-0.2%)(-2.4%)(-5.8%)29.89Finland
15+1.2%(-0.2%)(-4.0%)31.66Portugal
12+0.5%(-1.5%)(-5.7%)34.07Denmark
11+0.7%(-1.0%)(-2.9%)34.43Sweden
13+0.7%(-1.4%)(-1.3%)38.33Norway
10+0.5%(-1.0%)(-1.2%)41.11Switzerland
12+0.2%(-2.3%)(-3.3%)42.70Austria
15+1.9%(-0.3%)(-2.6%)45.92Greece
32+1.4%(-4.3%)(-4.2%)47.24Turkey
13+0.4%(-0.2%)(-3.8%)61.54Belgium
12(-0.3%)(-2.6%)(-5.5%)89.20Netherlands
14(-0.5%)(-2.3%)(-4.6%)233.81Italy
12(-0.3%)(-1.7%)(-3.7%)240.56Germany
11(-4.4%)(-10.1%)(-14.7%)242.82United Kingdom
12(-0.3%)(-3.9%)(-5.9%)269.41France
13(-2.6%)(-5.1%)(-11.9%)279.24Spain
CAGR, 2008-132009-102008-092009
Percent2005 U.S.$ Billions
Construction
Five Year Risk
Score
Total Real Construction Spending GrowthTotal Construction
Spending

Copyright © 2009 IHS Global Insight. All Rights Reserved.
Summary Tables: Eastern Europe
28+2.0%(-0.6%)(-3.9%)266.33Eastern Europe
17+4.1%+1.0%(-0.3%)7.35Bulgaria
32(-1.1%)(-3.6%)(-13.9%)9.54Ukraine
19(-0.2%)(-2.0%)(-6.4%)11.49Hungary
16+2.6%+2.5%(-2.5%)11.49Slovakia
23+3.2%+1.0%(-0.5%)24.89Romania
19+2.2%+0.3%(-5.8%)29.19Czech Republic
20+1.8%(-0.7%)(-0.1%)65.81Poland
34+2.2%(-1.2%)(-5.4%)106.55Russia
CAGR, 2008-132009-102008-092009
Percent 2005 U.S.$ Billions
Construction
Five Year Risk Score
Total Real Construction Spending GrowthTotal Construction
Spending

Copyright © 2009 IHS Global Insight. All Rights Reserved.
Implications For Your Business
• This is the worst year, and worst outlook, for the European construction market in two decades
• While fiscal stimulus and support from the IMF has certainly improved the infrastructure construction outlook in particular, growth in the European construction markets will not return to the levels enjoyed a few years ago
• Eastern Europe, although more risky, is expected to rebound more quickly than Western Europe