FINANCING VOCATIONAL EDUCATION
Sorting out the byzantine world of state funding formulas, district cost variations, and options for supporting the provision of equitable, quality vocational education in high schools
A State Policymaker’s Guide
BY Steven Klein
MPR Associates 2150 Shattuck Avenue, Suite 800 Berkeley, CA 94704 (510) 849-4942
June 2001
DISTRIBUTED IN COLLABORATION WITH National Association of State Directors of Vocational Technical Education Consortium AND National Conference of State Legislatures
2
ACKNOWLEDGMENTS
The author would like to thank countless state finance and vocational education
administrators for supplying MPR researchers with information documenting
their state funding formulas, as well as the time they spent working with MPR
researchers to explain often complex state funding mechanisms.
The author would also like to thank the staff of Management, Analysis, & Plan-
ning, Inc., and the Ohio Legislative Office of Education Oversight for granting
permission to extract portions of reports for use in this paper.
The author wishes to recognize the contributions of Gary Hoachlander, President
of MPR Associates, without whose suggestions and direction this paper would
have been impossible. He also wishes to recognize Renee Beltranena and Tawny
Beal for assistance in collecting state data.
The author acknowledges Ann Dykman for edits and suggestions and Barbara
Kridl for layout and production.
3
TABLE OF CONTENTS
Page
Acknowledgments .............................................................................................. 2
Introduction ....................................................................................................... 4
How Costly Is Vocational Education? ................................................................ 6
State Approaches to Funding Vocational Education.......................................... 11
Reflections on State Funding Practices for Vocational Education ..................... 24
Summary............................................................................................................. 28
References ........................................................................................................... 30
Appendix—State Funding Matrices .................................................................... 31
4
INTRODUCTION
States have long provided financial support to public school districts to ensure
all students have access to quality vocational programs. This aid is generally
conditioned on the assumption that vocational education is more expensive to
provide than other forms of instruction, although the actual magnitude of this
added expense has yet to be conclusively documented. This lack of evidence has
often afforded state policymakers considerable discretion in devising funding
strategies and authorizing state resources in support of vocational education.
A national survey of state funding practices for vocational education reveals that
the majority employ either unit-cost-based mechanisms, in which funding is
allocated based on the number of courses offered or teachers engaged in voca-
tional instruction, or weighted, per-pupil formulas that allocate resources based
on the number of students enrolled in vocational education in each district. A
few states are experimenting with performance-based funding formulas tied to
student outcomes, and some—typically smaller, more rural states—do not pro-
vide any supplemental resources for vocational instruction. Predictably, the ra-
tionale for the different funding strategies and levels of support varies by state
according to historical practices, legislative intent, scale of the vocational enter-
prise, and breadth and scope of vocational programs.
This paper is intended to offer state policymakers data that will help them make
more informed decisions about vocational education funding. Based on details
supplied by state vocational administrators from across the nation, this paper
communicates perspectives from the field about the intended and unintended
effects of state legislation on vocational education. Different funding formulas
and funding levels are arrayed to provide legislators with an understanding of
the approaches states are using to support vocational programs. A discussion of
the multiple purposes of vocational education is also included to assist policy-
makers in determining what constitutes a reasonable cost for maintaining voca-
tional programs.
This paper is organized in three sections. The first reviews factors that can con-
tribute to higher costs for vocational instruction and describes how differences
in the delivery of this instruction can affect quality and cost. The second section
summarizes results of a 50-state survey conducted by MPR Associates to ascertain

Financing Vocational Education 5
vocational education funding patterns across states. The third section identifies
funding practices that may help inform policy within states and discusses the
types of information that states will likely need to collect to evaluate their voca-
tional funding systems.
6
HOW COSTLY IS VOCATIONAL EDUCATION?
If the average cost of providing vocational education could be objectively meas-
ured, states would be better able to adjust funding to reflect the actual cost dis-
tricts face in educating students. This section reviews national and state data
from the school finance literature to isolate the component costs of vocational
education compared with other forms of instruction. It suggests that the relative
cost of hiring academic and vocational instructors is about the same; however,
other costs, such as the number of teachers required to staff classrooms and the
materials and equipment needed to provide instruction, are both variable and
difficult to quantify based on published studies alone. Student demographics
and state, regional, and local economic conditions, such as the demand for
skilled labor or the price of materials, also may affect costs, as can the manner in
which vocational education is organized and delivered.
Vocational Staff Salaries
Since school districts must compete against local employers when hiring staff, it
is often assumed that excess demand will drive up the cost of vocational instruc-
tor salaries.1 While variation in the education, tenure, professional development,
and contractual incentives offered to vocational teachers likely contribute to sal-
ary differentials between the two groups, average base salaries for full-time voca-
tional and academic teachers were not statistically different across the nation in
1993–94 ($35,080 and $34,762, respectively) (table 1). This indicates that, on the
average, vocational teachers are no more expensive to compensate than aca-
demic instructors.
A variety of factors account for the minor earnings disparities noted between
vocational and academic instructors. National data suggest that while vocational
educators are relatively less likely than academic teachers to have earned ad-
vanced degrees, they are more likely to have attained greater seniority in the
1For the purposes of the national survey, vocational educators are those who identify their primary field of instruction as accounting, agriculture, business and marketing, health occupations, indus-trial arts, trade and industry, technical, home economics, or other vocational/technical education. Academic instructors were confined to four subjects areas: mathematics; science (e.g., biology, chem-istry, earth science, physics); English/language arts; and social studies.
Financing Vocational Education 7
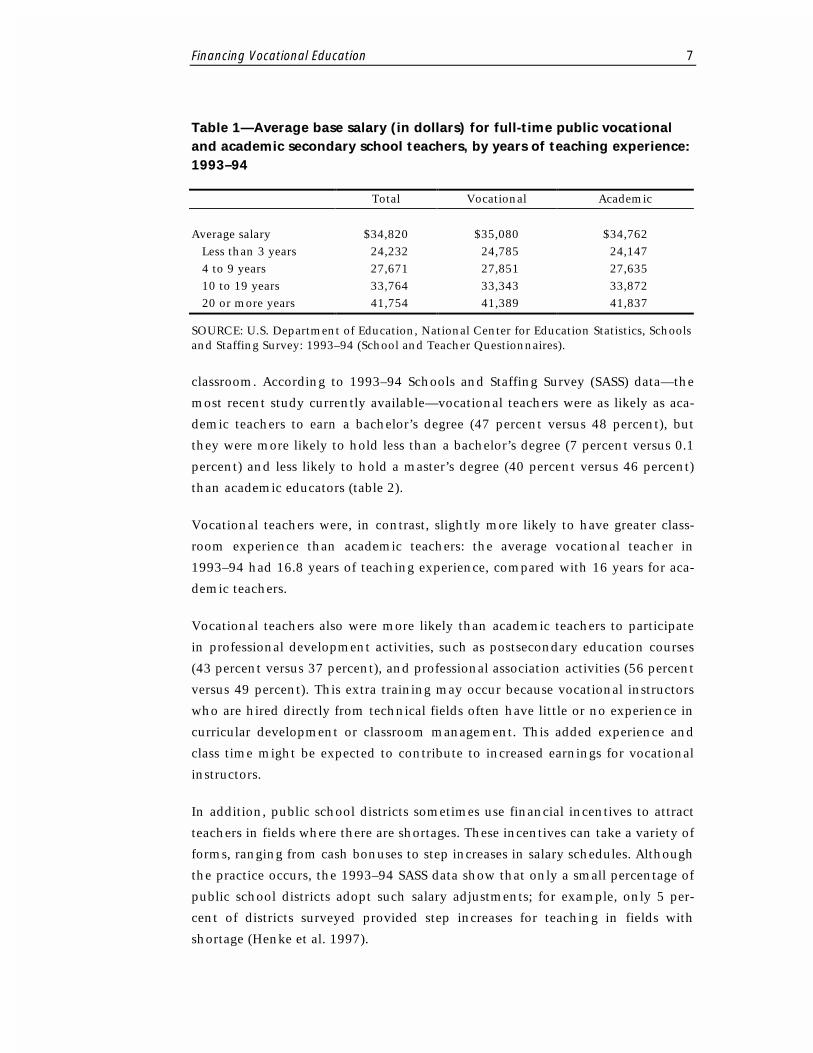
Table 1—Average base salary (in dollars) for full-time public vocational and academic secondary school teachers, by years of teaching experience: 1993–94
Total Vocational Academic
Average salary $34,820 $35,080 $34,762 Less than 3 years 24,232 24,785 24,147 4 to 9 years 27,671 27,851 27,635 10 to 19 years 33,764 33,343 33,872 20 or more years 41,754 41,389 41,837
SOURCE: U.S. Department of Education, National Center for Education Statistics, Schools and Staffing Survey: 1993–94 (School and Teacher Questionnaires).
classroom. According to 1993–94 Schools and Staffing Survey (SASS) data—the
most recent study currently available—vocational teachers were as likely as aca-
demic teachers to earn a bachelor’s degree (47 percent versus 48 percent), but
they were more likely to hold less than a bachelor’s degree (7 percent versus 0.1
percent) and less likely to hold a master’s degree (40 percent versus 46 percent)
than academic educators (table 2).
Vocational teachers were, in contrast, slightly more likely to have greater class-
room experience than academic teachers: the average vocational teacher in
1993–94 had 16.8 years of teaching experience, compared with 16 years for aca-
demic teachers.
Vocational teachers also were more likely than academic teachers to participate
in professional development activities, such as postsecondary education courses
(43 percent versus 37 percent), and professional association activities (56 percent
versus 49 percent). This extra training may occur because vocational instructors
who are hired directly from technical fields often have little or no experience in
curricular development or classroom management. This added experience and
class time might be expected to contribute to increased earnings for vocational
instructors.
In addition, public school districts sometimes use financial incentives to attract
teachers in fields where there are shortages. These incentives can take a variety of
forms, ranging from cash bonuses to step increases in salary schedules. Although
the practice occurs, the 1993–94 SASS data show that only a small percentage of
public school districts adopt such salary adjustments; for example, only 5 per-
cent of districts surveyed provided step increases for teaching in fields with
shortage (Henke et al. 1997).
Financing Vocational Education 8
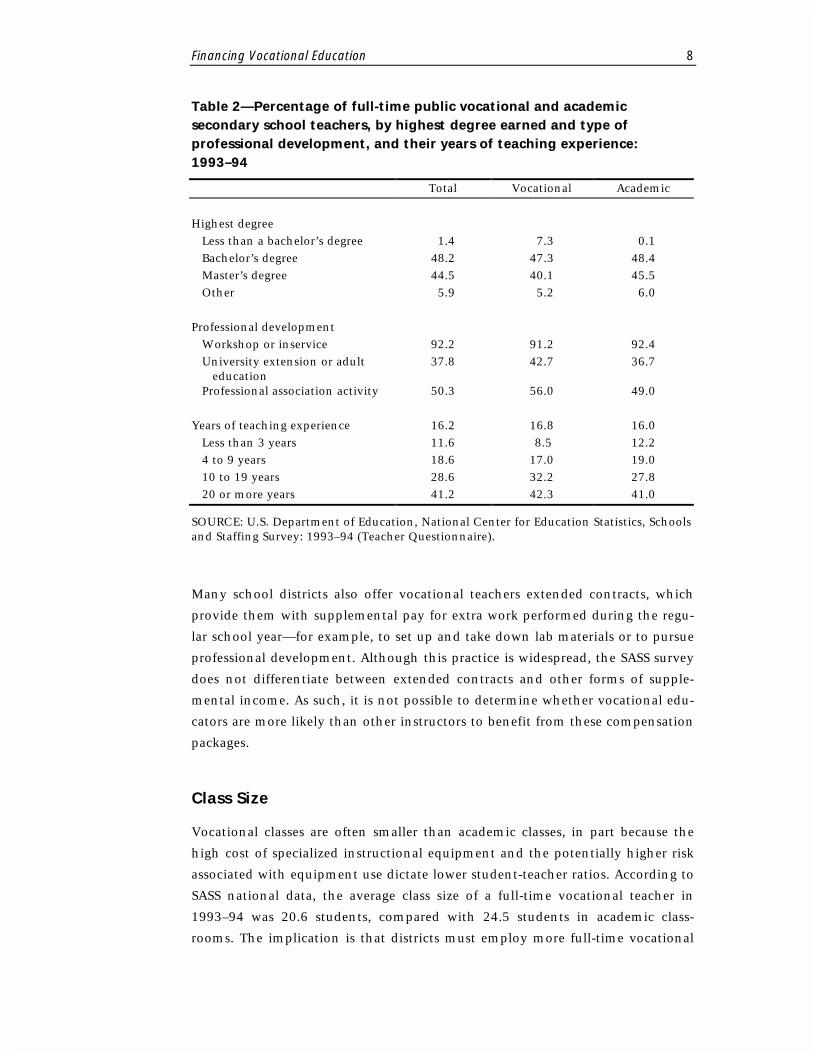
Table 2—Percentage of full-time public vocational and academic secondary school teachers, by highest degree earned and type of professional development, and their years of teaching experience: 1993–94
Total Vocational Academic
Highest degree Less than a bachelor’s degree 1.4 7.3 0.1 Bachelor’s degree 48.2 47.3 48.4 Master’s degree 44.5 40.1 45.5 Other 5.9 5.2 6.0 Professional development Workshop or inservice 92.2 91.2 92.4 University extension or adult education
37.8 42.7 36.7
Professional association activity 50.3 56.0 49.0 Years of teaching experience 16.2 16.8 16.0 Less than 3 years 11.6 8.5 12.2 4 to 9 years 18.6 17.0 19.0 10 to 19 years 28.6 32.2 27.8 20 or more years 41.2 42.3 41.0
SOURCE: U.S. Department of Education, National Center for Education Statistics, Schools and Staffing Survey: 1993–94 (Teacher Questionnaire).
Many school districts also offer vocational teachers extended contracts, which
provide them with supplemental pay for extra work performed during the regu-
lar school year—for example, to set up and take down lab materials or to pursue
professional development. Although this practice is widespread, the SASS survey
does not differentiate between extended contracts and other forms of supple-
mental income. As such, it is not possible to determine whether vocational edu-
cators are more likely than other instructors to benefit from these compensation
packages.
Class Size
Vocational classes are often smaller than academic classes, in part because the
high cost of specialized instructional equipment and the potentially higher risk
associated with equipment use dictate lower student-teacher ratios. According to
SASS national data, the average class size of a full-time vocational teacher in
1993–94 was 20.6 students, compared with 24.5 students in academic class-
rooms. The implication is that districts must employ more full-time vocational
Financing Vocational Education 9
instructors to generate a similar number of student contact hours, potentially
boosting the average cost of vocational instruction by approximately 20 percent
over the cost of academic courses ($1,703 versus $1,419 per student per full-time
instructor).
Overall, there are fewer students enrolled in vocational than academic classes,
but the average size of vocational classes likely varies by course level and pro-
gram area. In 1994, almost all public high school graduates (97 percent) com-
pleted at least one vocational education course; however, according to 1998
data, only 25 percent concentrated in vocational education (Hurst and Hudson
2000).2 Consequently, the bulk of the vocational enrollment is in introductory
courses, which often emphasize less advanced skills or require less exposure to
advanced instructional equipment.
Students concentrating in vocational education generally require greater instruc-
tor attention and access to more sophisticated equipment, often because they are
striving to achieve industry certification. Average class sizes typically shrink as
skill specificity rises, particularly in trade and industrial arts programs in which
teachers must supervise students as they operate tools and machinery. Accord-
ingly, the cost for vocational instruction within a given school or district may
depend on a variety of factors, including the number of students enrolled in vo-
cational courses, the number and type of introductory and advanced vocational
courses offered, and the equipment used for instruction.
Purchase and Maintenance of Vocational Instructional Equipment
To keep programs current, school districts must continually purchase vocational
equipment and materials and maintain vocational facilities. Little information
on these capital costs has been published, in part because few states collect data
on district expenditures by program area. Another complication is that school
districts often have different sources of materials depending on the program of-
fered. Materials may be donated by local employers, purchased periodically or
through specially negotiated agreements with manufacturers, funded with fed-
eral Perkins Act dollars, or obtained through other, more creative means (such as
student fund-raisers or reconditioning discarded equipment).
2Vocational concentration refers to students earning 3 or more credits in a single occupationally specific program area.
Financing Vocational Education 10
In the absence of state or national data on equipment costs, it can be instructive
to examine state cost data, which can provide a more complete picture of the
relative cost associated with vocational delivery. Unfortunately, state finance
data on individual cost components (such as teacher salaries) are generally not
available, so the interpretation of aggregate state-level data must be approached
with care. Also, because states vary so much in the amount of vocational educa-
tion funding they provide, it is difficult to compare one state’s results with an-
other.
11
STATE APPROACHES TO FUNDING VOCATIONAL
EDUCATION
MPR Associates conducted a national survey to help state legislators compare
their vocational education funding levels and formulas for distributing resources
with those of other states. The project began in July 2000 with an Internet
search on state legislation, administrative codes, and state guidelines that govern
vocational funding. In August 2000, MPR researchers developed a common in-
terview protocol and began calling state finance experts within state education
and/or finance departments. These interviews helped MPR staff validate state
finance data, fill in missing information or gather more detail about processes,
and clarify the state’s intent with regard to its funding practices. In some cases,
administrators were contacted several times to ensure reporting accuracy. This
section summarizes the findings on strategies used to fund vocational programs,
quantifies the level of support afforded by these approaches, and assesses the
rationale and supporting data on which these formulas are based.
Rationale for State Funding Approaches
Conversations with state representatives revealed a range of intentions underly-
ing state vocational funding practices. In many cases, staffers spoke of inheriting
historical funding formulas that had been in place for years prior to their hire.
When pressed on the reasons for their continued use, staff often mentioned the
importance of maintaining stability in annual allocations and expressed a lack of
interest in fiddling with a system that appeared to be working.
On the other hand, a number of states had recently adopted or were transition-
ing to new formulas. Changes in funding practices in these states often resulted
from court rulings on equity and adequacy issues—either within vocational edu-
cation or secondary education overall—or legislative mandates to reform voca-
tional education policy. Since 1993, at least 10 states have undergone systematic
changes in their state funding approaches (Education Commission of the States
1999). Shifts in state education policy also have led to changes in state funding
for vocational education. For example, Indiana recently adopted a new voca-
tional funding formula that is intended to promote state economic competitive-
ness. Under the new formula, local agencies are funded based on student
Financing Vocational Education 12
participation in specific vocational program areas, particularly those in which
there is above average labor market demand. Responding to legislative pressure,
Florida recently instituted a postsecondary performance incentive system that
rewards local agencies based on the number of students who complete programs
and enter the workforce.
State funding methods for vocational education fall into four broad categories:
foundation grant programs, unit cost funding, weighted adjustments, and per-
formance-based outcomes. It is not always easy, however, to label individual
state approaches. In many cases, states may combine two or more strategies,
such as basing funding on the number of vocational full-time-equivalent stu-
dents but adding in a stipend for equipment or administration of the programs.
In addition, states deliver vocational education in different settings, including
high schools devoted to vocational education, programs within comprehensive
high schools, and regional centers that serve several high schools, often in two
or more districts. Whether a state has multiple vocational delivery systems and
whether these systems are funded using similar allocation criteria also compli-
cate classification attempts. To simplify analysis for the purposes of this study,
state funding systems are classified based on the practice used to distribute a ma-
jority of state vocational funds. Analysis places greater emphasis on quantifying
the level of vocational funding and its relationship to other forms of instruction
than on detailing the multitude of channels by which vocational funds may be
disbursed. A matrix in each section helps illustrate state funding approaches.
Category I: Foundation Grants
State foundation grant programs are intended to ensure that all students in a
state receive a minimum level of basic education services. Each year, the state
establishes a threshold spending level for each student, often expressed in full-
time-equivalent (FTE) or Average Daily Membership (ADM) units. This level is
then adjusted to account for district attributes, which may include local wealth
or taxing capacity, school size and urbanicity, and/or student characteristics or
special needs. Districts receive an allocation according to the number of students
they enroll and have some level of flexibility in how to spend this money.
Twenty percent of states—Arkansas, Nebraska, Nevada, New Hampshire, New
Jersey, New Mexico, Oregon, South Dakota, Wisconsin, and Wyoming—do
not budget supplemental funding for vocational education in addition to their
state foundation grant program. Instead, districts opting to offer vocational pro-
grams must fund them out of their state foundation grant, with their share of
Financing Vocational Education 13
federal Perkins Act dollars that flow from the state, and/or with local contribu-
tions.
Although these 10 states do not earmark additional funding for vocational edu-
cation, it is likely that most, if not all, indirectly consider the cost of providing
vocational education when they determine foundation funding levels. Given
that school districts in each of these states have historically provided students
with access to vocational services, in some cases through area vocational high
schools, it is clear that the absence of supplemental funding has not eradicated
vocational instruction. It could be that the size of state foundation grants is suf-
ficient to support vocational instruction, local agencies have found other sources
to fund vocational programs, or the type of vocational instruction and manner
of delivery conform to available funding.
Some states have developed foundation grant formulas that implicitly account
for the average cost of providing vocational instruction within the state. To es-
tablish state funding levels, Wyoming has adopted a cost-based grant model
that takes into account approximately 25 instructional and operational cost
components, including the average statewide cost of providing vocational educa-
tion. Consequently, in the aggregate, the basic block grant under the new system
is believed to be sufficient to pay for the amount and quality of vocational edu-
cation offered before the state school finance system changed.
Recognizing that vocational students may be required to travel to other sites to
receive services, some states have given local agencies leeway in how they calcu-
late vocational FTE students. Nevada, for example, allows local districts to count
students who are involved in cooperative work agreements even if they spend as
much as one-third of their day off campus. Moreover, states that operate stand-
alone area vocational schools, such as Arkansas, provide a small amount of
money for equipment and program start-up to qualified schools that apply.
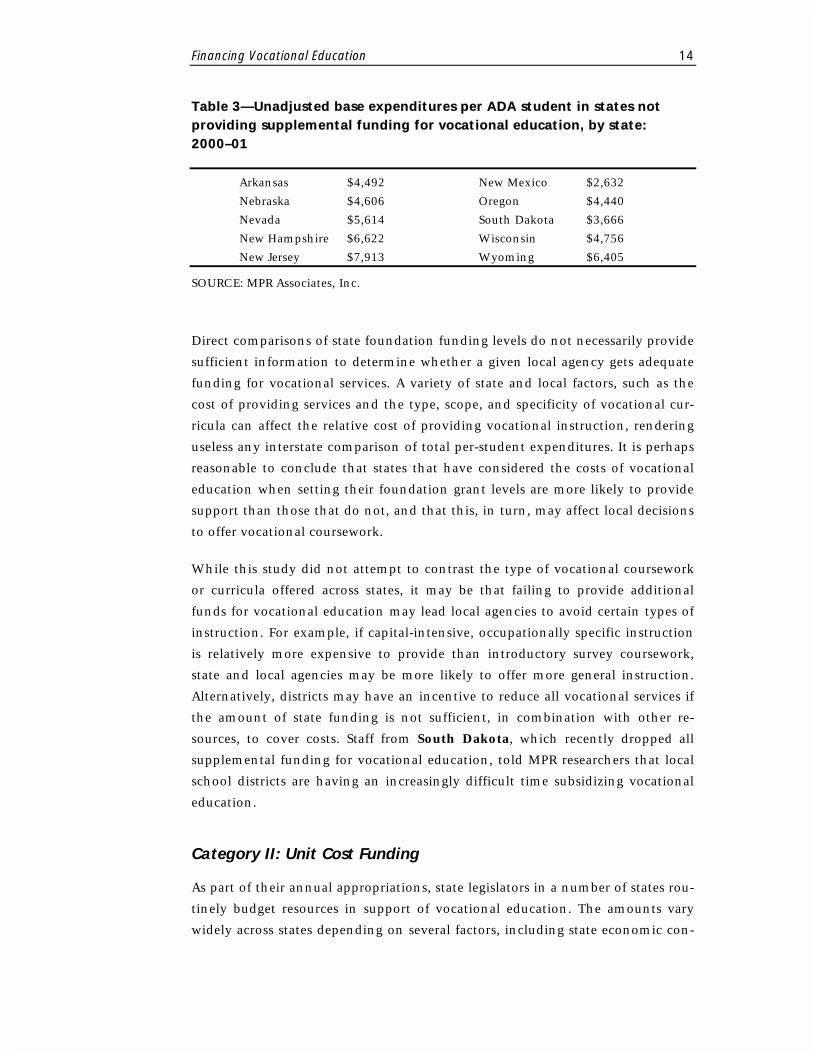
A review of state foundation spending (see table 3) suggests that some states, in-
cluding New Jersey, New Hampshire, and Wyoming, provide a relatively high
level of support for all students, vocational included. In fact, unadjusted state
funding in New Jersey for students ($7,913) exceeds funding provided for voca-
tional students participating in traditional program areas in most states.
Financing Vocational Education 14
Table 3—Unadjusted base expenditures per ADA student in states not providing supplemental funding for vocational education, by state: 2000–01
Arkansas $4,492 New Mexico $2,632
Nebraska $4,606 Oregon $4,440
Nevada $5,614 South Dakota $3,666
New Hampshire $6,622 Wisconsin $4,756
New Jersey $7,913 Wyoming $6,405
SOURCE: MPR Associates, Inc.
Direct comparisons of state foundation funding levels do not necessarily provide
sufficient information to determine whether a given local agency gets adequate
funding for vocational services. A variety of state and local factors, such as the
cost of providing services and the type, scope, and specificity of vocational cur-
ricula can affect the relative cost of providing vocational instruction, rendering
useless any interstate comparison of total per-student expenditures. It is perhaps
reasonable to conclude that states that have considered the costs of vocational
education when setting their foundation grant levels are more likely to provide
support than those that do not, and that this, in turn, may affect local decisions
to offer vocational coursework.
While this study did not attempt to contrast the type of vocational coursework
or curricula offered across states, it may be that failing to provide additional
funds for vocational education may lead local agencies to avoid certain types of
instruction. For example, if capital-intensive, occupationally specific instruction
is relatively more expensive to provide than introductory survey coursework,
state and local agencies may be more likely to offer more general instruction.
Alternatively, districts may have an incentive to reduce all vocational services if
the amount of state funding is not sufficient, in combination with other re-
sources, to cover costs. Staff from South Dakota, which recently dropped all
supplemental funding for vocational education, told MPR researchers that local
school districts are having an increasingly difficult time subsidizing vocational
education.
Category II: Unit Cost Funding
As part of their annual appropriations, state legislators in a number of states rou-
tinely budget resources in support of vocational education. The amounts vary
widely across states depending on several factors, including state economic con-
Financing Vocational Education 15
ditions, the number of students participating in vocational programs, the num-
ber and type of local agencies offering services, historical funding precedent, and
the relationship of vocational education to other legislative priorities. Although
these annual allocations may run into the hundreds of millions of dollars, state
funding usually covers only a fraction of total spending on vocational instruc-
tion.
To allocate funding to local education agencies, state administrators design fund-
ing formulas that take into account a variety of district characteristics. Most base
these decisions on the level of student participation in vocational education, the
number of teachers required to provide instruction, or the overall costs incurred
in providing vocational services. As might be expected, given the rash of lawsuits
over school finance, states often include some form of fiscal equalization factor
in their formula to control for district wealth. Other factors used to adjust state
allocations to local agencies include program type, length of training, size of the
institution, student outcomes, and student participation in vocational organiza-
tions, such as VICA or FFA. A number of states, typically those that concentrate
funding in area vocational schools, also budget additional resources to support
administration and facility construction, purchase, or lease.
Funding by FTE Student Participation
Fifteen states condition the size of district allocations, in part or whole, on en-
rollment. For example, a district that enrolls 5 percent of the state’s FTE voca-
tional students would be eligible to receive 5 percent of the state funds allocated
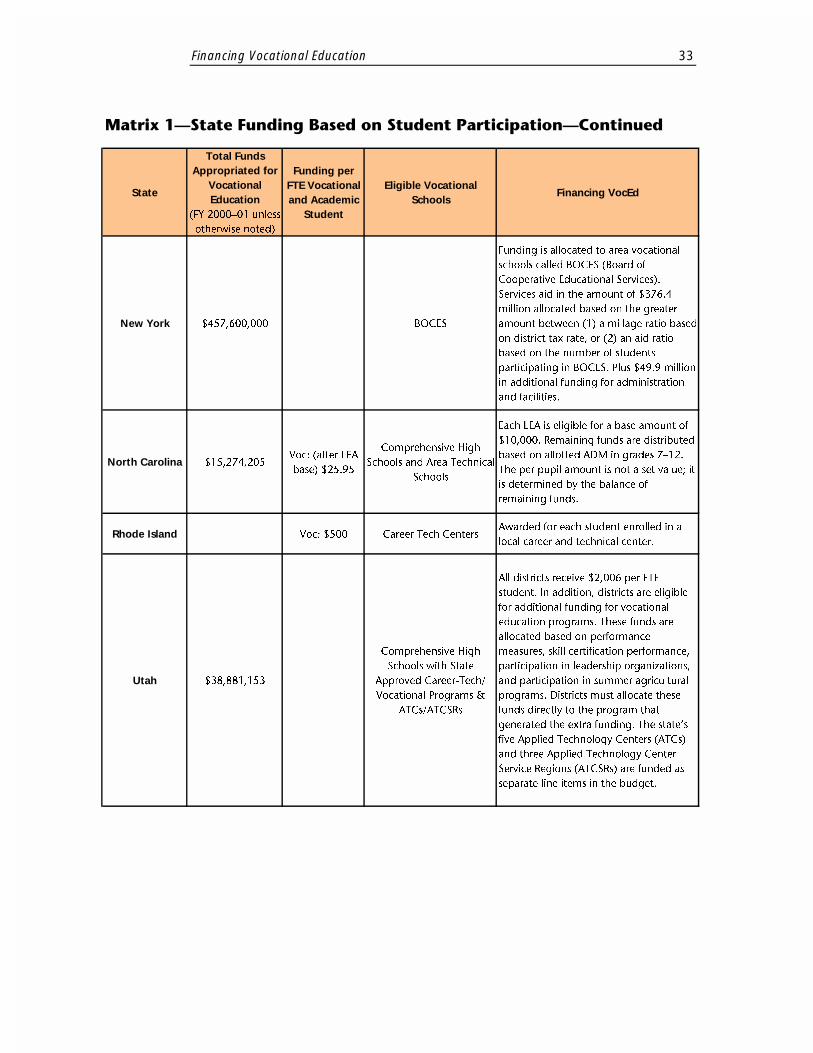
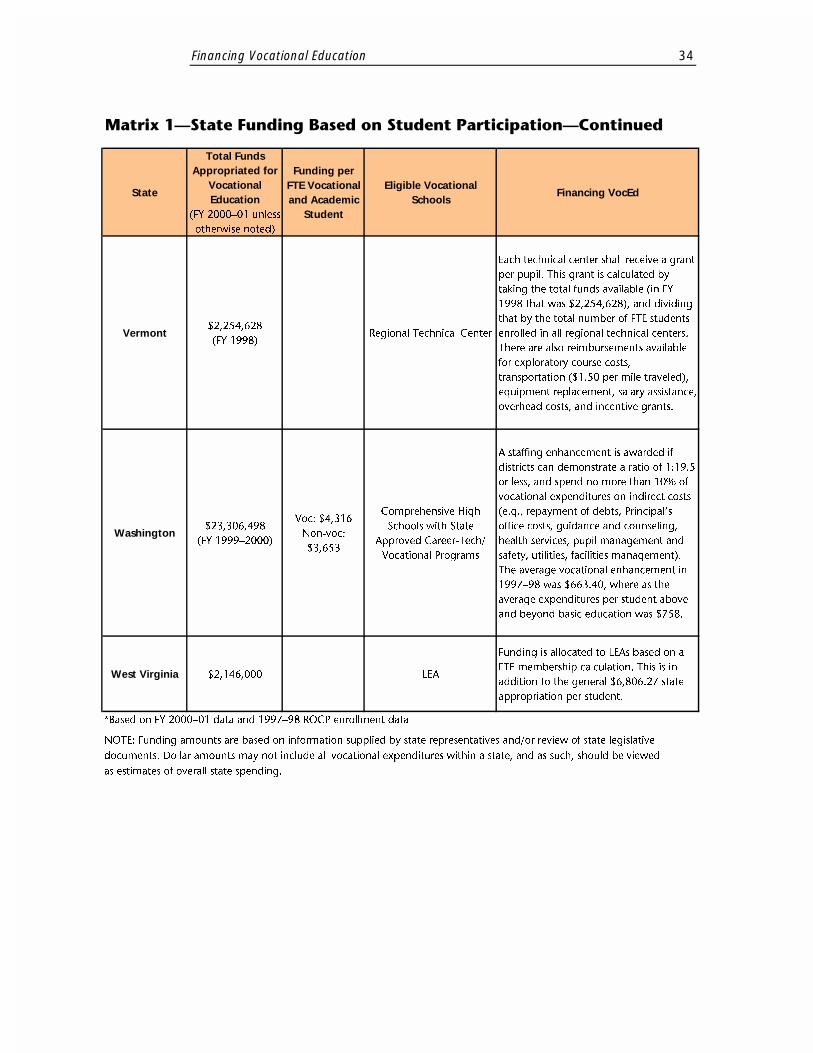
for vocational education. The states that allocate a majority of their vocational
funding based on student participation levels are Arizona, California, Con-
necticut, Hawaii, Maryland, Massachusetts, Minnesota, Montana, New York,
North Carolina, Rhode Island, Utah, Vermont, Washington, and West Vir-
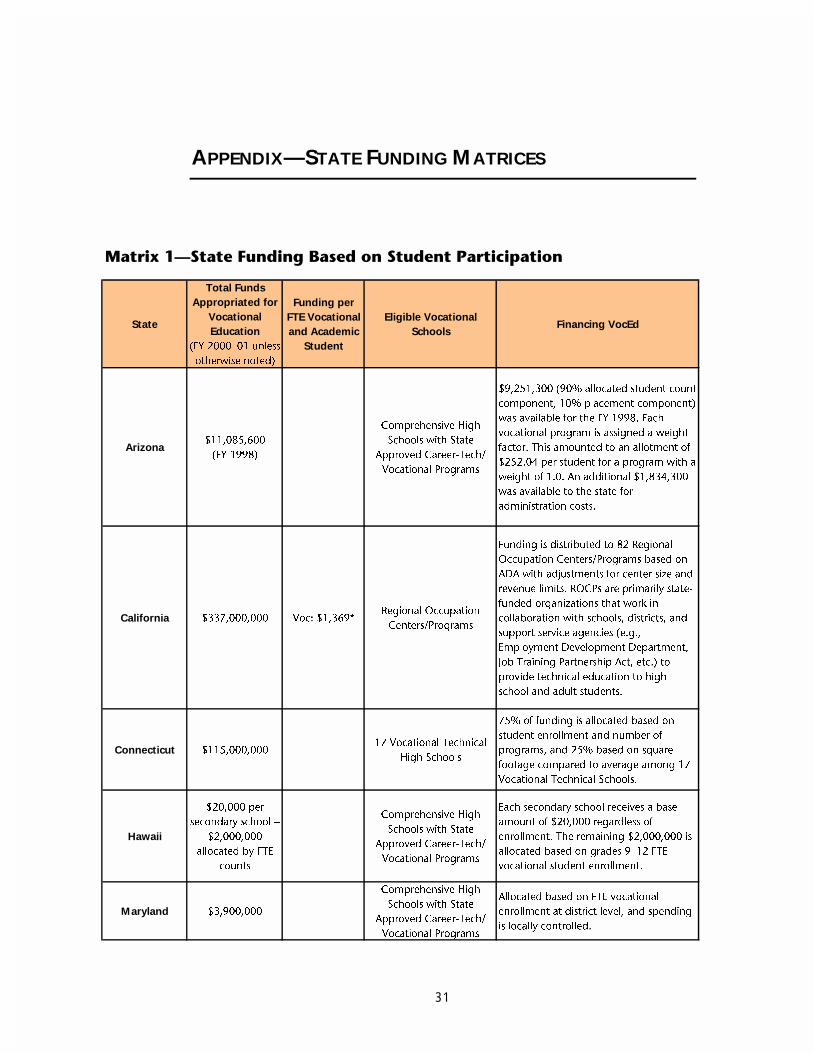
ginia.3 The specific funding mechanism varies within states, however (see Ma-
trix 1 in the appendix).
To consolidate state resources, a number of states, including California, Con-
necticut, New York, Rhode Island, and Vermont earmark state funding for
area vocational centers. California provides a fairly good example of the method
most states use: funding is distributed to 82 Regional Occupational Center Pro-
grams based on the centers’ average daily attendance (adjusted for center size
3Arizona considers both student participation levels and vocational student weights in its formula to distribute funding, and the majority of districts receive funding based on student participation. Weights are applied only to students who participate in one of the state’s two joint vocational edu-cation districts, which serve roughly 12 of the state’s 231 districts.
Financing Vocational Education 16
and revenue limits). To adjust for district wealth, New York lets its area centers
choose whether to submit either enrollment data or its millage ratio, which is
based on the tax rate of sending districts. Not all states that fund centers correct
for district wealth: Connecticut allocates 75 percent of funding based on the
number of programs and students enrolled and 25 percent based on school
square footage, and Vermont awards $500 per student enrolled in an area cen-
ter, based on the previous year’s enrollment.
The remaining 10 states fund vocational instruction regardless of whether it is
offered in a comprehensive high school or area vocational center. In most cases,
states have devised unique funding formulas that, though based on vocational
FTE student enrollment, incorporate other factors. Arizona has developed one of
the more complex formulas: a block grant accounts for roughly 83 percent of
state vocational funds. Ninety percent of the grant is allocated based on 11th- and
12th-grade vocational enrollment and 10 percent on the number of students who
are placed in employment. Moreover, vocational enrollments are adjusted by
class length and weighted by program area, with higher priority programs—
those preparing students for high-demand, high-wage occupations—given
greater weight. The remaining 17 percent of vocational education funding in
Arizona is earmarked for administrative costs. The distribution formula is less
complicated in other states; for example, each LEA in North Carolina is eligible
for a base grant of $10,000. Any remaining state funds are allocated based on
student ADM in grades 7–12.
Other states use unique cost formulas that consider individual factors (for exam-
ple, teacher salaries), summed by program area, to generate an overall cost of
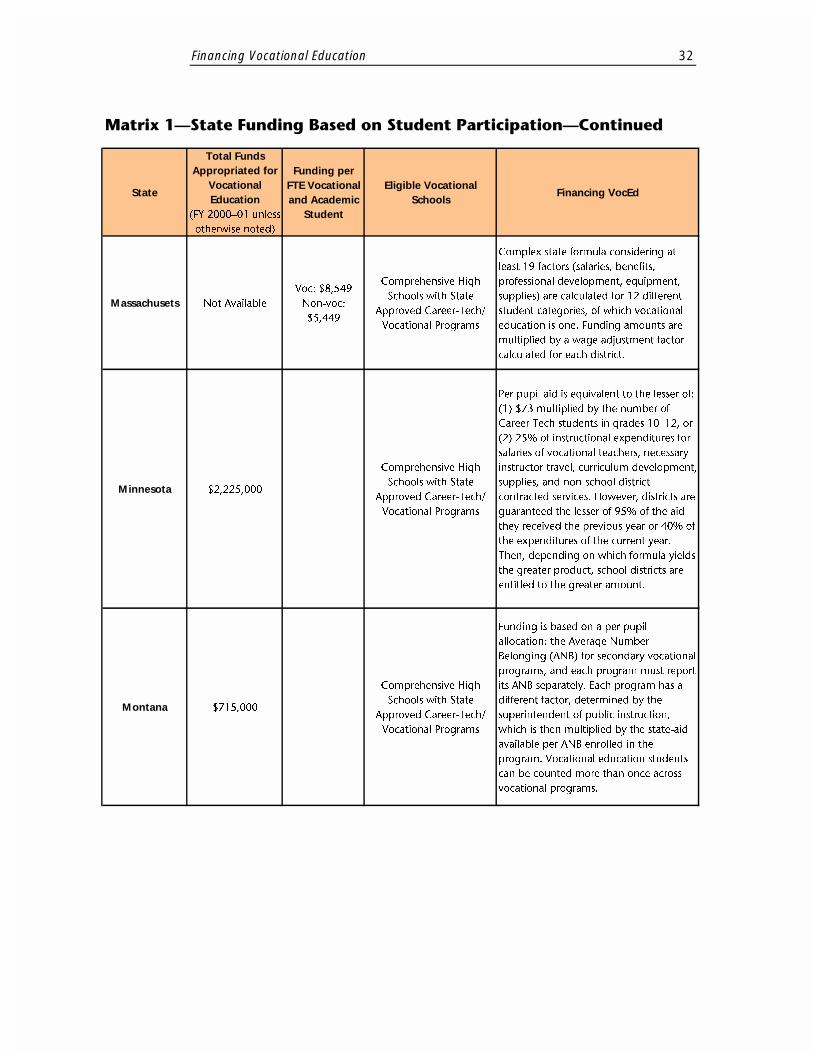
educating students. Massachusetts has one of the more intricate formulas. It
calculates average expenditures for at least 19 factors, including salaries, benefits,
professional development, physical plant, and equipment and supplies, for 12
different student categories, of which vocational education is one. State data for
the 2000–01 school year suggest that vocational education is 56 percent more
expensive to provide than a general high school education. So, on average, high
school districts in Massachusetts will receive $5,449 for each “academic” stu-
dent versus $8,549 for each FTE vocational student.
In Washington, local agencies are awarded $3,653 for each high school FTE stu-
dent enrolled in academic coursework and $4,316 for each vocational FTE stu-
dent. Only districts that cap their staff-to-student ratios at 1:19.5 and spend no
more than 10 percent of their vocational budget on indirect costs (such as mate-
rials and supplies) can receive state funding. Using data from earlier years, the
state has calculated that average local vocational expenditures exceeded those for
Financing Vocational Education 17
basic education by $758, an amount that is somewhat more than the actual av-
erage state allocation of $663.40 awarded by the state to cover the supplemental
cost.
Allocating resources based on the level of student participation in local agencies
seems a reasonably good way to concentrate funding in areas of greatest de-
mand. Moreover, when it is adjusted for district and other local characteristics,
this funding approach can provide some assurance that each local agency re-
ceives its fair share of state resources. It is not clear, however, that all districts
will receive the minimum resources necessary to provide an adequate program of
vocational services, even if the total state allocation for vocational education is
sufficient. If there is a fixed cost associated with offering particular types of voca-
tional programs, or in maintaining services across a number of program areas,
then smaller districts or those with more capital-intensive programs may be un-
able to support services.
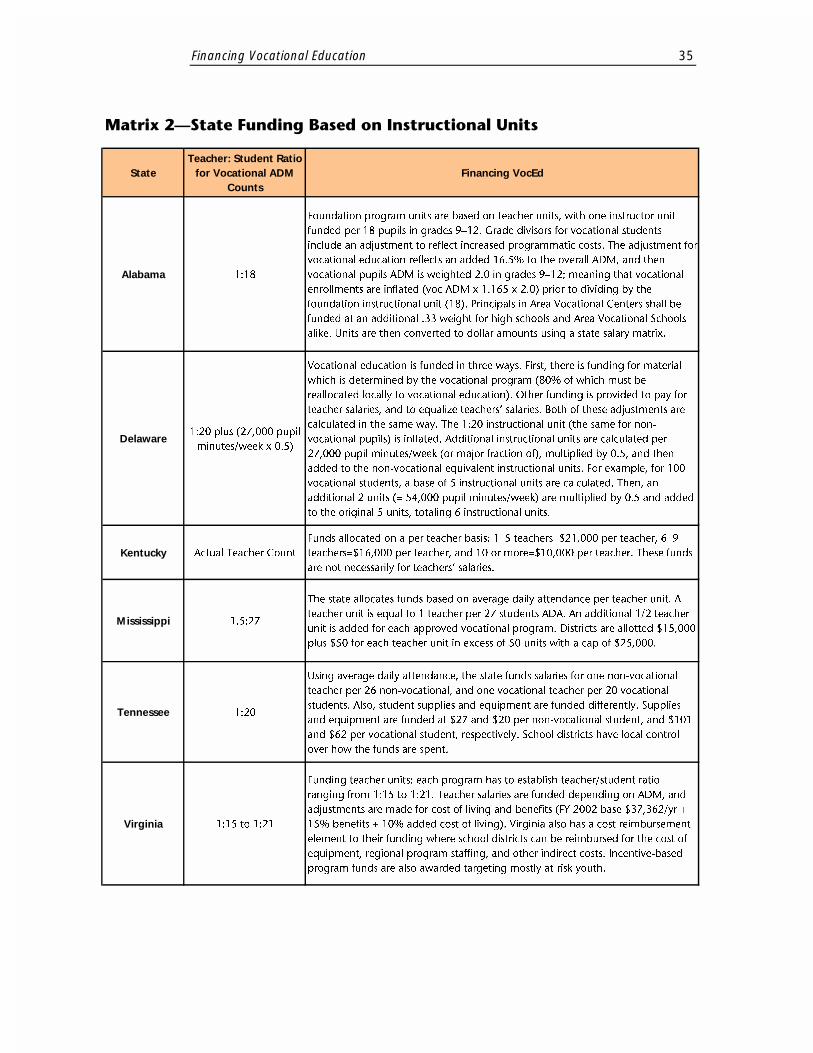
Funding by Instructional Unit
Alabama, Delaware, Kentucky, Mississippi, Tennessee, and Virginia (see Ma-
trix 2 in the appendix) base vocational funding on “instructional units,” or the
total number of students participating in vocational education (often calculated
on an FTE or ADM basis) divided by an average vocational class size (fixed by the
state).
Sometimes class sizes vary for vocational and academic instruction. In Tennes-
see, for example, a district earns funding for a teacher’s salary and expenses for
each 26 general high school students and for each 20 vocational students en-
rolled. Rather than rely on a single average class size to calculate instructional
units for vocational programs, Virginia has specified differing student-to-teacher
ratios—ranging from 15:1 to 21:1—for differing vocational programs. Each voca-
tional program unit is funded at a constant teacher salary amount of $37,262 per
year plus 15 percent for benefits; urban districts receive a 10 percent cost-of-
living adjustment.
One advantage of instructor-based funding is that states have some flexibility in
establishing the amount of supplemental funding local agencies may receive for
vocational coursework. Specifically, states that adjust instructional units by voca-
tional program area may be better able to direct resources toward those programs
that are most expensive to provide. By using smaller student bases for higher-
cost program areas, school districts can generate additional funding eligibilities
for different programs enrolling the same number of students. This can provide
Financing Vocational Education 18
local agencies with an incentive to offer relatively more expensive programs,
such as machine tools or automotive technologies, which an average cost ap-
proach might not otherwise cover. Alternatively, districts can choose to offer
smaller class sizes in high-cost, capital-intensive vocational program areas.
In Delaware, vocational instructional units are treated as add-on funding—
districts generate one instructional unit for every 20 students, regardless of pro-
gram area, and one-half unit for every 27,000 vocational pupil minutes per week.
Mississippi, in contrast, calculates instructional units for vocational and aca-
demic students by dividing student FTE by an average class size of 27. An addi-
tional one-half teacher unit is then added for each approved vocational program,
with funding based on certification and experience of an approved teacher.
Rather than link instructional funding to vocational student enrollments, Ken-
tucky has adopted a unique formula in which school districts that operate an
area center or vocational department receive $21,000 per teacher for up to five
vocational instructors, $15,000 per teacher for between six and nine instructors,
and $10,000 per teacher for 10 or more instructors. The state operates 52 centers
that receive a direct line item appropriation in the budget as well as per-pupil
funding in accordance with the basic school formula.
Funding by Cost Reimbursement
Colorado, Idaho, Iowa, Maine, Michigan, North Dakota, Oklahoma, and
Pennsylvania reimburse districts for all or a percentage of costs associated with
providing selected vocational services (see Matrix 3 in the appendix). Each year,
districts report their actual costs for vocational education programs and services,
often categorizing these expenditures by purpose. States typically appropriate
funding for vocational education based on prior year allocations and trends, ad-
justing year to year to reflect changes in state resources and district expenditures.
Some states, such as Maine, fully reimburse districts for all vocational costs that
exceed the state foundation formula. District costs are reimbursed on a two-year
lagged cycle, based on a formula that controls for district property values and
student enrollment. One drawback with this approach is that, since district ex-
penditures are premised on full state reimbursement, fiscal shortfalls can reduce
state capacity to reimburse districts, meaning that some portion of local costs
will go unfunded. The consequences can be severe for districts that face budget
deficits when anticipated state resources fail to materialize. A second problem
with full-cost reimbursement is that the approach does not encourage efficiency.
One state representative pointed out that districts are actually encouraged to
Financing Vocational Education 19
spend more under full-cost reimbursement, since in theory all costs will be com-
pensated.
Some states compromise by reimbursing a percentage of district costs or a subset
of program expense categories. For example, North Dakota reimburses districts
that provide secondary occupational programs for 26 percent of the cost of in-
structional salaries and extended contracts and 31 percent of approved travel.
Area Vocational and Technology Centers receive 39 percent of all approved
costs. Similarly, districts in Iowa are eligible for partial reimbursement of teacher
salaries, benefits, and travel. As in North Dakota, state funding in Iowa covers
only a percentage of total local expenditures: for the 2000–01 school year, it is
estimated that roughly 8 percent of actual vocational costs will be reimbursed by
the state. While Idaho also offers cost reimbursement, each of 43 vocational
program areas has a funding cap: for example, $15,390 per unit for machining
technologist programs and $5,130 per unit for marketing education.
In practice, state funding is seldom sufficient to cover all of the costs associated
with vocational education. For example, in Colorado, state funding is available
only if a school district’s vocational program costs exceed 70 percent of the per-
pupil funding otherwise available to it. It works a little like some insurance poli-
cies. Specifically, the state covers 80 percent of the first $1,250 of excess costs
and 50 percent of expenditures over that amount. In 2000–01, the vocational
program expenses of Colorado districts will equal roughly $63.5 million, of
which roughly $19 million will be eligible for state reimbursement. Available
state funding will cover about 93 percent of the $19 million, and districts must
pay for the remaining expenses through other local sources.
Oklahoma has taken a unique approach to funding districts in that the state has
defined quality criteria and associated costs for vocational services offered in
comprehensive high schools and Area Technology Centers. Within comprehen-
sive high schools, each district receives $200 per contract month for each voca-
tional teacher. This money is used to support student organizations and
professional development activities. Additionally, the state provides grants rang-
ing from $560 to $8,280, depending upon vocational program area, to compen-
sate for equipment, supplies, and staff development training. Area Technology
Centers in Oklahoma follow the state’s Quality Foundation Formula, which
stipulates the standard of instruction for all students and the cost of meeting
these standards ($118,359 per FTE program in 2000–01). Knowing in advance
the amount of funding for which they will be eligible helps local agencies set the
level of vocational education they wish to offer and balance a mix of services
that match student and community tastes. The downside of cost reimbursement
Financing Vocational Education 20
is that it can expose the state to some level of uncertainty in budgeting for voca-
tional expenditures, since it may be difficult to predict changes in local spend-
ing. States also may require greater oversight of local spending to ensure that
vocational costs are classified appropriately.
Category III: Weighted Funding
Weighted cost factors are used in state funding formulas to concentrate funding
on vocational education. Weights function by mathematically inflating the
number of FTE students participating in a vocational course or program area,
thereby increasing an agency’s resource eligibility. States that use this approach
include Alaska, Florida, Georgia, Illinois, Indiana, Kansas, Louisiana, Ohio,
South Carolina, and Texas (see Matrix 4 in the appendix).
The typical formula involves either add-on weights or vocational student weights. A
state using an add-on weight would multiply its base foundation level of fund-
ing allocated for all students by a fractional number for each student participat-
ing in vocational programs. In contrast, a state employing a vocational student
weight would simply specify different weights for students participating in voca-
tional and non-vocational programs. While the two forms of weighting are sub-
tly different, the effect is the same: youth enrolling in approved vocational
programs qualify for more funding than those in other instructional areas.
Texas provides perhaps the clearest illustration of how vocational weighting for-
mulas can operate. Within Texas, each FTE student in Career and Technology
Education—defined as 1,080 contact hours a year—generates a weight of 1.37.
To calculate the amount of funding local agencies are eligible to receive, total
student contact hours are multiplied by three factors: 0.95, the adjustment for
student absences; $2,537, the adjusted state basic allotment; and 1.37, the voca-
tional student weight. The basic allotment may be adjusted per district to ac-
count for geographic variation in known resource costs and to ensure equity for
small and mid-sized districts. South Carolina employs a similar formula, with
the exception that each FTE student in vocational education generates a weight
of 1.29, compared with 1.25 for other high school students. In Florida, this
weight is 1.211 for vocational students.
Each vocational student in Kansas gets an add-on weight of 0.5. In Ohio the
add-on is 0.6, in Louisiana 0.05, and Illinois 0.3, for specific programs. Indiana
has developed a complex system of add-on weighting that differentially funds
vocational programs based on their cost. For example, relatively more expensive
programs, such as business education laboratory courses, are assigned an add-on
Financing Vocational Education 21
cost of 0.33, compared with 0.19 for agriculture courses that meet one period per
day. The state plans to phase out this approach in the 2002–03 school year, how-
ever, when it will adopt a student performance incentive model.
Comparisons between states are most useful when they focus on the relative
weight a state assigns to vocational students rather than on actual dollar
amounts. State foundation levels vary widely across states, in part because of dif-
ferences in state economic conditions and in part because of higher education
costs in some areas. Furthermore, district eligibilities are often adjusted before
the calculation of vocational funding levels to account for local characteristics,
so comparisons of state foundation floors may be misleading. Matrix 4 compares
state weights for vocational education with state foundation funding levels for
all students. Approximate funding levels per FTE student participating in voca-
tional education and regular high school instruction may be estimated from the
weighted factors provided in the matrix. Assuming that the distribution of voca-
tional students is roughly equal to those who participate in non-vocational pro-
grams, it would appear that, on average, states using weighted formulas allocate
roughly 27 percent more funding for vocational education than other forms of
instruction.
Category IV: Performance Funding
Two states—Indiana and Missouri—condition all or a portion of their annual
funding for vocational education on student participation in specific program
areas and/or performance outcomes. This emphasis on student outcomes can be
traced to a number of factors, including a desire on the part of state legislators to
promote economic development and to make local agencies accountable for stu-
dent results on some level. While only two states presently engage in this fund-
ing approach, a number of others in the national survey indicated an interest in
making the switch (see Matrix 5 in the appendix).
Since 1974, Indiana has funded vocational education using a system of pro-
gram-specific, added-cost weights. Relatively higher-cost programs, such as Trade
and Industry, are given more weight than less capital-intensive programs, such
as Consumer and Homemaker education (0.48 versus 0.14). Beginning in the
2002–03 school year, the state will implement a new, outcome-based system.
Districts will earn $550 for each student who receives a certificate of achieve-
ment in a technical field, $1,000 for each student in programs linked to high-
demand employment or labor market fields, $700 for each student in moderate-
demand fields, $300 for each student in less-than-moderate-demand fields, and
$230 for each student enrolled in apprenticeship programs. Although the for-
Financing Vocational Education 22
mula appears to represent a dramatic change in state funding, the amounts allo-
cated for each outcome, as well as the outcomes themselves, are intended to
keep overall district funding relatively constant.
In contrast, Missouri uses a state instructional salary reimbursement formula
that bases funding to area vocational schools and comprehensive high schools
on a combination of the number of teachers employed and the performance of
each agency. For example, comprehensive high schools are eligible for a funding
base of $300 per contract month for each full-time, certificated vocational edu-
cation teacher, and $35 per class period for part-time teachers. Incentive funding
is then awarded conditioned on the relative success of the agency in placing stu-
dents in jobs and the responsiveness of a particular program to labor market
supply and demand factors. Values for each component are added together to
obtain an Effectiveness Index score that is used to determine agency eligibility
for state funds appropriated for incentive funding. State resources are also avail-
able for the purchase of instructional equipment through state enhancement
grants (covering 75 percent) and annual equipment funding (covering 50 per-
cent) of the cost of new equipment.
While there are often compelling reasons to reward districts for positive out-
comes, ensuring that the competition is fair and that the results reinforce the
provision of high-quality vocational education should be the highest priority.
For example, a state adopting a performance-based formula that rewards pro-
grams in high demand labor market areas or those with high placement rates
should consider earmarking funds for districts seeking to change their program
offerings. Otherwise, districts that do not quality for incentive funding may find
it difficult to ever generate sufficient resources that will allow them to imple-
ment relatively higher-quality instructional programs.
Moreover, unless state incentive systems adjust for district size, basing funding
on student outcomes may unfairly reward larger, more urban districts, even if
they engage in relatively low-quality instruction. Given the greater availability of
jobs in metropolitan areas, as well as the larger number of potential completers,
the location or scale of the enterprise may contribute more to outcomes than the
instruction itself. Economies of scale also may give larger agencies an unfair ad-
vantage in either purchasing equipment or offering different types of vocational
programs. Unless states take steps to audit local agencies, educators may have
some incentive to emphasize completion at the expense of program content.
Finally, the philosophical question is whether funding performance outcomes
will support the central mission of vocational education. Do incentive systems
Financing Vocational Education 23
penalize districts whose vocational programs stress academic and cognitive skills
and whose aim is preparing students for college rather than employment imme-
diately after high school? While the Missouri system awards similar points for
students who find employment or who enroll in continuing education, a higher
weight is applied to students who pursue related postsecondary education than
for those in unrelated education, which could include pursuit of a baccalaureate-
level degree.
A second question is whether performance-incentive systems introduce account-
ability into vocational funding formulas at the expense of choice or equality.
Districts responding to fiscal pressures may have more incentive to expand rela-
tively higher revenue-generating programs at the expense of less lucrative pro-
grams that have greater student interest. At present, it is difficult to assess the
long-term effects of performance-based funding on vocational programs. With
the exception of Missouri, which expanded funding incentives to include all
schools in 1994, there is little evidence to either recommend or reject these sys-
tems.
24
REFLECTIONS ON STATE FUNDING PRACTICES FOR
VOCATIONAL EDUCATION
Although the overall operation and purpose of vocational education is remarka-
bly similar across the country, it is funded quite differently from state to state.
The challenge for states, then, is to clarify what constitutes a reasonable level of
spending for vocational education. To assess the return on investment accu-
rately, states will need to collect and analyze data that quantifies the costs and
benefits of vocational education.
Variability in Local Programs
Given that state supplemental funding for vocational education is often allo-
cated per FTE student, based on the average cost of all vocational programs
within an instructional category, it is possible that some school districts will not
receive sufficient funding to offer certain types of vocational programs. If there is
a minimum cost threshold associated with providing certain types of vocational
instruction, it may be that, on average, the enrollment of smaller districts is not
sufficient to ensure a minimum level of instructional quality. States can address
this problem by including an explicit adjustment factor in the vocational for-
mula, as Texas has done, to ensure that small and mid-sized districts are not pe-
nalized. Or they could follow the lead of Oklahoma and adopt statewide quality
standards and procedures that local agencies must follow to ensure that all agen-
cies provide a comparable level of vocational service.
Whether vocational education is delivered in stand-alone vocational high
schools, comprehensive high schools, or in regional centers that serve a number
of schools also may affect its cost. For example, area vocational schools, by virtue
of their size, teacher expertise, student skill level, or concentration of students,
may be able to accommodate relatively larger numbers of students in classes
than comprehensive high schools, which can result in instructional cost savings.
Conversely, comprehensive high schools may realize substantial savings in
transportation costs, since students may attend all courses on site.
If a state uses a weighted funding formula for vocational education, it may wish
to assess whether the type of vocational program offered affects instructional
Financing Vocational Education 25
costs. Several states, including Idaho, Indiana, Michigan, and Oklahoma, allot
additional funding for more expensive programs. This approach can encourage
local agencies to offer higher-cost vocational services than they might otherwise
support and give states more influence over local instruction. On the other hand
states must guard against the possibility that districts might try to “game” the
system for their own benefit. For instance, the quality or scope of vocational
programs could suffer if school districts attempted to maximize funding by fun-
neling students into relatively high-cost vocational programs.
Funding districts at a flat rate per FTE student without attaching any require-
ments for how the money should be spent may or may not affect vocational
education. Such an approach could enable districts to spend even more on voca-
tional education and/or offer a higher level of academic services. Some districts
could choose to offer a full complement of vocational programs while others of-
fered very few. Is this unfair? The answer depends, in part, on the reasons for the
differences in the relative amounts of vocational education offered among dis-
tricts.
First, the decision may simply be a local choice that reflects student, parental, or
community preferences for vocational versus academic education. The tradition
of local control gives communities substantial discretion over the kind of educa-
tion offered. Other things being equal, districts may choose to pay above-average
salaries for their teachers and offset this added expense with higher class size.
They can buy more expensive textbooks and replace them less frequently. If lo-
cal preference is the cause of the variation, there is no apparent rationale for ac-
commodating these different preferences through the state’s school finance
system.
Second, the differences may reflect district variation in the distribution of K–12
students. Since vocational education is largely a secondary school program, K–12
districts with above-average concentrations of high school students will have
above-average requirements for vocational education. Over time, of course, these
variations in age distributions should even out as the various demographic
bulges work their way through the local school system. However, school district
finances are not structured to allow accumulations of surpluses in years of “low-
cost” demographics to later tap in high-cost years. If student distribution is the
reason for district variation in vocational education spending, there may be jus-
tification for a state to address the issue through its education funding formula.
Perceived need can be a third reason for the differences in district spending. Tra-
ditionally, vocational education has been designed for high school students who
Financing Vocational Education 26
are less likely to pursue a four-year postsecondary education. If relatively higher
doses of vocational education are appropriate for these students, and if it is pos-
sible to identify them accurately and fairly, then states may want to consider
enabling local districts to use this strategy. After all, similar reasons justify addi-
tional compensation for the higher costs associated with serving students who
“need” other types of special education. Since the percentage of students able to
pursue a four-year college degree probably does vary considerably among dis-
tricts, the state’s funding formula could address this issue as it does for district
size or the proportion of special education students.4
There are, however, potential problems with this third explanation that merit
careful consideration. First, the long-standing presumption that vocational edu-
cation is suited mainly for students who do not intend to go to four-year college
is less widely held today. Labeling any educational program as intended primar-
ily for “non-college-bound” students relegates it to second-class status that can
stigmatize both students and teachers. Additionally, such a policy tends to pro-
mote “tracking” and the low expectations that seem to follow students assigned
to the lower path. These practices are at odds with many of the current efforts to
break down the barriers between vocational and academic education and to raise
the knowledge and skill levels expected of all students.
Furthermore, even if vocational education were the preferred mode of instruc-
tion for non-college-bound students, it is not easy to determine ahead of time
(that is, no later than the end of 10th grade) precisely who will not go to four-
year college. The fact is that about 90 percent of all high school students aspire
to attend four-year college. Although as many as 60 percent of high school stu-
dents will not achieve this goal, most parents will not accept such a determina-
tion for their own children so early.
Finally, there is the complicated matter of distinguishing “need” for vocational
education from mere preference. Even if there were consensus that the state fi-
nance system should address differences in need for vocational education among
districts, how would the state distinguish the students who “need” an automo-
tive or cosmetology program to pursue employment after high school from the
students who just want to work on their own cars and do their own hair? There
is nothing wrong with the latter preferences. It is simply that they are just that—
preferences—and, therefore, not a factor that demands the state’s attention.
4It is worth noting that because most states’ basic grant formula already provides additional re-sources for schools with high concentrations of economically disadvantaged students, existing school finance systems may already concentrate funding on districts with larger vocational pro-grams.
Financing Vocational Education 27
In reality, probably all three of these explanations are valid to some degree. That
is, the variation among school districts in the amount of vocational education
they provide reflects local preferences, demographic differences in the ages of
students, and different degrees of “need” for workforce preparation in lieu of
four-year college. Unfortunately, it is not possible to disentangle the relative in-
fluence of any one of these factors. For the present, the most we can know is
that the provision of vocational education does vary among districts and, conse-
quently, some districts will feel more pressure from finance reform than others.
State legislators are the ones who will determine whether state policy should
seek to remedy this particular fiscal impact. One additional piece of information
that may aid the deliberations is an examination of how districts with above-
and below-average levels of vocational education fare under the state funding
system.
Using Data for Policymaking Purposes
To quantify the relative cost of providing vocational education, states may want
to develop a set of annual district reporting procedures to track expenditures for
vocational education programs, services, and other activities. Ideally, these data
would be sufficient to provide state legislators with information about how the
cost of vocational education compares with that of other types of education and
how it varies across districts and vocational program areas. Data also could be
used to compute vocational program cost factors that could be incorporated into
a state’s funding system. In light of the minimal cost differences among teacher
salaries, the data elements most likely to show variation include district expendi-
tures for purchasing and maintaining vocational equipment and supplies across
program areas.
There can be a tradeoff, however, in complicating vocational funding formulas.
Although adding numerous adjustments to the state vocational formulas could
help control for the effects of a variety of factors, unnecessarily complicating the
formula actually could reduce efficiency if locals are unable to collect accurate
data for all elements. Ideally, states will configure their data collection system to
allow for the calculation of the relative cost of vocational education reliably and
defensibly in relation to other types of instruction, and to ensure that district
calculations are sufficient to provide all students with access to an adequate level
of vocational services.
28
SUMMARY
Evidence from national data sets and a review of states’ finance policies suggest
that the cost of providing vocational education can be higher than the cost of
providing other forms of instruction. To supplement vocational funding, states
have developed a number of different mechanisms for allocating state resources,
with the majority employing some form of unit-based or weighted per-pupil
formula. Since states have adopted a variety of approaches to fund vocational
programs, not all of which are grounded on actual expenditures, it is difficult to
calculate the true cost associated with vocational services. The national survey
on state funding practices indicates that the relative cost of vocational education
may be from 20 percent to 40 percent greater than that of academic instruction,
and that this cost varies by program area and content level.
Existing state funding systems often operate on historical precedent, with fund-
ing strategies and amounts premised on preceding year allocations. In practice,
annual vocational budgeting in most states is a data-driven exercise: local educa-
tors routinely submit summary counts of student participants and/or district cost
data to state staffers, who aggregate data, often into complex spreadsheets, to
produce district allocations that remain nearly constant over time.
There are often good reasons for maintaining stable district allocations. Since
teacher salaries are a majority of local costs for vocational education, large, un-
anticipated changes in annual funding can jeopardize jobs and, by extension,
the quality and type of vocational offerings. Other fixed costs, which include
instructional supplies and building and equipment maintenance, also require
relatively stable funding streams. Survey results suggest that states that have in-
stituted reforms have generally done so only when coerced by legal mandate or
legislative directive.
Before proceeding to institutionalize changes, it may be prudent for representa-
tives of legislative and executive branches of state government to meet with state
education administrators and agree upon the goals for vocational education.
Specifically, what are the purposes of vocational education in a state? What types
of vocational programs and instructional settings should be encouraged and to
what extent? Is a state willing to fund traditional vocational programs tied to
fields that may be low paying and relatively expensive to equip, or is the desire
Financing Vocational Education 29
to redirect instruction into other fields that may require less equipment and of-
fer graduates higher-paying jobs? How much flexibility should local agencies
have in allocating resources across programs? Is there a threshold level of fund-
ing that local agencies must exceed if they are to offer vocational programs, and
if so, what is it?
States that have undertaken systematic reform of vocational funding have gener-
ally approached the exercise with considerable care. To ensure that resource
shifts do not overly burden local agencies, states adopting new funding formulas
have often allocated additional educational funding to offset any unanticipated
consequences of the new formula or included funding “circuit-breakers,” which
cap annual changes in district funding to protect local agencies from large re-
source deviations. The need for consistency suggests that states that are contem-
plating such changes proceed at an equally careful, measured pace to ensure they
do not unduly penalize local agencies with legislative mandates outside their
control.
30
REFERENCES
Education Commission of the States. (1999). Determining the Cost of a Basic or
Core Education. Denver, CO: Author.
Henke, R.R., Choy, S.P., Chen, X., Geis, S., and Alt, M.N. (1997). America’s Teach-
ers: Profile of a Profession: 1993–94 (NCES 97–460). U.S. Department of Educa-
tion, National Center for Education Statistics. Washington, DC: U.S.
Government Printing Office.
Hurst, D., and Hudson, L. (2000). Changes in High School Coursetaking in a Larger
Perspective (NCES 2001–026). U.S. Department of Education. Washington,
DC: National Center for Education Statistics.
31
APPENDIX—STATE FUNDING MATRICES
State
Total Funds Appropriated for
Vocational Education
(FY 2000�01 unless
otherwise noted)
Funding per FTE Vocational and Academic
Student
Eligible Vocational Schools
Financing VocEd
Arizona$11,085,600
(FY 1998)
Comprehensive High
Schools with State
Approved Career-Tech/
Vocational Programs
$9,251,300 (90% allocated student count
component, 10% placement component)
was available for the FY 1998. Each
vocational program is assigned a weight
factor. This amounted to an allotment of
$252.04 per student for a program with a
weight of 1.0. An additional $1,834,300
was available to the state for
administration costs.
California $337,000,000 Voc: $1,369*Regional Occupation
Centers/Programs
Funding is distributed to 82 Regional
Occupation Centers/Programs based on
ADA with adjustments for center size and
revenue limits. ROCPs are primarily state-
funded organizations that work in
collaboration with schools, districts, and
support service agencies (e.g.,
Employment Development Department,
Job Training Partnership Act, etc.) to
provide technical education to high
school and adult students.
Connecticut $115,000,00017 Vocational Technical
High Schools
75% of funding is allocated based on
student enrollment and number of
programs, and 25% based on square
footage compared to average among 17
Vocational Technical Schools.
Hawaii
$20,000 per
secondary school +
$2,000,000
allocated by FTE
counts
Comprehensive High
Schools with State
Approved Career-Tech/
Vocational Programs
Each secondary school receives a base
amount of $20,000 regardless of
enrollment. The remaining $2,000,000 is
allocated based on grades 9�12 FTE
vocational student enrollment.
Maryland $3,900,000
Comprehensive High
Schools with State
Approved Career-Tech/
Vocational Programs
Allocated based on FTE vocational
enrollment at district level, and spending
is locally controlled.
�������������� ���������������� ������������������
Financing Vocational Education 32
State
Total Funds Appropriated for
Vocational Education
(FY 2000�01 unless
otherwise noted)
Funding per FTE Vocational and Academic
Student
Eligible Vocational Schools
Financing VocEd
Massachusets Not Available
Voc: $8,549
Non-voc:
$5,449
Comprehensive High
Schools with State
Approved Career-Tech/
Vocational Programs
Complex state formula considering at
least 19 factors (salaries, benefits,
professional development, equipment,
supplies) are calculated for 12 different
student categories, of which vocational
education is one. Funding amounts are
multiplied by a wage adjustment factor
calculated for each district.
Minnesota $2,225,000
Comprehensive High
Schools with State
Approved Career-Tech/
Vocational Programs
Per pupil aid is equivalent to the lesser of:
(1) $73 multiplied by the number of
Career Tech students in grades 10�12, or
(2) 25% of instructional expenditures for
salaries of vocational teachers, necessary
instructor travel, curriculum development,
supplies, and non-school district-
contracted services. However, districts are
guaranteed the lesser of 95% of the aid
they received the previous year or 40% of
the expenditures of the current year.
Then, depending on which formula yields
the greater product, school districts are
entitled to the greater amount.
Montana $715,000
Comprehensive High
Schools with State
Approved Career-Tech/
Vocational Programs
Funding is based on a per pupil
allocation: the Average Number
Belonging (ANB) for secondary vocational
programs, and each program must report
its ANB separately. Each program has a
different factor, determined by the
superintendent of public instruction,
which is then multiplied by the state-aid
available per ANB enrolled in the
program. Vocational education students
can be counted more than once across
vocational programs.
�������������� ���������������� ������������������������ ��
Financing Vocational Education 33
State
Total Funds Appropriated for
Vocational Education
(FY 2000�01 unless
otherwise noted)
Funding per FTE Vocational and Academic
Student
Eligible Vocational Schools
Financing VocEd
New York $457,600,000 BOCES
Funding is allocated to area vocational
schools called BOCES (Board of
Cooperative Educational Services).
Services aid in the amount of $376.4
million allocated based on the greater
amount between (1) a millage ratio based
on district tax rate, or (2) an aid ratio
based on the number of students
participating in BOCES. Plus $49.9 million
in additional funding for administration
and facilities.
North Carolina $15,274,205Voc: (after LEA
base) $25.95
Comprehensive High
Schools and Area Technical
Schools
Each LEA is eligible for a base amount of
$10,000. Remaining funds are distributed
based on allotted ADM in grades 7�12.
The per pupil amount is not a set value; it
is determined by the balance of
remaining funds.
Rhode Island Voc: $500 Career Tech CentersAwarded for each student enrolled in a
local career and technical center.
Utah $38,881,153
Comprehensive High
Schools with State
Approved Career-Tech/
Vocational Programs &
ATCs/ATCSRs
All districts receive $2,006 per FTE
student. In addition, districts are eligible
for additional funding for vocational
education programs. These funds are
allocated based on performance
measures, skill certification performance,
participation in leadership organizations,
and participation in summer agricultural
programs. Districts must allocate these
funds directly to the program that
generated the extra funding. The state�s
five Applied Technology Centers (ATCs)
and three Applied Technology Center
Service Regions (ATCSRs) are funded as
separate line items in the budget.
�������������� ���������������� ������������������������ ��
Financing Vocational Education 34
State
Total Funds Appropriated for
Vocational Education
(FY 2000�01 unless
otherwise noted)
Funding per FTE Vocational and Academic
Student
Eligible Vocational Schools
Financing VocEd
Vermont$2,254,628
(FY 1998)Regional Technical Center
Each technical center shall receive a grant
per pupil. This grant is calculated by
taking the total funds available (in FY
1998 that was $2,254,628), and dividing
that by the total number of FTE students
enrolled in all regional technical centers.
There are also reimbursements available
for exploratory course costs,
transportation ($1.50 per mile traveled),
equipment replacement, salary assistance,
overhead costs, and incentive grants.
Washington$23,306,498
(FY 1999�2000)
Voc: $4,316
Non-voc:
$3,653
Comprehensive High
Schools with State
Approved Career-Tech/
Vocational Programs
A staffing enhancement is awarded if
districts can demonstrate a ratio of 1:19.5
or less, and spend no more than 10% of
vocational expenditures on indirect costs
(e.g., repayment of debts, Principal�s
office costs, guidance and counseling,
health services, pupil management and
safety, utilities, facilities management).
The average vocational enhancement in
1997�98 was $663.40, where as the
average expenditures per student above
and beyond basic education was $758.
West Virginia $2,146,000 LEA
Funding is allocated to LEAs based on a
FTE membership calculation. This is in
addition to the general $6,806.27 state
appropriation per student.
NOTE: Funding amounts are based on information supplied by state representatives and/or review of state legislative
documents. Dollar amounts may not include all vocational expenditures within a state, and as such, should be viewed
as estimates of overall state spending.
*Based on FY 2000�01 data and 1997�98 ROCP enrollment data
�������������� ���������������� ������������������������ ��
Financing Vocational Education 35
StateTeacher: Student Ratio
for Vocational ADM Counts
Financing VocEd
Alabama 1:18
Foundation program units are based on teacher units, with one instructor unit
funded per 18 pupils in grades 9�12. Grade divisors for vocational students
include an adjustment to reflect increased programmatic costs. The adjustment for
vocational education reflects an added 16.5% to the overall ADM, and then
vocational pupils ADM is weighted 2.0 in grades 9�12; meaning that vocational
enrollments are inflated (voc ADM x 1.165 x 2.0) prior to dividing by the
foundation instructional unit (18). Principals in Area Vocational Centers shall be
funded at an additional .33 weight for high schools and Area Vocational Schools
alike. Units are then converted to dollar amounts using a state salary matrix.
Delaware1:20 plus (27,000 pupil
minutes/week x 0.5)
Vocational education is funded in three ways. First, there is funding for material
which is determined by the vocational program (80% of which must be
reallocated locally to vocational education). Other funding is provided to pay for
teacher salaries, and to equalize teachers� salaries. Both of these adjustments are
calculated in the same way. The 1:20 instructional unit (the same for non-
vocational pupils) is inflated. Additional instructional units are calculated per
27,000 pupil minutes/week (or major fraction of), multiplied by 0.5, and then
added to the non-vocational equivalent instructional units. For example, for 100
vocational students, a base of 5 instructional units are calculated. Then, an
additional 2 units (= 54,000 pupil minutes/week) are multiplied by 0.5 and added
to the original 5 units, totaling 6 instructional units.
Kentucky Actual Teacher Count
Funds allocated on a per teacher basis: 1�5 teachers=$21,000 per teacher, 6�9
teachers=$16,000 per teacher, and 10 or more=$10,000 per teacher. These funds
are not necessarily for teachers� salaries.
Mississippi 1.5:27
The state allocates funds based on average daily attendance per teacher unit. A
teacher unit is equal to 1 teacher per 27 students ADA. An additional 1/2 teacher
unit is added for each approved vocational program. Districts are allotted $15,000
plus $50 for each teacher unit in excess of 50 units with a cap of $25,000.
Tennessee 1:20
Using average daily attendance, the state funds salaries for one non-vocational
teacher per 26 non-vocational, and one vocational teacher per 20 vocational
students. Also, student supplies and equipment are funded differently. Supplies
and equipment are funded at $27 and $20 per non-vocational student, and $101
and $62 per vocational student, respectively. School districts have local control
over how the funds are spent.
Virginia 1:15 to 1:21
Funding teacher units: each program has to establish teacher/student ratio
ranging from 1:15 to 1:21. Teacher salaries are funded depending on ADM, and
adjustments are made for cost of living and benefits (FY 2002 base $37,362/yr +
15% benefits + 10% added cost of living). Virginia also has a cost reimbursement
element to their funding where school districts can be reimbursed for the cost of
equipment, regional program staffing, and other indirect costs. Incentive-based
program funds are also awarded targeting mostly at-risk youth.
�������������� �������������������� �������������
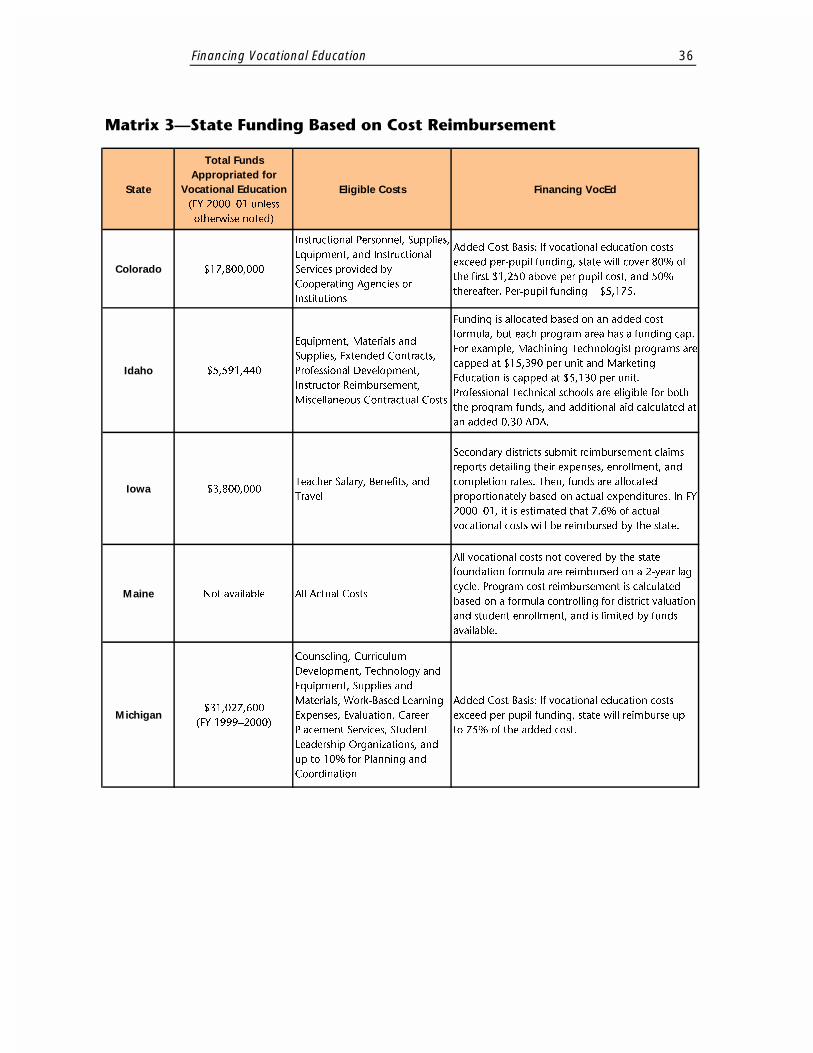
Financing Vocational Education 36
State
Total Funds Appropriated for
Vocational Education (FY 2000�01 unless
otherwise noted)
Eligible Costs Financing VocEd
Colorado $17,800,000
Instructional Personnel, Supplies,
Equipment, and Instructional
Services provided by
Cooperating Agencies or
Institutions
Added Cost Basis: If vocational education costs
exceed per-pupil funding, state will cover 80% of
the first $1,250 above per pupil cost, and 50%
thereafter. Per-pupil funding = $5,175.
Idaho $5,591,440
Equipment, Materials and
Supplies, Extended Contracts,
Professional Development,
Instructor Reimbursement,
Miscellaneous Contractual Costs
Funding is allocated based on an added cost
formula, but each program area has a funding cap.
For example, Machining Technologist programs are
capped at $15,390 per unit and Marketing
Education is capped at $5,130 per unit.
Professional Technical schools are eligible for both
the program funds, and additional aid calculated at
an added 0.30 ADA.
Iowa $3,800,000Teacher Salary, Benefits, and
Travel
Secondary districts submit reimbursement claims
reports detailing their expenses, enrollment, and
completion rates. Then, funds are allocated
proportionately based on actual expenditures. In FY
2000�01, it is estimated that 7.6% of actual
vocational costs will be reimbursed by the state.
Maine Not available All Actual Costs
All vocational costs not covered by the state
foundation formula are reimbursed on a 2-year lag
cycle. Program cost reimbursement is calculated
based on a formula controlling for district valuation
and student enrollment, and is limited by funds
available.
Michigan$31,027,600
(FY 1999�2000)
Counseling, Curriculum
Development, Technology and
Equipment, Supplies and
Materials, Work-Based Learning
Expenses, Evaluation, Career
Placement Services, Student
Leadership Organizations, and
up to 10% for Planning and
Coordination
Added Cost Basis: If vocational education costs
exceed per pupil funding, state will reimburse up
to 75% of the added cost.
�������������� ������������������������� �������
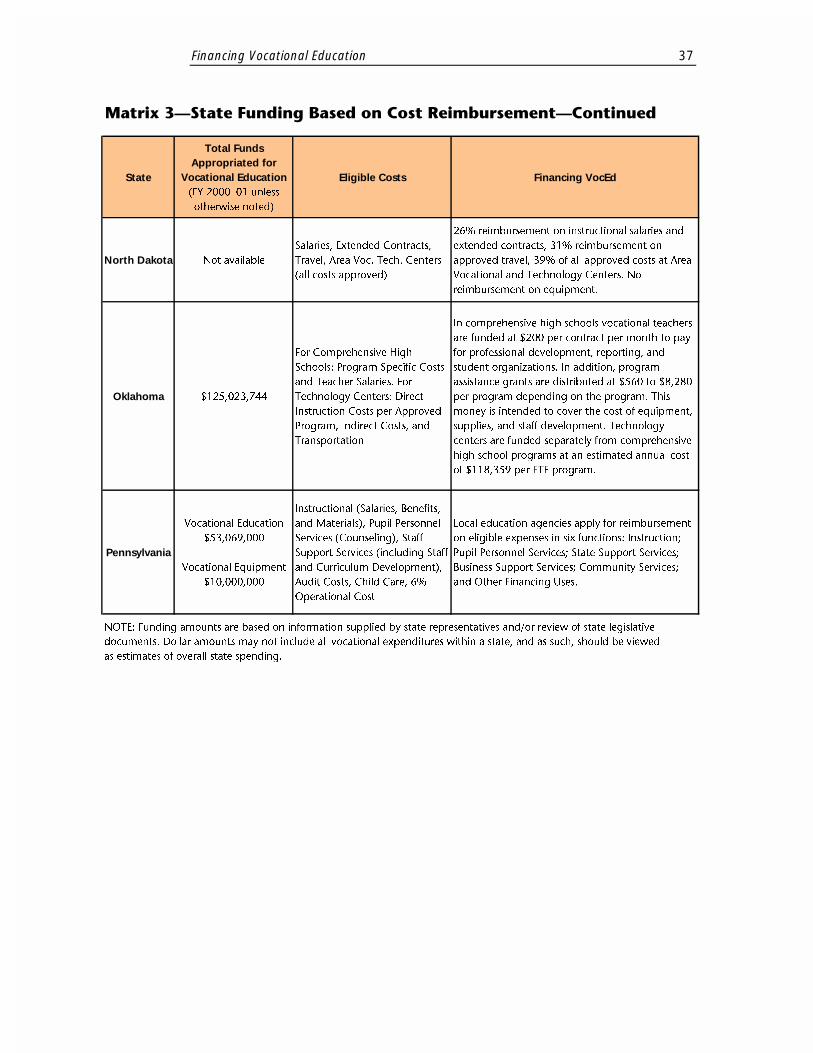
Financing Vocational Education 37
State
Total Funds Appropriated for
Vocational Education (FY 2000�01 unless
otherwise noted)
Eligible Costs Financing VocEd
North Dakota Not available
Salaries, Extended Contracts,
Travel, Area Voc. Tech. Centers
(all costs approved)
26% reimbursement on instructional salaries and
extended contracts, 31% reimbursement on
approved travel, 39% of all approved costs at Area
Vocational and Technology Centers. No
reimbursement on equipment.
Oklahoma $125,023,744
For Comprehensive High
Schools: Program Specific Costs
and Teacher Salaries. For
Technology Centers: Direct
Instruction Costs per Approved
Program, Indirect Costs, and
Transportation
In comprehensive high schools vocational teachers
are funded at $200 per contract per month to pay
for professional development, reporting, and
student organizations. In addition, program
assistance grants are distributed at $560 to $8,280
per program depending on the program. This
money is intended to cover the cost of equipment,
supplies, and staff development. Technology
centers are funded separately from comprehensive
high school programs at an estimated annual cost
of $118,359 per FTE program.
Pennsylvania
Vocational Education
$53,069,000
Vocational Equipment
$10,000,000
Instructional (Salaries, Benefits,
and Materials), Pupil Personnel
Services (Counseling), Staff
Support Services (including Staff
and Curriculum Development),
Audit Costs, Child Care, 6%
Operational Cost
Local education agencies apply for reimbursement
on eligible expenses in six functions: Instruction;
Pupil Personnel Services; State Support Services;
Business Support Services; Community Services;
and Other Financing Uses.
NOTE: Funding amounts are based on information supplied by state representatives and/or review of state legislative
documents. Dollar amounts may not include all vocational expenditures within a state, and as such, should be viewed
as estimates of overall state spending.
�������������� ������������������������� ������������� ��
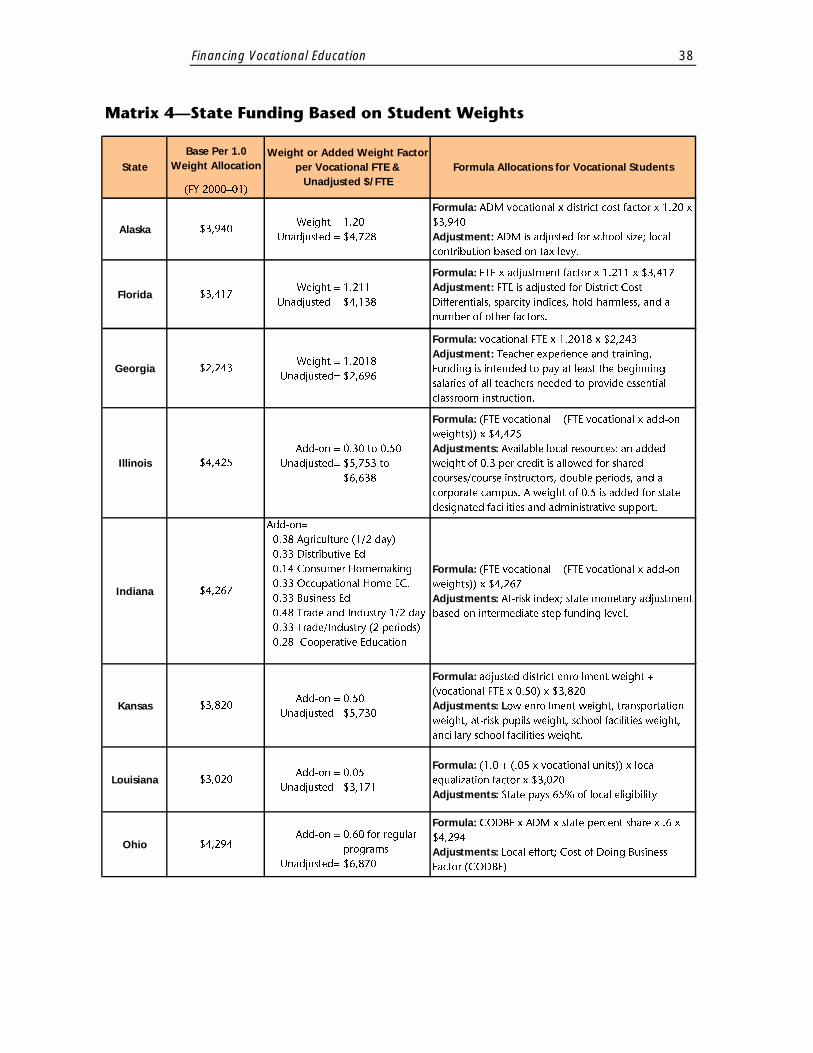
Financing Vocational Education 38
AlaskaWeight =
Unadjusted =
1.20
$4,728
Formula: ADM vocational x district cost factor x 1.20 x
$3,940
Adjustment: ADM is adjusted for school size; local
contribution based on tax levy.
FloridaWeight =
Unadjusted =
1.211
$4,138
Formula: FTE x adjustment factor x 1.211 x $3,417
Adjustment: FTE is adjusted for District Cost
Differentials, sparcity indices, hold harmless, and a
number of other factors.
GeorgiaWeight =
Unadjusted=
1.2018
$2,696
Formula: vocational FTE x 1.2018 x $2,243
Adjustment: Teacher experience and training.
Funding is intended to pay at least the beginning
salaries of all teachers needed to provide essential
classroom instruction.
IllinoisAdd-on =
Unadjusted=
0.30 to 0.50
$5,753 to
$6,638
Formula: (FTE vocational + (FTE vocational x add-on
weights)) x $4,425
Adjustments: Available local resources: an added
weight of 0.3 per credit is allowed for shared
courses/course instructors, double periods, and a
corporate campus. A weight of 0.5 is added for state
designated facilities and administrative support.
Indiana
Formula: (FTE vocational + (FTE vocational x add-on
weights)) x $4,267
Adjustments: At-risk index; state monetary adjustment
based on intermediate step funding level.
KansasAdd-on =
Unadjusted=
0.50
$5,730
Formula: adjusted district enrollment weight +
(vocational FTE x 0.50) x $3,820
Adjustments: Low enrollment weight, transportation
weight, at-risk pupils weight, school facilities weight,
ancillary school facilities weight.
LouisianaAdd-on =
Unadjusted=
0.05
$3,171
Formula: (1.0 + (.05 x vocational units)) x local
equalization factor x $3,020
Adjustments: State pays 65% of local eligibility
OhioAdd-on =
Unadjusted=
0.60 for regular
programs
$6,870
Formula: CODBF x ADM x state percent share x .6 x
$4,294
Adjustments: Local effort; Cost of Doing Business
Factor (CODBF)
Add-on=
0.38 Agriculture (1/2 day)
0.33 Distributive Ed
0.14 Consumer Homemaking
0.33 Occupational Home EC.
0.33 Business Ed
0.48 Trade and Industry 1/2 day
0.33 Trade/Industry (2 periods)
0.28 Cooperative Education
$3,820
$3,020
$4,294
$4,425
$4,267
Formula Allocations for Vocational Students
(FY 2000�01)
$3,940
$2,243
$3,417
������� ������ ���������������� �����!���"��
StateBase Per 1.0
Weight AllocationWeight or Added Weight Factor
per Vocational FTE & Unadjusted $/FTE
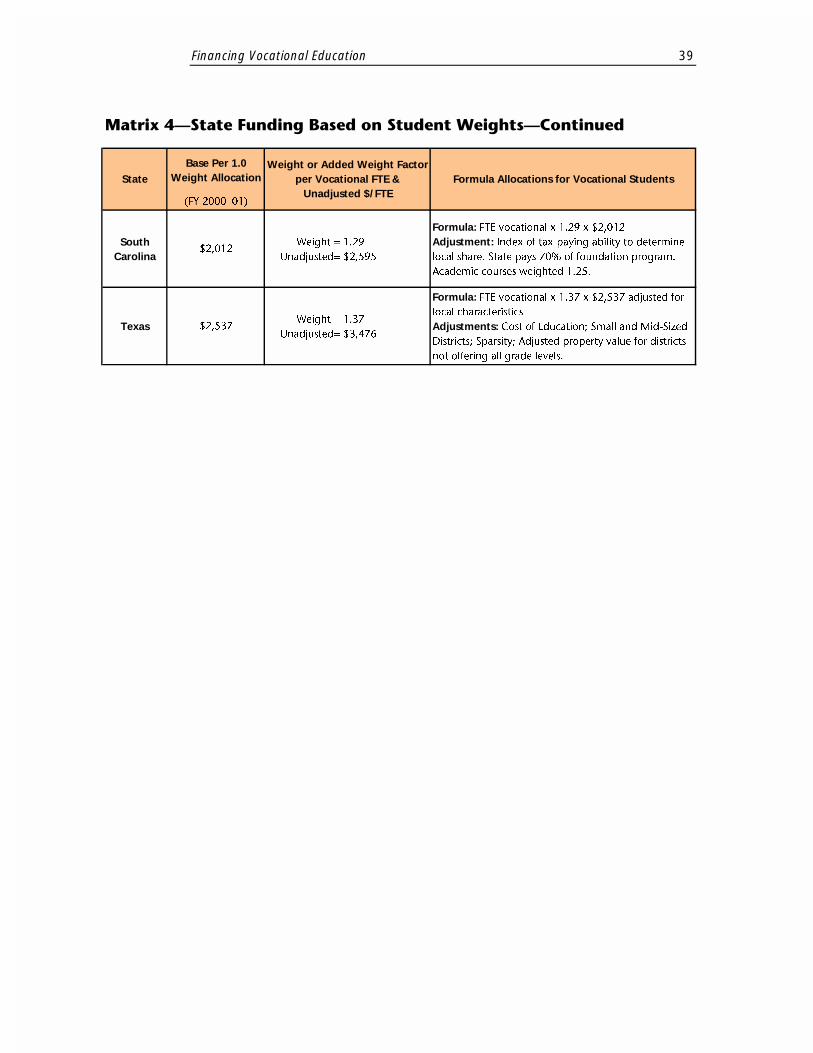
Financing Vocational Education 39
South Carolina
Weight =
Unadjusted=
1.29
$2,595
Formula: FTE vocational x 1.29 x $2,012
Adjustment: Index of tax-paying ability to determine
local share. State pays 70% of foundation program.
Academic courses weighted 1.25.
TexasWeight =
Unadjusted=
1.37
$3,476
Formula: FTE vocational x 1.37 x $2,537 adjusted for
local characteristics
Adjustments: Cost of Education; Small and Mid-Sized
Districts; Sparsity; Adjusted property value for districts
not offering all grade levels.
$2,012
$2,537
������� ������ ���������������� �����!���"�������� ��
StateBase Per 1.0
Weight AllocationWeight or Added Weight Factor
per Vocational FTE & Unadjusted $/FTE
Formula Allocations for Vocational Students
(FY 2000�01)
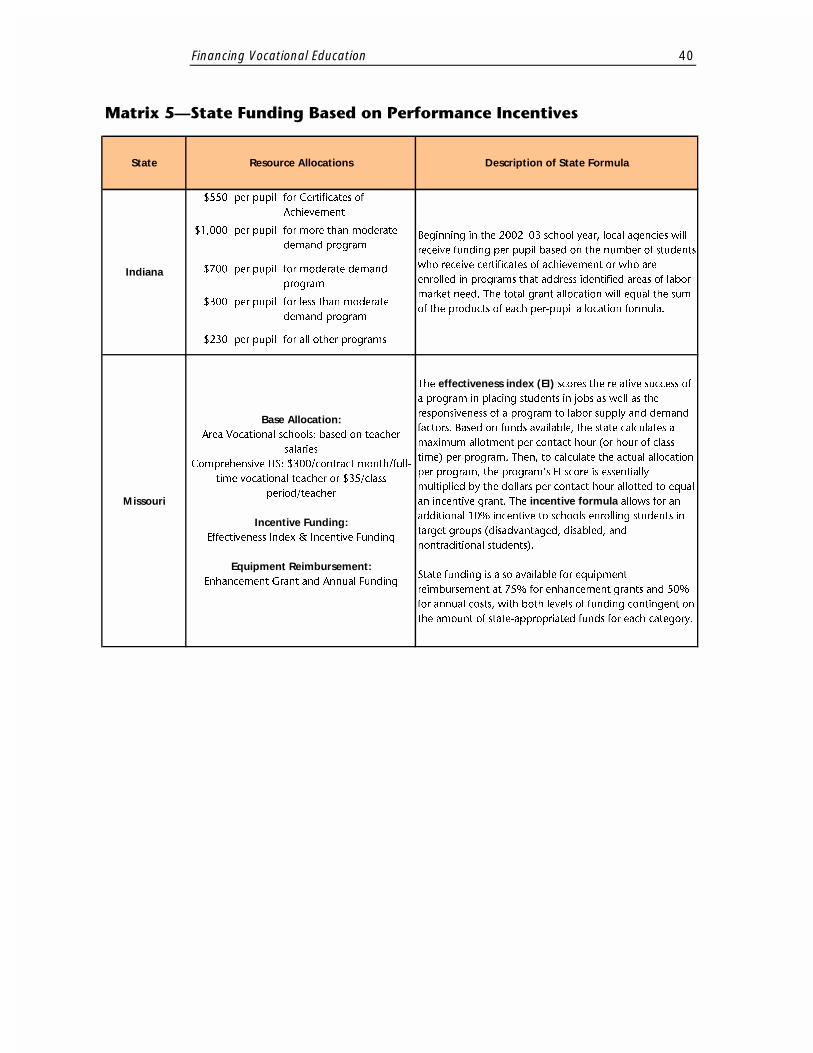
Financing Vocational Education 40
�������#������ ������������������$���������������%��
$550 per pupil for Certificates of
Achievement
$1,000 per pupil for more than moderate
demand program
$700 per pupil for moderate demand
program
$300 per pupil for less than moderate
demand program
$230 per pupil for all other programs
Missouri
The effectiveness index (EI) scores the relative success ofa program in placing students in jobs as well as the
responsiveness of a program to labor supply and demand
factors. Based on funds available, the state calculates a
maximum allotment per contact hour (or hour of class
time) per program. Then, to calculate the actual allocation
per program, the program�s EI score is essentially
multiplied by the dollars per contact hour allotted to equal
an incentive grant. The incentive formula allows for an
additional 10% incentive to schools enrolling students in
target groups (disadvantaged, disabled, and
nontraditional students).
State funding is also available for equipment
reimbursement at 75% for enhancement grants and 50%
for annual costs, with both levels of funding contingent on
the amount of state-appropriated funds for each category.
Beginning in the 2002�03 school year, local agencies will
receive funding per pupil based on the number of students
who receive certificates of achievement or who are
enrolled in programs that address identified areas of labor
market need. The total grant allocation will equal the sum
of the products of each per-pupil allocation formula.
State Description of State FormulaResource Allocations
Base Allocation:Area Vocational schools: based on teacher
salaries
Comprehensive HS: $300/contract month/full-
time vocational teacher or $35/class
period/teacher
Incentive Funding:Effectiveness Index & Incentive Funding
Equipment Reimbursement:Enhancement Grant and Annual Funding
Indiana
Recommended