Embed Size (px)
Citation preview
ISSN 1680-8851
SERIES
200MACROECONOMICS OF DEVELOPMENT
Financing of education and technical and
vocational education and
training (TVET) in Latin America and
the Caribbean
Michael Hanni
ECLACPublications
Thank you for your interest in
this ECLAC publication
Please register if you would like to receive information on our editorial
products and activities. When you register, you may specify your particular
areas of interest and you will gain access to our products in other formats.
www.cepal.org/en/publications
Publicaciones www.cepal.org/apps
Financing of education
and technical and vocational
education and training (TVET) in
Latin America and the Caribbean
Michael Hanni
200
This document has been prepared by Michael Hanni, Economic Affairs Officer in the Economic Development Division of the Economic Commission for Latin America and the Caribbean (ECLAC), in the framework of the cooperation programme between ECLAC and the Government of Norway and the project entitled “Vocational education and training for equality in Latin America and the Caribbean”.
The views expressed in this document, which has been reproduced without formal editing, are those of the author and do not necessarily reflect the views of the Organization.
United Nations publication ISSN: 1680-8851 (electronic version) ISSN: 1680-8843 (print version) LC/TS.2019/29/Rev.1 Distribution: L Copyright © United Nations, 2019 All rights reserved Printed at United Nations, Santiago S.19-00376
This publication should be cited as: M. Hanni, “Financing of education and technical and vocational education and training (TVET) in Latin America and the Caribbean”, Macroeconomics of Development series , No. 200 (LC/TS.2019/29/Rev.1), Santiago, Economic Commission for Latin America and the Caribbean (ECLAC), 2019.
Applications for authorization to reproduce this work in whole or in part should be sent to the Economic Commission for Latin America and the Caribbean (ECLAC), Publications and Web Services Division, [email protected]. Member States and their governmental institutions may reproduce this work without prior authorization, but are requested to mention the source and to inform ECLAC of such reproduction.
3 ECLAC - Macroeconomics of Development Series No. 200 Financing of education and technical and vocational...
Contents
Abstract .............................................................................................................................................................................. 7
Introduction ...................................................................................................................................................................... 9
I. Technical and vocational education and training (TVET): definitions and rationales
for investment .................................................................................................................................................... 11
A. What is TVET? ............................................................................................................................................ 11
B. Rationales for investment in TVET ......................................................................................................12
II. Theoretical framework for TVET finance ...................................................................................................15
A. Models for the provision of education and TVET services .........................................................15
B. Justifications for public sector intervention in education
and TVET financing in a mixed market .............................................................................................16
C. Education and TVET financing modalities .......................................................................................18
III. Education and TVET financing in Latin America and the Caribbean .............................................. 25
A. Scope of analysis ..................................................................................................................................... 25
B. Public sector ............................................................................................................................................. 26
1. Resource mobilization ................................................................................................................. 26
2. Education initial financing ........................................................................................................... 37
3. TVET initial financing .................................................................................................................... 43
C. Private sector ............................................................................................................................................ 45
1. Households ...................................................................................................................................... 45
2. Firms ................................................................................................................................................... 52
D. Rest of the world ..................................................................................................................................... 56
1. Bilateral ODA ................................................................................................................................... 56
4 ECLAC - Macroeconomics of Development Series No. 200 Financing of education and technical and vocational...
2. ODA by multilateral institutions ........................................................................................................... 61
3. Private sector financing ........................................................................................................................... 63
IV. Conclusions and policy issues ...................................................................................................................... 65
Bibliography ................................................................................................................................................................... 69
Macroeconomics of Development Series: issues published .......................................................................... 72
Tables
Table 1 Latin America (selected countries): specific tax instruments
to finance education ......................................................................................................................31
Table 2 Selected countries: Formal TVET financing measures ....................................................... 32
Table 3 Latin America and the Caribbean: TVET related payroll taxes ....................................... 33
Table 4 Latin America (18 countries): Education expenditure targets
established in national legislation, latest year ..................................................................... 39
Table 5 Latin America and the Caribbean (selected countries): Preferential
treatment of educational expenses for the value-added tax (VAT) ............................. 47
Table 6 Latin America and the Caribbean (11 countries): personal income tax
benefits for educational expenses ........................................................................................... 48
Table 7 Selected countries: firms’ sources of financing for training ............................................ 53
Table 8 Latin America (5 countries): tax benefits for education
and training expenditures by firms .......................................................................................... 54
Figures
Figure 1 Latin America and the Caribbean: total tax revenues, 2017 ............................................ 27
Figure 2 Latin America and the Caribbean and OECD: structure of tax
revenues, 2017 ................................................................................................................................ 28
Figure 3 Latin America and the Caribbean and OECD: subnational tax
revenues, 2016 ................................................................................................................................ 29
Figure 4 Latin America and the Caribbean and OECD: subnational tax
revenues from immovable property, 2016 ............................................................................ 30
Figure 5 Latin America and the Caribbean (selected countries): TVET related
payroll tax revenues, 2017 .......................................................................................................... 34
Figure 6 Selected national training institutions: revenues by source,
2016 or latest ................................................................................................................................... 35
Figure 7 World Bank: IBRD and IDA new commitments for education
in Latin America and the Caribbean, FY1990-FY2015 ........................................................ 36
Figure 8 Latin America and the Caribbean: public expenditure on education, 2016 ............... 38
Figure 9 Latin America and the Caribbean: share of public expenditure
on education in total public expenditure, 2016 ................................................................... 38
Figure 10 Latin America and the Caribbean: initial government spending
per student (primary and secondary), 2016 or latest ......................................................... 40
Figure 11 Latin America and the Caribbean: initial government spending
per student at the secondary level and GDP per-capita, 2016 or latest ..................... 41
5 ECLAC - Macroeconomics of Development Series No. 200 Financing of education and technical and vocational...
Figure 12 Latin America and the Caribbean: initial government spending
per student as a percentage of GDP per-capita, 2016 or latest ................................... 42
Figure 13 TVET expenditures at the secondary level, 2017 or latest ................................................ 43
Figure 14 Secondary level TVET expenditures relative to all secondary
expenditures and to all education expenditures, 2017 or latest ................................... 44
Figure 15 TVET initial financing by national training institutions, 2017 or latest .......................... 44
Figure 16 Selected countries: initial funding of education by sector, 2015 ................................... 45
Figure 17 Selected countries: initial funding of education as a share
of GDP per-capita, by households, 2015 ............................................................................... 46
Figure 18 Selected countries: size of tax expenditures associated
with educational expenditures for the valued-added tax (VAT)
and the personal income tax (PIT), latest year .................................................................... 50
Figure 19 Percentage of firms offering formal training and firms identifying
an inadequately educated workforce as a major constraint,
2017 or latest ................................................................................................................................... 52
Figure 20 Latin America and the Caribbean: percentage of firms offering
formal training, by country, 2017 or latest ............................................................................ 53
Figure 21 Latin America and the Caribbean: bilateral official development
aid (commitments) flows for education and secondary vocational
education, 2008-2017 ................................................................................................................... 57
Figure 22 Selected countries: bilateral donors providing official development
aid (commitments) for education to Latin America and the Caribbean,
2008-2017 ......................................................................................................................................... 58
Figure 23 Latin America and the Caribbean (selected countries): principal
recipients of bilateral official development aid (commitments)
for education, 2008-2017 ............................................................................................................ 58
Figure 24 Selected countries: top 20 bilateral donors providing official development
aid (commitments) for secondary vocational education
in Latin America and the Caribbean, 2008-2017 ................................................................. 59
Figure 25 Latin America and the Caribbean: top 20 bilateral recipients of official
development aid (commitments) for secondary vocational
education, 2008-2017 ................................................................................................................... 60
Figure 26 Selected multilateral organizations: ODA commitments for education
in Latin America and the Caribbean, 2008-2017.................................................................61
Figure 27 ODA commitments by multilateral organizations for secondary vocational
education in Latin America and the Caribbean, 2008-2017 ............................................ 62
Figure 28 Selected philanthropic organizations: cumulative commitments for education
in Latin America and the Caribbean, by educational level,
2013-2017 ......................................................................................................................................... 63
6 ECLAC - Macroeconomics of Development Series No. 200 Financing of education and technical and vocational...
Boxes
Box 1 Social impact bonds and human capital performance bonds ....................................... 20
Box 2 Enterprise training funds ..............................................................................................................21
Box 3 The German dual system model .............................................................................................. 22
Box 4 Transformation of the Tertiary Technical and Technological Institutes
Project in Ecuador ......................................................................................................................... 37
Box 5 Implicit household educational expenses based on VAT data .......................................51
Box 6 Recent secondary vocational education projects in Latin America
and the Caribbean ........................................................................................................................ 60
Box 7 Skills Development and Employability Project in Guyana ............................................... 62
Diagramas
Diagram 1 TVET modalities as a life-long learning continuum ............................................................12
Diagram 2 Schematic of education and TVET funding and expenditure ..........................................19
Diagram 3 Stylized representation of resource mobilization and initial
financing by actor .......................................................................................................................... 20
7 ECLAC - Macroeconomics of Development Series No. 200 Financing of education and technical and vocational...
Abstract
A key pre-requisite for achieving the Sustainable Development Goals is accessible and inclusive quality
education (SDG 4). Research has shown that investments in human capital —by the public sector, by
firms and by households— have a significant impact on economic performance as well as individual and
social wellbeing.
The role of technical and vocation education and training (TVET) in this process is key, especially
as the global and regional economy undergoes significant changes. The world of work is evolving
rapidly, as productive structures adapt to the shifts induced by the emergence of new technologies and
new business models. Skills in this environment tend to depreciate quickly and therefore must be
continually updated.
TVET provides opportunities to transition students into this new world of work as well as
keeping existing workers employed. TVET programmes targeted at women, youth, senior citizens
and other vulnerable populations also provides governments with significant leverage to reduce
inequality and poverty.
To realize these benefits, however, will require a substantial commitment by governments,
households and firms to finance TVET. Unfortunately, this task is made more difficult by the exceptionally
high level of fragmentation that characterizes TVET, both inside and outside the formal education
system. The potential for market failures that lead to a suboptimal level of investment is therefore
substantial. This situation argues for the State to play a key role in providing the necessary governance
of the market as well as in mobilizing the financing required to overcome these market failures.
The focus of this paper is therefore to review initial financing for education and TVET in Latin
America and the Caribbean, which is defined as those resources that derive directly from
governments, households and firms, with the aim to support the formulation of a TVET financing
framework for the region.

9 ECLAC - Macroeconomics of Development Series No. 200 Financing of education and technical and vocational...
Introduction
The 2030 Agenda for Sustainable Development offers countries in the region the opportunity to
substantially remake their development policies, in line with the Sustainable Development Goals.
New public policies are needed not only to address existing socio-economic gaps, but to place
countries on a sustainable and inclusive growth trajectory. In this context, a key pre-requisite for
achieving these goals is accessible and inclusive quality education (SDG 4). Research has shown that
investments in human capital —by the public sector, by firms and by households— have a
significant impact on economic performance as well as individual and social wellbeing.
The role of technical and vocation education and training (TVET) in this process is key,
especially as the global and regional economy undergoes significant changes. The world of work is
evolving rapidly, as productive structures adapt to the shifts induced by the emergence of new
technologies and new business models. Skills in this environment tend to depreciate quickly and
therefore must be continually updated. In this sense, TVET provides opportunities to transition
students into this new world of work as well as keeping existing workers employed. TVET targeted
to women, youth, senior citizens and other vulnerable populations also provides governments with
significant leverage to reduce inequality and poverty.
To realize these benefits, however, will require a substantial commitment by governments,
households and firms to finance TVET. Unfortunately, this task is made more difficult by the
exceptionally high level of fragmentation that characterizes TVET, both inside and outside the
formal education system. The potential for market failures that lead to a suboptimal level of
investment is therefore substantial. This situation argues for the State to play a key role in providing
the necessary governance of the market as well as in mobilizing the financing necessary to
overcome these market failures.
Addressing this funding commitment in Latin America and the Caribbean will be a
considerable challenge. The adoption of the 2030 Agenda for Sustainable Development has
10 ECLAC - Macroeconomics of Development Series No. 200 Financing of education and technical and vocational...
coincided with a deterioration of the region’s macroeconomic fundamentals. Slowing growth, even
outright recession in some countries, as well as considerable fiscal imbalances have limited policy
space. In response, many countries in the region have adopted fiscal consolidation measures that
have served to cut government spending, initially in public investment but now increasingly in other
areas, including social spending.
In this context, the aim of this paper is to provide an overview of the current state of financing
for education and TVET in the region. Given the wide scope of this topic, it is necessary to apply a
specific lens to the analysis. The focus of this paper is therefore to review initial financing for
education and TVET, which is defined as those resources that derive directly from governments,
households and firms. Transfers of resources —for example, scholarships, vouchers, other
subsidies— and the final expenditures on education and TVET are therefore excluded from the
present analysis.
The paper is structured in the following manner. Section I provides the context for the
analysis by examining the definition of TVET and the rationales for investment. Section II reviews
the theoretical framework for education and TVET finance as well as an examination of the
principal financing modalities. Section III analyses the initial financing for education and TVET in
Latin America and the Caribbean of the principal actors in the TVET market: government,
households, firms, and other international partners and investors. Finally, section IV concludes
with identifying some key topics for consideration in the evaluation and formulation of new
education and TVET financing policies.
11 ECLAC - Macroeconomics of Development Series No. 200 Financing of education and technical and vocational...
I. Technical and vocational education and training
(TVET): definitions and rationales for investment
A. What is TVET?
Technical and vocational education and training (TVET) is defined by UNESCO (1984) as “those
aspects of the educational process involving, in addition to general education, the study of
technologies and related sciences and the acquisition of practical skills, attitudes, understanding
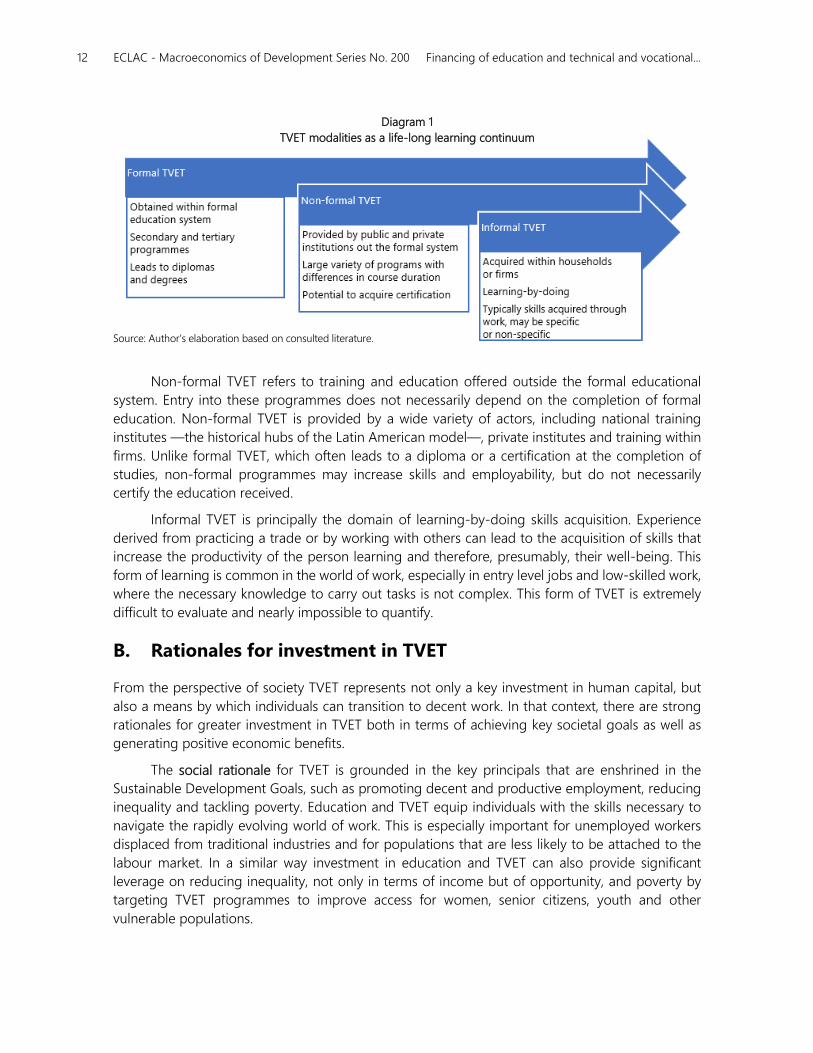
and knowledge relating to occupation in various sectors of economic life.” As diagram 1
highlights, this definition is sufficiently broad that is covers a spectrum of education and training
from formal (TVET offered within the formal educational system) to non-formal (TVET provided
to those outside the formal educational system) and ending at in-formal (TVET associated with
learning by doing and personal skills acquisition). TVET is therefore a process of life-long learning
that undergirds the social and economic well-being of the economy, in as much as it is a key
force for human capital formation.
Formal TVET refers to technical and professional programmes offered within the formal
education system, which lead to degrees or other types of certifications. At the secondary level TVET
specific tracks are typically offered to upper-secondary students, although in some countries
programmes exist at the lower-secondary level as well. Beyond formal TVET at the secondary level,
students can enter post-secondary non-tertiary TVET programmes that offer access to certifications
in specific occupations and or skills. Finally, tertiary TVET programmes offer degrees that are
equivalent to a bachelor’s degree.
12 ECLAC - Macroeconomics of Development Series No. 200 Financing of education and technical and vocational...
Diagram 1
TVET modalities as a life-long learning continuum
Source: Author’s elaboration based on consulted literature.
Non-formal TVET refers to training and education offered outside the formal educational
system. Entry into these programmes does not necessarily depend on the completion of formal
education. Non-formal TVET is provided by a wide variety of actors, including national training
institutes —the historical hubs of the Latin American model—, private institutes and training within
firms. Unlike formal TVET, which often leads to a diploma or a certification at the completion of
studies, non-formal programmes may increase skills and employability, but do not necessarily
certify the education received.
Informal TVET is principally the domain of learning-by-doing skills acquisition. Experience
derived from practicing a trade or by working with others can lead to the acquisition of skills that
increase the productivity of the person learning and therefore, presumably, their well-being. This
form of learning is common in the world of work, especially in entry level jobs and low-skilled work,
where the necessary knowledge to carry out tasks is not complex. This form of TVET is extremely
difficult to evaluate and nearly impossible to quantify.
B. Rationales for investment in TVET
From the perspective of society TVET represents not only a key investment in human capital, but
also a means by which individuals can transition to decent work. In that context, there are strong
rationales for greater investment in TVET both in terms of achieving key societal goals as well as
generating positive economic benefits.
The social rationale for TVET is grounded in the key principals that are enshrined in the
Sustainable Development Goals, such as promoting decent and productive employment, reducing
inequality and tackling poverty. Education and TVET equip individuals with the skills necessary to
navigate the rapidly evolving world of work. This is especially important for unemployed workers
displaced from traditional industries and for populations that are less likely to be attached to the
labour market. In a similar way investment in education and TVET can also provide significant
leverage on reducing inequality, not only in terms of income but of opportunity, and poverty by
targeting TVET programmes to improve access for women, senior citizens, youth and other
vulnerable populations.
13 ECLAC - Macroeconomics of Development Series No. 200 Financing of education and technical and vocational...
There is also a strong case for the economic rationale for TVET as well, as it generates benefits
that accrue to individuals, firms and the economy as a whole (Blundell et al., 2005). An extensive
economic literature exists that is devoted to the measurement of the private individual returns to
education. Much of this literature is based on the seminal work of Jacob Mincer (1958), who
developed an earnings function that in its most basic formulation models hourly wages as a function
of education and labour market experience.
A recent comprehensive study based on a Mincerian model found that at the global level an
additional year of education results on average results in a 9.7% increase in hourly earnings
(Montenegro and Patrinos, 2014). The authors of this study find that there is significant variation
across regions, with some regions registering results lower than the global average: Middle East
and North Africa (6.5%) and South Asia (7.2%). Additionally, there is a difference in the returns to
education based on gender. At the global level, women see their average wages rise 11.5% for each
year of additional education, whereas the equivalent increase for men is 9.1%.
Private returns to TVET are consistent with the rates of return for education as a whole,
though they can vary depending on the type and length of a given programme. An analysis of
European countries found that the rate of return for an additional year of TVET —in an aggregate
sense as the study could not differentiate by programme— was comparable to that of tertiary
education at roughly 7% for both men and women (Cedefop —European Centre for the
Development of Vocational Training, 2011). Taking into account the shorter duration of TVET courses
the adjusted rate of return rose to 10% for men and 7% for women.
However, private returns to TVET are strongly conditioned on the occupational field, the
length of the programme and the type of certification or degree received upon completion. Stevens,
et al., (2015) find that the average rate of return for career technical education programmes at
community colleges in the California Community College system span a range that runs from 14%
for short-term certification programmes to 45% for associate degrees. This result is largely driven
by returns to training in healthcare related occupations, where estimated returns ranged from 12%
to 99%, depending on the certification or degree received. In contrast, private returns to additional
education in non-healthcare related TVET programs were calculated to be between 15% and 23%.
Studies on the returns on investment for training by firms vary significantly, depending on
type of firm undertaking the investment and the kind of training provided. A study by Mincer (1989)
found that returns to employers were significant (with an upper limit of 23.6%), but that they were
sensitive to the length of time the trainee stays with the firm and how fast their training becomes
obsolete (depreciates). A recent study based on detailed microdata for Portuguese firms that
included specific information on training expenses found that the internal rate of return for
investments in human capital by firms providing training was between 17% and 24% (Almeida and
Carneiro, 2006). Despite these high rates of return the authors found that on average firms in the
sample dedicated less than 1% of total work hours to training.
At the macroeconomic level the importance of education as a determinant of economic growth
is firmly established in the endogenous growth models, which posit that investment in human capital is
the key contributor to long-term economic growth (Romer, 1986; Lucas, 1988; Becker, Murphy and
Tamura, 1990). While econometric analysis of this relationship have shown mixed results, recent work
that incorporate more appropriate proxies of human capital more firmly establish the positive
contribution of education and cognitive ability to economic growth (Hanushek and Woessmann, 2012).

15 ECLAC - Macroeconomics of Development Series No. 200 Financing of education and technical and vocational...
II. Theoretical framework for TVET finance
A. Models for the provision of education and TVET services
Models for the provision of education and TVET services can vary widely, although in theoretical
terms, it is potentially useful to envision three main types: first, a completely centralized model
where the State both finances and provides TVET; second, a completely market based model, where
State intervention is minimal and individuals and firms establish the supply and demand for formal
and non-formal TVET in the marketplace; and third, a mixed model where both the State and the
private sector are involved in the financing and the supply of TVET. At its most fundamental level,
these differences in models are based on what is the perceived role of the State in the provision of
education and TVET: should the State increase supply or create demand, or both or neither?
In a centralized model, the State determines the supply of TVET and its financing. This model
is most strongly associated with the provision of TVET through the formal education system, where
public institutions play a predominant role, and in non-formal TVET through national training
institutions. Decisions about the funding of TVET are largely determined at the aggregate level. This
model is largely focussed on outputs, rather than outcomes, which is reflected in indicators in
countries’ results-based budgeting reports that often highlight the absolute number of participants
in programmes, regardless of the result of that education on labour market outcomes.
At the other extreme, a purely market-based model leaves the supply and demand for TVET
to be determined by market forces. Individuals and other private entities —firms or non-
governmental organizations, for example— enter the market making use of their own resources,
and perhaps with minimal support of the public sector, to purchase educational services from
private —or potentially public— providers. Private TVET providers in turn can be for-profit or non-
profit entities, whose training offer responds to the overall demand for their services. In this model,
16 ECLAC - Macroeconomics of Development Series No. 200 Financing of education and technical and vocational...
the market for TVET may potentially be more dynamic than in a centralized model, responding with
greater ease to changes in economic and labour market conditions.
A mixed model of TVET incorporates aspects of the previous two approaches, creating a
market that encompasses both public and private actors. While Ministries of Education or special
TVET councils —which can include participants from the public and private sectors— provide
governance of the TVET market, the market can suffer from significant coordination problems
arising from the large variety of programmes on offer and the various actors that participate in the
market. This notwithstanding, the public sector in this model plays an important role in mobilizing
resources and offering formal and non-formal educational services —especially in countries where
free public education is a constitutionally guaranteed right. In turn, private providers respond to the
demand for their services, which are purchased by households or firms, in some cases making use
of financing obtained from the public sector.
A key aspect of a mixed model of TVET provision is that households and firms can make their
own decisions related to the consumption of educational services. These decisions include the most
basic, such as to participate or not in the TVET market, whether to follow formal secondary and
tertiary TVET programmes or to enrol in a non-formal institute, and if they should attend public or
private institutions, among others. To that end, the funding mechanisms adopted by the State within
this approach can have a strong impact on the eventual shape of the market, its dynamics and the
expectations of participants and providers.
B. Justifications for public sector intervention in education
and TVET financing in a mixed market
As described above, the prevailing mixed model market is characterized by a high level of
complexity, which leaves it susceptible to numerous market failures. These market failures can inhibit
investment in education and TVET by households and firms. Given the strong rationales for TVET,
there is a strong case for the public sector to take a key role in providing initial financing —which
can subsequently be deployed— to ensure that the market clears at an optimal equilibrium.
In the literature, one of the principal justifications for the intervention of the State in the
economy is to correct market failures —such as the existence of externalities, asymmetries of
information and economies of scale, among others— to ensure that resources are allocated
efficiently. Under this supposition the adoption of a specific public policy can result in a Pareto
improvement that moves the economy closer to its optimal allocation of resources and thereby
achieve the greatest social benefit.
Perhaps the principal cause of TVET market failure is the existence of externalities. Key among
these is that the social returns to higher TVET investment is greater than those accruing to
individuals or firms. The social returns to the positive externalities of TVET —stronger economic
growth, higher productivity, increased tax revenues, more productive employment, among others—
are significant. As a result, TVET markets are frequently characterized by underinvestment, leading
to a socially suboptimal equilibrium.
Imperfect information about the returns on TVET investment can reinforce underinvestment
in the market. To the extent that individuals or firms do not have the needed information to judge
the potential benefit of an investment in TVET —in terms of gaining employment, obtaining higher
17 ECLAC - Macroeconomics of Development Series No. 200 Financing of education and technical and vocational...
wages, improving productivity— their appraisal of the returns on that investment may be
significantly biased. In the case of households, the lack of labour market information, especially
related to skills demand and wage information, also diminishes the perceived benefits of investing
in a particular TVET programme.
TVET investment can also be affected by asymmetric information, which can give rise to
potential capital market imperfections that reduce the willingness of the financial sector to provide
financing to households and firms. Lending institutions may be unable to adequately quantify the
potential return to the TVET investment, leading to the use of higher interest rates than normal in
order to protect themselves from potential adverse selection. In turn, higher interest rates on loans
further reduces the potential returns, at least in the short-term, for those making a TVET investment.
Significantly tied to the preceding factors is the inherent risk aversion of market participants.
Individuals’ and firms’ uncertainty about the outcomes of their investment, especially as related to
its size in monetary terms, is a significant limitation to TVET investment. This is especially true for
individuals and households, where a TVET investment that does not result in employment with
higher wages and benefits can undermine their financial wellbeing, potentially with long-term
negative effects.
In a similar way, suboptimal TVET market equilibriums can also occur when firms seek to hire
high skill workers that were trained by their previous employer. This form of poaching leads firms
to underinvest in TVET as they fear that they may not be able to realize the benefits of their
investment before the individual potentially leaves the company. While this phenomenon has
serious microeconomic implications —lower productivity and competitiveness of firms— it also
limits the ability of individuals to leverage their training to advance in their careers in the labour
market. If workers are only trained in firm-specific or very general skills there is little opportunity to
make use of them in another setting, especially if this training does not result in a certification that
is recognized by other employers or educational institutions.
Education and TVET markets are also not immune to negative impacts on equality and
fairness. Potential students may face large barriers to entry into TVET markets, not only in terms
of mobilizing the necessary financing, but also due to other factors such as gender, race or
ethnicity. Limited access therefore serves to reinforce the socio-economic conditions that TVET
seeks to reverse. Government intervention can play a key role in lowering these barriers,
incentivizing further investment.
While the intervention of the State may attenuate these market failures and move the TVET
market to a more optimal equilibrium, it can also create its own distortions. Public policies are
not neutral, and they can both positively and negatively impact the incentives of the different
actors in the TVET market. For example, while a strong push to provide TVET through public
institutions may encourage households to participate in the market, it can also lead to a potential
free-rider problem as firms benefit from the provision of this public good without themselves
providing additional financing.
The intervention of State in capital markets, by guaranteeing loans for example, can lower
interest rates and allow households greater access to needed financing, but it may also lead to
moral hazard problems as financial institutions may engage in risky lending knowing that the public
sector will cover their losses.
18 ECLAC - Macroeconomics of Development Series No. 200 Financing of education and technical and vocational...
Public financing policies can also give rise to an inefficient allocation of resources if they flow
to actors who would have made the TVET investment in the absence of a transfer payment or a tax
benefit. Direct public spending programs must target their population carefully to make sure that
the transfers of resources from initial financing result in the largest potential participation in the
TVET market, especially from women, youth and other vulnerable populations. Preferential tax
treatments, essentially public spending through the tax system, is especially difficult to target and
often benefits households that are least in need of additional financing (IMF, 2011).
A lack of coordination between education and TVET financing policies can also lead to a
suboptimal allocation of resources. Many public spending and tax policies share policy
objectives but may not necessarily be fully integrated within a single framework in such a way
as to maximize their impact (Office of Management and Budget, 2012). Cost-benefit analysis,
infrequently used in policy consideration in Latin America and the Caribbean, may find that a
different combination of policies would result in a more effective allocation of resources
(ECLAC, 2019). In the case of TVET this kind of analysis is hampered by the lack of systematic
statistic and financial information of the market.
Funding mechanisms that provide the resources for initial funding policies can also generate
economic distortions that have important social and macroeconomic consequences. In the
economic literature, payroll taxes —which are often employed to finance non-formal TVET— can
have a negative effect on employment and wages (Kugler and Kugler, 2008; Antón, 2014). To the
extent that general taxation finances TVET, a tax structure based heavily on consumption taxes can
hurt lower-income households, leaving them with few resources to invest.
From a public economics standpoint the budgetary efficiency of education and TVET
financing policies must also be considered. Many governments employ spending targets or ear-
mark tax revenues to mobilize resources for education initial financing. These measures can
serve as practical tools to ensure a high level of resources are channelled toward the creation
of public goods and services in the area of education. However, they also create significant
budgetary rigidities that limit the policy space of countries, especially in times of fiscal
consolidation (Marcel et. al, 2014; Cetrángolo y Jimenez, 2009).
C. Education and TVET financing modalities
Developing TVET financing policies is necessarily a multidimensional exercise, reflecting the varied
nature of the educational ambits involved —formal and non-formal— as well as the multiple actors
who interact in the TVET market. To appreciate this complexity, it is useful to separate the initial
financing for TVET (who pays) from final financing (who spends). This distinction is important as
initial financing is defined as the education financing that each actor allocates based on their own
resources (that is net of transfers received by others). Final financing, in contrast, refers to the final
expenditure by each actor including the transfers that the they receive from other entities.
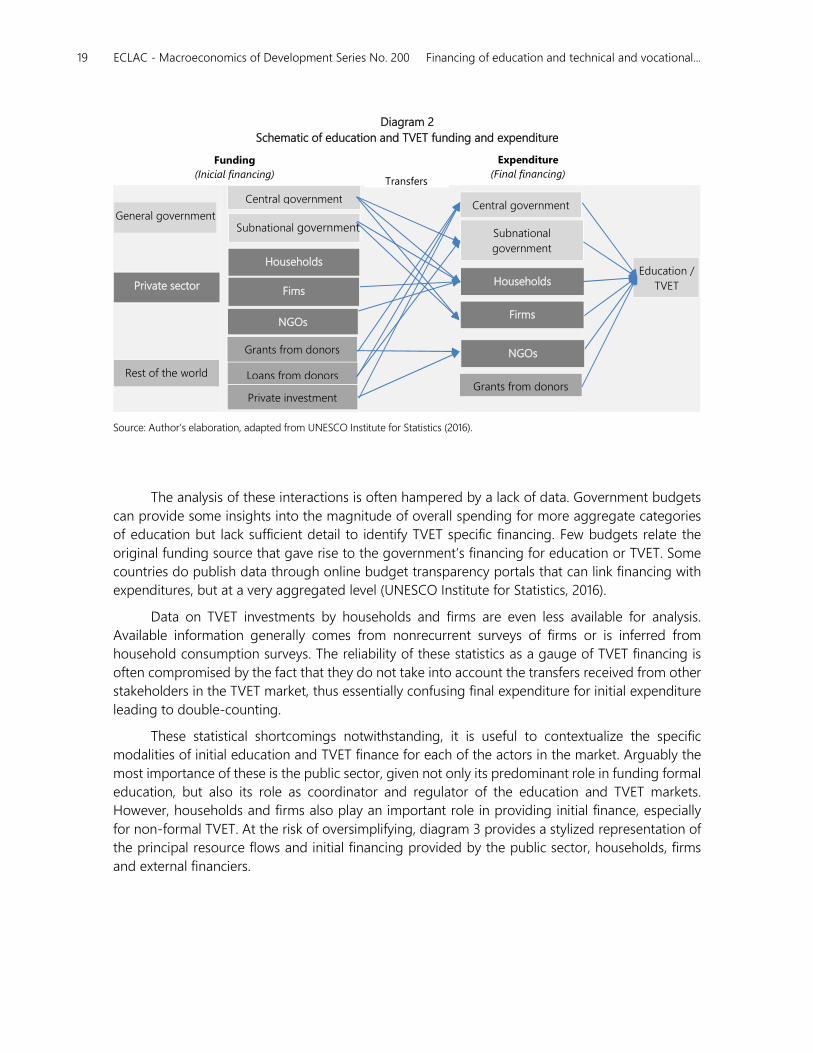
As Diagram 2 shows, there is a dense web of potential interactions between those actors who
provide the funding for TVET and those who finally spend those resources. While in some cases the
actors involved may be the same —for example, the central government both provides initial
financing as well as makes final expenditures— a mixed model for TVET provision makes extensive
use of transfers to channel initial finance to the final expenditure by other actors.
19 ECLAC - Macroeconomics of Development Series No. 200 Financing of education and technical and vocational...
Diagram 2
Schematic of education and TVET funding and expenditure
Source: Author’s elaboration, adapted from UNESCO Institute for Statistics (2016).
The analysis of these interactions is often hampered by a lack of data. Government budgets
can provide some insights into the magnitude of overall spending for more aggregate categories
of education but lack sufficient detail to identify TVET specific financing. Few budgets relate the
original funding source that gave rise to the government’s financing for education or TVET. Some
countries do publish data through online budget transparency portals that can link financing with
expenditures, but at a very aggregated level (UNESCO Institute for Statistics, 2016).
Data on TVET investments by households and firms are even less available for analysis.
Available information generally comes from nonrecurrent surveys of firms or is inferred from
household consumption surveys. The reliability of these statistics as a gauge of TVET financing is
often compromised by the fact that they do not take into account the transfers received from other
stakeholders in the TVET market, thus essentially confusing final expenditure for initial expenditure
leading to double-counting.
These statistical shortcomings notwithstanding, it is useful to contextualize the specific
modalities of initial education and TVET finance for each of the actors in the market. Arguably the
most importance of these is the public sector, given not only its predominant role in funding formal
education, but also its role as coordinator and regulator of the education and TVET markets.
However, households and firms also play an important role in providing initial finance, especially
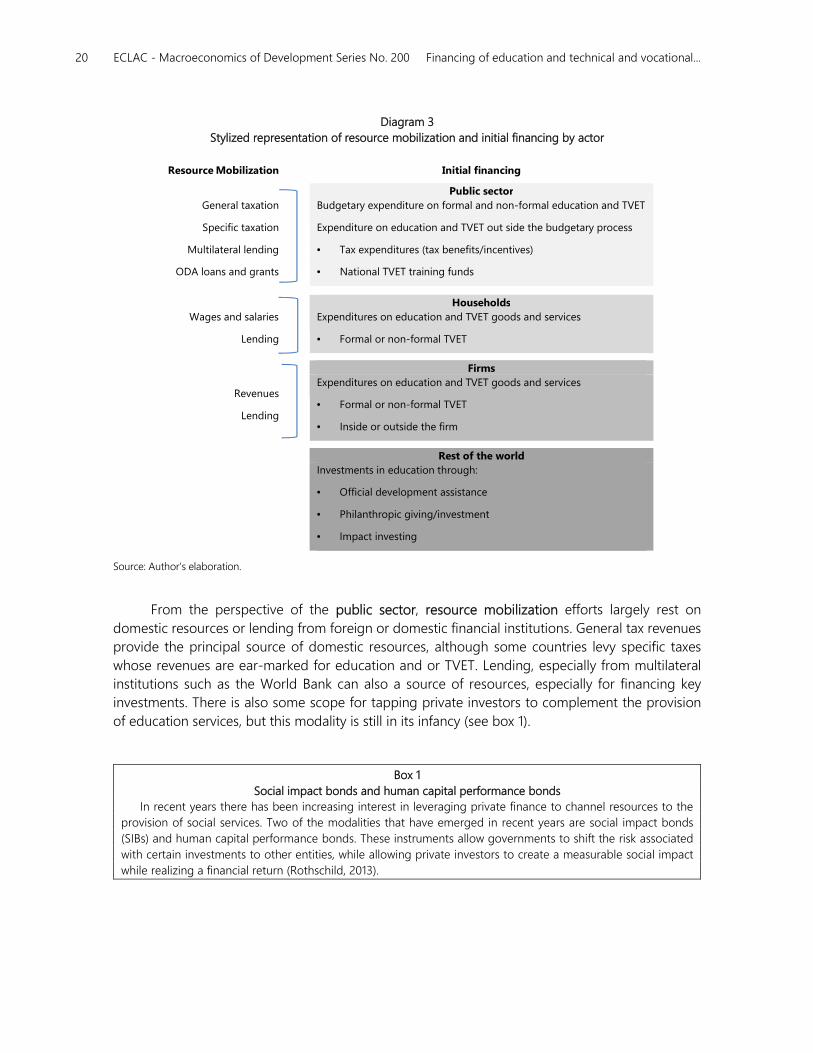
for non-formal TVET. At the risk of oversimplifying, diagram 3 provides a stylized representation of
the principal resource flows and initial financing provided by the public sector, households, firms
and external financiers.
Private sector
Rest of the world
General government
Central government
Subnational government
Private investment
Grants from donors
Loans from donors
Central government
Subnational
government
Grants from donors
Education /
TVET Households
Funding
(Inicial financing)
Expenditure
(Final financing) Transfers
Households
Fims
Firms
NGOs
NGOs
20 ECLAC - Macroeconomics of Development Series No. 200 Financing of education and technical and vocational...
Diagram 3
Stylized representation of resource mobilization and initial financing by actor
Resource Mobilization Initial financing
Public sector
General taxation
Specific taxation
Multilateral lending
ODA loans and grants
Budgetary expenditure on formal and non-formal education and TVET
Expenditure on education and TVET out side the budgetary process
• Tax expenditures (tax benefits/incentives)
• National TVET training funds
Households
Wages and salaries
Lending
Expenditures on education and TVET goods and services
• Formal or non-formal TVET
Firms
Revenues
Lending
Expenditures on education and TVET goods and services
• Formal or non-formal TVET
• Inside or outside the firm
Rest of the world
Investments in education through:
• Official development assistance
• Philanthropic giving/investment
• Impact investing
Source: Author’s elaboration.
From the perspective of the public sector, resource mobilization efforts largely rest on
domestic resources or lending from foreign or domestic financial institutions. General tax revenues
provide the principal source of domestic resources, although some countries levy specific taxes
whose revenues are ear-marked for education and or TVET. Lending, especially from multilateral
institutions such as the World Bank can also a source of resources, especially for financing key
investments. There is also some scope for tapping private investors to complement the provision
of education services, but this modality is still in its infancy (see box 1).
Box 1
Social impact bonds and human capital performance bonds
In recent years there has been increasing interest in leveraging private finance to channel resources to the
provision of social services. Two of the modalities that have emerged in recent years are social impact bonds
(SIBs) and human capital performance bonds. These instruments allow governments to shift the risk associated
with certain investments to other entities, while allowing private investors to create a measurable social impact
while realizing a financial return (Rothschild, 2013).
21 ECLAC - Macroeconomics of Development Series No. 200 Financing of education and technical and vocational...
A SIB is a funding mechanism by which governments enter into agreements with social service providers —
such as social enterprises or non-governmental organizations— and investors to pay for the delivery of pre-
defined social outcomes (OECD, 2015). Conceptually, a financial institution issues a bond to private investors, the
proceeds of which fund the operation expenses of the service provider. If the measurable outcomes are achieved
the government pays back the bond.
The use of social impact bonds has grown in recent years, and is under consideration in countries such as
Australia, Canada, Colombia, India, Ireland, and Israel (Azemati et al., 2013).
Source: Author’s elaboration.
The proceeds of resource mobilization efforts may not necessarily equate to public sector
initial financing for education and TVET. Within the ambit of non-formal TVET, payroll taxes are a
common resource mobilization instrument. Some countries have implemented national training
funds where revenues from payroll taxes, among others, are deposited and used to finance TVET
expenditures outside the regular government budgetary process (Johanson, 2009). Financing
provided by the funds can provide core funding to largely public institutions to provide pre-
employment training or to incentivize enterprise-based training (box 2).
Box 2
Enterprise training funds
Enterprise training funds can be used to bolster training within firms. The bulk of financing for these funds
derives from payroll taxes (levies) paid by firms, although these funds can also benefit from government transfers
and donations from third-parties. The use of these funds depends on the kind of model adopted by the fund.
Three common modalities are:
• Cost reimbursement model: qualified training expenses can be reimbursed from the payroll tax paid by the
enterprise. These reimbursements are usually limited to ensure that the fund maintains sufficient liquidity to
cover administrative costs.
• Levy-grant model: revenues generated by payroll taxes are deposited in the fund and grants are extended to
enterprises on a case-by-case basis. The level of the grant is not necessarily limited by the levy contributions
by the enterprise to the fund, creating an incentive to make larger investments in training.
• Levy-exemption model: enterprises are exempted from the payment of the payroll tax to the extent that they
provided approved training to their employees. Typically, the government fixes the percentage of the payroll
that must be dedicated to training or transferred to the training fund.
Source: Johanson (2009).
Additionally, tax expenditures —tax benefits and preferential tax treatments— should also be
considered as public sector initial education and TVET financing to the extent that they represent
government spending through the tax system outside the normal budgetary process. These
foregone revenues can increase the rate of return on TVET investments by households and firms.
For households these measures typically take the form of personal income tax deductions or credits
for education expenditures. Tax incentives for firms largely seek to promote training within firms or
in qualified TVET institutions.
Initial financing of the formal education system —and in some countries the public providers
of non-formal TVET— by the public sector is largely the domain of Ministries of Education, who
receive their resources through the regular budgetary process, which in turn determines the
22 ECLAC - Macroeconomics of Development Series No. 200 Financing of education and technical and vocational...
allocation of revenues mobilized from general taxes and other sources. While education funding
must compete with other interests within the budget process, an increasing number of countries
have adopted spending targets for education outlays, including that of 6% of GDP enshrined in
various intergovernmental agreements.
Public non-formal TVET providers —typically national training institutions— can also seek to
bolster their initial financing by diversifying their revenue sources with the aim to achieve long-term
sustainability (Antón, 2014). These options can include: the sale of goods and services generated
through the training process; renting equipment and facilities to private enterprises; and, delivering
services outside of the institute’s premise, among others (Uhder, 2017). There is also significant
scope for mobilizing initial financing through partnerships with the private sector (box 3).
Box 3
The German dual system model
The combination of vocational education and work experience has been the hallmark of the German dual
system. Students exiting compulsory education can opt to enter the dual system of education and training, where
they work as apprentices as well as attend courses in a formal setting. Roughly 70% of the training occurs within
firms, while the remainder occurs in formal vocational institutions which provide training courses and general
education. There are currently more than 300 recognized training occupations that are qualified for the dual
system approach. Students in these programs participate for two to three and a half years, after which they are
highly skilled and ready to immediately enter the labour force.
Financing for dual systems is provided by the State and by firms. The public sector provides the initial
financing to cover the TVET expenses related to the coursework completed within the formal education system.
In turn, the firms provide initial financing for the training provided to students, which is compensated in part by
the payment of lower wages —a training allowance that increase over time— as well as the work carried out
by the student.
In 2016 public and private spending on dual TVET in Germany reached 12.5 billion euros, equivalent to 0.39%
of GDP. Of this amount, public sector expenditure was 4.75 billion euros (0.15% of GDP). The employers share —
measured in net terms— was 7.7 billion euros (0.24% of GDP), equivalent to 62% of the total expenditure
of dual TVET.
Source: Author’s elaboration, based on BIBB (2017).
Within the private sector —spanning households, firms and NGOs— initial financing, beyond
their general tax obligations, is closely associated with the income generation capabilities of each
actor. An important distinction is that initial financing for private entities is net of transfers.
Households generate their resources through wage and salary work or through self-employment.
Firms provide initial financing for TVET, both inside and outside the enterprise, out of their own
revenues. NGOs, likewise generate resources through their operations, mainly by fund raising.
Resources for education and TVET can also be mobilized from the rest of the world. One
common modality has been through official development aid (ODA),1 although its relatively small
size and high volatility limits its ability to play a sustained role in education finance. It can, however,
1 Official development assistance (ODA) is defined as resource flows to countries and territories and multinational
organizations that are provided by official government agencies and are concessional (grants and soft loans) and
administrated with the promotion of the economic development and welfare of developing countries as the main
objective (OECD, 2018).
23 ECLAC - Macroeconomics of Development Series No. 200 Financing of education and technical and vocational...
play a catalytic role by financing key projects that unlock further investment within the education
sector. However, the effectiveness of ODA remains a topic of ongoing debate in international circles
(Heynemann and Lee, 2016).
International private sector investment in education is a topic of growing interest, though not
without its detractors. One of these channels is private philanthropic flows for development which
the OECD (2018) defines as transactions from the private sector that promote economic
development and welfare in developing countries as their main objective, and which originate from
the foundations’ own resources (endowments, donations, etc). While these transactions are
relatively modest in size, compared to official development assistance, in some sectors they are
important, especially in health. Financing for education is not insignificant, but it is far exceeded by
flows targeting healthcare.
Another form of private sector financing that has grown in prominence in recent years is
impact investing. Private investors who engage in impact investing seek to generate a measurable
development impact as well as a financial return (OECD, 2019). The Global Impact Investing
Network (2018) estimates that surveyed investors were managing US$ 228 billion in impact
investing assets in 2017. Of this amount, roughly US$ 9 billion was allocated to education. To
some extent this result represents the difficulties that impact investors face when approaching
potential projects in developing countries. Beyond identifying appropriate interventions there are
many other factors outside the control of any given investment that can determine the success
or failure of an investment.2
Private providers of education and TVET services can also mobilize resources in support of
their initial financing by leveraging the financial services provided by the International Finance
Corporation (IFC). While the IFC is a member of the World Bank Group of organizations, it is
effectively independent and functions as an international financial services provider. The IFC
focusses on financing private sector investment, mobilizing capital in international financial markets,
providing advisory services and risk-mitigation services to governments and private sector entities,
and managing assets for third-party entities. Education makes a relatively small share of the
organization´s portfolio, but of that amount 75% are in TVET and tertiary education.
2 These can include such varied factors such as from menstrual hygiene and nutrition to cultural resistance to school attendance
and difficulties in recruiting teachers. See: https://www.ft.com/content/4f9ad318-786d-11e8-af48-190d103e32a4.

25 ECLAC - Macroeconomics of Development Series No. 200 Financing of education and technical and vocational...
III. Education and TVET financing in Latin America
and the Caribbean
A. Scope of analysis
Given the complexities of education and TVET financing it is necessary to limit the analysis in this
report to resource mobilization and initial financing. Transfers and final expenditure are therefore
not examined, although they play an important role in shaping the education and TVET markets,
especially in mixed models where individuals can choose where to obtain their training, both in the
formal system as well as in the non-formal market. Because of the focus on initial financing much
of the statistical and financial information available is related to the public sector. However, initial
financing provided by households and firms, as well as actors beyond the frontiers of an individual
country will be explored. To that end, the following definitions based on international standards
guide the presentation of data that follows.
Public expenditure —initial financing— refers to spending of public authorities at all levels of
government, including by ministries and institutions whose mandate is not related education
(Health, Agriculture, Military). It includes financing for purposes such as the direct expenditure on
educational institutions, intergovernmental transfers for education, and transfers or other payments
to households and other private entities. Educational statistics provided by UNESCO and the OECD
are limited in scope to the formal sector and do not consider public expenditure through tax
benefits. The analysis presented in this report will include both of these items.
Initial financing of household expenditures refers to the use of their own resources
—excluding transfers from the public sector, households or other private entities— on costs such
as the purchase on educational goods and services, fees for ancillary services —lodging, meals,
26 ECLAC - Macroeconomics of Development Series No. 200 Financing of education and technical and vocational...
health services or other welfare services— furnished by educational institutions and transfers to
other households.
Initial financing by other private entities —firms, NGOs, charities, religious organizations—
include direct payments to educational institutions and subsidies to students or households that
originate from their own resources (excluding any subsidies or other transfers that they may
receive). From the perspective of formal TVET, international education statistical guidelines state
that these expenditures include contributions or subsidies to vocational and technical schools by
business or labour organisations; and, expenditure by private employers on the training of
apprentices and other participants in mixed school —and work— based educational programmes.
Financing for training within the firm is not included in international statistics but will be
examined in this report.
In terms of initial financing provided by the rest of the world —official development
assistance, philanthropic investing and impact investment— are essentially analysed from the
standpoint of investments in individual projects. Resources provided to governments to support
their budgets by external actors are considered to be part of the initial financing of the
domestic public sector.
B. Public sector
1. Resource mobilization
Financing of formal sector education and TVET is largely the province of central and, to a lesser
extent, subnational governments in the region. Public sector education expenditures —including
for TVET in the formal system— are financed nearly entirely out of the general budget of the
government, channelled typically though Ministries of Education. The resources at the disposal of
the region’s governments in turn stems principally from tax revenues. Thus, it is useful to consider
governments as facilitating the movement of resources from households and private sector entities
—in the form of tax revenues— toward specific ends, in this case education and TVET.
This section reviews the composition of funds available to finance education and TVET
expenditures from the perspective of the public sector in the region. The first section provides an
overview of general tax revenues in Latin America and the Caribbean. The second section examines specific
education and TVET tax instruments and revenues they generate. The third section reviews the possibility of
own financing by TVET institutions through the sale of goods and services. Finally, the fourth section reviews
multilateral lending for education and TVET in the region.
(a) General government taxation
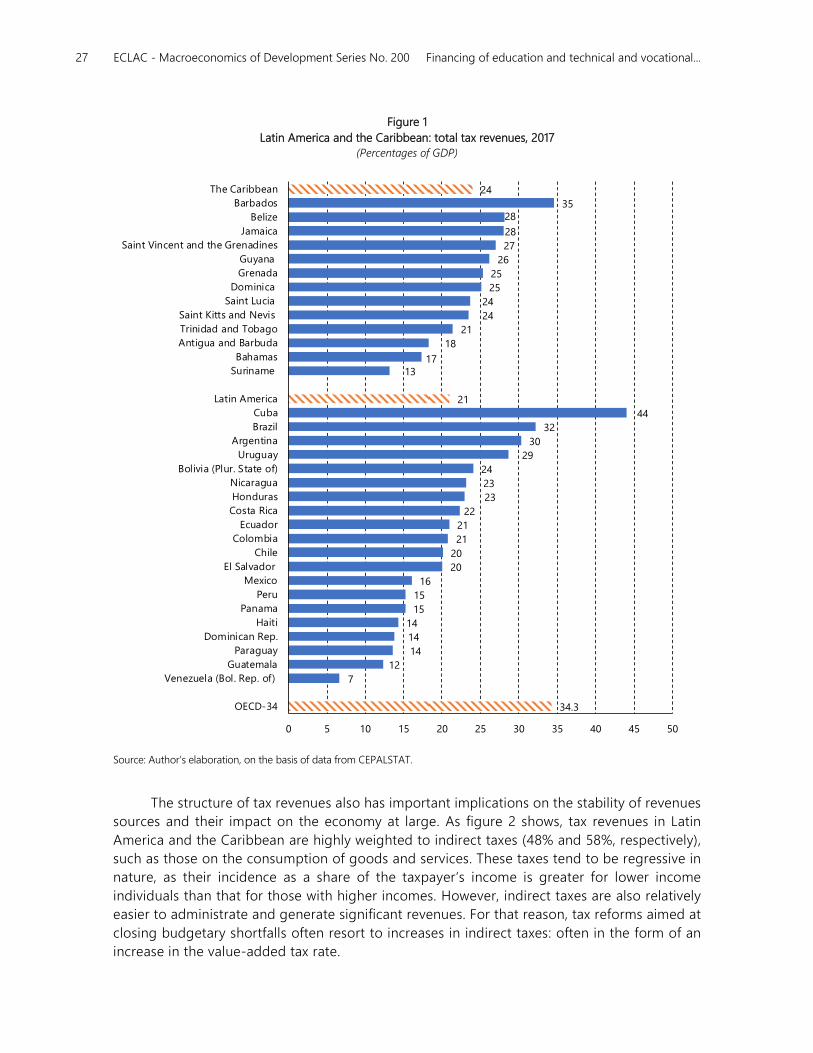
General government tax revenues in Latin America and the Caribbean are significantly
heterogenous, exhibiting a wide range of levels by country (figure 1). In aggregate terms the
subregional average tax pressure for Latin America (21% of GDP) and the Caribbean (24% of
GDP) are significantly below the average for the countries of the OECD (34% of GDP). However,
within each group there are a number of countries with tax takes that approach the OECD
average: namely Argentina, Bolivia, Brazil, Cuba and Uruguay in Latin America; and, Barbados,
Belize and Jamaica in the Caribbean. There are also a large number of countries where the tax
take is well below the level of 20% of GDP that was considered to be necessary to finance the
Millennium Development Goals (UNDP, 2010).
27 ECLAC - Macroeconomics of Development Series No. 200 Financing of education and technical and vocational...
Figure 1
Latin America and the Caribbean: total tax revenues, 2017 (Percentages of GDP)
Source: Author’s elaboration, on the basis of data from CEPALSTAT.
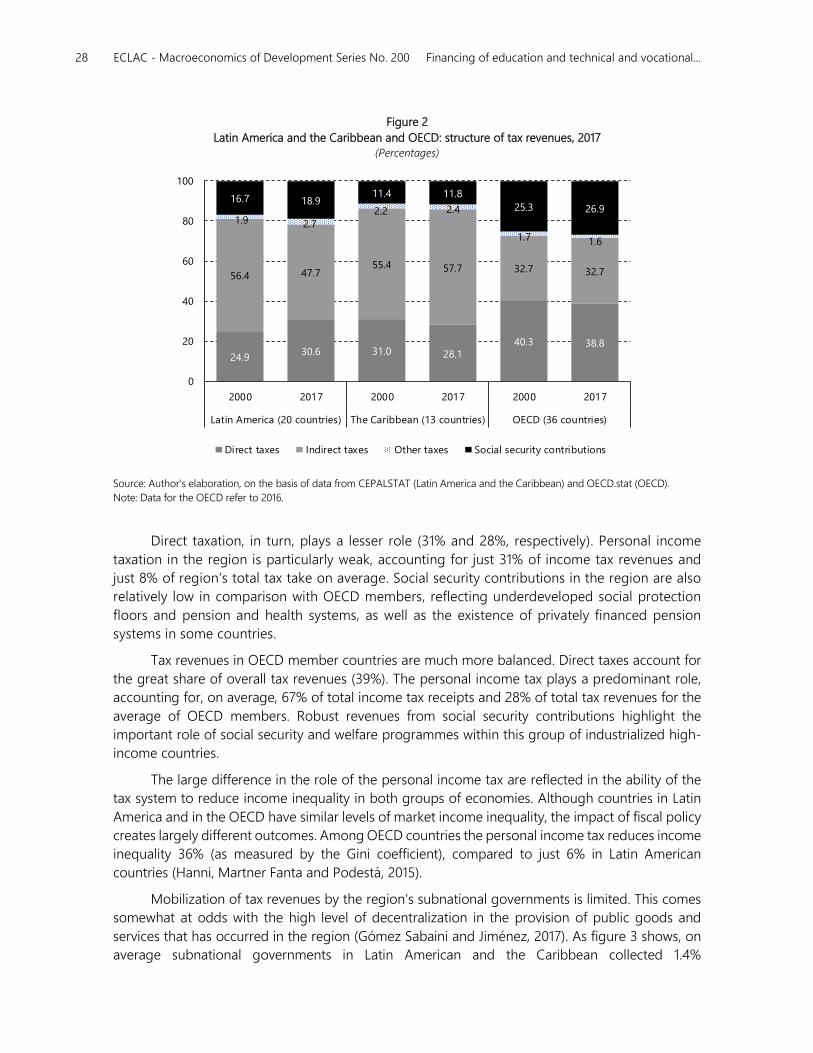
The structure of tax revenues also has important implications on the stability of revenues
sources and their impact on the economy at large. As figure 2 shows, tax revenues in Latin
America and the Caribbean are highly weighted to indirect taxes (48% and 58%, respectively),
such as those on the consumption of goods and services. These taxes tend to be regressive in
nature, as their incidence as a share of the taxpayer’s income is greater for lower income
individuals than that for those with higher incomes. However, indirect taxes are also relatively
easier to administrate and generate significant revenues. For that reason, tax reforms aimed at
closing budgetary shortfalls often resort to increases in indirect taxes: often in the form of an
increase in the value-added tax rate.
34.3
7
12
14
14
14
15
15
16
20
20
21
21
22
23
23
24
29
30
32
44
21
1317
18
21
24
24
25
25
26
27
28
2835
24
0 5 10 15 20 25 30 35 40 45 50
OECD-34
Venezuela (Bol. Rep. of)
Guatemala
Paraguay
Dominican Rep.
Haiti
Panama
Peru
Mexico
El Salvador
Chile
Colombia
Ecuador
Costa Rica
Honduras
Nicaragua
Bolivia (Plur. State of)
Uruguay
Argentina
Brazil
Cuba
Latin America
Suriname
Bahamas
Antigua and Barbuda
Trinidad and Tobago
Saint Kitts and Nevis
Saint Lucia
Dominica
Grenada
Guyana
Saint Vincent and the Grenadines
Jamaica
Belize
Barbados
The Caribbean
28 ECLAC - Macroeconomics of Development Series No. 200 Financing of education and technical and vocational...
Figure 2
Latin America and the Caribbean and OECD: structure of tax revenues, 2017 (Percentages)
Source: Author’s elaboration, on the basis of data from CEPALSTAT (Latin America and the Caribbean) and OECD.stat (OECD).
Note: Data for the OECD refer to 2016.
Direct taxation, in turn, plays a lesser role (31% and 28%, respectively). Personal income
taxation in the region is particularly weak, accounting for just 31% of income tax revenues and
just 8% of region’s total tax take on average. Social security contributions in the region are also
relatively low in comparison with OECD members, reflecting underdeveloped social protection
floors and pension and health systems, as well as the existence of privately financed pension
systems in some countries.
Tax revenues in OECD member countries are much more balanced. Direct taxes account for
the great share of overall tax revenues (39%). The personal income tax plays a predominant role,
accounting for, on average, 67% of total income tax receipts and 28% of total tax revenues for the
average of OECD members. Robust revenues from social security contributions highlight the
important role of social security and welfare programmes within this group of industrialized high-
income countries.
The large difference in the role of the personal income tax are reflected in the ability of the
tax system to reduce income inequality in both groups of economies. Although countries in Latin
America and in the OECD have similar levels of market income inequality, the impact of fiscal policy
creates largely different outcomes. Among OECD countries the personal income tax reduces income
inequality 36% (as measured by the Gini coefficient), compared to just 6% in Latin American
countries (Hanni, Martner Fanta and Podestá, 2015).
Mobilization of tax revenues by the region’s subnational governments is limited. This comes
somewhat at odds with the high level of decentralization in the provision of public goods and
services that has occurred in the region (Gómez Sabaini and Jiménez, 2017). As figure 3 shows, on
average subnational governments in Latin American and the Caribbean collected 1.4%
24.930.6 31.0 28.1
40.3 38.8
56.4 47.755.4 57.7 32.7 32.7
1.9 2.7
2.2 2.4
1.7 1.6
16.7 18.911.4 11.8
25.3 26.9
0
20
40
60
80
100
2000 2017 2000 2017 2000 2017
Latin America (20 countries) The Caribbean (13 countries) OECD (36 countries)
Direct taxes Indirect taxes Other taxes Social security contributions
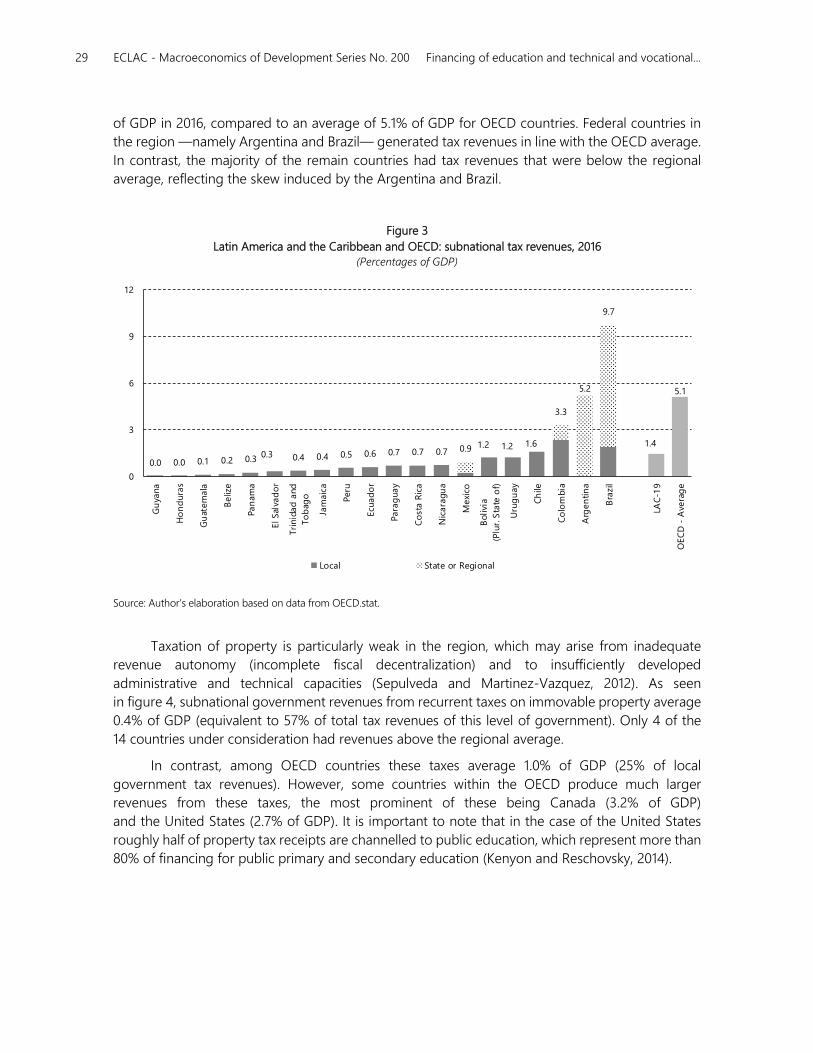
29 ECLAC - Macroeconomics of Development Series No. 200 Financing of education and technical and vocational...
of GDP in 2016, compared to an average of 5.1% of GDP for OECD countries. Federal countries in
the region —namely Argentina and Brazil— generated tax revenues in line with the OECD average.
In contrast, the majority of the remain countries had tax revenues that were below the regional
average, reflecting the skew induced by the Argentina and Brazil.
Figure 3
Latin America and the Caribbean and OECD: subnational tax revenues, 2016 (Percentages of GDP)
Source: Author’s elaboration based on data from OECD.stat.
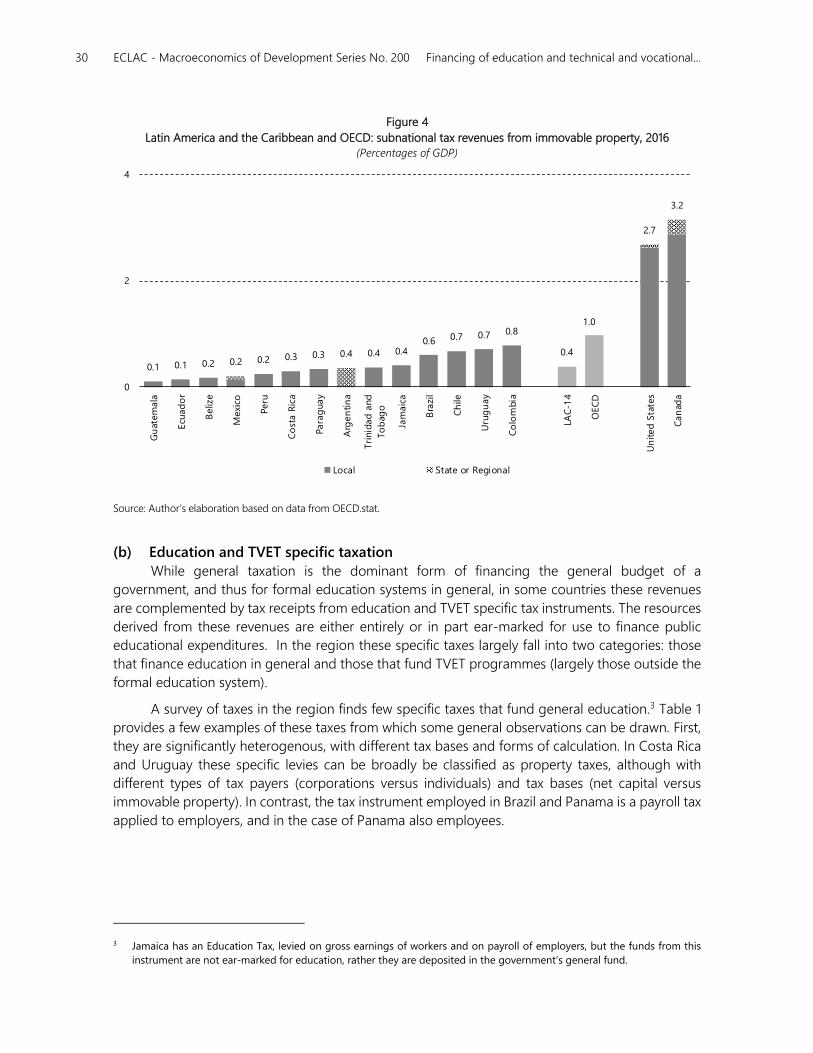
Taxation of property is particularly weak in the region, which may arise from inadequate
revenue autonomy (incomplete fiscal decentralization) and to insufficiently developed
administrative and technical capacities (Sepulveda and Martinez-Vazquez, 2012). As seen
in figure 4, subnational government revenues from recurrent taxes on immovable property average
0.4% of GDP (equivalent to 57% of total tax revenues of this level of government). Only 4 of the
14 countries under consideration had revenues above the regional average.
In contrast, among OECD countries these taxes average 1.0% of GDP (25% of local
government tax revenues). However, some countries within the OECD produce much larger
revenues from these taxes, the most prominent of these being Canada (3.2% of GDP)
and the United States (2.7% of GDP). It is important to note that in the case of the United States
roughly half of property tax receipts are channelled to public education, which represent more than
80% of financing for public primary and secondary education (Kenyon and Reschovsky, 2014).
0.0 0.0 0.1 0.2 0.30.3 0.4 0.4 0.5 0.6 0.7 0.7 0.7 0.9 1.2 1.2 1.6
3.3
5.2
9.7
1.4
5.1
0
3
6
9
12
Gu
yana
Ho
nd
ura
s
Gu
atem
ala
Beliz
e
Pan
am
a
El Sal
vad
or
Tri
nid
ad
and
To
bag
o
Jam
aic
a
Peru
Ecu
ad
or
Para
guay
Co
sta R
ica
Nic
ara
gu
a
Mexi
co
Bolivi
a
(Plu
r. S
tate
of)
Uru
gu
ay
Ch
ile
Co
lom
bia
Arg
en
tin
a
Bra
zil
LAC
-19
OEC
D -
Ave
rag
e
Local State or Regional
30 ECLAC - Macroeconomics of Development Series No. 200 Financing of education and technical and vocational...
Figure 4
Latin America and the Caribbean and OECD: subnational tax revenues from immovable property, 2016 (Percentages of GDP)
Source: Author’s elaboration based on data from OECD.stat.
(b) Education and TVET specific taxation
While general taxation is the dominant form of financing the general budget of a
government, and thus for formal education systems in general, in some countries these revenues
are complemented by tax receipts from education and TVET specific tax instruments. The resources
derived from these revenues are either entirely or in part ear-marked for use to finance public
educational expenditures. In the region these specific taxes largely fall into two categories: those
that finance education in general and those that fund TVET programmes (largely those outside the
formal education system).
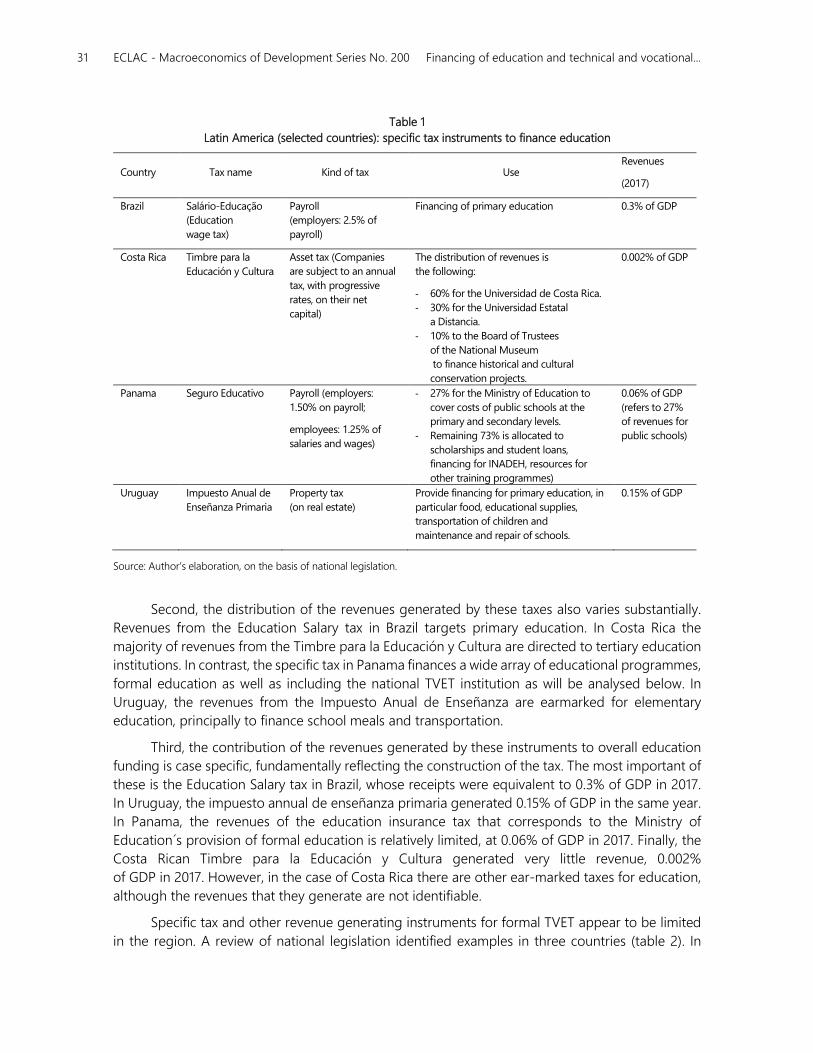
A survey of taxes in the region finds few specific taxes that fund general education.3 Table 1
provides a few examples of these taxes from which some general observations can be drawn. First,
they are significantly heterogenous, with different tax bases and forms of calculation. In Costa Rica
and Uruguay these specific levies can be broadly be classified as property taxes, although with
different types of tax payers (corporations versus individuals) and tax bases (net capital versus
immovable property). In contrast, the tax instrument employed in Brazil and Panama is a payroll tax
applied to employers, and in the case of Panama also employees.
3 Jamaica has an Education Tax, levied on gross earnings of workers and on payroll of employers, but the funds from this
instrument are not ear-marked for education, rather they are deposited in the government’s general fund.
0.1 0.1 0.2 0.2 0.2 0.3 0.3 0.4 0.4 0.40.6 0.7 0.7 0.8
0.4
1.0
2.7
3.2
0
2
4
Gu
atem
ala
Ecu
ad
or
Be
lize
Mexi
co
Peru
Co
sta R
ica
Pa
rag
ua
y
Arg
en
tin
a
Tri
nid
ad
and
To
bag
o
Jam
aic
a
Bra
zil
Ch
ile
Uru
gu
ay
Co
lom
bia
LAC
-14
OEC
D
Un
ite
d S
tate
s
Ca
nad
a
Local State or Regional
31 ECLAC - Macroeconomics of Development Series No. 200 Financing of education and technical and vocational...
Table 1
Latin America (selected countries): specific tax instruments to finance education
Country Tax name Kind of tax Use Revenues
(2017)
Brazil Salário-Educação
(Education
wage tax)
Payroll
(employers: 2.5% of
payroll)
Financing of primary education 0.3% of GDP
Costa Rica Timbre para la
Educación y Cultura
Asset tax (Companies
are subject to an annual
tax, with progressive
rates, on their net
capital)
The distribution of revenues is
the following:
- 60% for the Universidad de Costa Rica.
- 30% for the Universidad Estatal
a Distancia.
- 10% to the Board of Trustees
of the National Museum
to finance historical and cultural
conservation projects.
0.002% of GDP
Panama Seguro Educativo Payroll (employers:
1.50% on payroll;
employees: 1.25% of
salaries and wages)
- 27% for the Ministry of Education to
cover costs of public schools at the
primary and secondary levels.
- Remaining 73% is allocated to
scholarships and student loans,
financing for INADEH, resources for
other training programmes)
0.06% of GDP
(refers to 27%
of revenues for
public schools)
Uruguay Impuesto Anual de
Enseñanza Primaria
Property tax
(on real estate)
Provide financing for primary education, in
particular food, educational supplies,
transportation of children and
maintenance and repair of schools.
0.15% of GDP
Source: Author’s elaboration, on the basis of national legislation.
Second, the distribution of the revenues generated by these taxes also varies substantially.
Revenues from the Education Salary tax in Brazil targets primary education. In Costa Rica the
majority of revenues from the Timbre para la Educación y Cultura are directed to tertiary education
institutions. In contrast, the specific tax in Panama finances a wide array of educational programmes,
formal education as well as including the national TVET institution as will be analysed below. In
Uruguay, the revenues from the Impuesto Anual de Enseñanza are earmarked for elementary
education, principally to finance school meals and transportation.
Third, the contribution of the revenues generated by these instruments to overall education
funding is case specific, fundamentally reflecting the construction of the tax. The most important of
these is the Education Salary tax in Brazil, whose receipts were equivalent to 0.3% of GDP in 2017.
In Uruguay, the impuesto annual de enseñanza primaria generated 0.15% of GDP in the same year.
In Panama, the revenues of the education insurance tax that corresponds to the Ministry of
Education´s provision of formal education is relatively limited, at 0.06% of GDP in 2017. Finally, the
Costa Rican Timbre para la Educación y Cultura generated very little revenue, 0.002%
of GDP in 2017. However, in the case of Costa Rica there are other ear-marked taxes for education,
although the revenues that they generate are not identifiable.
Specific tax and other revenue generating instruments for formal TVET appear to be limited
in the region. A review of national legislation identified examples in three countries (table 2). In
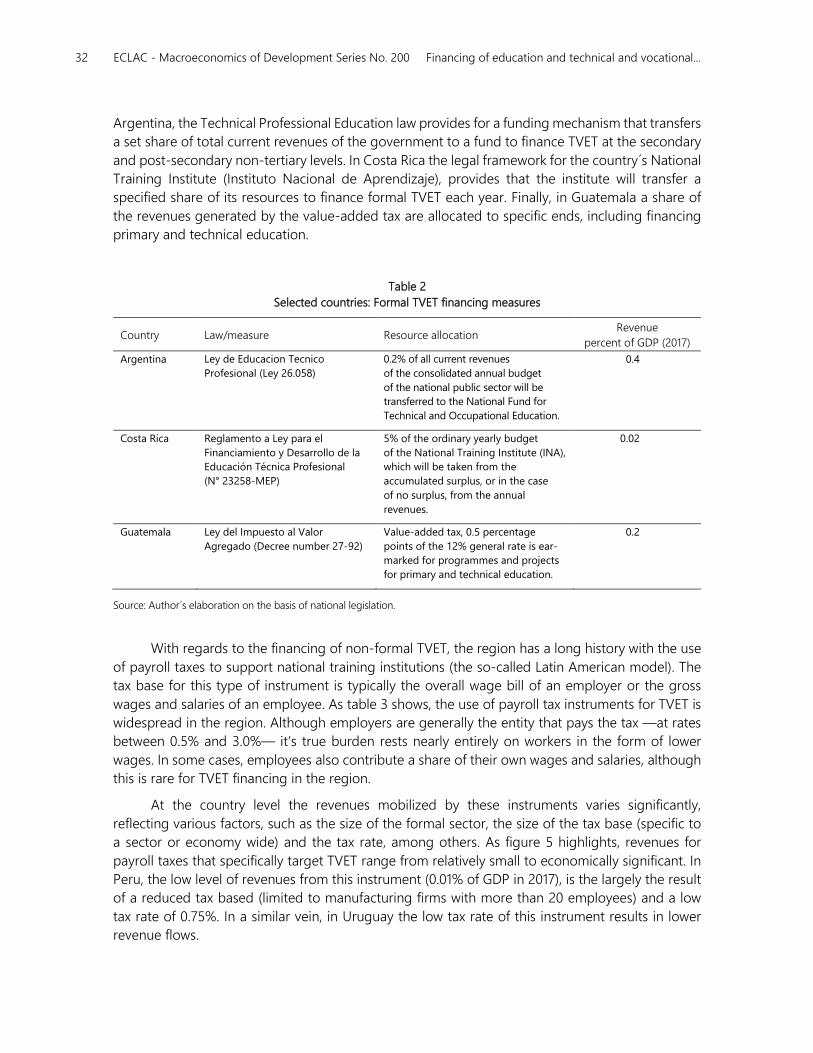
32 ECLAC - Macroeconomics of Development Series No. 200 Financing of education and technical and vocational...
Argentina, the Technical Professional Education law provides for a funding mechanism that transfers
a set share of total current revenues of the government to a fund to finance TVET at the secondary
and post-secondary non-tertiary levels. In Costa Rica the legal framework for the country´s National
Training Institute (Instituto Nacional de Aprendizaje), provides that the institute will transfer a
specified share of its resources to finance formal TVET each year. Finally, in Guatemala a share of
the revenues generated by the value-added tax are allocated to specific ends, including financing
primary and technical education.
Table 2
Selected countries: Formal TVET financing measures
Country Law/measure Resource allocation Revenue
percent of GDP (2017)
Argentina Ley de Educacion Tecnico
Profesional (Ley 26.058)
0.2% of all current revenues
of the consolidated annual budget
of the national public sector will be
transferred to the National Fund for
Technical and Occupational Education.
0.4
Costa Rica Reglamento a Ley para el
Financiamiento y Desarrollo de la
Educación Técnica Profesional
(N° 23258-MEP)
5% of the ordinary yearly budget
of the National Training Institute (INA),
which will be taken from the
accumulated surplus, or in the case
of no surplus, from the annual
revenues.
0.02
Guatemala Ley del Impuesto al Valor
Agregado (Decree number 27-92)
Value-added tax, 0.5 percentage
points of the 12% general rate is ear-
marked for programmes and projects
for primary and technical education.
0.2
Source: Author´s elaboration on the basis of national legislation.
With regards to the financing of non-formal TVET, the region has a long history with the use
of payroll taxes to support national training institutions (the so-called Latin American model). The
tax base for this type of instrument is typically the overall wage bill of an employer or the gross
wages and salaries of an employee. As table 3 shows, the use of payroll tax instruments for TVET is
widespread in the region. Although employers are generally the entity that pays the tax —at rates
between 0.5% and 3.0%— it’s true burden rests nearly entirely on workers in the form of lower
wages. In some cases, employees also contribute a share of their own wages and salaries, although
this is rare for TVET financing in the region.
At the country level the revenues mobilized by these instruments varies significantly,
reflecting various factors, such as the size of the formal sector, the size of the tax base (specific to
a sector or economy wide) and the tax rate, among others. As figure 5 highlights, revenues for
payroll taxes that specifically target TVET range from relatively small to economically significant. In
Peru, the low level of revenues from this instrument (0.01% of GDP in 2017), is the largely the result
of a reduced tax based (limited to manufacturing firms with more than 20 employees) and a low
tax rate of 0.75%. In a similar vein, in Uruguay the low tax rate of this instrument results in lower
revenue flows.
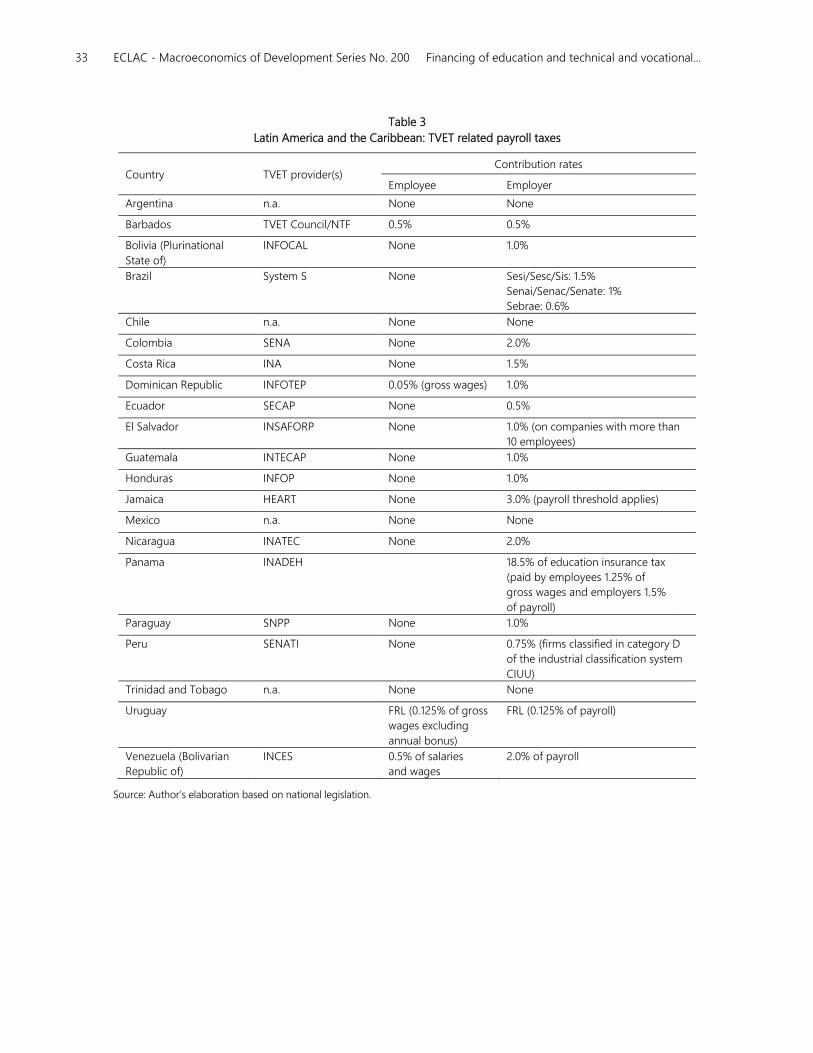
33 ECLAC - Macroeconomics of Development Series No. 200 Financing of education and technical and vocational...
Table 3
Latin America and the Caribbean: TVET related payroll taxes
Country TVET provider(s) Contribution rates
Employee Employer
Argentina n.a. None None
Barbados TVET Council/NTF 0.5% 0.5%
Bolivia (Plurinational
State of)
INFOCAL None 1.0%
Brazil System S None Sesi/Sesc/Sis: 1.5%
Senai/Senac/Senate: 1%
Sebrae: 0.6%
Chile n.a. None None
Colombia SENA None 2.0%
Costa Rica INA None 1.5%
Dominican Republic INFOTEP 0.05% (gross wages) 1.0%
Ecuador SECAP None 0.5%
El Salvador INSAFORP None 1.0% (on companies with more than
10 employees)
Guatemala INTECAP None 1.0%
Honduras INFOP None 1.0%
Jamaica HEART None 3.0% (payroll threshold applies)
Mexico n.a. None None
Nicaragua INATEC None 2.0%
Panama INADEH 18.5% of education insurance tax
(paid by employees 1.25% of
gross wages and employers 1.5%
of payroll)
Paraguay SNPP None 1.0%
Peru SENATI None 0.75% (firms classified in category D
of the industrial classification system
CIUU)
Trinidad and Tobago n.a. None None
Uruguay FRL (0.125% of gross
wages excluding
annual bonus)
FRL (0.125% of payroll)
Venezuela (Bolivarian
Republic of)
INCES 0.5% of salaries
and wages
2.0% of payroll
Source: Author’s elaboration based on national legislation.
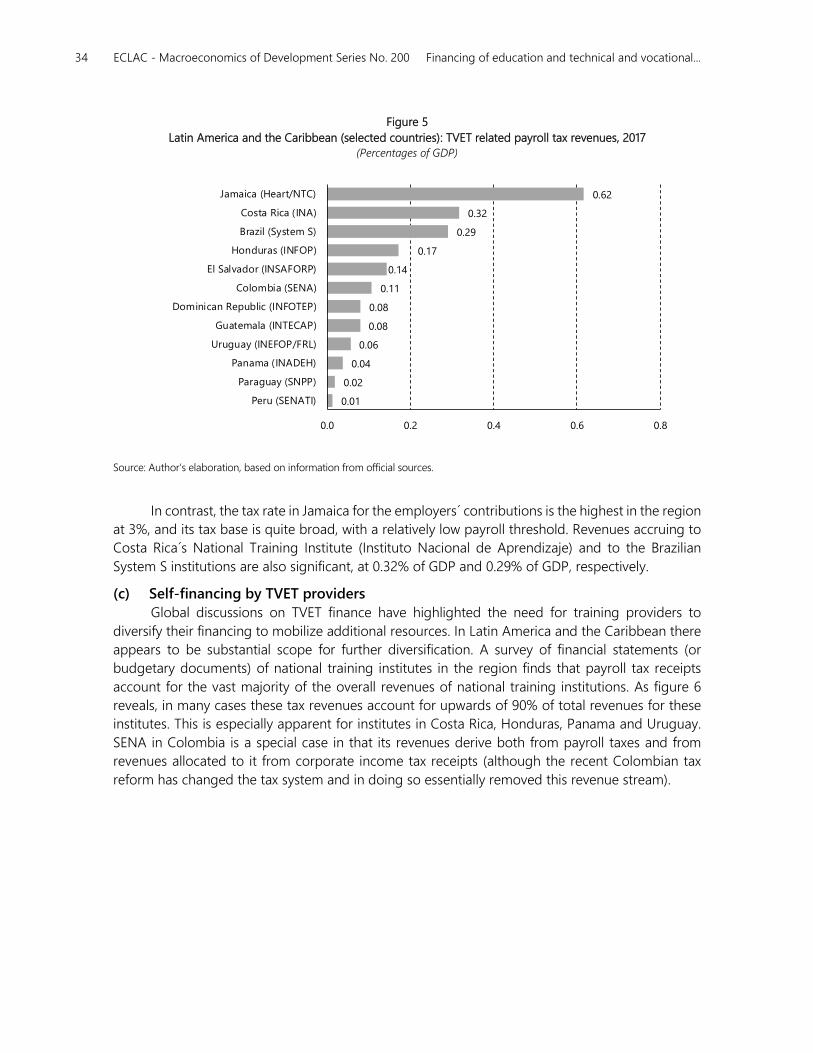
34 ECLAC - Macroeconomics of Development Series No. 200 Financing of education and technical and vocational...
Figure 5
Latin America and the Caribbean (selected countries): TVET related payroll tax revenues, 2017 (Percentages of GDP)
Source: Author’s elaboration, based on information from official sources.
In contrast, the tax rate in Jamaica for the employers´ contributions is the highest in the region
at 3%, and its tax base is quite broad, with a relatively low payroll threshold. Revenues accruing to
Costa Rica´s National Training Institute (Instituto Nacional de Aprendizaje) and to the Brazilian
System S institutions are also significant, at 0.32% of GDP and 0.29% of GDP, respectively.
(c) Self-financing by TVET providers
Global discussions on TVET finance have highlighted the need for training providers to
diversify their financing to mobilize additional resources. In Latin America and the Caribbean there
appears to be substantial scope for further diversification. A survey of financial statements (or
budgetary documents) of national training institutes in the region finds that payroll tax receipts
account for the vast majority of the overall revenues of national training institutions. As figure 6
reveals, in many cases these tax revenues account for upwards of 90% of total revenues for these
institutes. This is especially apparent for institutes in Costa Rica, Honduras, Panama and Uruguay.
SENA in Colombia is a special case in that its revenues derive both from payroll taxes and from
revenues allocated to it from corporate income tax receipts (although the recent Colombian tax
reform has changed the tax system and in doing so essentially removed this revenue stream).
0.01
0.02
0.04
0.06
0.08
0.08
0.11
0.14
0.17
0.29
0.32
0.62
0.0 0.2 0.4 0.6 0.8
Peru (SENATI)
Paraguay (SNPP)
Panama (INADEH)
Uruguay (INEFOP/FRL)
Guatemala (INTECAP)
Dominican Republic (INFOTEP)
Colombia (SENA)
El Salvador (INSAFORP)
Honduras (INFOP)
Brazil (System S)
Costa Rica (INA)
Jamaica (Heart/NTC)
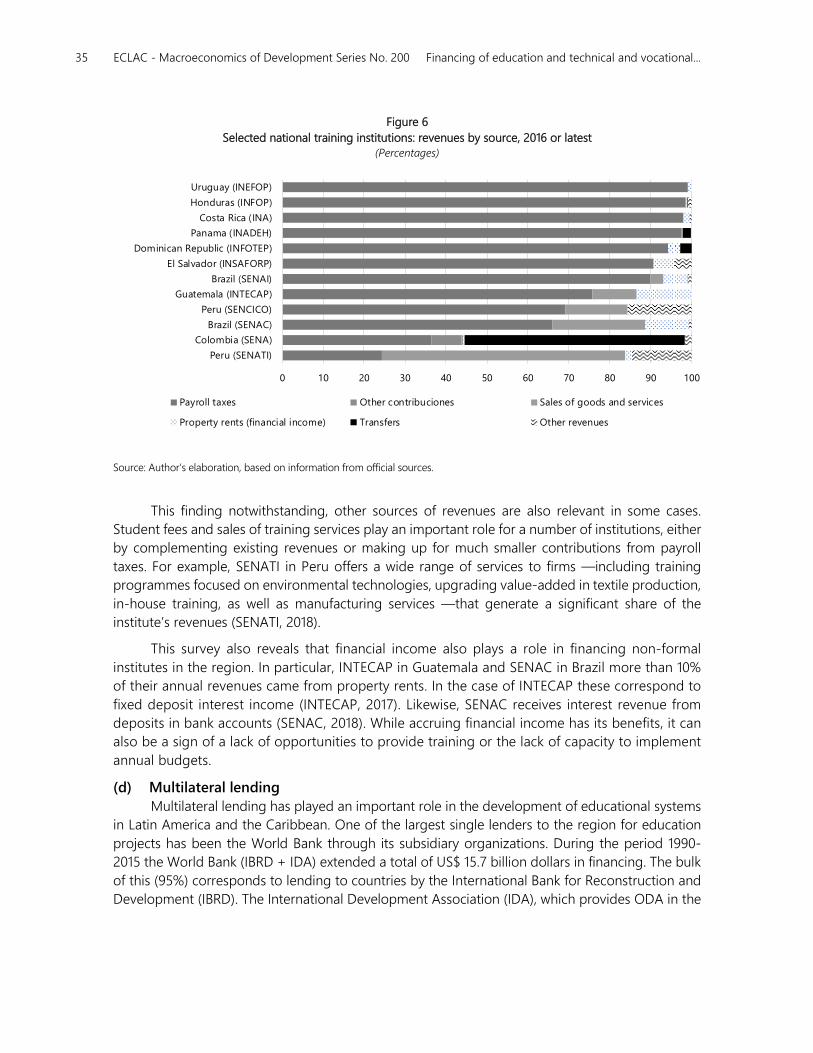
35 ECLAC - Macroeconomics of Development Series No. 200 Financing of education and technical and vocational...
Figure 6
Selected national training institutions: revenues by source, 2016 or latest (Percentages)
Source: Author’s elaboration, based on information from official sources.
This finding notwithstanding, other sources of revenues are also relevant in some cases.
Student fees and sales of training services play an important role for a number of institutions, either
by complementing existing revenues or making up for much smaller contributions from payroll
taxes. For example, SENATI in Peru offers a wide range of services to firms —including training
programmes focused on environmental technologies, upgrading value-added in textile production,
in-house training, as well as manufacturing services —that generate a significant share of the
institute’s revenues (SENATI, 2018).
This survey also reveals that financial income also plays a role in financing non-formal
institutes in the region. In particular, INTECAP in Guatemala and SENAC in Brazil more than 10%
of their annual revenues came from property rents. In the case of INTECAP these correspond to
fixed deposit interest income (INTECAP, 2017). Likewise, SENAC receives interest revenue from
deposits in bank accounts (SENAC, 2018). While accruing financial income has its benefits, it can
also be a sign of a lack of opportunities to provide training or the lack of capacity to implement
annual budgets.
(d) Multilateral lending
Multilateral lending has played an important role in the development of educational systems
in Latin America and the Caribbean. One of the largest single lenders to the region for education
projects has been the World Bank through its subsidiary organizations. During the period 1990-
2015 the World Bank (IBRD + IDA) extended a total of US$ 15.7 billion dollars in financing. The bulk
of this (95%) corresponds to lending to countries by the International Bank for Reconstruction and
Development (IBRD). The International Development Association (IDA), which provides ODA in the
0 10 20 30 40 50 60 70 80 90 100
Peru (SENATI)
Colombia (SENA)
Brazil (SENAC)
Peru (SENCICO)
Guatemala (INTECAP)
Brazil (SENAI)
El Salvador (INSAFORP)
Dominican Republic (INFOTEP)
Panama (INADEH)
Costa Rica (INA)
Honduras (INFOP)
Uruguay (INEFOP)
Payroll taxes Other contribuciones Sales of goods and services
Property rents (financial income) Transfers Other revenues
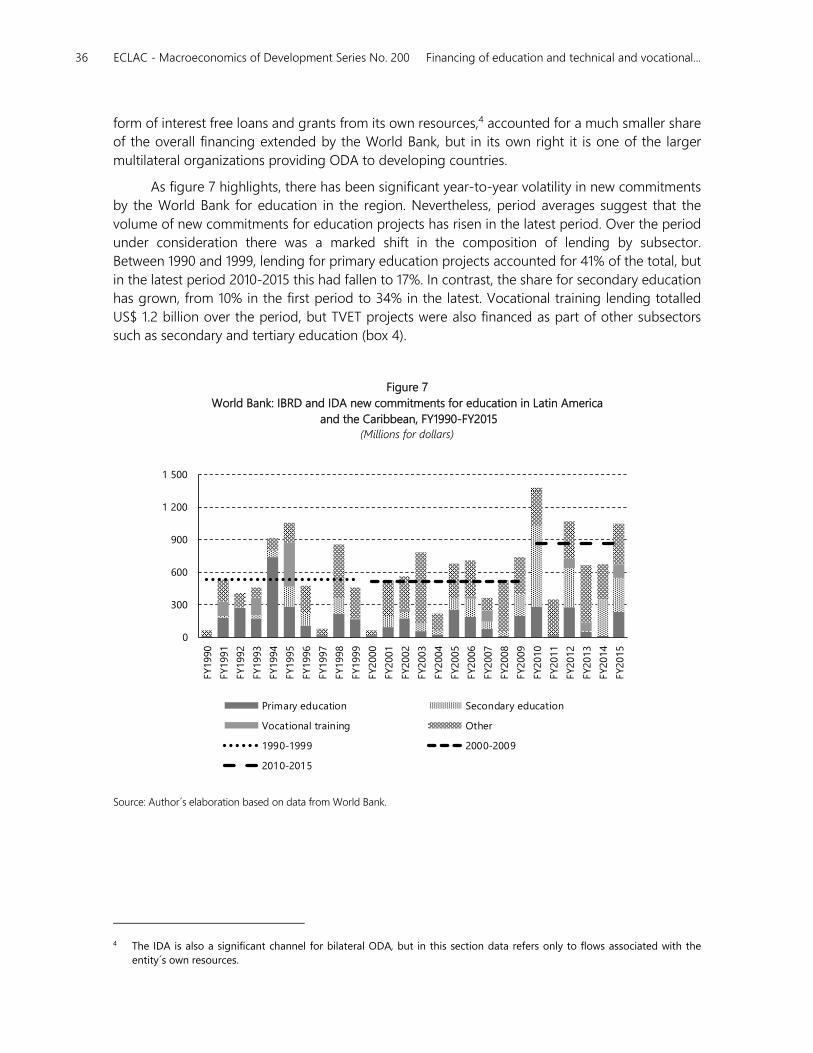
36 ECLAC - Macroeconomics of Development Series No. 200 Financing of education and technical and vocational...
form of interest free loans and grants from its own resources,4 accounted for a much smaller share
of the overall financing extended by the World Bank, but in its own right it is one of the larger
multilateral organizations providing ODA to developing countries.
As figure 7 highlights, there has been significant year-to-year volatility in new commitments
by the World Bank for education in the region. Nevertheless, period averages suggest that the
volume of new commitments for education projects has risen in the latest period. Over the period
under consideration there was a marked shift in the composition of lending by subsector.
Between 1990 and 1999, lending for primary education projects accounted for 41% of the total, but
in the latest period 2010-2015 this had fallen to 17%. In contrast, the share for secondary education
has grown, from 10% in the first period to 34% in the latest. Vocational training lending totalled
US$ 1.2 billion over the period, but TVET projects were also financed as part of other subsectors
such as secondary and tertiary education (box 4).
Figure 7
World Bank: IBRD and IDA new commitments for education in Latin America
and the Caribbean, FY1990-FY2015 (Millions for dollars)
Source: Author´s elaboration based on data from World Bank.
4 The IDA is also a significant channel for bilateral ODA, but in this section data refers only to flows associated with the
entity´s own resources.
0
300
600
900
1 200
1 500
FY1990
FY1991
FY1992
FY1993
FY1994
FY1995
FY1996
FY1997
FY1998
FY1999
FY2000
FY2001
FY2002
FY2003
FY2004
FY2005
FY2006
FY2007
FY2008
FY2009
FY2010
FY2011
FY2012
FY2013
FY2014
FY2015
Primary education Secondary education
Vocational training Other
1990-1999 2000-2009
2010-2015
37 ECLAC - Macroeconomics of Development Series No. 200 Financing of education and technical and vocational...
Box 4
Transformation of the Tertiary Technical and Technological Institutes Project in Ecuador
The Project to Restructure Public Higher Technical and Technological Education, which is implemented by
the Secretariat of Higher Education, Science and Technology (SENESCYT), will work to improve technical and
technological education services in the provinces, education quality and administrative capabilities of institutes;
to train teachers and directors; and to strengthen institutional coordination mechanisms with the private sector.
It also includes a gender plan to monitor access and attendance rates of female students to promote equal access
to technical education.
According to the national government, this financing will promote the development of human talent
associated with the change in the productive structure. A key project activity will be supporting the design of a
study plan aligned with the needs of the labor market. The project will also provide adequate infrastructure to
facilitate learning, promote linkages between secondary and higher education and strengthen the management
of the country’s technical and technological education system.
This loan will be used to build and equip 11 technical institutes in the provinces of Bolívar, El Oro, Guayas,
Manabí, Pichincha, Tungurahua and Sucumbíos.
This project seeks to train workers with the skills the labour market requires. The total World Bank loan is
US$102.47 million (which was classified as tertiary lending), of which SENESCYT will contribute US$11.97 million.
The project is expected to be completed by 2021. The loan term is 35 -year maturity, including a 17-year
grace period.
Source: World Bank.
2. Education initial financing
Overall education expenditures by governments in Latin America and the Caribbean are
significant, averaging 5.0% of GDP in 2016. As figure 8 highlights, this average belies a
heterogeneity of levels between countries, with outlays ranging from 2.9% of GDP in Guatemala
and Haiti to 10.0% of GDP in Cuba. Unlike other fiscal indicators —such as tax revenues— which
exhibit a significant bias between subregions, educational spending as a share of GDP is roughly
equal between South America (5.2% of GDP average in 2016) and the group of countries
comprised by Central America, Cuba, Dominican Republic, Haiti and Mexico (4.8% of GDP).
However, removing Cuba which is clearly and outlier from the second group results in a much
lower average for educational outlays: 4.2%.
Beyond their sheer economic weight, as measured as a share of GDP, education expenditures
also represent a significant share of overall public expenditure. As seen in figure 9, education outlays
in Latin America account for 18% of government expenditures. Of note, several countries whose
expenditures as a share of GDP were less than average, dedicate a very significant share of their
overall outlays to education. For example, of the countries examined, the lowest value of education
expenditures by share of GDP was in Guatemala (2.9%), however these expenditures represented
24% of overall public expenditure. In contrast, countries where social protection and health
expenditures are high —Argentina, Brazil, Costa Rica and Uruguay— all registered below average
results for this indicator.
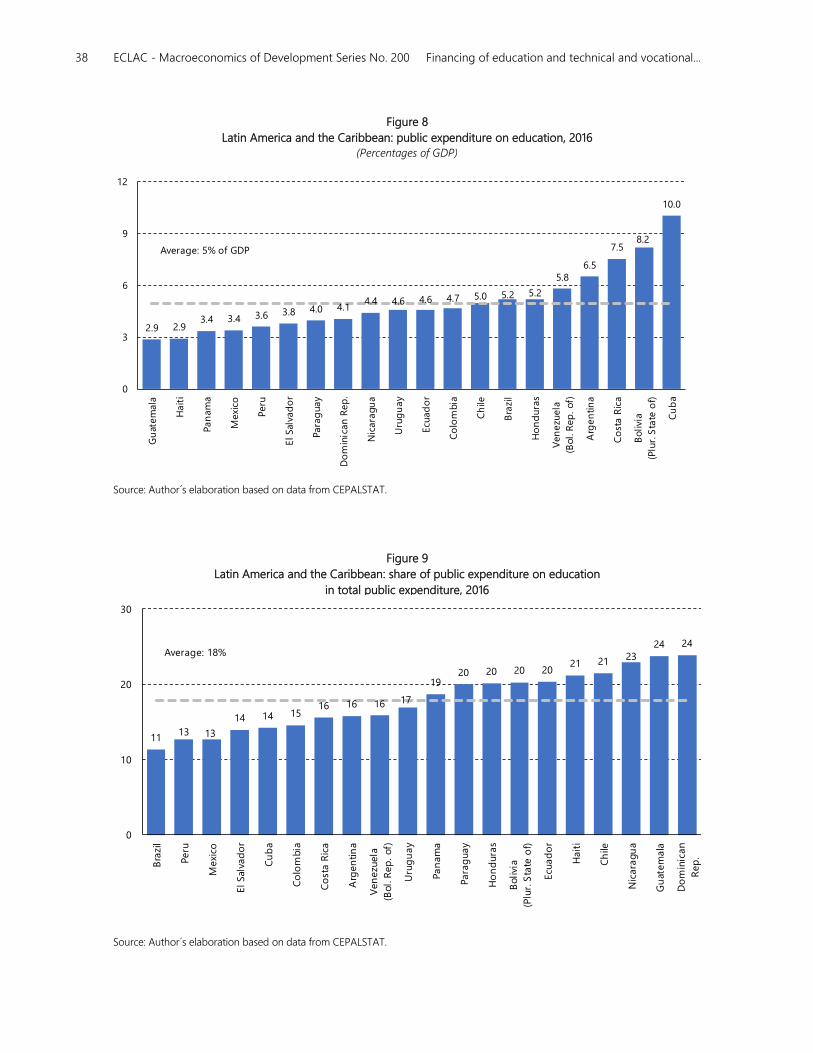
38 ECLAC - Macroeconomics of Development Series No. 200 Financing of education and technical and vocational...
Figure 8
Latin America and the Caribbean: public expenditure on education, 2016 (Percentages of GDP)
Source: Author´s elaboration based on data from CEPALSTAT.
Figure 9
Latin America and the Caribbean: share of public expenditure on education
in total public expenditure, 2016 (Percentages)
Source: Author´s elaboration based on data from CEPALSTAT.
1113 13
14 14 1516 16 16 17
1920 20 20 20
21 21 2324 24
0
10
20
30
Bra
zil
Peru
Mexi
co
El Sal
vad
or
Cu
ba
Co
lom
bia
Co
sta R
ica
Arg
en
tin
a
Ven
ezu
ela
(Bol.
Rep
. of)
Uru
gu
ay
Pa
nam
a
Para
guay
Ho
nd
ura
s
Bolivi
a
(Plu
r. S
tate
of)
Ecu
ad
or
Hait
i
Ch
ile
Nic
ara
gu
a
Gu
atem
ala
Do
min
ican
Rep
.
Average: 18%
2.9 2.93.4 3.4 3.6 3.8 4.0 4.1
4.4 4.6 4.6 4.7 5.0 5.2 5.2
5.86.5
7.58.2
10.0
0
3
6
9
12
Gu
ate
mala
Ha
iti
Pa
nam
a
Mexi
co
Peru
El Sal
vad
or
Para
guay
Do
min
ican
Rep
.
Nic
ara
gu
a
Uru
gu
ay
Ecu
ad
or
Co
lom
bia
Ch
ile
Bra
zil
Ho
nd
ura
s
Ven
ezu
ela
(Bol.
Rep
. of)
Arg
en
tin
a
Co
sta
Ric
a
Bo
livi
a
(Plu
r. S
tate
of)
Cu
ba
Average: 5% of GDP
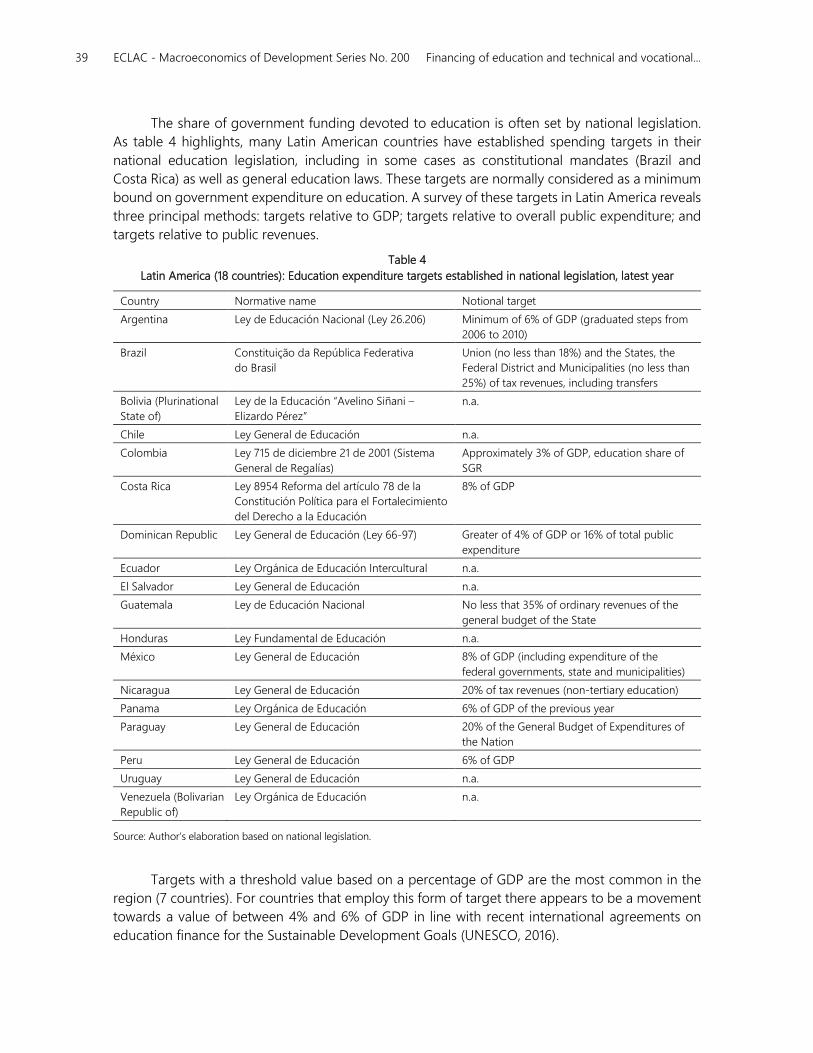
39 ECLAC - Macroeconomics of Development Series No. 200 Financing of education and technical and vocational...
The share of government funding devoted to education is often set by national legislation.
As table 4 highlights, many Latin American countries have established spending targets in their
national education legislation, including in some cases as constitutional mandates (Brazil and
Costa Rica) as well as general education laws. These targets are normally considered as a minimum
bound on government expenditure on education. A survey of these targets in Latin America reveals
three principal methods: targets relative to GDP; targets relative to overall public expenditure; and
targets relative to public revenues.
Table 4
Latin America (18 countries): Education expenditure targets established in national legislation, latest year
Country Normative name Notional target
Argentina Ley de Educación Nacional (Ley 26.206) Minimum of 6% of GDP (graduated steps from
2006 to 2010)
Brazil Constituição da República Federativa
do Brasil
Union (no less than 18%) and the States, the
Federal District and Municipalities (no less than
25%) of tax revenues, including transfers
Bolivia (Plurinational
State of)
Ley de la Educación “Avelino Siñani –
Elizardo Pérez”
n.a.
Chile Ley General de Educación n.a.
Colombia Ley 715 de diciembre 21 de 2001 (Sistema
General de Regalías)
Approximately 3% of GDP, education share of
SGR
Costa Rica Ley 8954 Reforma del artículo 78 de la
Constitución Política para el Fortalecimiento
del Derecho a la Educación
8% of GDP
Dominican Republic Ley General de Educación (Ley 66-97) Greater of 4% of GDP or 16% of total public
expenditure
Ecuador Ley Orgánica de Educación Intercultural n.a.
El Salvador Ley General de Educación n.a.
Guatemala Ley de Educación Nacional No less that 35% of ordinary revenues of the
general budget of the State
Honduras Ley Fundamental de Educación n.a.
México Ley General de Educación 8% of GDP (including expenditure of the
federal governments, state and municipalities)
Nicaragua Ley General de Educación 20% of tax revenues (non-tertiary education)
Panama Ley Orgánica de Educación 6% of GDP of the previous year
Paraguay Ley General de Educación 20% of the General Budget of Expenditures of
the Nation
Peru Ley General de Educación 6% of GDP
Uruguay Ley General de Educación n.a.
Venezuela (Bolivarian
Republic of)
Ley Orgánica de Educación n.a.
Source: Author’s elaboration based on national legislation.
Targets with a threshold value based on a percentage of GDP are the most common in the
region (7 countries). For countries that employ this form of target there appears to be a movement
towards a value of between 4% and 6% of GDP in line with recent international agreements on
education finance for the Sustainable Development Goals (UNESCO, 2016).
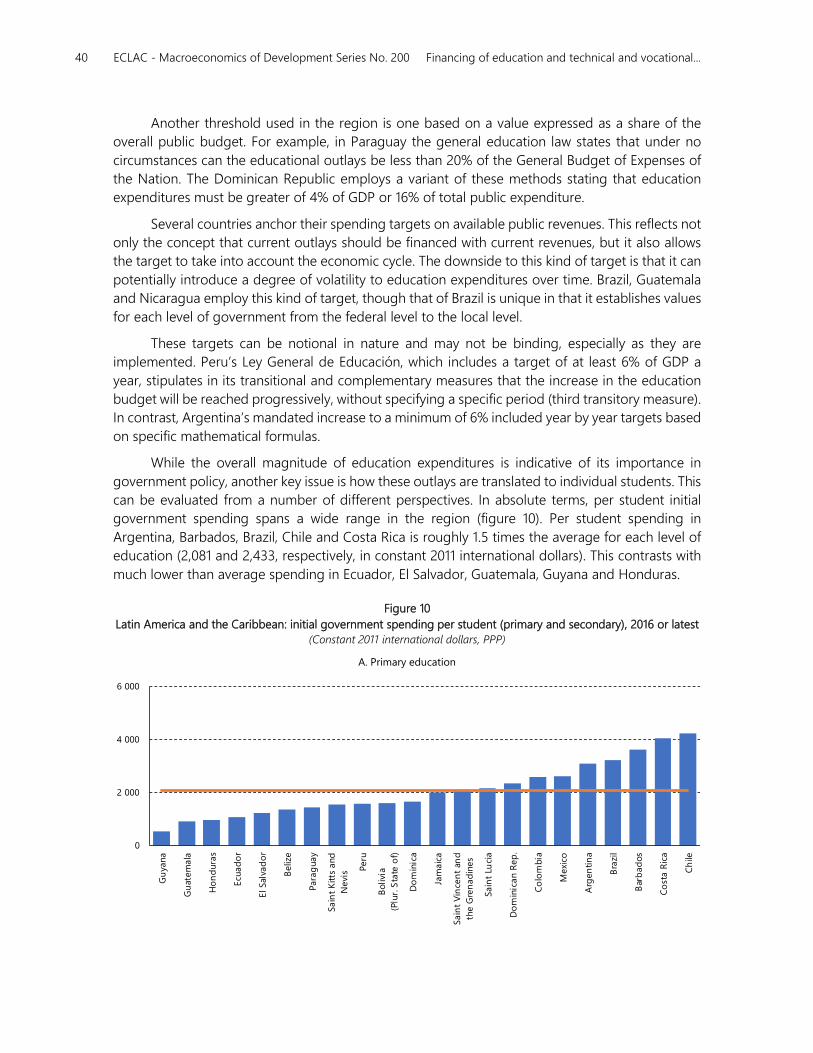
40 ECLAC - Macroeconomics of Development Series No. 200 Financing of education and technical and vocational...
Another threshold used in the region is one based on a value expressed as a share of the
overall public budget. For example, in Paraguay the general education law states that under no
circumstances can the educational outlays be less than 20% of the General Budget of Expenses of
the Nation. The Dominican Republic employs a variant of these methods stating that education
expenditures must be greater of 4% of GDP or 16% of total public expenditure.
Several countries anchor their spending targets on available public revenues. This reflects not
only the concept that current outlays should be financed with current revenues, but it also allows
the target to take into account the economic cycle. The downside to this kind of target is that it can
potentially introduce a degree of volatility to education expenditures over time. Brazil, Guatemala
and Nicaragua employ this kind of target, though that of Brazil is unique in that it establishes values
for each level of government from the federal level to the local level.
These targets can be notional in nature and may not be binding, especially as they are
implemented. Peru’s Ley General de Educación, which includes a target of at least 6% of GDP a
year, stipulates in its transitional and complementary measures that the increase in the education
budget will be reached progressively, without specifying a specific period (third transitory measure).
In contrast, Argentina’s mandated increase to a minimum of 6% included year by year targets based
on specific mathematical formulas.
While the overall magnitude of education expenditures is indicative of its importance in
government policy, another key issue is how these outlays are translated to individual students. This
can be evaluated from a number of different perspectives. In absolute terms, per student initial
government spending spans a wide range in the region (figure 10). Per student spending in
Argentina, Barbados, Brazil, Chile and Costa Rica is roughly 1.5 times the average for each level of
education (2,081 and 2,433, respectively, in constant 2011 international dollars). This contrasts with
much lower than average spending in Ecuador, El Salvador, Guatemala, Guyana and Honduras.
Figure 10
Latin America and the Caribbean: initial government spending per student (primary and secondary), 2016 or latest (Constant 2011 international dollars, PPP)
A. Primary education
0
2 000
4 000
6 000
Gu
yana
Gu
atem
ala
Ho
nd
ura
s
Ecu
ad
or
El Sal
vad
or
Beliz
e
Para
guay
Sain
t K
itts
and
Nevi
s Peru
Bolivi
a
(Plu
r. S
tate
of)
Do
min
ica
Jam
aic
a
Sain
t V
ince
nt
and
the G
ren
ad
ines
Sain
t Lu
cia
Do
min
ican R
ep
.
Co
lom
bia
Mexi
co
Arg
en
tin
a
Bra
zil
Bar
bad
os
Co
sta R
ica
Ch
ile
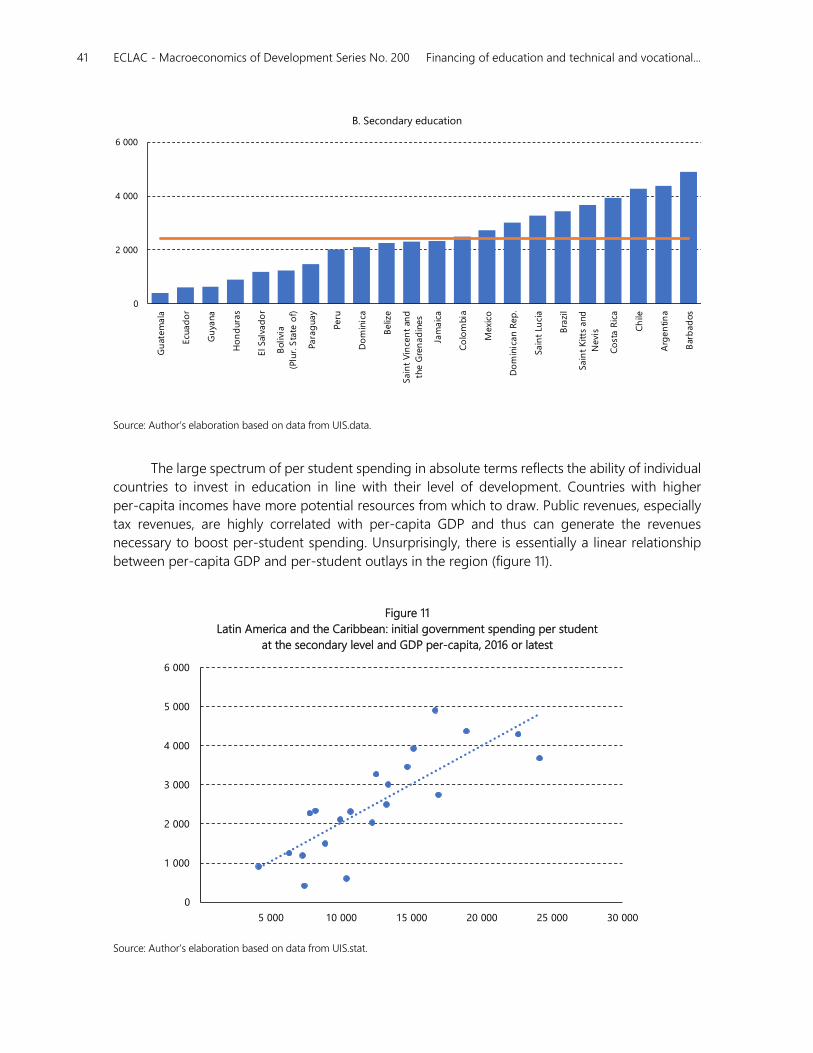
41 ECLAC - Macroeconomics of Development Series No. 200 Financing of education and technical and vocational...
B. Secondary education
Source: Author’s elaboration based on data from UIS.data.
The large spectrum of per student spending in absolute terms reflects the ability of individual
countries to invest in education in line with their level of development. Countries with higher
per-capita incomes have more potential resources from which to draw. Public revenues, especially
tax revenues, are highly correlated with per-capita GDP and thus can generate the revenues
necessary to boost per-student spending. Unsurprisingly, there is essentially a linear relationship
between per-capita GDP and per-student outlays in the region (figure 11).
Figure 11
Latin America and the Caribbean: initial government spending per student
at the secondary level and GDP per-capita, 2016 or latest (Constant 2011 international dollars, PPP)
Source: Author’s elaboration based on data from UIS.stat.
0
1 000
2 000
3 000
4 000
5 000
6 000
5 000 10 000 15 000 20 000 25 000 30 000
0
2 000
4 000
6 000
Gu
atem
ala
Ecu
ad
or
Gu
yana
Ho
nd
ura
s
El Sal
vad
or
Bolivi
a
(Plu
r. S
tate
of)
Para
guay
Peru
Do
min
ica
Beliz
e
Sain
t V
ince
nt
and
the G
ren
ad
ines
Jam
aic
a
Co
lom
bia
Mexi
co
Do
min
ican R
ep
.
Sain
t Lu
cia
Bra
zil
Sain
t K
itts
and
Nevi
s
Co
sta R
ica
Ch
ile
Arg
en
tin
a
Bar
bad
os
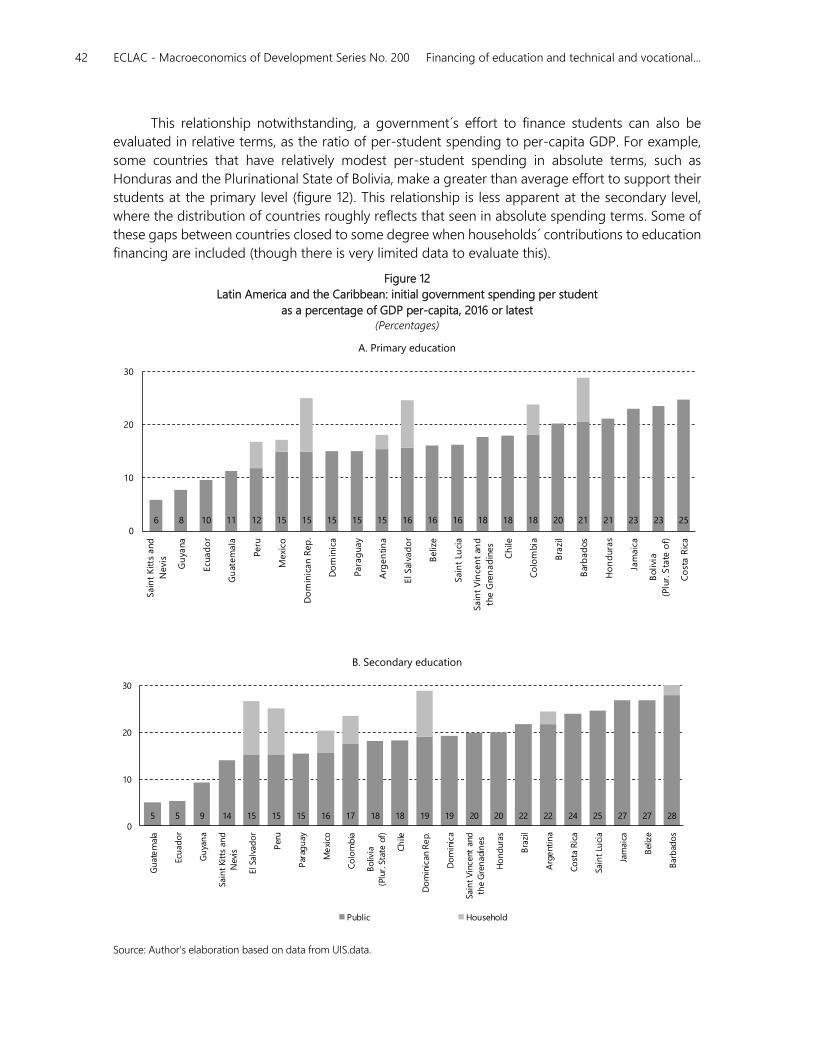
42 ECLAC - Macroeconomics of Development Series No. 200 Financing of education and technical and vocational...
This relationship notwithstanding, a government´s effort to finance students can also be
evaluated in relative terms, as the ratio of per-student spending to per-capita GDP. For example,
some countries that have relatively modest per-student spending in absolute terms, such as
Honduras and the Plurinational State of Bolivia, make a greater than average effort to support their
students at the primary level (figure 12). This relationship is less apparent at the secondary level,
where the distribution of countries roughly reflects that seen in absolute spending terms. Some of
these gaps between countries closed to some degree when households´ contributions to education
financing are included (though there is very limited data to evaluate this).
Figure 12
Latin America and the Caribbean: initial government spending per student
as a percentage of GDP per-capita, 2016 or latest (Percentages)
A. Primary education
B. Secondary education
Source: Author’s elaboration based on data from UIS.data.
5 5 9 14 15 15 15 16 17 18 18 19 19 20 20 22 22 24 25 27 27 280
10
20
30
Gu
ate
mala
Ecu
ad
or
Gu
yan
a
Sain
t Kit
ts a
nd
Nevi
s
El Sa
lvad
or
Peru
Par
agu
ay
Me
xico
Co
lom
bia
Bo
livia
(Plu
r. S
tate
of)
Ch
ile
Do
min
ican
Re
p.
Do
min
ica
Sain
t V
ince
nt
and
the G
ren
adi
nes
Ho
nd
ura
s
Bra
zil
Arg
enti
na
Co
sta R
ica
Sain
t Lu
cia
Jam
aic
a
Bel
ize
Bar
bad
os
Public Household
6 8 10 11 12 15 15 15 15 15 16 16 16 18 18 18 20 21 21 23 23 250
10
20
30
Sain
t K
itts
and
Nevi
s
Gu
yana
Ecu
ad
or
Gu
atem
ala
Peru
Mexi
co
Do
min
ican R
ep
.
Do
min
ica
Para
guay
Arg
en
tin
a
El Sal
vad
or
Beliz
e
Sain
t Lu
cia
Sain
t V
ince
nt
and
the G
ren
ad
ines
Ch
ile
Co
lom
bia
Bra
zil
Bar
bad
os
Ho
nd
ura
s
Jam
aic
a
Bolivi
a
(Plu
r. S
tate
of)
Co
sta R
ica
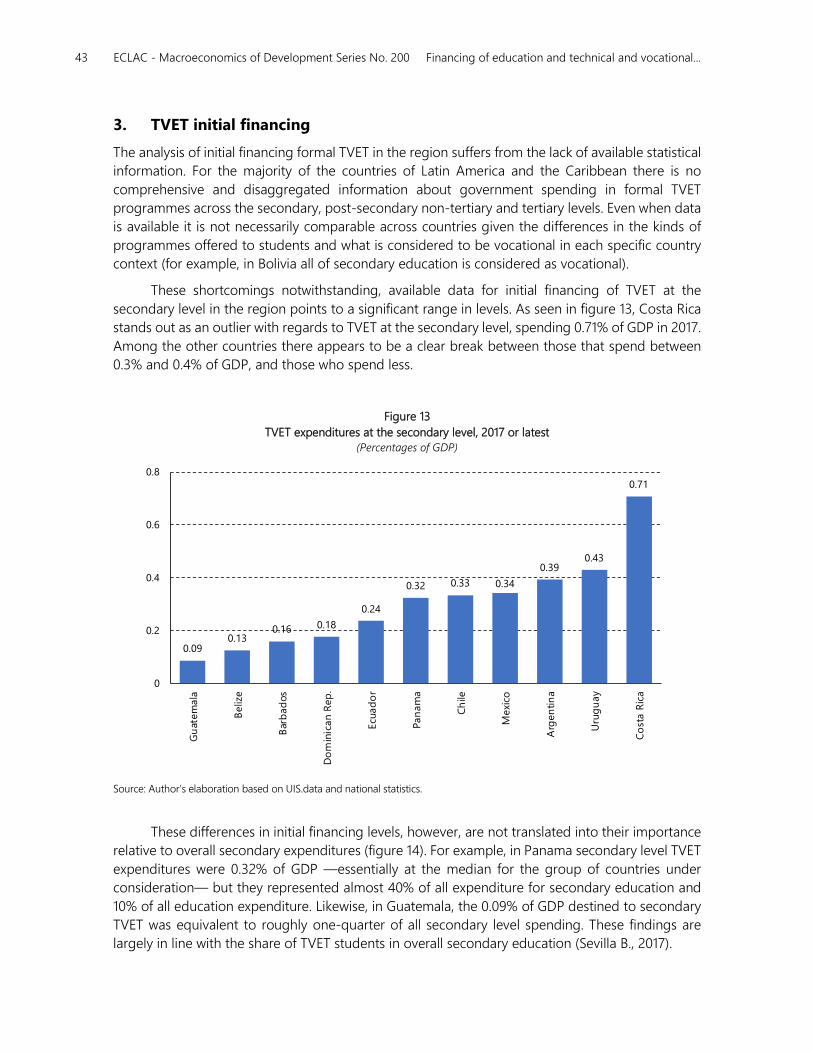
43 ECLAC - Macroeconomics of Development Series No. 200 Financing of education and technical and vocational...
3. TVET initial financing
The analysis of initial financing formal TVET in the region suffers from the lack of available statistical
information. For the majority of the countries of Latin America and the Caribbean there is no
comprehensive and disaggregated information about government spending in formal TVET
programmes across the secondary, post-secondary non-tertiary and tertiary levels. Even when data
is available it is not necessarily comparable across countries given the differences in the kinds of
programmes offered to students and what is considered to be vocational in each specific country
context (for example, in Bolivia all of secondary education is considered as vocational).
These shortcomings notwithstanding, available data for initial financing of TVET at the
secondary level in the region points to a significant range in levels. As seen in figure 13, Costa Rica
stands out as an outlier with regards to TVET at the secondary level, spending 0.71% of GDP in 2017.
Among the other countries there appears to be a clear break between those that spend between
0.3% and 0.4% of GDP, and those who spend less.
Figure 13
TVET expenditures at the secondary level, 2017 or latest (Percentages of GDP)
Source: Author’s elaboration based on UIS.data and national statistics.
These differences in initial financing levels, however, are not translated into their importance
relative to overall secondary expenditures (figure 14). For example, in Panama secondary level TVET
expenditures were 0.32% of GDP —essentially at the median for the group of countries under
consideration— but they represented almost 40% of all expenditure for secondary education and
10% of all education expenditure. Likewise, in Guatemala, the 0.09% of GDP destined to secondary
TVET was equivalent to roughly one-quarter of all secondary level spending. These findings are
largely in line with the share of TVET students in overall secondary education (Sevilla B., 2017).
0.090.13
0.16 0.18
0.24
0.32 0.33 0.34
0.390.43
0.71
0
0.2
0.4
0.6
0.8
Gu
atem
ala
Beliz
e
Bar
bad
os
Do
min
ican R
ep
.
Ecu
ad
or
Pan
am
a
Ch
ile
Mexi
co
Arg
en
tin
a
Uru
gu
ay
Co
sta R
ica
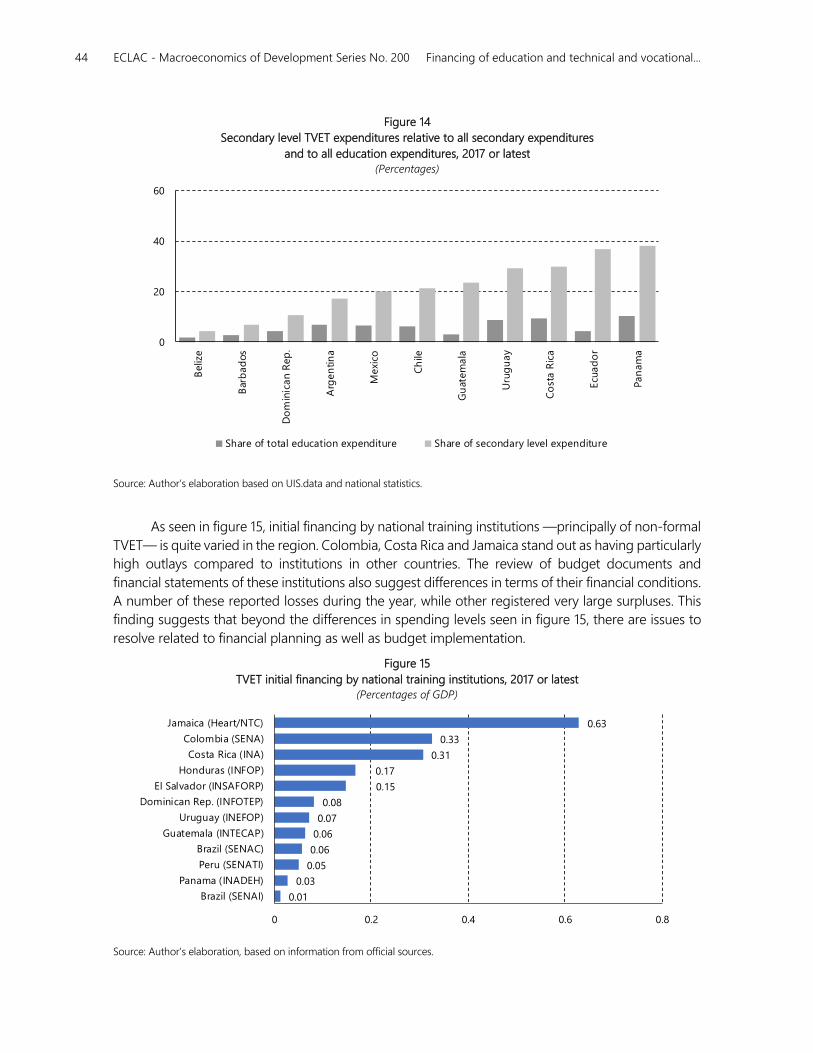
44 ECLAC - Macroeconomics of Development Series No. 200 Financing of education and technical and vocational...
0.01
0.03
0.05
0.06
0.06
0.07
0.08
0.15
0.17
0.31
0.33
0.63
0 0.2 0.4 0.6 0.8
Brazil (SENAI)
Panama (INADEH)
Peru (SENATI)
Brazil (SENAC)
Guatemala (INTECAP)
Uruguay (INEFOP)
Dominican Rep. (INFOTEP)
El Salvador (INSAFORP)
Honduras (INFOP)
Costa Rica (INA)
Colombia (SENA)
Jamaica (Heart/NTC)
Figure 14
Secondary level TVET expenditures relative to all secondary expenditures
and to all education expenditures, 2017 or latest (Percentages)
Source: Author’s elaboration based on UIS.data and national statistics.
As seen in figure 15, initial financing by national training institutions —principally of non-formal
TVET— is quite varied in the region. Colombia, Costa Rica and Jamaica stand out as having particularly
high outlays compared to institutions in other countries. The review of budget documents and
financial statements of these institutions also suggest differences in terms of their financial conditions.
A number of these reported losses during the year, while other registered very large surpluses. This
finding suggests that beyond the differences in spending levels seen in figure 15, there are issues to
resolve related to financial planning as well as budget implementation.
Figure 15
TVET initial financing by national training institutions, 2017 or latest (Percentages of GDP)
Source: Author’s elaboration, based on information from official sources.
0
20
40
60B
eliz
e
Bar
bad
os
Do
min
ican R
ep
.
Arg
en
tin
a
Mexi
co
Ch
ile
Gu
atem
ala
Uru
gu
ay
Co
sta R
ica
Ecu
ad
or
Pan
am
a
Share of total education expenditure Share of secondary level expenditure
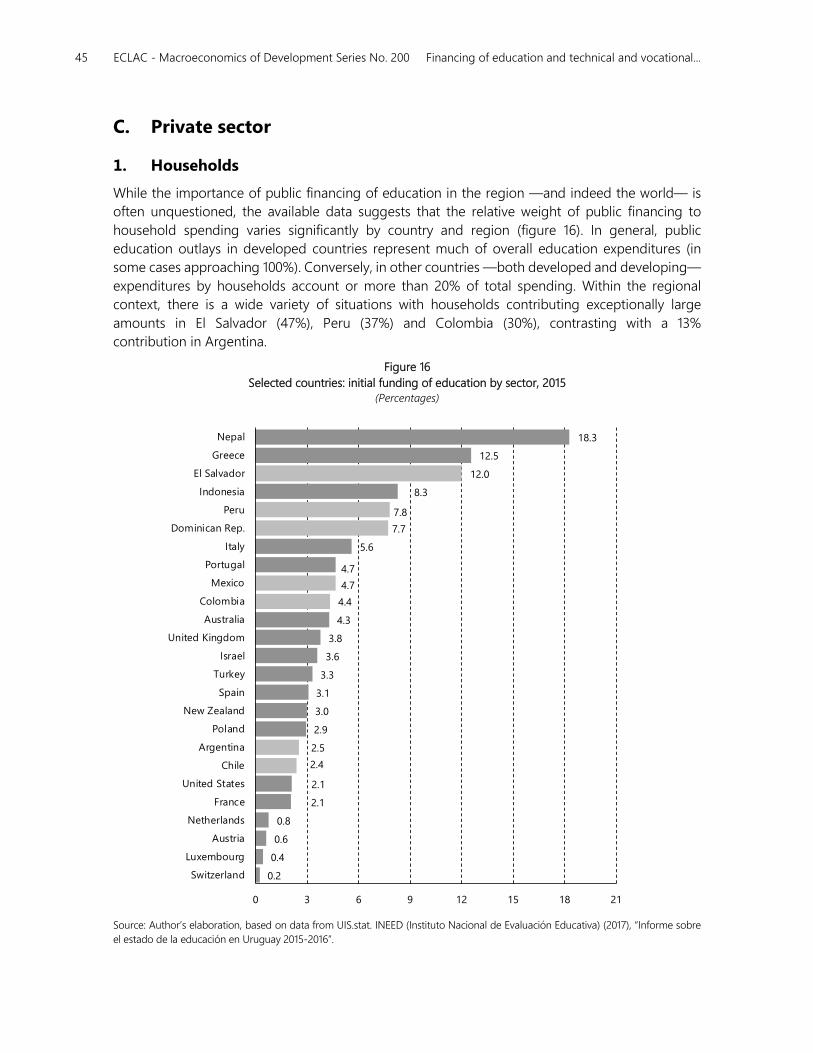
45 ECLAC - Macroeconomics of Development Series No. 200 Financing of education and technical and vocational...
C. Private sector
1. Households
While the importance of public financing of education in the region —and indeed the world— is
often unquestioned, the available data suggests that the relative weight of public financing to
household spending varies significantly by country and region (figure 16). In general, public
education outlays in developed countries represent much of overall education expenditures (in
some cases approaching 100%). Conversely, in other countries —both developed and developing—
expenditures by households account or more than 20% of total spending. Within the regional
context, there is a wide variety of situations with households contributing exceptionally large
amounts in El Salvador (47%), Peru (37%) and Colombia (30%), contrasting with a 13%
contribution in Argentina.
Figure 16
Selected countries: initial funding of education by sector, 2015 (Percentages)
Source: Author’s elaboration, based on data from UIS.stat. INEED (Instituto Nacional de Evaluación Educativa) (2017), “Informe sobre
el estado de la educación en Uruguay 2015-2016”.
0.2
0.4
0.6
0.8
2.1
2.1
2.9
3.0
3.1
3.3
3.6
3.8
4.3
4.7
5.6
8.3
12.5
18.3
2.4
2.5
4.4
4.7
7.7
7.8
12.0
0 3 6 9 12 15 18 21
Switzerland
Luxembourg
Austria
Netherlands
France
United States
Chile
Argentina
Poland
New Zealand
Spain
Turkey
Israel
United Kingdom
Australia
Colombia
Mexico
Portugal
Italy
Dominican Rep.
Peru
Indonesia
El Salvador
Greece
Nepal
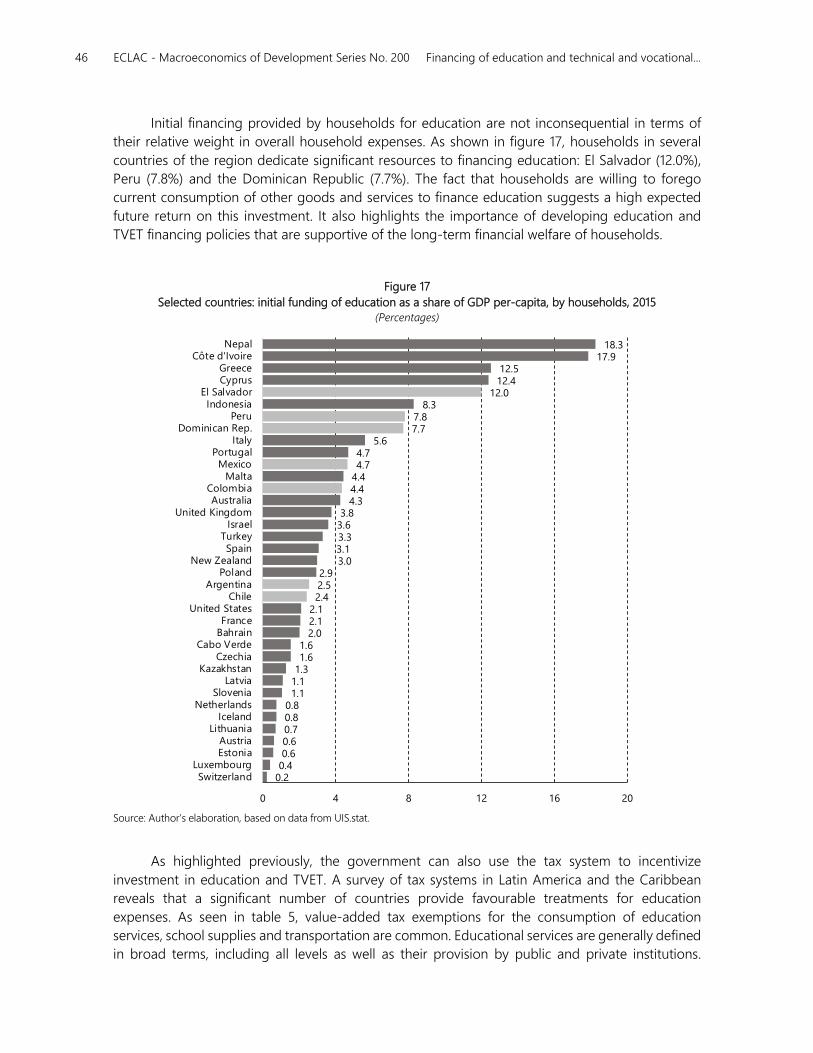
46 ECLAC - Macroeconomics of Development Series No. 200 Financing of education and technical and vocational...
0.20.40.60.60.70.80.81.11.11.31.61.6
2.02.12.1
2.93.03.13.33.63.8
4.3
4.4
4.75.6
8.3
12.412.5
17.918.3
2.42.5
4.4
4.7
7.77.8
12.0
0 4 8 12 16 20
SwitzerlandLuxembourg
EstoniaAustria
LithuaniaIceland
NetherlandsSlovenia
LatviaKazakhstan
CzechiaCabo Verde
BahrainFrance
United StatesChile
ArgentinaPoland
New ZealandSpain
TurkeyIsrael
United KingdomAustralia
ColombiaMalta
MexicoPortugal
ItalyDominican Rep.
PeruIndonesia
El SalvadorCyprusGreece
Côte d'IvoireNepal
Initial financing provided by households for education are not inconsequential in terms of
their relative weight in overall household expenses. As shown in figure 17, households in several
countries of the region dedicate significant resources to financing education: El Salvador (12.0%),
Peru (7.8%) and the Dominican Republic (7.7%). The fact that households are willing to forego
current consumption of other goods and services to finance education suggests a high expected
future return on this investment. It also highlights the importance of developing education and
TVET financing policies that are supportive of the long-term financial welfare of households.
Figure 17
Selected countries: initial funding of education as a share of GDP per-capita, by households, 2015 (Percentages)
Source: Author’s elaboration, based on data from UIS.stat.
As highlighted previously, the government can also use the tax system to incentivize
investment in education and TVET. A survey of tax systems in Latin America and the Caribbean
reveals that a significant number of countries provide favourable treatments for education
expenses. As seen in table 5, value-added tax exemptions for the consumption of education
services, school supplies and transportation are common. Educational services are generally defined
in broad terms, including all levels as well as their provision by public and private institutions.
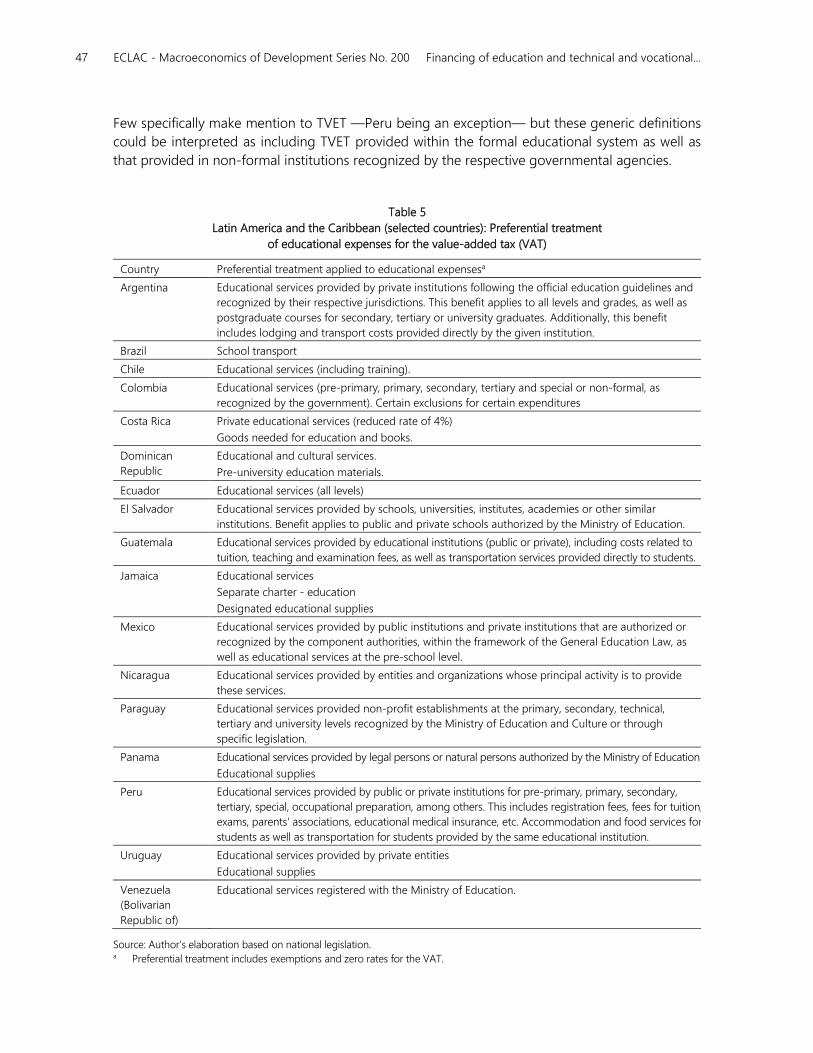
47 ECLAC - Macroeconomics of Development Series No. 200 Financing of education and technical and vocational...
Few specifically make mention to TVET —Peru being an exception— but these generic definitions
could be interpreted as including TVET provided within the formal educational system as well as
that provided in non-formal institutions recognized by the respective governmental agencies.
Table 5
Latin America and the Caribbean (selected countries): Preferential treatment
of educational expenses for the value-added tax (VAT)
Country Preferential treatment applied to educational expensesa
Argentina Educational services provided by private institutions following the official education guidelines and
recognized by their respective jurisdictions. This benefit applies to all levels and grades, as well as
postgraduate courses for secondary, tertiary or university graduates. Additionally, this benefit
includes lodging and transport costs provided directly by the given institution.
Brazil School transport
Chile Educational services (including training).
Colombia Educational services (pre-primary, primary, secondary, tertiary and special or non-formal, as
recognized by the government). Certain exclusions for certain expenditures
Costa Rica Private educational services (reduced rate of 4%)
Goods needed for education and books.
Dominican
Republic
Educational and cultural services.
Pre-university education materials.
Ecuador Educational services (all levels)
El Salvador Educational services provided by schools, universities, institutes, academies or other similar
institutions. Benefit applies to public and private schools authorized by the Ministry of Education.
Guatemala Educational services provided by educational institutions (public or private), including costs related to
tuition, teaching and examination fees, as well as transportation services provided directly to students.
Jamaica Educational services
Separate charter - education
Designated educational supplies
Mexico Educational services provided by public institutions and private institutions that are authorized or
recognized by the component authorities, within the framework of the General Education Law, as
well as educational services at the pre-school level.
Nicaragua Educational services provided by entities and organizations whose principal activity is to provide
these services.
Paraguay Educational services provided non-profit establishments at the primary, secondary, technical,
tertiary and university levels recognized by the Ministry of Education and Culture or through
specific legislation.
Panama Educational services provided by legal persons or natural persons authorized by the Ministry of Education
Educational supplies
Peru Educational services provided by public or private institutions for pre-primary, primary, secondary,
tertiary, special, occupational preparation, among others. This includes registration fees, fees for tuition,
exams, parents' associations, educational medical insurance, etc. Accommodation and food services for
students as well as transportation for students provided by the same educational institution.
Uruguay Educational services provided by private entities
Educational supplies
Venezuela
(Bolivarian
Republic of)
Educational services registered with the Ministry of Education.
Source: Author’s elaboration based on national legislation. a Preferential treatment includes exemptions and zero rates for the VAT.
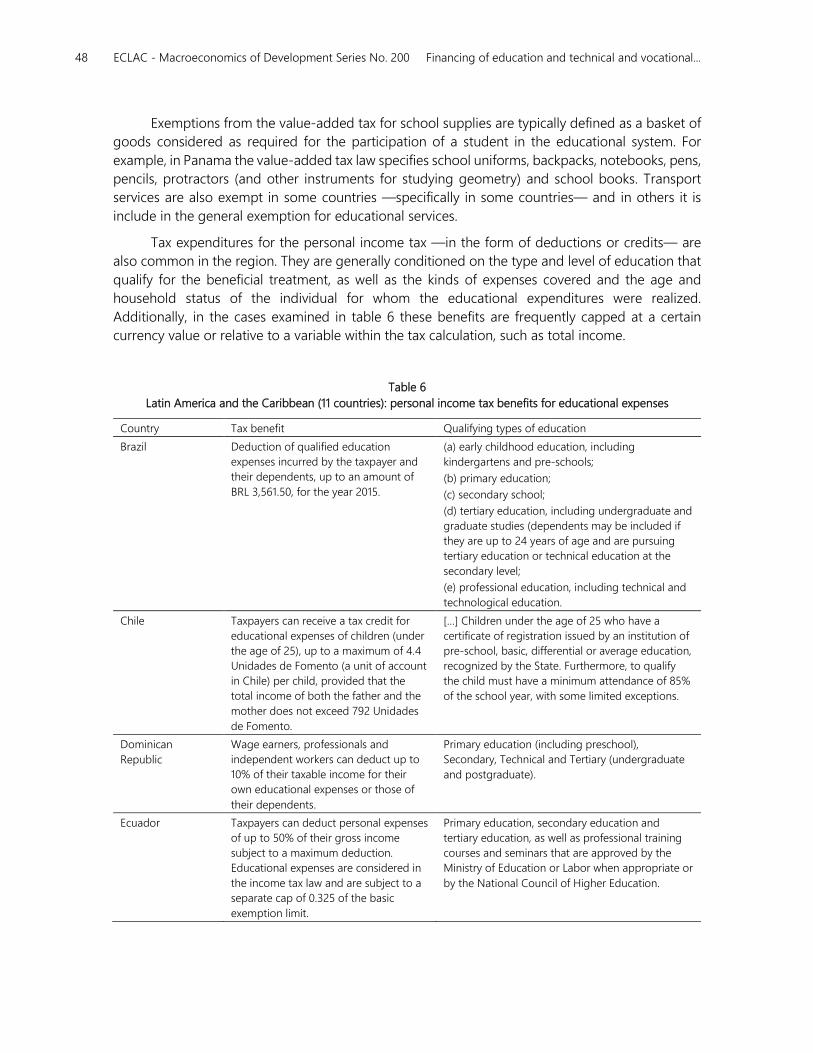
48 ECLAC - Macroeconomics of Development Series No. 200 Financing of education and technical and vocational...
Exemptions from the value-added tax for school supplies are typically defined as a basket of
goods considered as required for the participation of a student in the educational system. For
example, in Panama the value-added tax law specifies school uniforms, backpacks, notebooks, pens,
pencils, protractors (and other instruments for studying geometry) and school books. Transport
services are also exempt in some countries —specifically in some countries— and in others it is
include in the general exemption for educational services.
Tax expenditures for the personal income tax —in the form of deductions or credits— are
also common in the region. They are generally conditioned on the type and level of education that
qualify for the beneficial treatment, as well as the kinds of expenses covered and the age and
household status of the individual for whom the educational expenditures were realized.
Additionally, in the cases examined in table 6 these benefits are frequently capped at a certain
currency value or relative to a variable within the tax calculation, such as total income.
Table 6
Latin America and the Caribbean (11 countries): personal income tax benefits for educational expenses
Country Tax benefit Qualifying types of education
Brazil Deduction of qualified education
expenses incurred by the taxpayer and
their dependents, up to an amount of
BRL 3,561.50, for the year 2015.
(a) early childhood education, including
kindergartens and pre-schools;
(b) primary education;
(c) secondary school;
(d) tertiary education, including undergraduate and
graduate studies (dependents may be included if
they are up to 24 years of age and are pursuing
tertiary education or technical education at the
secondary level;
(e) professional education, including technical and
technological education.
Chile Taxpayers can receive a tax credit for
educational expenses of children (under
the age of 25), up to a maximum of 4.4
Unidades de Fomento (a unit of account
in Chile) per child, provided that the
total income of both the father and the
mother does not exceed 792 Unidades
de Fomento.
[…] Children under the age of 25 who have a
certificate of registration issued by an institution of
pre-school, basic, differential or average education,
recognized by the State. Furthermore, to qualify
the child must have a minimum attendance of 85%
of the school year, with some limited exceptions.
Dominican
Republic
Wage earners, professionals and
independent workers can deduct up to
10% of their taxable income for their
own educational expenses or those of
their dependents.
Primary education (including preschool),
Secondary, Technical and Tertiary (undergraduate
and postgraduate).
Ecuador Taxpayers can deduct personal expenses
of up to 50% of their gross income
subject to a maximum deduction.
Educational expenses are considered in
the income tax law and are subject to a
separate cap of 0.325 of the basic
exemption limit.
Primary education, secondary education and
tertiary education, as well as professional training
courses and seminars that are approved by the
Ministry of Education or Labor when appropriate or
by the National Council of Higher Education.
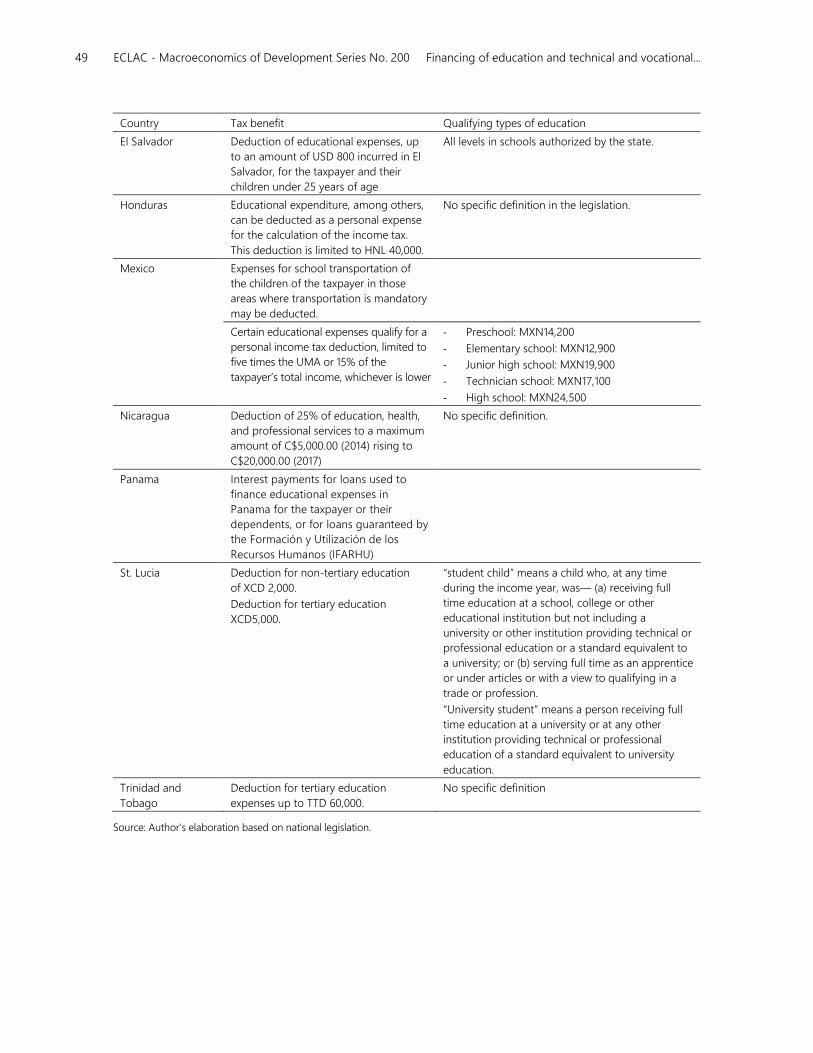
49 ECLAC - Macroeconomics of Development Series No. 200 Financing of education and technical and vocational...
Country Tax benefit Qualifying types of education
El Salvador Deduction of educational expenses, up
to an amount of USD 800 incurred in El
Salvador, for the taxpayer and their
children under 25 years of age
All levels in schools authorized by the state.
Honduras Educational expenditure, among others,
can be deducted as a personal expense
for the calculation of the income tax.
This deduction is limited to HNL 40,000.
No specific definition in the legislation.
Mexico Expenses for school transportation of
the children of the taxpayer in those
areas where transportation is mandatory
may be deducted.
Certain educational expenses qualify for a
personal income tax deduction, limited to
five times the UMA or 15% of the
taxpayer’s total income, whichever is lower
- Preschool: MXN14,200
- Elementary school: MXN12,900
- Junior high school: MXN19,900
- Technician school: MXN17,100
- High school: MXN24,500
Nicaragua Deduction of 25% of education, health,
and professional services to a maximum
amount of C$5,000.00 (2014) rising to
C$20,000.00 (2017)
No specific definition.
Panama Interest payments for loans used to
finance educational expenses in
Panama for the taxpayer or their
dependents, or for loans guaranteed by
the Formación y Utilización de los
Recursos Humanos (IFARHU)
St. Lucia Deduction for non-tertiary education
of XCD 2,000.
Deduction for tertiary education
XCD5,000.
“student child” means a child who, at any time
during the income year, was— (a) receiving full
time education at a school, college or other
educational institution but not including a
university or other institution providing technical or
professional education or a standard equivalent to
a university; or (b) serving full time as an apprentice
or under articles or with a view to qualifying in a
trade or profession.
“University student” means a person receiving full
time education at a university or at any other
institution providing technical or professional
education of a standard equivalent to university
education.
Trinidad and
Tobago
Deduction for tertiary education
expenses up to TTD 60,000.
No specific definition
Source: Author’s elaboration based on national legislation.
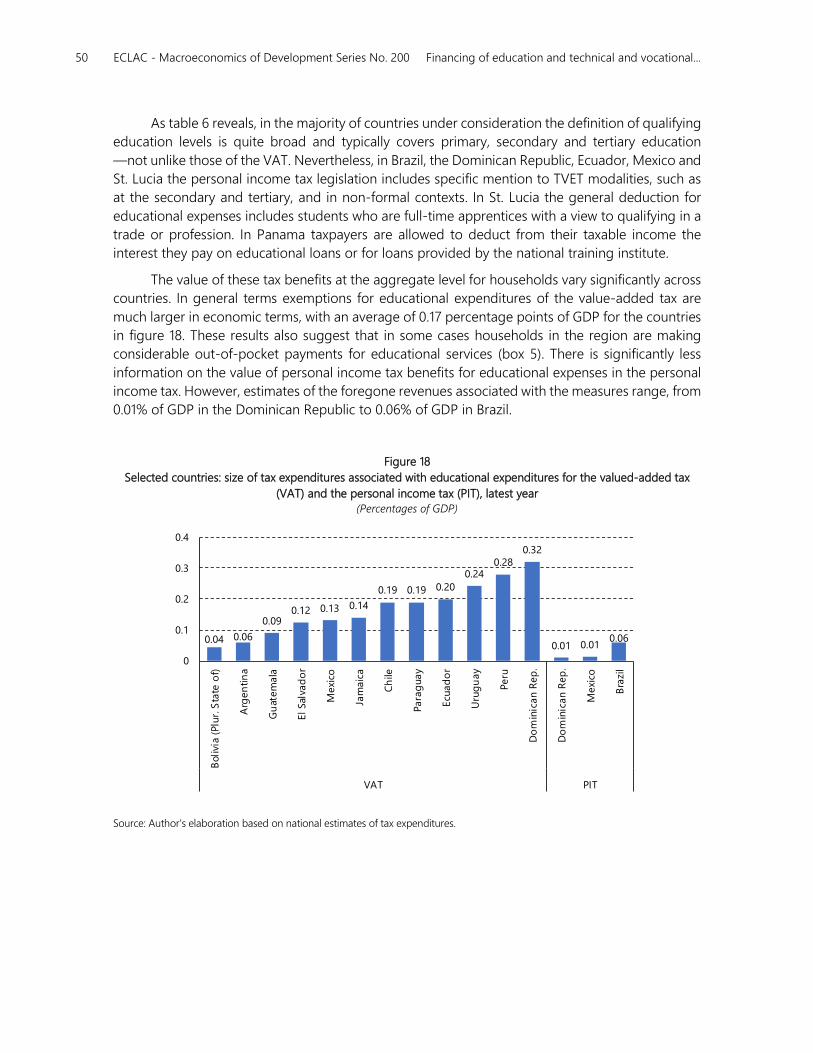
50 ECLAC - Macroeconomics of Development Series No. 200 Financing of education and technical and vocational...
As table 6 reveals, in the majority of countries under consideration the definition of qualifying
education levels is quite broad and typically covers primary, secondary and tertiary education
—not unlike those of the VAT. Nevertheless, in Brazil, the Dominican Republic, Ecuador, Mexico and
St. Lucia the personal income tax legislation includes specific mention to TVET modalities, such as
at the secondary and tertiary, and in non-formal contexts. In St. Lucia the general deduction for
educational expenses includes students who are full-time apprentices with a view to qualifying in a
trade or profession. In Panama taxpayers are allowed to deduct from their taxable income the
interest they pay on educational loans or for loans provided by the national training institute.
The value of these tax benefits at the aggregate level for households vary significantly across
countries. In general terms exemptions for educational expenditures of the value-added tax are
much larger in economic terms, with an average of 0.17 percentage points of GDP for the countries
in figure 18. These results also suggest that in some cases households in the region are making
considerable out-of-pocket payments for educational services (box 5). There is significantly less
information on the value of personal income tax benefits for educational expenses in the personal
income tax. However, estimates of the foregone revenues associated with the measures range, from
0.01% of GDP in the Dominican Republic to 0.06% of GDP in Brazil.
Figure 18
Selected countries: size of tax expenditures associated with educational expenditures for the valued-added tax
(VAT) and the personal income tax (PIT), latest year (Percentages of GDP)
Source: Author’s elaboration based on national estimates of tax expenditures.
0.04 0.06
0.090.12 0.13 0.14
0.19 0.19 0.20
0.240.28
0.32
0.01 0.010.06
0
0.1
0.2
0.3
0.4
Bolivi
a (P
lur.
Sta
te o
f)
Arg
en
tin
a
Gu
atem
ala
El Sal
vad
or
Mexi
co
Jam
aic
a
Ch
ile
Para
guay
Ecu
ad
or
Uru
gu
ay
Peru
Do
min
ican R
ep
.
Do
min
ican R
ep
.
Mexi
co
Bra
zil
VAT PIT
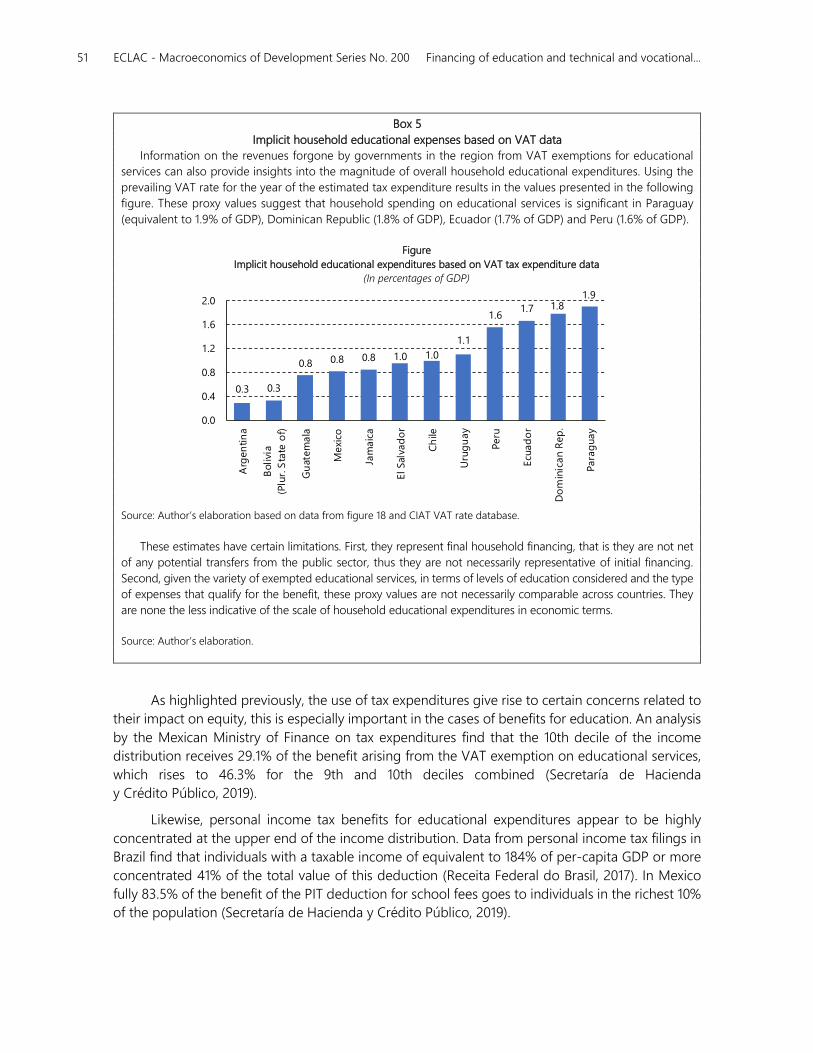
51 ECLAC - Macroeconomics of Development Series No. 200 Financing of education and technical and vocational...
Box 5
Implicit household educational expenses based on VAT data
Information on the revenues forgone by governments in the region from VAT exemptions for educational
services can also provide insights into the magnitude of overall household educational expenditures. Using the
prevailing VAT rate for the year of the estimated tax expenditure results in the values presented in the following
figure. These proxy values suggest that household spending on educational services is significant in Paraguay
(equivalent to 1.9% of GDP), Dominican Republic (1.8% of GDP), Ecuador (1.7% of GDP) and Peru (1.6% of GDP).
Figure
Implicit household educational expenditures based on VAT tax expenditure data
(In percentages of GDP)
Source: Author’s elaboration based on data from figure 18 and CIAT VAT rate database.
These estimates have certain limitations. First, they represent final household financing, that is they are not net
of any potential transfers from the public sector, thus they are not necessarily representative of initial financing.
Second, given the variety of exempted educational services, in terms of levels of education considered and the type
of expenses that qualify for the benefit, these proxy values are not necessarily comparable across countries. They
are none the less indicative of the scale of household educational expenditures in economic terms.
Source: Author’s elaboration.
As highlighted previously, the use of tax expenditures give rise to certain concerns related to
their impact on equity, this is especially important in the cases of benefits for education. An analysis
by the Mexican Ministry of Finance on tax expenditures find that the 10th decile of the income
distribution receives 29.1% of the benefit arising from the VAT exemption on educational services,
which rises to 46.3% for the 9th and 10th deciles combined (Secretaría de Hacienda
y Crédito Público, 2019).
Likewise, personal income tax benefits for educational expenditures appear to be highly
concentrated at the upper end of the income distribution. Data from personal income tax filings in
Brazil find that individuals with a taxable income of equivalent to 184% of per-capita GDP or more
concentrated 41% of the total value of this deduction (Receita Federal do Brasil, 2017). In Mexico
fully 83.5% of the benefit of the PIT deduction for school fees goes to individuals in the richest 10%
of the population (Secretaría de Hacienda y Crédito Público, 2019).
0.3 0.3
0.8 0.8 0.8 1.0 1.0
1.1
1.61.7 1.8
1.9
0.0
0.4
0.8
1.2
1.6
2.0
Arg
en
tin
a
Bolivi
a
(Plu
r. S
tate
of)
Gu
atem
ala
Mexi
co
Jam
aic
a
El Sal
vad
or
Ch
ile
Uru
gu
ay
Peru
Ecu
ad
or
Do
min
ican R
ep
.
Para
guay
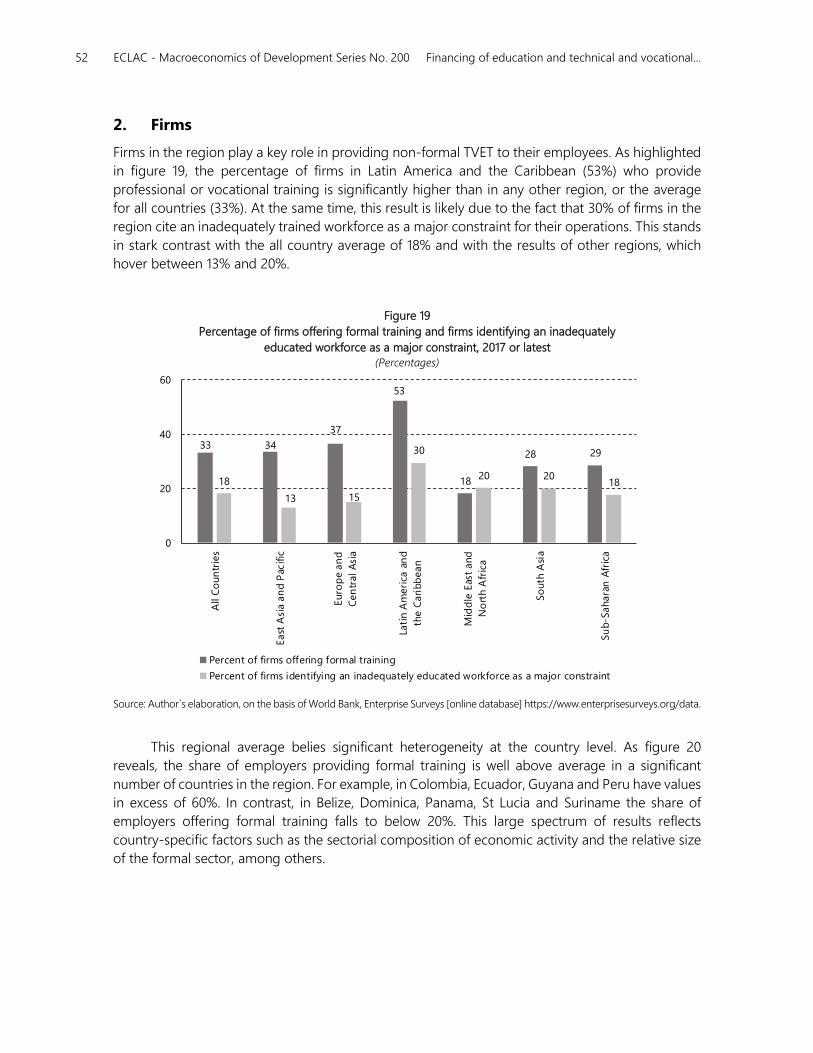
52 ECLAC - Macroeconomics of Development Series No. 200 Financing of education and technical and vocational...
2. Firms
Firms in the region play a key role in providing non-formal TVET to their employees. As highlighted
in figure 19, the percentage of firms in Latin America and the Caribbean (53%) who provide
professional or vocational training is significantly higher than in any other region, or the average
for all countries (33%). At the same time, this result is likely due to the fact that 30% of firms in the
region cite an inadequately trained workforce as a major constraint for their operations. This stands
in stark contrast with the all country average of 18% and with the results of other regions, which
hover between 13% and 20%.
Figure 19
Percentage of firms offering formal training and firms identifying an inadequately
educated workforce as a major constraint, 2017 or latest (Percentages)
Source: Author´s elaboration, on the basis of World Bank, Enterprise Surveys [online database] https://www.enterprisesurveys.org/data.
This regional average belies significant heterogeneity at the country level. As figure 20
reveals, the share of employers providing formal training is well above average in a significant
number of countries in the region. For example, in Colombia, Ecuador, Guyana and Peru have values
in excess of 60%. In contrast, in Belize, Dominica, Panama, St Lucia and Suriname the share of
employers offering formal training falls to below 20%. This large spectrum of results reflects
country-specific factors such as the sectorial composition of economic activity and the relative size
of the formal sector, among others.
33 34
37
53
18
28 29
18
13 15
30
20 2018
0
20
40
60
All
Co
un
trie
s
East
Asi
a a
nd P
acific
Euro
pe a
nd
Cen
tral A
sia
Lati
n A
meri
ca a
nd
the C
ari
bb
ean
Mid
dle
Eas
t and
No
rth A
fric
a
So
uth
Asi
a
Su
b-S
ahara
n A
fric
a
Percent of firms offering formal training
Percent of firms identifying an inadequately educated workforce as a major constraint
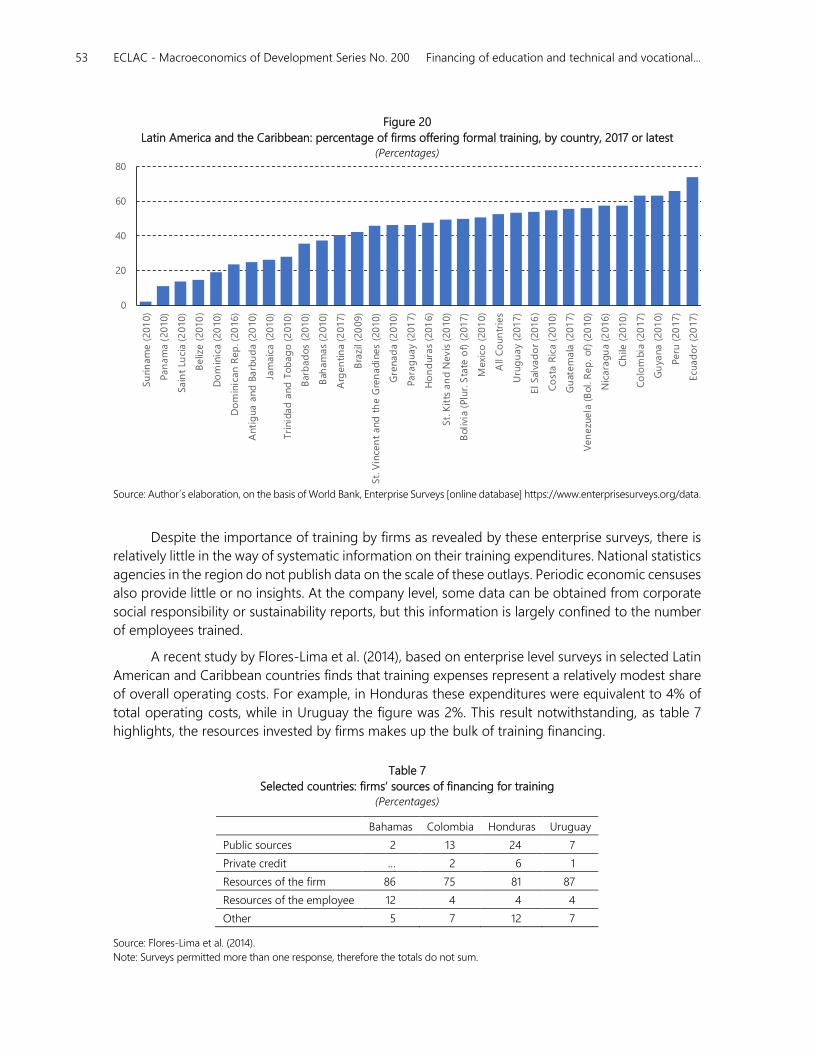
53 ECLAC - Macroeconomics of Development Series No. 200 Financing of education and technical and vocational...
0
20
40
60
80
Su
rin
am
e (
201
0)
Pan
am
a (
2010)
Sain
t Lu
cia (2
010)
Beliz
e (
2010
)
Do
min
ica (20
10)
Do
min
ican R
ep
. (20
16)
Anti
gua a
nd
Barb
ud
a (20
10)
Jam
aic
a (
2010)
Tri
nid
ad
and
Tob
ag
o (2
010)
Bar
bad
os
(2010)
Bah
am
as
(2010)
Arg
en
tin
a (2
017)
Bra
zil (2
009)
St. V
ince
nt
and
th
e G
ren
adin
es
(2010)
Gre
nad
a (2
010)
Para
guay
(201
7)
Ho
nd
ura
s (2
01
6)
St. K
itts
an
d N
evis
(20
10)
Bolivi
a (P
lur.
Sta
te o
f) (
2017)
Mexi
co (
201
0)
All
Co
un
trie
s
Uru
gu
ay
(2017)
El Sal
vad
or
(2016
)
Co
sta R
ica (
2010)
Gu
atem
ala
(201
7)
Ven
ezu
ela
(B
ol. R
ep
. of)
(20
10)
Nic
ara
gu
a (2
016)
Ch
ile (
2010
)
Co
lom
bia
(20
17)
Gu
yana (
201
0)
Peru
(20
17)
Ecu
ad
or
(20
17)
Figure 20
Latin America and the Caribbean: percentage of firms offering formal training, by country, 2017 or latest (Percentages)
Source: Author´s elaboration, on the basis of World Bank, Enterprise Surveys [online database] https://www.enterprisesurveys.org/data.
Despite the importance of training by firms as revealed by these enterprise surveys, there is
relatively little in the way of systematic information on their training expenditures. National statistics
agencies in the region do not publish data on the scale of these outlays. Periodic economic censuses
also provide little or no insights. At the company level, some data can be obtained from corporate
social responsibility or sustainability reports, but this information is largely confined to the number
of employees trained.
A recent study by Flores-Lima et al. (2014), based on enterprise level surveys in selected Latin
American and Caribbean countries finds that training expenses represent a relatively modest share
of overall operating costs. For example, in Honduras these expenditures were equivalent to 4% of
total operating costs, while in Uruguay the figure was 2%. This result notwithstanding, as table 7
highlights, the resources invested by firms makes up the bulk of training financing.
Table 7
Selected countries: firms’ sources of financing for training (Percentages)
Bahamas Colombia Honduras Uruguay
Public sources 2 13 24 7
Private credit … 2 6 1
Resources of the firm 86 75 81 87
Resources of the employee 12 4 4 4
Other 5 7 12 7
Source: Flores-Lima et al. (2014).
Note: Surveys permitted more than one response, therefore the totals do not sum.
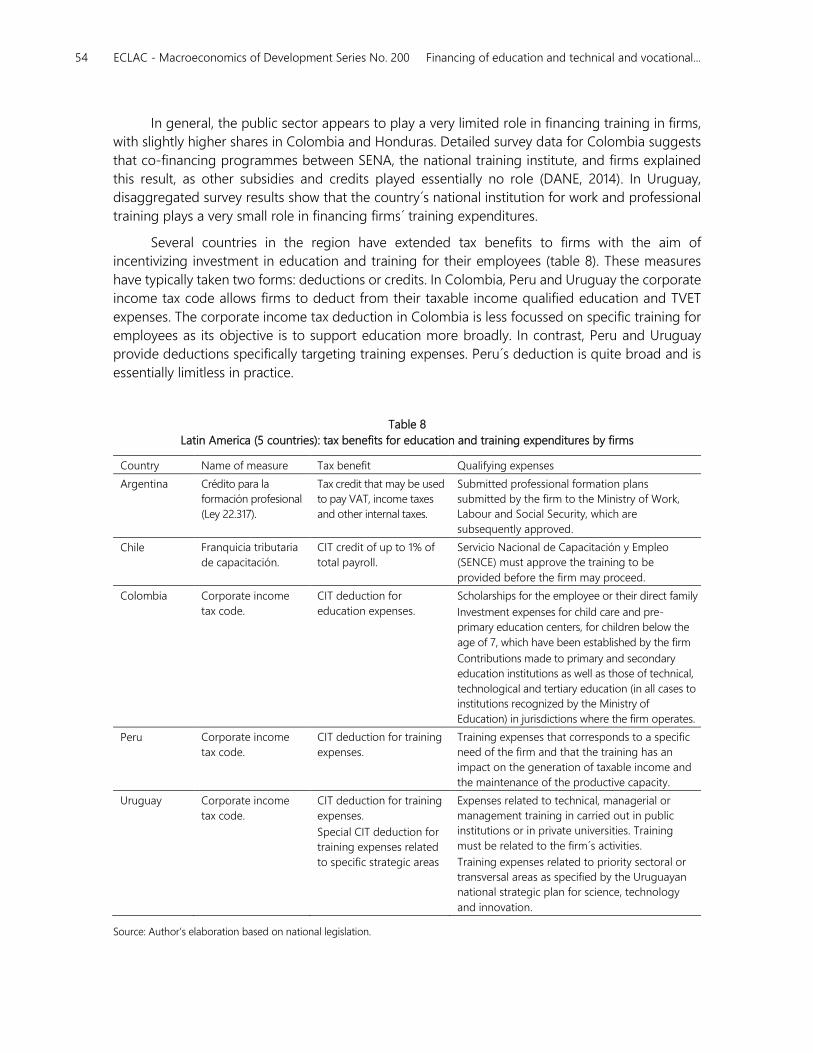
54 ECLAC - Macroeconomics of Development Series No. 200 Financing of education and technical and vocational...
In general, the public sector appears to play a very limited role in financing training in firms,
with slightly higher shares in Colombia and Honduras. Detailed survey data for Colombia suggests
that co-financing programmes between SENA, the national training institute, and firms explained
this result, as other subsidies and credits played essentially no role (DANE, 2014). In Uruguay,
disaggregated survey results show that the country´s national institution for work and professional
training plays a very small role in financing firms´ training expenditures.
Several countries in the region have extended tax benefits to firms with the aim of
incentivizing investment in education and training for their employees (table 8). These measures
have typically taken two forms: deductions or credits. In Colombia, Peru and Uruguay the corporate
income tax code allows firms to deduct from their taxable income qualified education and TVET
expenses. The corporate income tax deduction in Colombia is less focussed on specific training for
employees as its objective is to support education more broadly. In contrast, Peru and Uruguay
provide deductions specifically targeting training expenses. Peru´s deduction is quite broad and is
essentially limitless in practice.
Table 8
Latin America (5 countries): tax benefits for education and training expenditures by firms
Country Name of measure Tax benefit Qualifying expenses
Argentina Crédito para la
formación profesional
(Ley 22.317).
Tax credit that may be used
to pay VAT, income taxes
and other internal taxes.
Submitted professional formation plans
submitted by the firm to the Ministry of Work,
Labour and Social Security, which are
subsequently approved.
Chile Franquicia tributaria
de capacitación.
CIT credit of up to 1% of
total payroll.
Servicio Nacional de Capacitación y Empleo
(SENCE) must approve the training to be
provided before the firm may proceed.
Colombia Corporate income
tax code.
CIT deduction for
education expenses.
Scholarships for the employee or their direct family
Investment expenses for child care and pre-
primary education centers, for children below the
age of 7, which have been established by the firm
Contributions made to primary and secondary
education institutions as well as those of technical,
technological and tertiary education (in all cases to
institutions recognized by the Ministry of
Education) in jurisdictions where the firm operates.
Peru Corporate income
tax code.
CIT deduction for training
expenses.
Training expenses that corresponds to a specific
need of the firm and that the training has an
impact on the generation of taxable income and
the maintenance of the productive capacity.
Uruguay Corporate income
tax code.
CIT deduction for training
expenses.
Special CIT deduction for
training expenses related
to specific strategic areas
Expenses related to technical, managerial or
management training in carried out in public
institutions or in private universities. Training
must be related to the firm´s activities.
Training expenses related to priority sectoral or
transversal areas as specified by the Uruguayan
national strategic plan for science, technology
and innovation.
Source: Author’s elaboration based on national legislation.
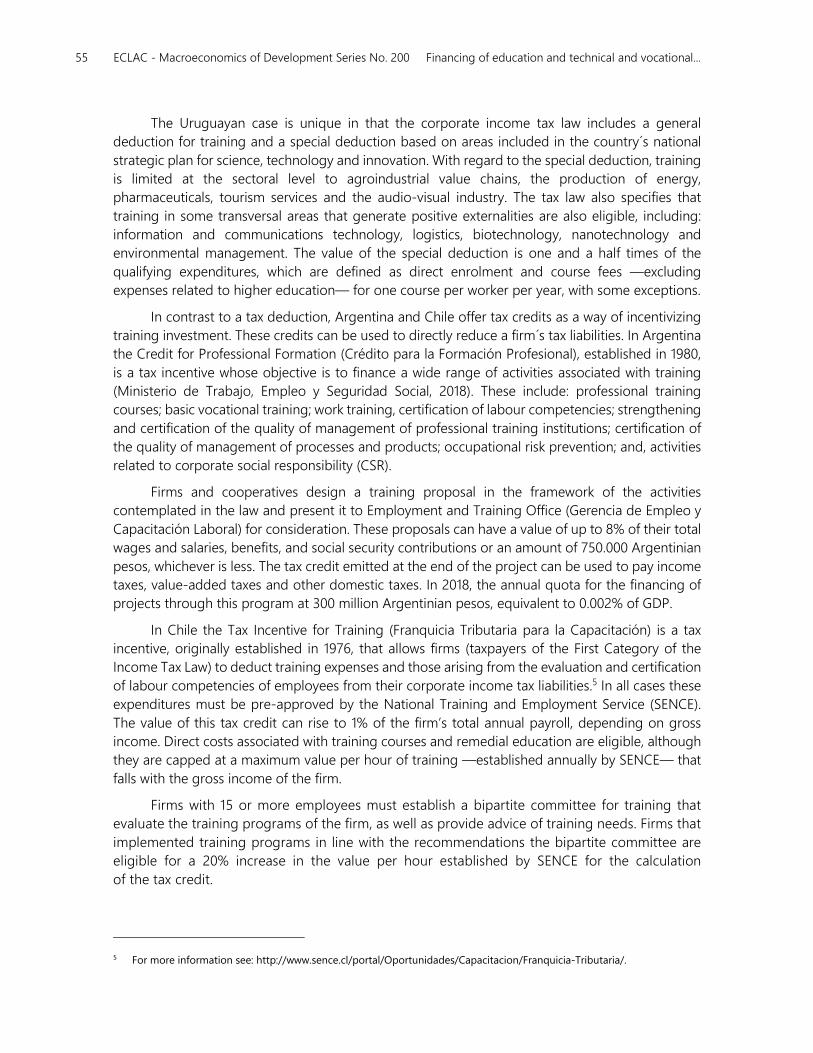
55 ECLAC - Macroeconomics of Development Series No. 200 Financing of education and technical and vocational...
The Uruguayan case is unique in that the corporate income tax law includes a general
deduction for training and a special deduction based on areas included in the country´s national
strategic plan for science, technology and innovation. With regard to the special deduction, training
is limited at the sectoral level to agroindustrial value chains, the production of energy,
pharmaceuticals, tourism services and the audio-visual industry. The tax law also specifies that
training in some transversal areas that generate positive externalities are also eligible, including:
information and communications technology, logistics, biotechnology, nanotechnology and
environmental management. The value of the special deduction is one and a half times of the
qualifying expenditures, which are defined as direct enrolment and course fees —excluding
expenses related to higher education— for one course per worker per year, with some exceptions.
In contrast to a tax deduction, Argentina and Chile offer tax credits as a way of incentivizing
training investment. These credits can be used to directly reduce a firm´s tax liabilities. In Argentina
the Credit for Professional Formation (Crédito para la Formación Profesional), established in 1980,
is a tax incentive whose objective is to finance a wide range of activities associated with training
(Ministerio de Trabajo, Empleo y Seguridad Social, 2018). These include: professional training
courses; basic vocational training; work training, certification of labour competencies; strengthening
and certification of the quality of management of professional training institutions; certification of
the quality of management of processes and products; occupational risk prevention; and, activities
related to corporate social responsibility (CSR).
Firms and cooperatives design a training proposal in the framework of the activities
contemplated in the law and present it to Employment and Training Office (Gerencia de Empleo y
Capacitación Laboral) for consideration. These proposals can have a value of up to 8% of their total
wages and salaries, benefits, and social security contributions or an amount of 750.000 Argentinian
pesos, whichever is less. The tax credit emitted at the end of the project can be used to pay income
taxes, value-added taxes and other domestic taxes. In 2018, the annual quota for the financing of
projects through this program at 300 million Argentinian pesos, equivalent to 0.002% of GDP.
In Chile the Tax Incentive for Training (Franquicia Tributaria para la Capacitación) is a tax
incentive, originally established in 1976, that allows firms (taxpayers of the First Category of the
Income Tax Law) to deduct training expenses and those arising from the evaluation and certification
of labour competencies of employees from their corporate income tax liabilities.5 In all cases these
expenditures must be pre-approved by the National Training and Employment Service (SENCE).
The value of this tax credit can rise to 1% of the firm’s total annual payroll, depending on gross
income. Direct costs associated with training courses and remedial education are eligible, although
they are capped at a maximum value per hour of training —established annually by SENCE— that
falls with the gross income of the firm.
Firms with 15 or more employees must establish a bipartite committee for training that
evaluate the training programs of the firm, as well as provide advice of training needs. Firms that
implemented training programs in line with the recommendations the bipartite committee are
eligible for a 20% increase in the value per hour established by SENCE for the calculation
of the tax credit.
5 For more information see: http://www.sence.cl/portal/Oportunidades/Capacitacion/Franquicia-Tributaria/.
56 ECLAC - Macroeconomics of Development Series No. 200 Financing of education and technical and vocational...
One of the interesting features of the Chilean tax incentive is the provisions it includes that
benefit workers if they eventually leave the firm. For example, expenditures on the evaluation and
certification of labour competencies for workers by entities accredited by ChileValora (a government
body that manages the national system of labour competencies certification) can also be included
in the calculation of the tax credit. Additionally, training programmes that lead to the attainment of
tertiary technical degrees at a qualified technical formation centre can be credited against the firm’s
tax liabilities up to an established value per year per employee.
In 2017, 1,2 million participants attended training courses within the framework of the Chilean
training tax incentive programme. Statistical data from SENCE also suggest that workers in general
attended more than one training course, as the number of approved individuals was 747,056.
Employers put forward 2,370 employees to have their labour competencies evaluated and certified.
The number of participants in training programmes that led to the attainment of tertiary technical
degrees was very limited, totalling just 264 in 2017.
Spending on training under the programme is heavily weighted toward the public sector. The
tax incentive mobilized US$ 33.9 million of additional spending by firms, which accounted
for 17% of total expenditures (private and public) related to the programme. In absolute terms total
expenditure on training provided in the framework of the tax incentive regime was equivalent
to 0.1% of GDP in 2017.
D. Rest of the world
1. Bilateral ODA
The importance of bilateral ODA for Latin America and the Caribbean has diminished over time as
countries have reached middle —and high— income status. This transition notwithstanding a
significant flow of resources continues to target the region, especially in the area of education.
During the past decade, the period between 2008 and 2017, ODA commitments —amounts that
correspond to agreements that have been signed, but not necessarily disbursed—
totalled US$ 7.5 billion. Nevertheless, as seen in figure 21, these flows have trended lower over time.
It is also important to provide some context for the economic magnitude of these flows, as they
have averaged 0.01% of regional GDP during the period.
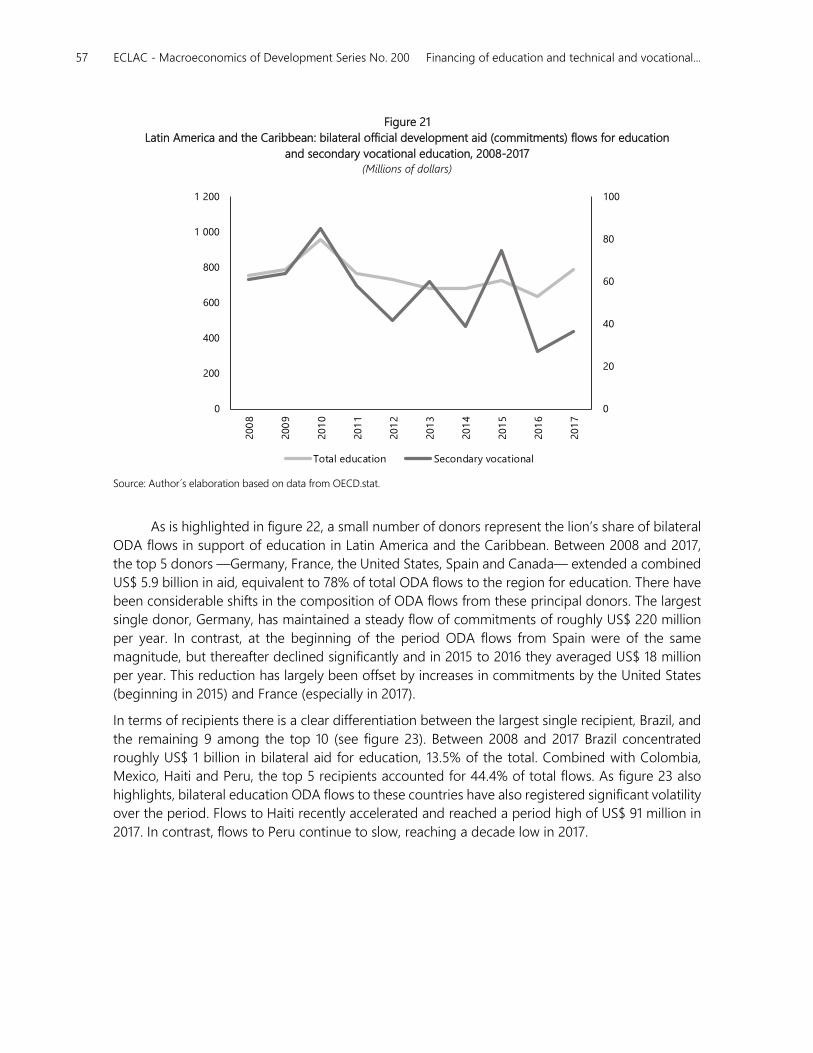
57 ECLAC - Macroeconomics of Development Series No. 200 Financing of education and technical and vocational...
Figure 21
Latin America and the Caribbean: bilateral official development aid (commitments) flows for education
and secondary vocational education, 2008-2017 (Millions of dollars)
Source: Author´s elaboration based on data from OECD.stat.
As is highlighted in figure 22, a small number of donors represent the lion’s share of bilateral
ODA flows in support of education in Latin America and the Caribbean. Between 2008 and 2017,
the top 5 donors —Germany, France, the United States, Spain and Canada— extended a combined
US$ 5.9 billion in aid, equivalent to 78% of total ODA flows to the region for education. There have
been considerable shifts in the composition of ODA flows from these principal donors. The largest
single donor, Germany, has maintained a steady flow of commitments of roughly US$ 220 million
per year. In contrast, at the beginning of the period ODA flows from Spain were of the same
magnitude, but thereafter declined significantly and in 2015 to 2016 they averaged US$ 18 million
per year. This reduction has largely been offset by increases in commitments by the United States
(beginning in 2015) and France (especially in 2017).
In terms of recipients there is a clear differentiation between the largest single recipient, Brazil, and
the remaining 9 among the top 10 (see figure 23). Between 2008 and 2017 Brazil concentrated
roughly US$ 1 billion in bilateral aid for education, 13.5% of the total. Combined with Colombia,
Mexico, Haiti and Peru, the top 5 recipients accounted for 44.4% of total flows. As figure 23 also
highlights, bilateral education ODA flows to these countries have also registered significant volatility
over the period. Flows to Haiti recently accelerated and reached a period high of US$ 91 million in
2017. In contrast, flows to Peru continue to slow, reaching a decade low in 2017.
0
20
40
60
80
100
0
200
400
600
800
1 000
1 200
200
8
200
9
201
0
201
1
201
2
201
3
201
4
201
5
201
6
201
7
Total education Secondary vocational
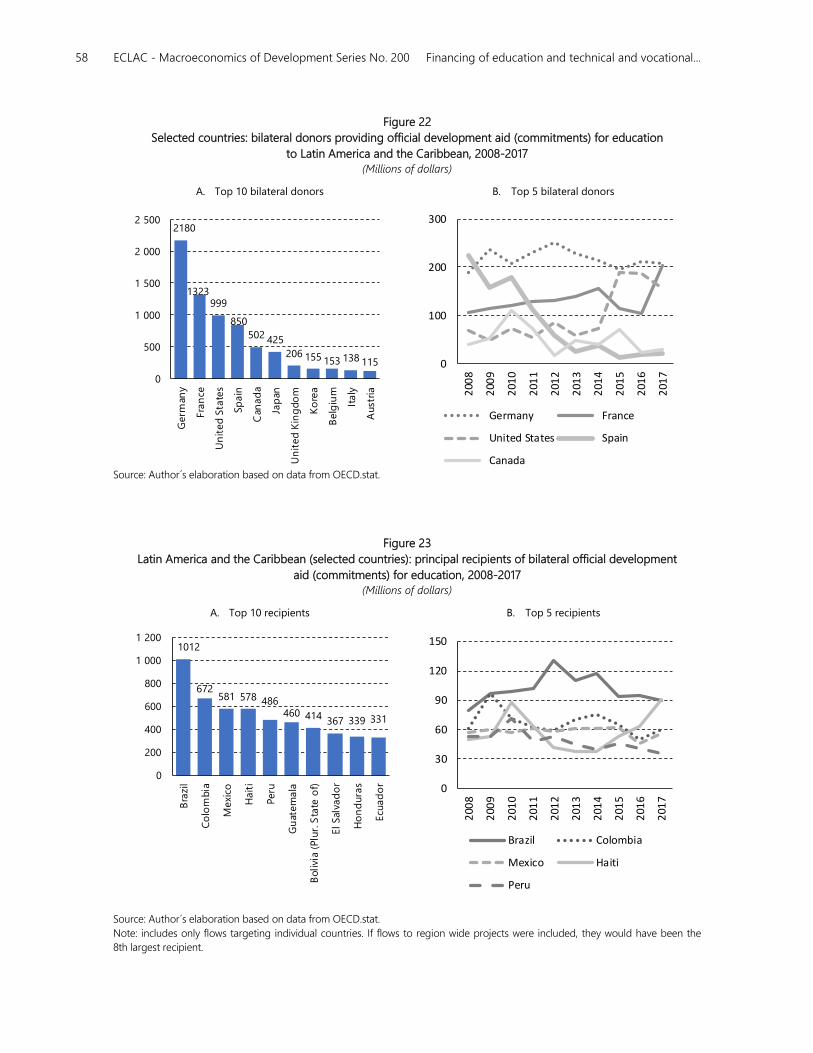
58 ECLAC - Macroeconomics of Development Series No. 200 Financing of education and technical and vocational...
2180
1323999
850
502 425
206 155 153 138 115
0
500
1 000
1 500
2 000
2 500
G
erm
any
Fra
nce
U
nit
ed
Sta
tes
Sp
ain
C
anad
a
Ja
pan
U
nit
ed
Kin
gdo
m
K
ore
a
B
elg
ium
It
aly
A
ust
ria
Figure 22
Selected countries: bilateral donors providing official development aid (commitments) for education
to Latin America and the Caribbean, 2008-2017 (Millions of dollars)
A. Top 10 bilateral donors B. Top 5 bilateral donors
Source: Author´s elaboration based on data from OECD.stat.
Figure 23
Latin America and the Caribbean (selected countries): principal recipients of bilateral official development
aid (commitments) for education, 2008-2017 (Millions of dollars)
A. Top 10 recipients B. Top 5 recipients
Source: Author´s elaboration based on data from OECD.stat.
Note: includes only flows targeting individual countries. If flows to region wide projects were included, they would have been the
8th largest recipient.
0
30
60
90
120
150
20
08
20
09
20
10
20
11
20
12
20
13
20
14
20
15
20
16
20
17
Brazil Colombia
Mexico Haiti
Peru
1012
672581 578 486
460 414367 339 331
0
200
400
600
800
1 000
1 200
Bra
zil
Co
lom
bia
Mexi
co
Hait
i
Peru
Gu
atem
ala
Bolivi
a (P
lur.
Sta
te o
f)
El Sal
vad
or
Ho
nd
ura
s
Ecu
ad
or
0
100
200
300
20
08
20
09
20
10
20
11
20
12
20
13
20
14
20
15
20
16
20
17
Germany France
United States Spain
Canada
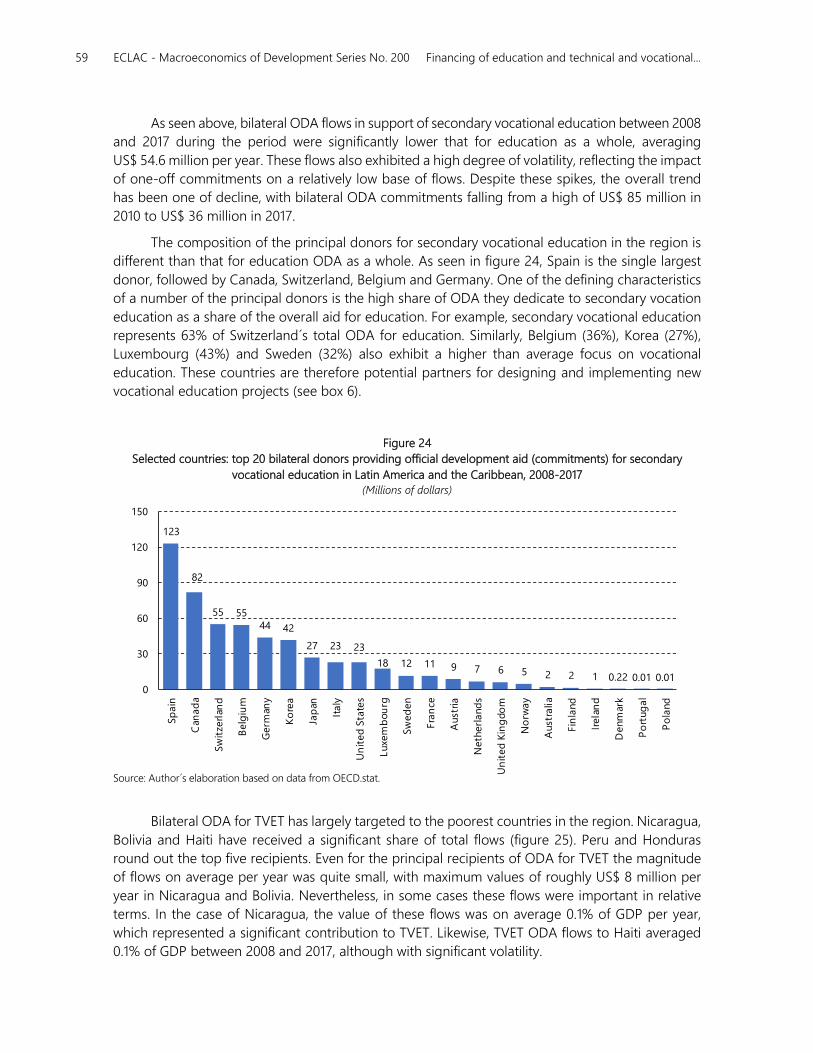
59 ECLAC - Macroeconomics of Development Series No. 200 Financing of education and technical and vocational...
123
82
55 5544 42
27 23 23
18 12 11 9 7 6 5 2 2 1 0.22 0.01 0.010
30
60
90
120
150
Sp
ain
C
anad
a
Sw
itze
rlan
d
B
elg
ium
G
erm
any
K
ore
a
Ja
pan
It
aly
U
nit
ed
Sta
tes
Luxe
mb
ou
rg
Sw
ed
en
Fra
nce
A
ust
ria
N
eth
erl
and
s
U
nit
ed
Kin
gdo
m
N
orw
ay
A
ust
ralia
Fin
land
Ir
ela
nd
D
enm
ark
P
ort
ug
al
P
ola
nd
As seen above, bilateral ODA flows in support of secondary vocational education between 2008
and 2017 during the period were significantly lower that for education as a whole, averaging
US$ 54.6 million per year. These flows also exhibited a high degree of volatility, reflecting the impact
of one-off commitments on a relatively low base of flows. Despite these spikes, the overall trend
has been one of decline, with bilateral ODA commitments falling from a high of US$ 85 million in
2010 to US$ 36 million in 2017.
The composition of the principal donors for secondary vocational education in the region is
different than that for education ODA as a whole. As seen in figure 24, Spain is the single largest
donor, followed by Canada, Switzerland, Belgium and Germany. One of the defining characteristics
of a number of the principal donors is the high share of ODA they dedicate to secondary vocation
education as a share of the overall aid for education. For example, secondary vocational education
represents 63% of Switzerland´s total ODA for education. Similarly, Belgium (36%), Korea (27%),
Luxembourg (43%) and Sweden (32%) also exhibit a higher than average focus on vocational
education. These countries are therefore potential partners for designing and implementing new
vocational education projects (see box 6).
Figure 24
Selected countries: top 20 bilateral donors providing official development aid (commitments) for secondary
vocational education in Latin America and the Caribbean, 2008-2017 (Millions of dollars)
Source: Author´s elaboration based on data from OECD.stat.
Bilateral ODA for TVET has largely targeted to the poorest countries in the region. Nicaragua,
Bolivia and Haiti have received a significant share of total flows (figure 25). Peru and Honduras
round out the top five recipients. Even for the principal recipients of ODA for TVET the magnitude
of flows on average per year was quite small, with maximum values of roughly US$ 8 million per
year in Nicaragua and Bolivia. Nevertheless, in some cases these flows were important in relative
terms. In the case of Nicaragua, the value of these flows was on average 0.1% of GDP per year,
which represented a significant contribution to TVET. Likewise, TVET ODA flows to Haiti averaged
0.1% of GDP between 2008 and 2017, although with significant volatility.
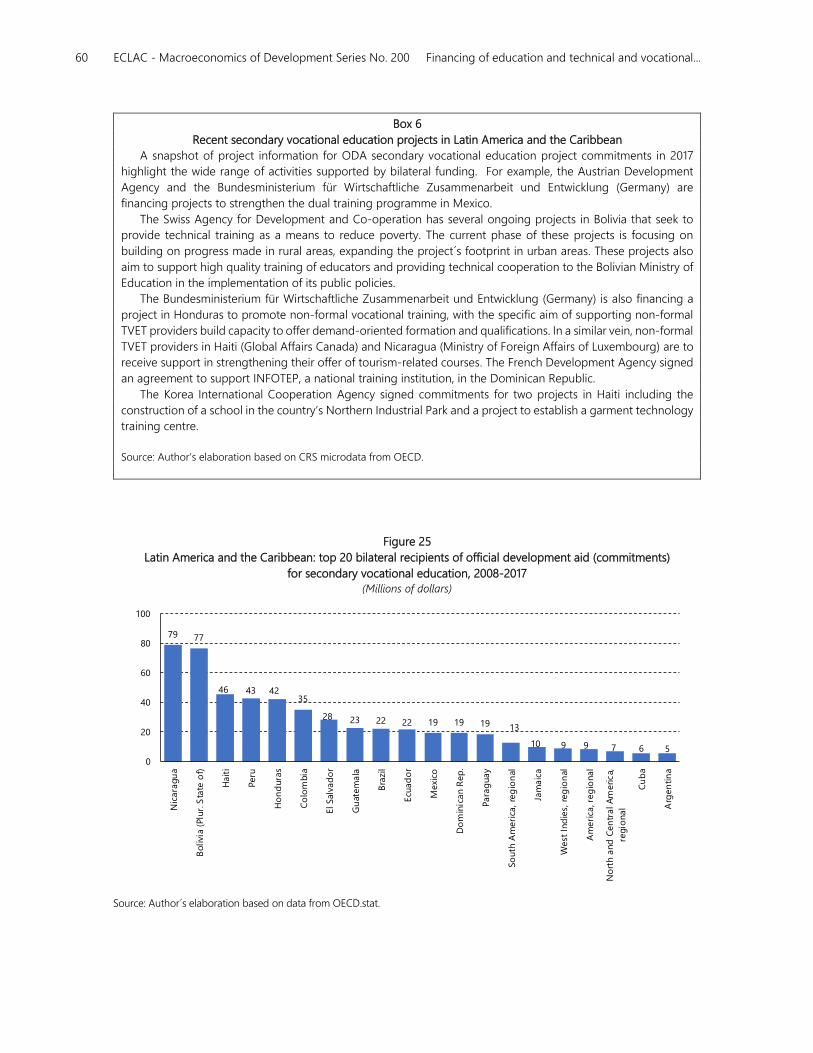
60 ECLAC - Macroeconomics of Development Series No. 200 Financing of education and technical and vocational...
79 77
46 43 4235
28 23 22 22 19 19 19 13
10 9 9 7 6 5
0
20
40
60
80
100
Nic
ara
gu
a
Bolivi
a (P
lur.
Sta
te o
f)
Hait
i
Peru
Ho
nd
ura
s
Co
lom
bia
El Sal
vad
or
Gu
atem
ala
Bra
zil
Ecu
ad
or
Mexi
co
Do
min
ican R
ep
.
Para
guay
So
uth
Am
eri
ca, re
gio
nal
Jam
aic
a
West
Ind
ies,
reg
ion
al
Am
eri
ca, r
eg
ional
No
rth a
nd
Cen
tral A
merica,
regio
nal
Cu
ba
Arg
en
tin
a
Box 6
Recent secondary vocational education projects in Latin America and the Caribbean
A snapshot of project information for ODA secondary vocational education project commitments in 2017
highlight the wide range of activities supported by bilateral funding. For example, the Austrian Development
Agency and the Bundesministerium für Wirtschaftliche Zusammenarbeit und Entwicklung (Germany) are
financing projects to strengthen the dual training programme in Mexico.
The Swiss Agency for Development and Co-operation has several ongoing projects in Bolivia that seek to
provide technical training as a means to reduce poverty. The current phase of these projects is focusing on
building on progress made in rural areas, expanding the project´s footprint in urban areas. These projects also
aim to support high quality training of educators and providing technical cooperation to the Bolivian Ministry of
Education in the implementation of its public policies.
The Bundesministerium für Wirtschaftliche Zusammenarbeit und Entwicklung (Germany) is also financing a
project in Honduras to promote non-formal vocational training, with the specific aim of supporting non-formal
TVET providers build capacity to offer demand-oriented formation and qualifications. In a similar vein, non-formal
TVET providers in Haiti (Global Affairs Canada) and Nicaragua (Ministry of Foreign Affairs of Luxembourg) are to
receive support in strengthening their offer of tourism-related courses. The French Development Agency signed
an agreement to support INFOTEP, a national training institution, in the Dominican Republic.
The Korea International Cooperation Agency signed commitments for two projects in Haiti including the
construction of a school in the country’s Northern Industrial Park and a project to establish a garment technology
training centre.
Source: Author’s elaboration based on CRS microdata from OECD.
Figure 25
Latin America and the Caribbean: top 20 bilateral recipients of official development aid (commitments)
for secondary vocational education, 2008-2017 (Millions of dollars)
Source: Author´s elaboration based on data from OECD.stat.
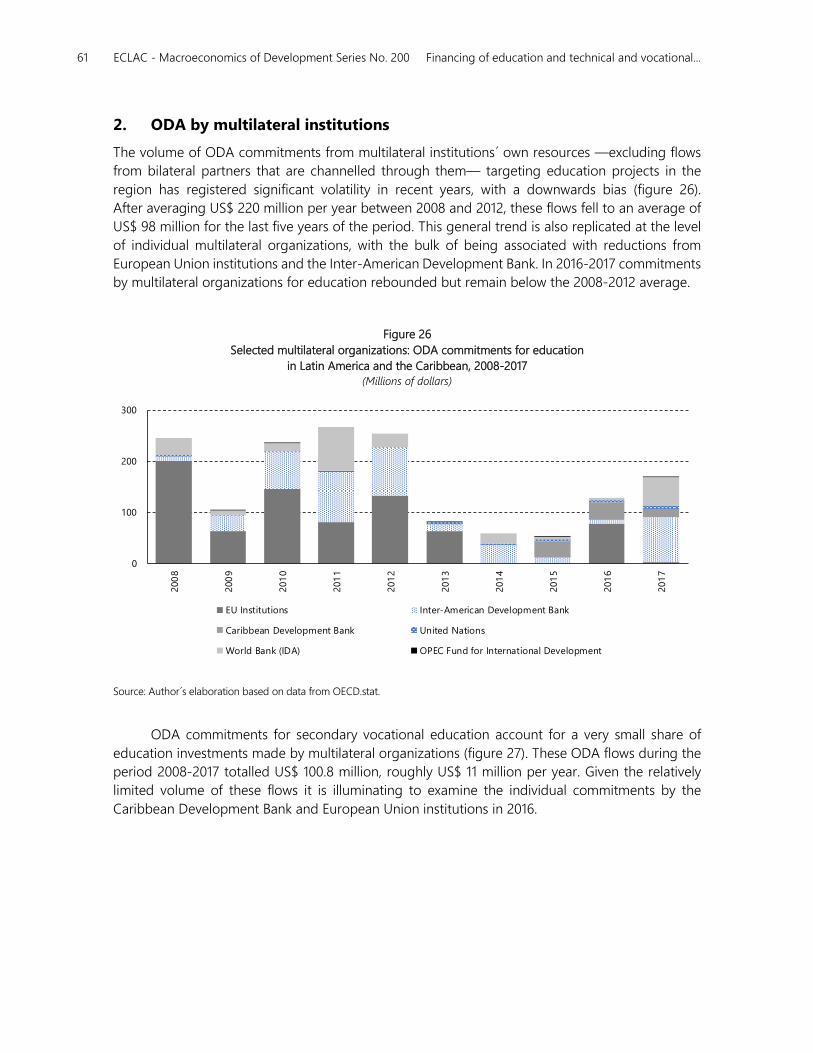
61 ECLAC - Macroeconomics of Development Series No. 200 Financing of education and technical and vocational...
2. ODA by multilateral institutions
The volume of ODA commitments from multilateral institutions´ own resources —excluding flows
from bilateral partners that are channelled through them— targeting education projects in the
region has registered significant volatility in recent years, with a downwards bias (figure 26).
After averaging US$ 220 million per year between 2008 and 2012, these flows fell to an average of
US$ 98 million for the last five years of the period. This general trend is also replicated at the level
of individual multilateral organizations, with the bulk of being associated with reductions from
European Union institutions and the Inter-American Development Bank. In 2016-2017 commitments
by multilateral organizations for education rebounded but remain below the 2008-2012 average.
Figure 26
Selected multilateral organizations: ODA commitments for education
in Latin America and the Caribbean, 2008-2017 (Millions of dollars)
Source: Author´s elaboration based on data from OECD.stat.
ODA commitments for secondary vocational education account for a very small share of
education investments made by multilateral organizations (figure 27). These ODA flows during the
period 2008-2017 totalled US$ 100.8 million, roughly US$ 11 million per year. Given the relatively
limited volume of these flows it is illuminating to examine the individual commitments by the
Caribbean Development Bank and European Union institutions in 2016.
0
100
200
300
200
8
200
9
201
0
201
1
201
2
201
3
201
4
201
5
201
6
201
7
EU Institutions Inter-American Development Bank
Caribbean Development Bank United Nations
World Bank (IDA) OPEC Fund for International Development
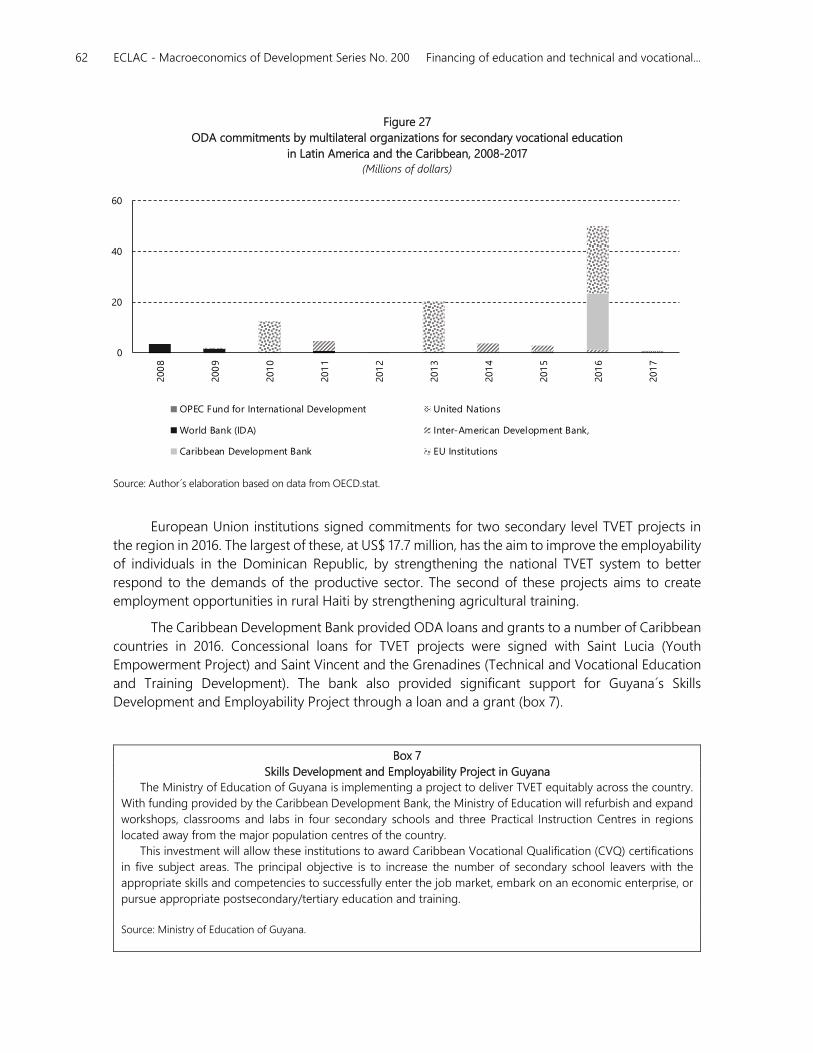
62 ECLAC - Macroeconomics of Development Series No. 200 Financing of education and technical and vocational...
Figure 27
ODA commitments by multilateral organizations for secondary vocational education
in Latin America and the Caribbean, 2008-2017 (Millions of dollars)
Source: Author´s elaboration based on data from OECD.stat.
European Union institutions signed commitments for two secondary level TVET projects in
the region in 2016. The largest of these, at US$ 17.7 million, has the aim to improve the employability
of individuals in the Dominican Republic, by strengthening the national TVET system to better
respond to the demands of the productive sector. The second of these projects aims to create
employment opportunities in rural Haiti by strengthening agricultural training.
The Caribbean Development Bank provided ODA loans and grants to a number of Caribbean
countries in 2016. Concessional loans for TVET projects were signed with Saint Lucia (Youth
Empowerment Project) and Saint Vincent and the Grenadines (Technical and Vocational Education
and Training Development). The bank also provided significant support for Guyana´s Skills
Development and Employability Project through a loan and a grant (box 7).
Box 7
Skills Development and Employability Project in Guyana
The Ministry of Education of Guyana is implementing a project to deliver TVET equitably across the country.
With funding provided by the Caribbean Development Bank, the Ministry of Education will refurbish and expand
workshops, classrooms and labs in four secondary schools and three Practical Instruction Centres in regions
located away from the major population centres of the country.
This investment will allow these institutions to award Caribbean Vocational Qualification (CVQ) certifications
in five subject areas. The principal objective is to increase the number of secondary school leavers with the
appropriate skills and competencies to successfully enter the job market, embark on an economic enterprise, or
pursue appropriate postsecondary/tertiary education and training.
Source: Ministry of Education of Guyana.
0
20
40
60
200
8
200
9
201
0
201
1
201
2
201
3
201
4
201
5
201
6
201
7
OPEC Fund for International Development United Nations
World Bank (IDA) Inter-American Development Bank,
Caribbean Development Bank EU Institutions
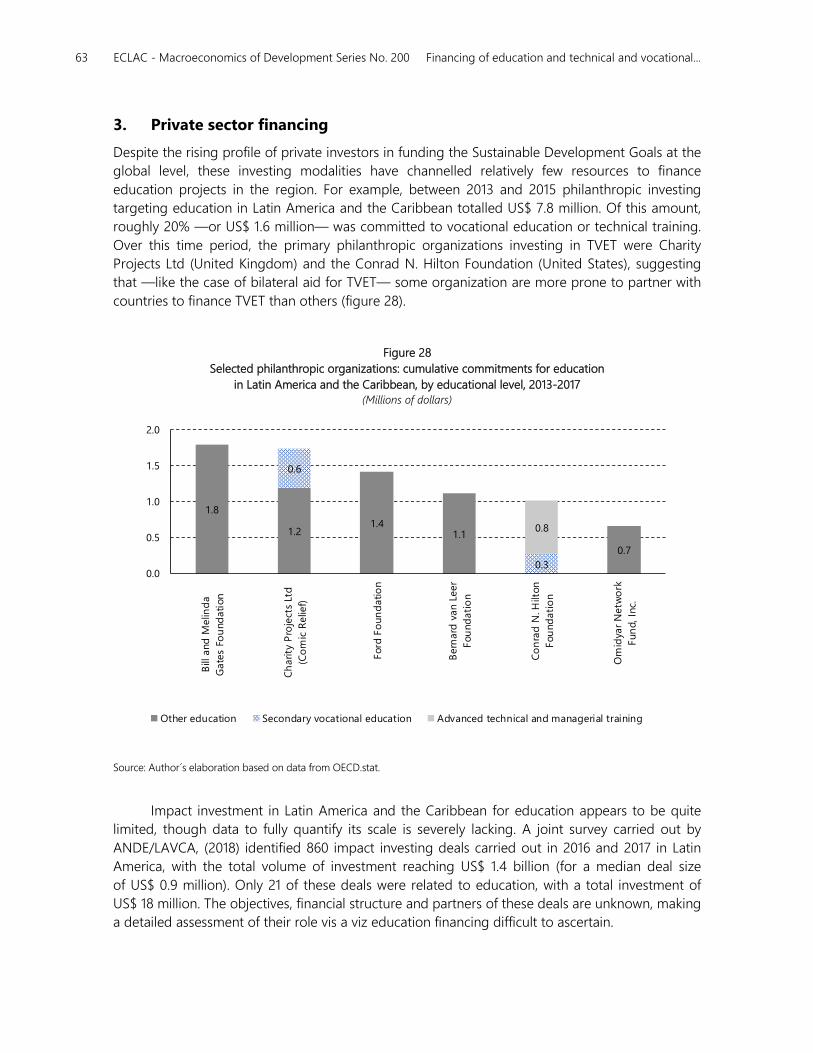
63 ECLAC - Macroeconomics of Development Series No. 200 Financing of education and technical and vocational...
3. Private sector financing
Despite the rising profile of private investors in funding the Sustainable Development Goals at the
global level, these investing modalities have channelled relatively few resources to finance
education projects in the region. For example, between 2013 and 2015 philanthropic investing
targeting education in Latin America and the Caribbean totalled US$ 7.8 million. Of this amount,
roughly 20% —or US$ 1.6 million— was committed to vocational education or technical training.
Over this time period, the primary philanthropic organizations investing in TVET were Charity
Projects Ltd (United Kingdom) and the Conrad N. Hilton Foundation (United States), suggesting
that —like the case of bilateral aid for TVET— some organization are more prone to partner with
countries to finance TVET than others (figure 28).
Figure 28
Selected philanthropic organizations: cumulative commitments for education
in Latin America and the Caribbean, by educational level, 2013-2017 (Millions of dollars)
Source: Author´s elaboration based on data from OECD.stat.
Impact investment in Latin America and the Caribbean for education appears to be quite
limited, though data to fully quantify its scale is severely lacking. A joint survey carried out by
ANDE/LAVCA, (2018) identified 860 impact investing deals carried out in 2016 and 2017 in Latin
America, with the total volume of investment reaching US$ 1.4 billion (for a median deal size
of US$ 0.9 million). Only 21 of these deals were related to education, with a total investment of
US$ 18 million. The objectives, financial structure and partners of these deals are unknown, making
a detailed assessment of their role vis a viz education financing difficult to ascertain.
1.8
1.21.4
1.1
0.7
0.6
0.3
0.8
0.0
0.5
1.0
1.5
2.0
Bill
and
Melin
da
Gate
s Fo
und
ati
on
Ch
arity
Pro
ject
s Lt
d
(Co
mic
Relie
f)
Ford
Fo
un
datio
n
Bern
ard
van L
eer
Fou
nd
ati
on
Co
nra
d N
. Hilt
on
Fou
nd
ati
on
Om
idya
r N
etw
ork
Fun
d, In
c.
Other education Secondary vocational education Advanced technical and managerial training

65 ECLAC - Macroeconomics of Development Series No. 200 Financing of education and technical and vocational...
IV. Conclusions and policy issues
Making progress towards the achievement of the targets set out in Sustainable Development
Goal 4, especially those related to TVET, will require a renewed effort to boost initial finance for
education. As this report has attempted to reveal, there is significant differences in initial financing
of education and TVET across countries as well as between the various actors in the education
and TVET market: governments, households, forms and outside investors. In that regard
public policies that target improving the level of TVET investment must be tailored to the specific
context of each country.
For Latin America and the Caribbean these efforts will necessarily take place in a period of
reduced policy space for implementing and financing public goods and services. Sustained low
levels of growth and fiscal consolidation both serve to limit the ability of countries to provide these
services while at the same time increasing the demand for them. TVET investment is not immune
to these pressures on government finances and therefore financing policies must look to mobilize
additional resources as well as improving the efficiency and effectiveness of existing financing
programs. In this context, the review of initial financing of education and TVET in the region
contained in this report suggests that policymakers consider the following issues:
Transparency of education expenditures at all levels aligned with administrative data. The
analysis of TVET financing in the region is extremely hampered by the dearth of statistical
information on its extent and its relative importance vis-a-viz other education spending. This lack
of information limits the ability to formulate and evaluate TVET financing policies (especially by civil
society). Additionally, without information linking spending with outcomes and results it is not
possible to analyse with the necessary rigour the efficiency and effectiveness of TVET investments.
National statistical agencies should be strengthened and empowered to capture timely
information on firms’ training programmes. Estimates based on ongoing economic surveys could
66 ECLAC - Macroeconomics of Development Series No. 200 Financing of education and technical and vocational...
provide invaluable insights into non-formal training and vocational education in the region allowing
for the formulation of holistic TVET policies.
Consider reforming tax expenditures for education spending. Evidence suggests that tax
expenditures for educational expenditures are largely captured by individuals at the upper end of
the income distribution (see section III.C.1). Seen as such, tax expenditures as a policy to expand
access to education for all is potentially an inefficient use of resources. Tax benefits for the personal
income tax are also poorly targeted, as much of the population of the region is exempt from the
tax as minimum extent income levels are high. While the foregone revenues due to these policies
are not large —0.16% of GDP on average— they are roughly equivalent to some countries’ initial
public financing of secondary level TVET.
Strengthening subnational resource mobilization. The provision of public goods and services,
particularly of education, has seen significant decentralization in the past decades in the region.
This decentralization has often suffered from a lack of overall coordination, which has served to
increase territorial inequities. At the same time resource mobilization of own-resources at the
subnational level remains very limited, resulting in a high dependence on transfers from the central
government. In this context, countries should strengthen their fiscal coordination frameworks while
at the same time creating incentives to increase the subnational tax take, especially from
instruments that tax immovable property.6
Property taxes have several favourable properties that make them particularly appropriate
for education finance: potentially large tax base with low tax rates, stable long-term revenue flows,
progressive incidence (higher income households typically pay more). However, to the extent that
these subnational own-revenues are used to finance public goods and services countries must
provide for equalization mechanism to limit potential inequities.
Strengthen financing synergies with firms. Public sector intervention will continue to play a
key role in governing and financing the formal and non-formal TVET market, but additional sources
of financing can and should be mobilized to respond to the needed investments in vocational
education foreseen in Sustainable Development Goals 4. Firms are important benefactors of TVET
and should therefore participate in its financing. In that sense, countries should review potential
opportunities for public private partnerships to share both the costs and the risks associated with
financing TVET. For example, several countries in the region are developing dual systems in line
with the German model —most prominently Mexico— but these remain limited.
Evaluate opportunities to channel resources from external sources to TVET. Impact investing
and philanthropic giving/investing are a rising phenomenon in sustainable development finance
around the world. At the global level private sector investors have already mobilized considerable
resources to finance projects that have a tangible social impact, while at the same time generating
a financial return. Impact investments in education, however, do not figure prominently in their
portfolios. Countries should evaluate the extent to which impact investing and philanthropic
6 The reform of the Mexican Fiscal Coordination Law in 2013 provides an example of how this might be accomplished. The
new measure modified the formula that determines the distribution of federal resources to subnational governments to
include tax effort. This change was introduced as a means to incentivize subnational governments to increase their tax take.
In particular, the measure was targeted at mobilizing revenues from property taxes.
67 ECLAC - Macroeconomics of Development Series No. 200 Financing of education and technical and vocational...
investing could play a role in financing specific projects in their countries and particularly how to
identify those projects and propose them to potential investors.
Consider the use of innovative forms of market financing. Social impact bonds and human
capital performance bonds are also a relatively recent development, but they may provide countries
with a unique opportunity to mobilize financing for the provision of social services. However, the
structure of these instruments is generally tied to the use of private providers, so countries must
consider carefully the role of the private sector in the provision of public goods and services. At the
global level these instruments are still in their infancy. This notwithstanding there are examples that
could provide insights for the region’s countries. For example, the development impact bond for
education in India that was launched in 2015.

69 ECLAC - Macroeconomics of Development Series No. 200 Financing of education and technical and vocational...
Bibliography
Almeida, R. & Carneiro, P. (2006), “The return to firm investment in human capital,” No. 3851,
The World Bank.
ANDE/LAVCA (2018), “The Impact Investing Landscape in Latin America: Trends 2016 & 2017”.
Antón, A. (2014), “The effect of payroll taxes on employment and wages under high labor informality”,
IZA Journal of Labor & Development, vol. 3, No. 1, December.
Azemati, H. et al. (2013), “Social impact bonds: lessons learned so far”, Community Development
Investment Review, No. 01.
Becker, G., Murphy, K. & Tamura, R. (1990), “Human Capital, Fertility, and Economic Growth”, Journal of
Political Economy, vol. 98, No. 5.
BIBB (Bundesinstitut für Berufsbildung) (2017), “Dual VET: Vocational Education and Training in Germany”,
accessed online at: https://www.bibb.de/dokumente/pdf/govet_praesentation_dual_vet_en.pdf.
Blundell, R. et al. (2005), “Human Capital Investment: The Returns from Education and Training to the
Individual, the Firm and the Economy”, Fiscal Studies, vol. 20, No. 1, February 2.
Cedefop - European Centre for the Development of Vocational Training (2011), The economic benefits
of VET for individuals, Luxembourg, Publications Office.
Cetrángolo, O. y J. Jiménez (2009), “Rigideces y espacios fiscales en América Latina”, Documentos de
Proyectos, N° 269 (LC/W.269), Santiago, Comisión Económica para América Latina y el Caribe (CEPAL).
DANE (2014), “Encuesta de Formación de Capital Humano 2012”.
ECLAC (Economic Commission for Latin America and the Caribbean) (2019), Fiscal Panorama of Latin America
and the Caribbean, 2019 (LC/PUB.2019/8-P), Santiago.
Flores-Lima, J. G. R., González-Velosa, C., & Rosas-Shady, D. (2014), Cinco hechos: Sobre la capacitación
en firma en America Latina y el Caribe.
GIIN (2018), “Annual Impact Investment Survey, 2018”.
Global Impact Investing Network (2018), “Annual Impact Investor Survey 2018: the eighth edition”.
70 ECLAC - Macroeconomics of Development Series No. 200 Financing of education and technical and vocational...
Gómez Sabaini, J. C. & Jiménez, J. P. (2017), La tributación en los gobiernos subnacionales, Naciones Unidas
Comisión Económica para América Latina y el Caribe (CEPAL).
Hanni, M., Martner Fanta, R. & Podestá, A. (2015), “El potencial redistributivo de la fiscalidad en América
Latina”, Revista CEPAL.
Hanushek, E. & Woessmann, L. (2012), “Do better schools lead to more growth? Cognitive skills, economic
outcomes, and causation”, Journal of Economic Growth, vol. 17, No. 4.
Heyneman, S. P., & Lee, B. (2016). “International organizations and the future of education assistance”,
International Journal of Educational Development, 48, 9–22.
IMF (2011), “Shifting Gears: Tackling Challenges on the Road to Fiscal Adjustmentî, April 2011”.
INEED (Instituto Nacional de Evaluación Educativa) (2017), “Informe sobre el estado de la educación en
Uruguay 2015-2016”.
INTECAP (Instituto Técnico de Capacitación y Productividad) (2017), “Informe de Auditoria Interna: Del 1 de
enero al 31 de diciembre 2016”, Guatemala.
Johanson, R. (2009). “A review of national training funds”, World Bank.
Kenyon, D. A. & Reschovsky, A. (2014), “Introduction to Special Issue on the Property Tax and the
Financing of K–12 Education”, Education Finance and Policy, vol. 9, No. 4, October.
Kugler, A. & Kugler, M. (2008), “Labor Market Effects of Payroll Taxes in Developing Countries: Evidence
from Colombia”, No. 13855, National Bureau of Economic Research, Inc.
Lucas, R. (1988), “On the mechanics of economic development”, Journal of Monetary Economics,
vol. 22, No. 1.
Marcel, M., M. Guzmán and M. Sanginés (2014), Presupuesto Para el Desarrollo en América Latina,
Inter-American Development Bank, Washington, DC.
Mincer, J. (1989), “Job Training: Costs, Returns, and Wage Profiles”, No. 3208, National Bureau
of Economic Research, Inc.
(1958), “Investment in Human Capital and Personal Income Distribution”, Journal of Political
Economy, vol. 66.
Ministerio de Trabajo, Empleo y Seguridad Social (2018), “Crédito para la Formación Profesional:
Preguntas Frecuentes”.
Montenegro, C. E. & Patrinos, H. A. (2014), Comparable Estimates of Returns to Schooling around
the World, Policy Research Working Papers, The World Bank, September.
OECD (2019), “Social Impact Investment 2019: The Impact Imperative for Sustainable Development”.
(2018), “Private Philanthropy for Development”.
(2015), Social Impact Investment: Building the Evidence Base, OECD Publishing, Paris.
Office of Management and Budget (2012), “Analysis of Office of Management and Budget, Analytical
Perspectives, Budget of the United States Government, Fiscal Year 2013”.
Receita Federal do Brasil (2017), “Grandes Números IRPF – Ano-Calendário 2016, Exercício 2017”.
Romer, P. M. (1986), “Increasing Returns and Long-Run Growth,” Journal of Political Economy, vol. 94,
No. 5, October.
Rothschild, S. (2013), “Human capital performance bonds”, Community Development Investment
Review, No. 01.
Secretaría de Hacienda y Crédito Público (2019), “Presupuesto de Gastos Fiscales 2018”.
SENAC (Serviço Nacional de Aprendizagem Comercial) (2018), “Demonstrações Contábeis Consolidadas
- exercício 2017”.
SENATI (Servicio Nacional de Adiestramiento en Trabajo Industrial) (2018), “Memoria Anual 2018”, Lima.
71 ECLAC - Macroeconomics of Development Series No. 200 Financing of education and technical and vocational...
Sepulveda, C. & Martinez-Vazquez, J. (2012), “Explaining property tax collections in developing countries:
the case of Latin America”, Decentralization and Reform in Latin America, Edward Elgar
Publishing, pg. 172–222.
Sevilla B., M. P. (2017), “Panorama de la educación técnica profesional en América Latina y el Caribe”,
No. 222, Naciones Unidas Comisión Económica para América Latina y el Caribe (CEPAL).
Stevens, A., Kurlaender, M. & Grosz, M. (2015), “Career Technical Education and Labor Market
Outcomes: Evidence from California Community Colleges”, No. 21137, National Bureau of
Economic Research, Inc.
Uhder, C. (2017), “Diversifying the funding sources for TVET”, pg. 24.
UNDP (United Nations Development Programme) (2010), “What Will It Take To Achieve the Millennium
Development Goals? An International Assessment”, June.
UNESCO (2016), “Education 2030: Incheon Declaration and Framework for Action for the implementation
of Sustainable Development Goal 4: Ensure inclusive and equitable quality education and promote
lifelong learning for all”.
(1984), Terminology of technical and vocational education, UNESCO, Paris, France.
UNESCO Institute for Statistics (2016), A roadmap to better data on education financing. Information
paper; 27, UNESCO Institute for Statistics, February.
72 ECLAC - Macroeconomics of Development Series No. 200 Financing of education and technical and vocational...
Series
Macroeconomics of Development.
Issues published
A complete list as well as pdf files are available at
www.eclac.org/publicaciones
200. Financing of education and technical and vocational education and training (TVET) in Latin America
and the Caribbean. Michael Hanni (LC/TS.2019/29), 2019.
199. La identificación y anticipación de brechas de habilidades laborales en América Latina: experiencias y
lecciones. Sonia Gontero y Sonia Albornoz (LC/TS.2019/11), 2019.
198. Metodología para la construcción de un indicador adelantado de flujos de capitales para 14 países de
América Latina, Pablo Carvallo, Cecilia Vera, Claudia de Camino y José Sánchez (LC/TS.2018/120), 2018.
197. Territorial inequality, equalization transfers and asymmetric sharing of non-renewable natural resources in
Latin America. Giorgio Brosio, Juan Pablo Jimenez and Ignacio Ruelas (LC/TS.2018/113), 2018.
196. Decentralized provision of education: methodological suggestions for analysis, with application to Mexico.
Giorgio Brosio (LC/TS.2018/108), 2018.
195. Ciclo de precios y regímenes fiscales vinculados con los recursos naturales no renovables en América Latina.
y el Caribe. Michael Hanni, Juan Pablo Jiménez e Ignacio Ruelas (LC/TS.2018/92), 2018.
194. Gastos e ingresos públicos de América Latina desde fines de los años ochenta hasta 2015. Tendencias
observadas, desafíos actuales y lineamientos de reformas. Oscar Cetrángolo, Javier Curcio, Juan Carlos
Gómez Sabaini y Dalmiro Morán (LC/TS.2018/61), 2018.
193. La construcción de sistemas de información sobre el mercado laboral en América Latina. Sonia Gontero y
María José Zambrano (LC/TS.018), 2018
192. Financiamiento y gasto educativo en América Latina. Oscar Cetrángolo y Javier Curcio (LC/TS.2017/95), 2017.
191. Evolución reciente del sector educativo en la región de América Latina y el Caribe. Casos de Chile, Colombia
y México. Oscar Cetrángolo, Javier Curcio y Florencia Calligaro (LC/TS.2017/94), 2017.
190. Las transformaciones tecnológicas y su impacto en los mercados laborales. Jürgen Weller (LC/TS.2017/76), 2017.
MACROECONOMICS OF DEVELOPMENTIssues published:
200. Financing of education and technical and vocational education and training (TVET) in Latin America and the Caribbean Michael Hanni
199. La identificación y anticipación de brechas de habilidades laborales en América Latina: experiencias y leccionesSonia Gontero y Sonia Albornoz
198. Metodología para la construcción de un indicador adelantado de flujos de capitales para 14 países de América LatinaPablo Carvallo, Cecilia Vera, Claudia de Camino y José Sánchez
197. Territorial inequality, equalization transfers and asymmetric sharing of non-renewable natural resources in Latin America Giorgio Brosio, Juan Pablo Jimenez and Ignacio Ruelas