11MAY 2017
FINANCIAL SERVICES
MAY 2017 (As of 3 May 2017) For updated information, please visit www.ibef.org
22MAY 2017 For updated information, please visit www.ibef.org
❖ Executive Summary…………………..…….3
❖ Advantage India……………………………..4
❖ Market Overview and Trends………..…….6
❖ Porter’s Five Force Analysis………………19
❖ Strategies Adopted.…………………..……21
❖ Growth Drivers………………………..…….23
❖ Opportunities…………………………..…...31
❖ Success Stories………………….…………35
❖ Useful Information…………………………..41
FINANCIAL SERVICES
MAY 2017
33MAY 2017 For updated information, please visit www.ibef.org
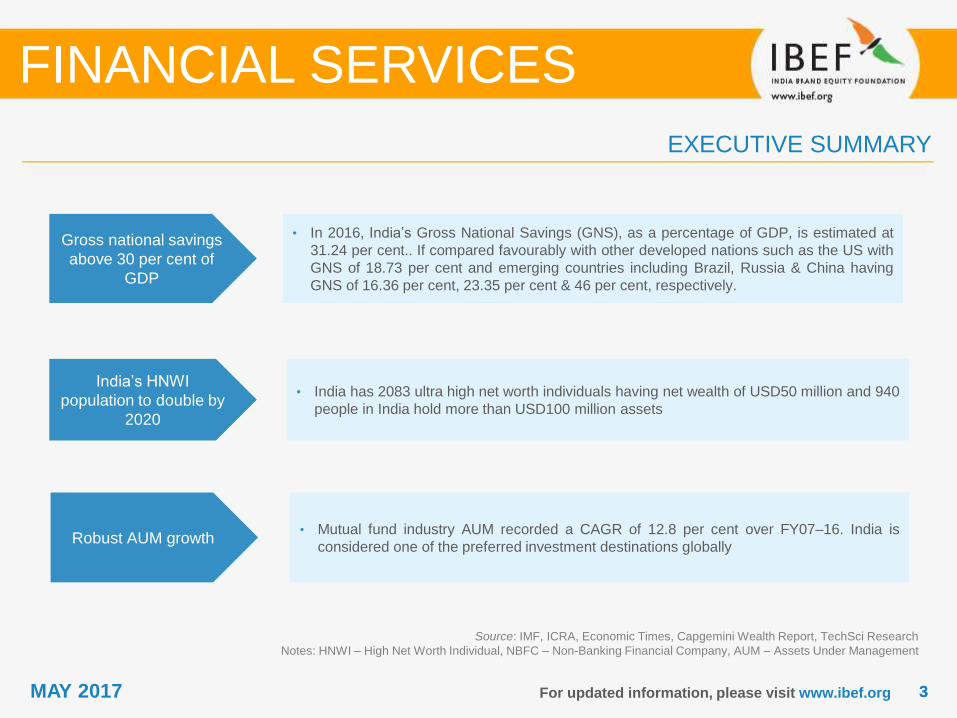
Gross national savings
above 30 per cent of
GDP
• In 2016, India’s Gross National Savings (GNS), as a percentage of GDP, is estimated at
31.24 per cent.. If compared favourably with other developed nations such as the US with
GNS of 18.73 per cent and emerging countries including Brazil, Russia & China having
GNS of 16.36 per cent, 23.35 per cent & 46 per cent, respectively.
India’s HNWI
population to double by
2020
• India has 2083 ultra high net worth individuals having net wealth of USD50 million and 940
people in India hold more than USD100 million assets
Source: IMF, ICRA, Economic Times, Capgemini Wealth Report, TechSci Research
Notes: HNWI – High Net Worth Individual, NBFC – Non-Banking Financial Company, AUM – Assets Under Management
EXECUTIVE SUMMARY
FINANCIAL SERVICES
Robust AUM growth• Mutual fund industry AUM recorded a CAGR of 12.8 per cent over FY07–16. India is
considered one of the preferred investment destinations globally

ADVANTAGE INDIA
FINANCIAL SERVICES
55MAY 2017
Growing demand
For updated information, please visit www.ibef.org
ADVANTAGE INDIA
Source: IMF, World Bank, KPMG report “Indian Mutual Fund Industry”, TechSci Research, Ministry of External Affairs
Notes: HNWI – High Net Worth Individual, NBFC – Non-Banking Financial Company, F – Forecast, NRFIP – National Rural Financial Inclusion Plan
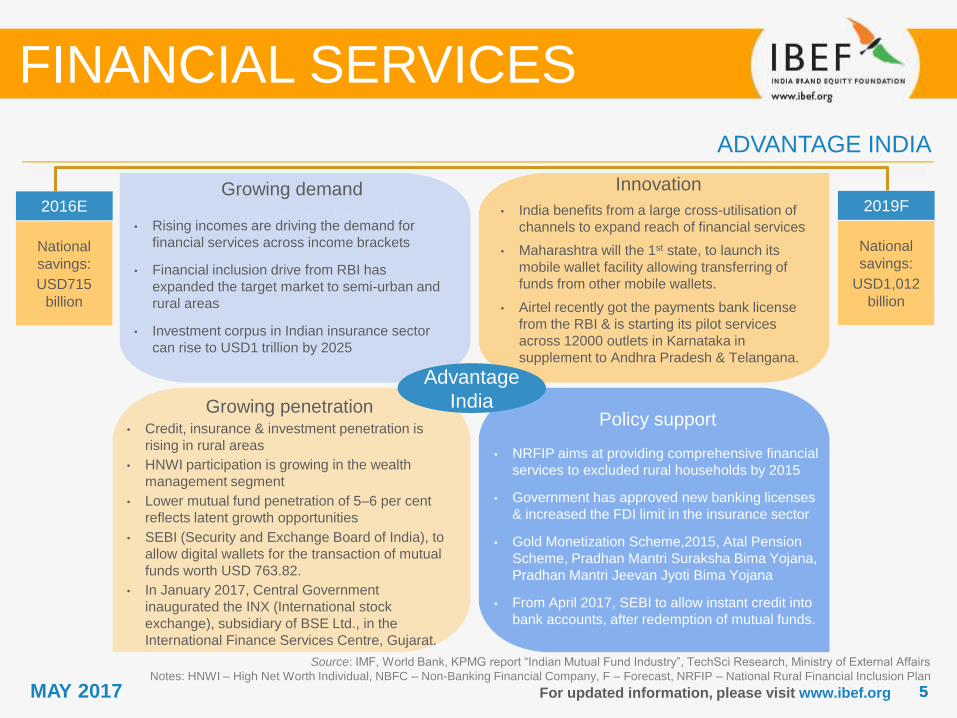
2016E
National
savings:
USD715
billion
2019F
National
savings:
USD1,012
billion
Advantage
India
FINANCIAL SERVICES
Growing demand
• Rising incomes are driving the demand for
financial services across income brackets
• Financial inclusion drive from RBI has
expanded the target market to semi-urban and
rural areas
• Investment corpus in Indian insurance sector
can rise to USD1 trillion by 2025
Innovation
• India benefits from a large cross-utilisation of
channels to expand reach of financial services
• Maharashtra will the 1st state, to launch its
mobile wallet facility allowing transferring of
funds from other mobile wallets.
• Airtel recently got the payments bank license
from the RBI & is starting its pilot services
across 12000 outlets in Karnataka in
supplement to Andhra Pradesh & Telangana.
Growing penetration• Credit, insurance & investment penetration is
rising in rural areas
• HNWI participation is growing in the wealth
management segment
• Lower mutual fund penetration of 5–6 per cent
reflects latent growth opportunities
• SEBI (Security and Exchange Board of India), to
allow digital wallets for the transaction of mutual
funds worth USD 763.82.
• In January 2017, Central Government
inaugurated the INX (International stock
exchange), subsidiary of BSE Ltd., in the
International Finance Services Centre, Gujarat.
Policy support
• NRFIP aims at providing comprehensive financial
services to excluded rural households by 2015
• Government has approved new banking licenses
& increased the FDI limit in the insurance sector
• Gold Monetization Scheme,2015, Atal Pension
Scheme, Pradhan Mantri Suraksha Bima Yojana,
Pradhan Mantri Jeevan Jyoti Bima Yojana
• From April 2017, SEBI to allow instant credit into
bank accounts, after redemption of mutual funds.

MARKET OVERVIEW AND TRENDS
FINANCIAL SERVICES
77MAY 2017 For updated information, please visit www.ibef.org
SEGMENTS OF THE FINANCIAL SERVICES SECTOR
FINANCIAL SERVICES
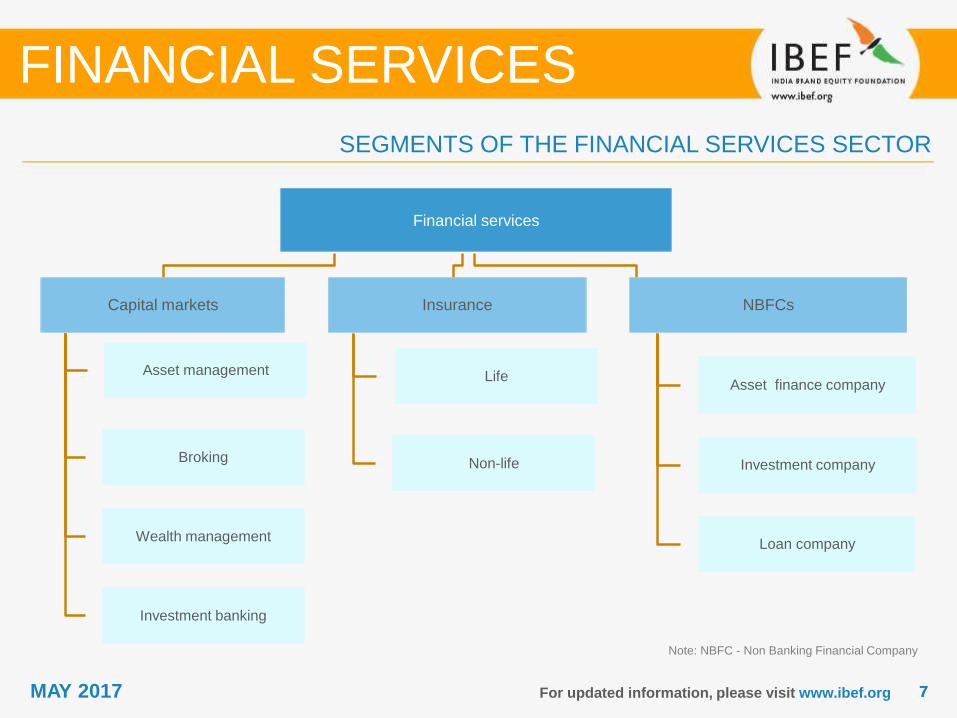
Financial services
Capital markets
Asset management
Broking
Wealth management
Investment banking
Insurance
Life
Non-life
NBFCs
Asset finance company
Investment company
Loan company
Note: NBFC - Non Banking Financial Company
88MAY 2017 For updated information, please visit www.ibef.org
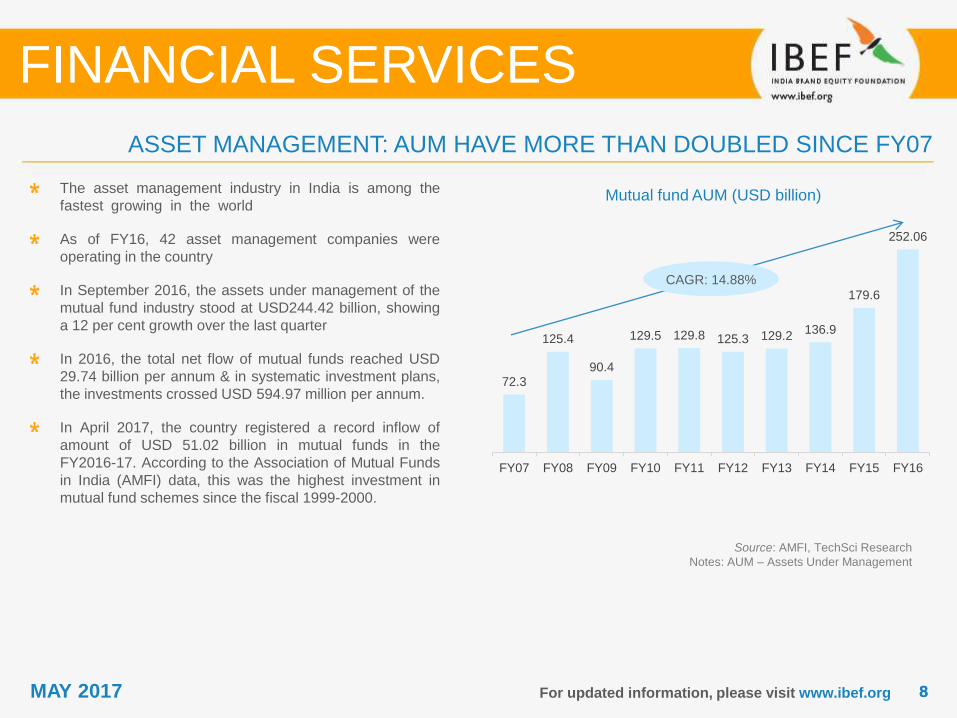
Mutual fund AUM (USD billion)
Source: AMFI, TechSci Research
Notes: AUM – Assets Under Management
The asset management industry in India is among the
fastest growing in the world
As of FY16, 42 asset management companies were
operating in the country
In September 2016, the assets under management of the
mutual fund industry stood at USD244.42 billion, showing
a 12 per cent growth over the last quarter
In 2016, the total net flow of mutual funds reached USD
29.74 billion per annum & in systematic investment plans,
the investments crossed USD 594.97 million per annum.
In April 2017, the country registered a record inflow of
amount of USD 51.02 billion in mutual funds in the
FY2016-17. According to the Association of Mutual Funds
in India (AMFI) data, this was the highest investment in
mutual fund schemes since the fiscal 1999-2000.
ASSET MANAGEMENT: AUM HAVE MORE THAN DOUBLED SINCE FY07
FINANCIAL SERVICES
CAGR: 14.88%
72.3
125.4
90.4
129.5 129.8 125.3 129.2136.9
179.6
252.06
FY07 FY08 FY09 FY10 FY11 FY12 FY13 FY14 FY15 FY16
99MAY 2017
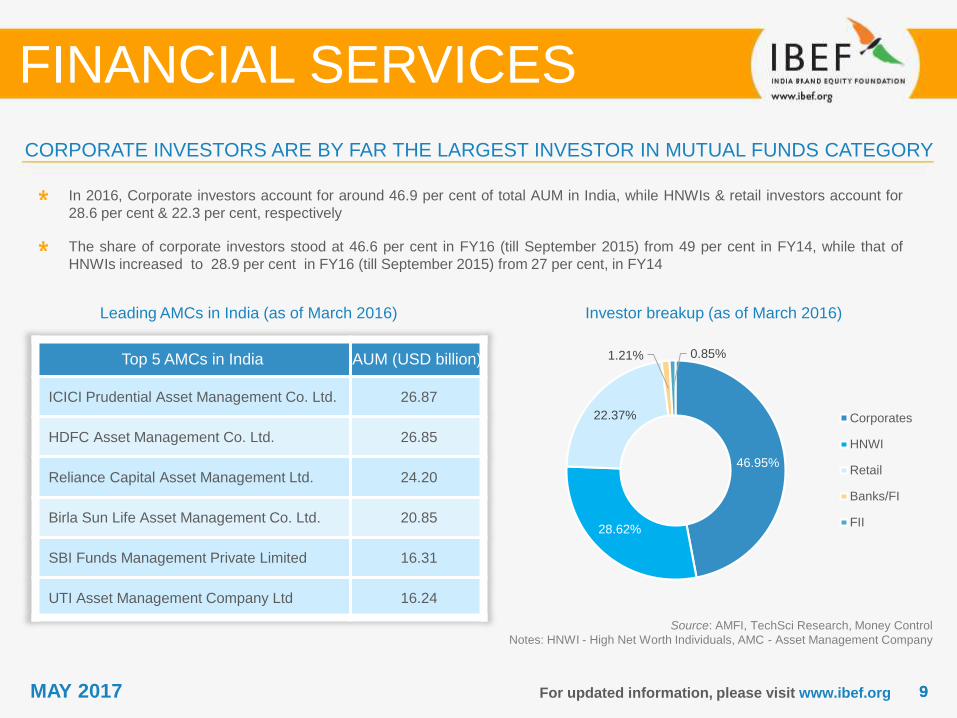
46.95%
28.62%
22.37%
1.21% 0.85%
Corporates
HNWI
Retail
Banks/FI
FII
For updated information, please visit www.ibef.org
CORPORATE INVESTORS ARE BY FAR THE LARGEST INVESTOR IN MUTUAL FUNDS CATEGORY
Leading AMCs in India (as of March 2016)
Source: AMFI, TechSci Research, Money Control
Notes: HNWI - High Net Worth Individuals, AMC - Asset Management Company
In 2016, Corporate investors account for around 46.9 per cent of total AUM in India, while HNWIs & retail investors account for
28.6 per cent & 22.3 per cent, respectively
The share of corporate investors stood at 46.6 per cent in FY16 (till September 2015) from 49 per cent in FY14, while that of
HNWIs increased to 28.9 per cent in FY16 (till September 2015) from 27 per cent, in FY14
Investor breakup (as of March 2016)
FINANCIAL SERVICES
Top 5 AMCs in India AUM (USD billion)
ICICI Prudential Asset Management Co. Ltd. 26.87
HDFC Asset Management Co. Ltd. 26.85
Reliance Capital Asset Management Ltd. 24.20
Birla Sun Life Asset Management Co. Ltd. 20.85
SBI Funds Management Private Limited 16.31
UTI Asset Management Company Ltd 16.24
1010MAY 2017
2083 100 99
194
294
108128
240254
354430
882
599
873
785
586
499466
718647
161
2201
19252068
1153
881
1811
AustralianSE
Hong KongSE
KoreaExchange
ShanghaiStock
Exchange
Taiwan SEGroup
NSE India
For updated information, please visit www.ibef.org
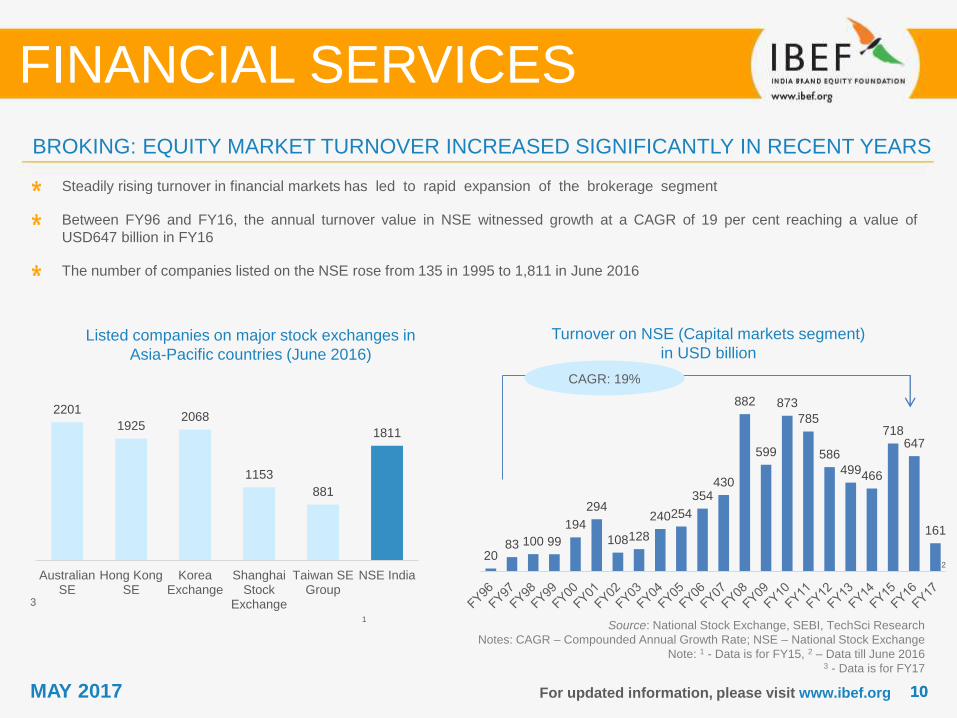
BROKING: EQUITY MARKET TURNOVER INCREASED SIGNIFICANTLY IN RECENT YEARS
Listed companies on major stock exchanges in
Asia-Pacific countries (June 2016)
Source: National Stock Exchange, SEBI, TechSci Research
Notes: CAGR – Compounded Annual Growth Rate; NSE – National Stock Exchange
Note: 1 - Data is for FY15, 2 – Data till June 20163 - Data is for FY17
Steadily rising turnover in financial markets has led to rapid expansion of the brokerage segment
Between FY96 and FY16, the annual turnover value in NSE witnessed growth at a CAGR of 19 per cent reaching a value of
USD647 billion in FY16
The number of companies listed on the NSE rose from 135 in 1995 to 1,811 in June 2016
Turnover on NSE (Capital markets segment)
in USD billion
FINANCIAL SERVICES
CAGR: 19%
1
2
3
1111MAY 2017 For updated information, please visit www.ibef.org
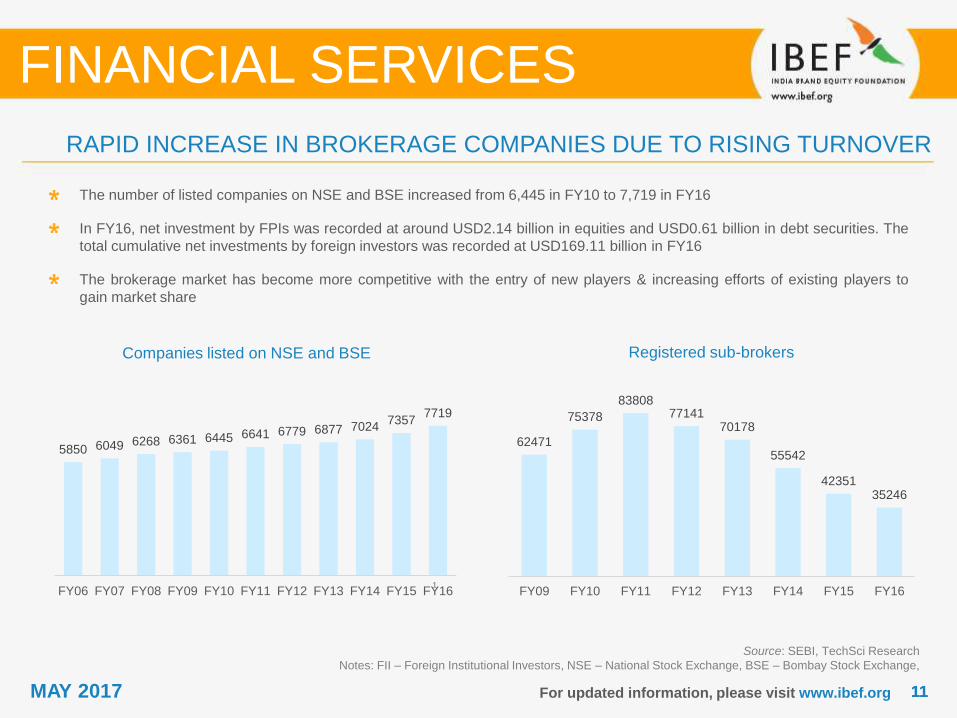
RAPID INCREASE IN BROKERAGE COMPANIES DUE TO RISING TURNOVER
Companies listed on NSE and BSE
Source: SEBI, TechSci Research
Notes: FII – Foreign Institutional Investors, NSE – National Stock Exchange, BSE – Bombay Stock Exchange,
The number of listed companies on NSE and BSE increased from 6,445 in FY10 to 7,719 in FY16
In FY16, net investment by FPIs was recorded at around USD2.14 billion in equities and USD0.61 billion in debt securities. The
total cumulative net investments by foreign investors was recorded at USD169.11 billion in FY16
The brokerage market has become more competitive with the entry of new players & increasing efforts of existing players to
gain market share
Registered sub-brokers
FINANCIAL SERVICES
1
5850 6049 6268 6361 6445 6641 6779 6877 70247357
7719
FY06 FY07 FY08 FY09 FY10 FY11 FY12 FY13 FY14 FY15 FY16
62471
75378
8380877141
70178
55542
4235135246
FY09 FY10 FY11 FY12 FY13 FY14 FY15 FY16
1212MAY 2017 For updated information, please visit www.ibef.org
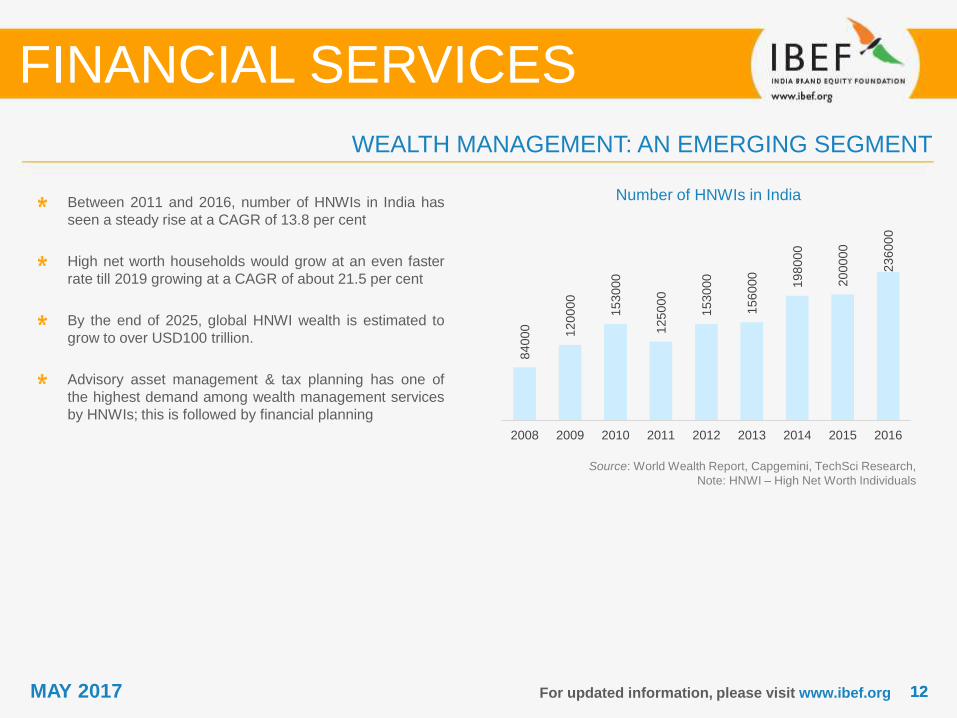
Number of HNWIs in India
Source: World Wealth Report, Capgemini, TechSci Research,
Note: HNWI – High Net Worth Individuals
Between 2011 and 2016, number of HNWIs in India has
seen a steady rise at a CAGR of 13.8 per cent
High net worth households would grow at an even faster
rate till 2019 growing at a CAGR of about 21.5 per cent
By the end of 2025, global HNWI wealth is estimated to
grow to over USD100 trillion.
Advisory asset management & tax planning has one of
the highest demand among wealth management services
by HNWIs; this is followed by financial planning
WEALTH MANAGEMENT: AN EMERGING SEGMENT
FINANCIAL SERVICES
84
00
0 12
00
00
15
30
00
12
50
00
15
30
00
15
60
00
19
80
00
20
00
00
23
60
00
2008 2009 2010 2011 2012 2013 2014 2015 2016
1313MAY 2017 For updated information, please visit www.ibef.org
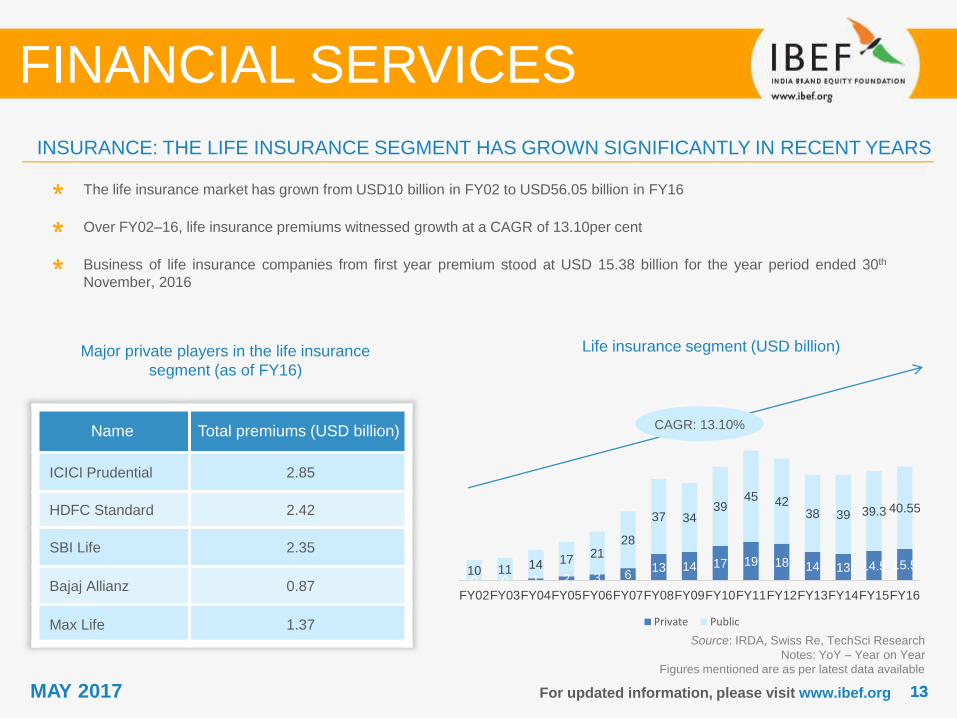
INSURANCE: THE LIFE INSURANCE SEGMENT HAS GROWN SIGNIFICANTLY IN RECENT YEARS
Major private players in the life insurance
segment (as of FY16)
Source: IRDA, Swiss Re, TechSci Research
Notes: YoY – Year on Year
Figures mentioned are as per latest data available
The life insurance market has grown from USD10 billion in FY02 to USD56.05 billion in FY16
Over FY02–16, life insurance premiums witnessed growth at a CAGR of 13.10per cent
Business of life insurance companies from first year premium stood at USD 15.38 billion for the year period ended 30th
November, 2016
Life insurance segment (USD billion)
FINANCIAL SERVICES
Name Total premiums (USD billion)
ICICI Prudential 2.85
HDFC Standard 2.42
SBI Life 2.35
Bajaj Allianz 0.87
Max Life 1.37
CAGR: 13.10%
0 0 1 2 3 613 14 17 19 18 14 13 14.5 15.510 11 14 17
2128
37 3439
45 4238 39 39.3 40.55
FY02FY03FY04FY05FY06FY07FY08FY09FY10FY11FY12FY13FY14FY15FY16
Private Public
1414MAY 2017
0.1
0.3
0.5
0.8 1.2 1.9
2.7
2.7
2.9
3.8
4.7
5.1
5.7
6.3
6.1
2.5 2.8 3.1 3.3 3
.6 3.8
4.4
4.2 4
.6
5.8
6.7 6.8 7
.2
7.7
7.3
FY
02
FY
03
FY
04
FY
05
FY
06
FY
07
FY
08
FY
09
FY
10
FY
11
FY
12
FY
13
FY
14
FY
15
FY
16
Private Public
For updated information, please visit www.ibef.org
Non-life insurance premiums (USD billion)
Source: IRDA, General Insurance Council TechSci Research
Notes: YoY – Year on Year
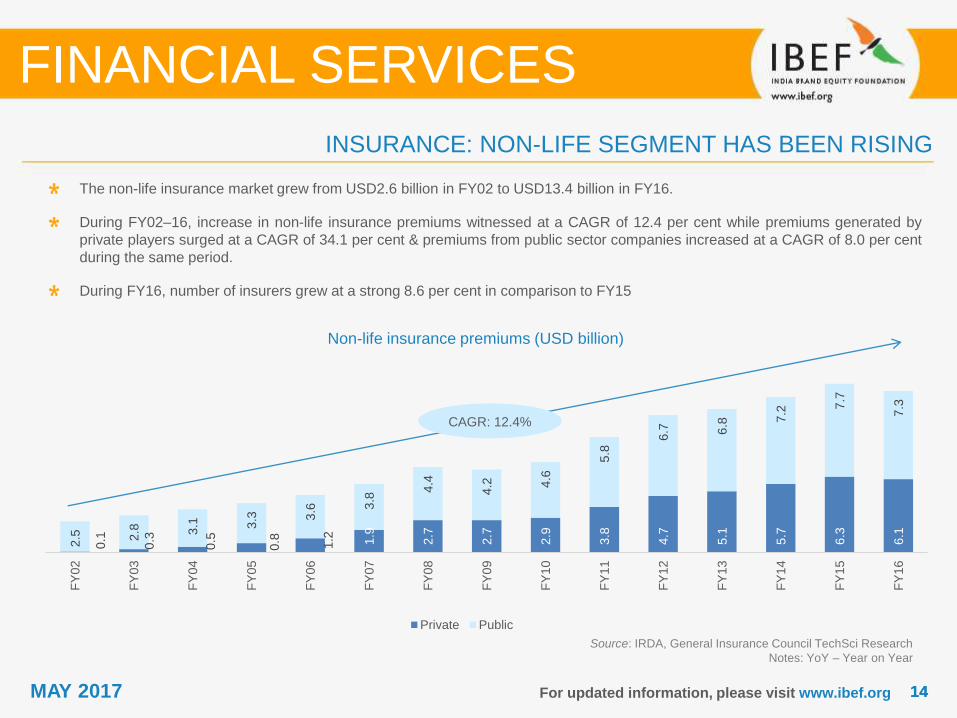
The non-life insurance market grew from USD2.6 billion in FY02 to USD13.4 billion in FY16.
During FY02–16, increase in non-life insurance premiums witnessed at a CAGR of 12.4 per cent while premiums generated by
private players surged at a CAGR of 34.1 per cent & premiums from public sector companies increased at a CAGR of 8.0 per cent
during the same period.
During FY16, number of insurers grew at a strong 8.6 per cent in comparison to FY15
INSURANCE: NON-LIFE SEGMENT HAS BEEN RISING
FINANCIAL SERVICES
CAGR: 12.4%
1515MAY 2017 For updated information, please visit www.ibef.org
Segment-wise breakup for Non-life insurance
premiums (upto November 2016)
Source: IRDA, TechSci Research
Notes: CAGR – Compounded Annual Growth Rate
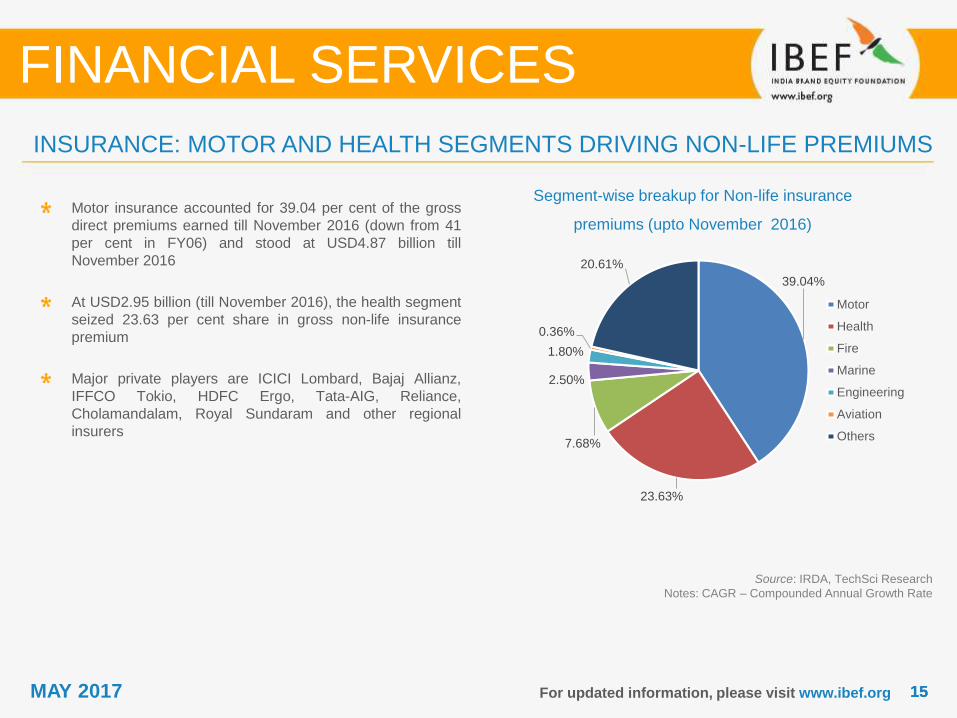
Motor insurance accounted for 39.04 per cent of the gross
direct premiums earned till November 2016 (down from 41
per cent in FY06) and stood at USD4.87 billion till
November 2016
At USD2.95 billion (till November 2016), the health segment
seized 23.63 per cent share in gross non-life insurance
premium
Major private players are ICICI Lombard, Bajaj Allianz,
IFFCO Tokio, HDFC Ergo, Tata-AIG, Reliance,
Cholamandalam, Royal Sundaram and other regional
insurers
INSURANCE: MOTOR AND HEALTH SEGMENTS DRIVING NON-LIFE PREMIUMS
FINANCIAL SERVICES
39.04%
23.63%
7.68%
2.50%
1.80%
0.36%
20.61%
Motor
Health
Fire
Marine
Engineering
Aviation
Others
1616MAY 2017 For updated information, please visit www.ibef.org
Growth in AUM of top-10 non-specialised NBFCs
(in USD billion)
Source: FICCI,
CRISIL, Dun and Bradstreet, ICRA, TechSci Research
Notes: AUM - Assets Under Management;
NBFC - Non Banking Financial Company
P-Provisional
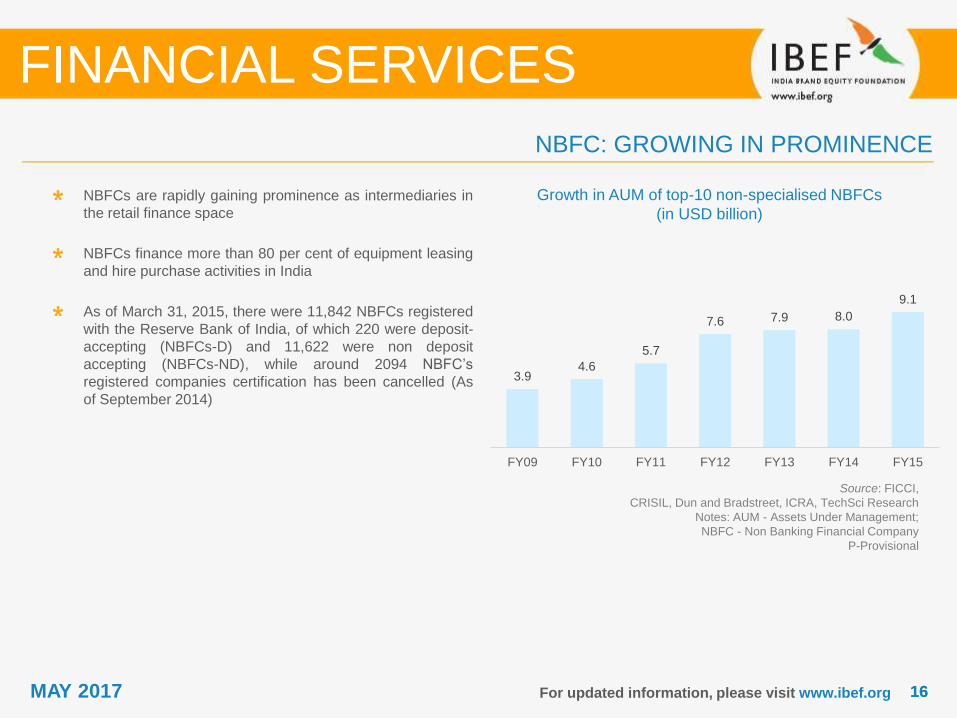
NBFCs are rapidly gaining prominence as intermediaries in
the retail finance space
NBFCs finance more than 80 per cent of equipment leasing
and hire purchase activities in India
As of March 31, 2015, there were 11,842 NBFCs registered
with the Reserve Bank of India, of which 220 were deposit-
accepting (NBFCs-D) and 11,622 were non deposit
accepting (NBFCs-ND), while around 2094 NBFC’s
registered companies certification has been cancelled (As
of September 2014)
NBFC: GROWING IN PROMINENCE
FINANCIAL SERVICES
3.94.6
5.7
7.6 7.9 8.0
9.1
FY09 FY10 FY11 FY12 FY13 FY14 FY15
1717MAY 2017 For updated information, please visit www.ibef.org
Insurance Sector
• New distribution channels such as bancassurance, online distribution & NBFCs have widened the
reach & reduced operational costs
• The life insurance sector has witnessed the launch of innovative products such as Unit Linked
Insurance Plans (ULIPs)
• Most general insurance public companies are planning to expand beyond Indian markets,
especially in South-East Asia & the Middle East
• Government announced to divest USD1.63 billion worth of stake in PSU general insurance
companies to execute the steep disinvestment target of USD10.78 billion, next fiscal year.
Mutual Fund
• During FY07-16, India’s AUM grew at a CAGR of 12.4 per cent, with the country’s overall AUM
reaching USD206.8 billion as of FY16
• In FY09, SEBI removed the entry load to bring about more transparency in commissions,
encouraging longer-term investment
• In its effort to encourage investments from smaller cities, SEBI allowed AMCs to hike expense ratio
up to 0.3 per cent on the condition of generating more than 30 per cent inflow from these cities
• During December 2016, mutual fund equity schemes attracted a net inflow of USD 1.50 billion
NOTABLE TRENDS IN THE FINANCIAL SERVICES SECTOR
FINANCIAL SERVICES
1818MAY 2017 For updated information, please visit www.ibef.org
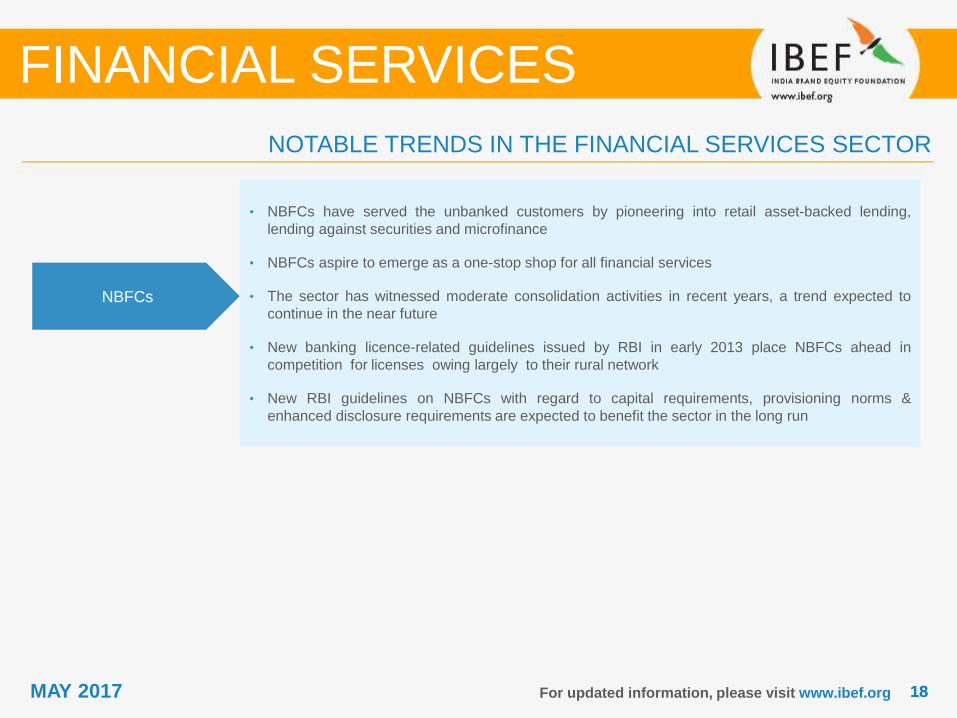
NOTABLE TRENDS IN THE FINANCIAL SERVICES SECTOR
FINANCIAL SERVICES
NBFCs
• NBFCs have served the unbanked customers by pioneering into retail asset-backed lending,
lending against securities and microfinance
• NBFCs aspire to emerge as a one-stop shop for all financial services
• The sector has witnessed moderate consolidation activities in recent years, a trend expected to
continue in the near future
• New banking licence-related guidelines issued by RBI in early 2013 place NBFCs ahead in
competition for licenses owing largely to their rural network
• New RBI guidelines on NBFCs with regard to capital requirements, provisioning norms &
enhanced disclosure requirements are expected to benefit the sector in the long run

PORTER FIVE FORCES ANALYSIS
FINANCIAL SERVICES
2020MAY 2017
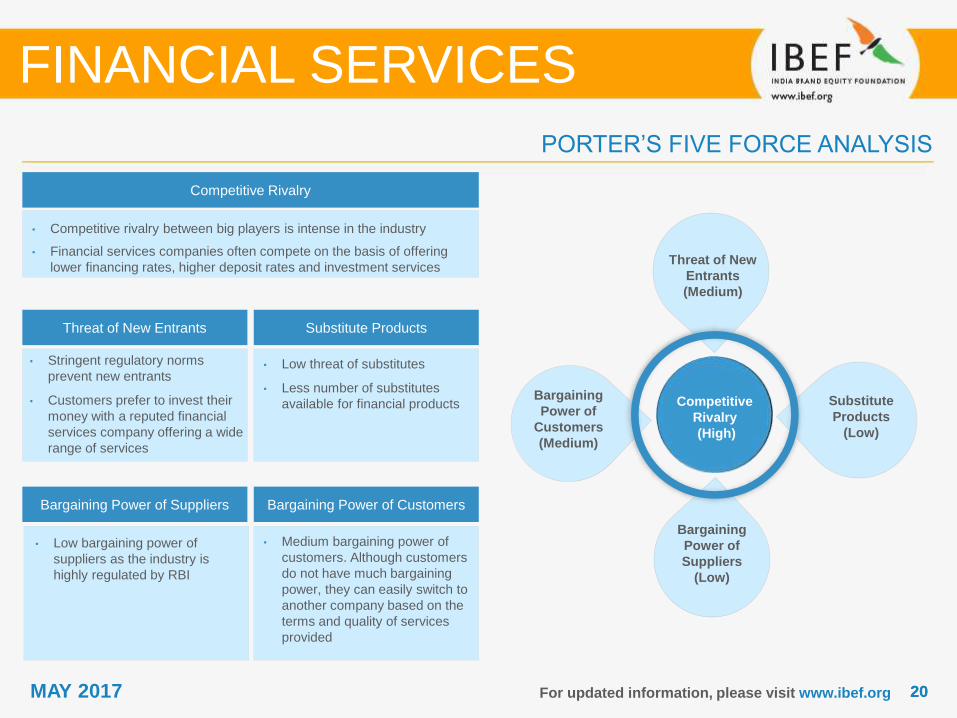
• Medium bargaining power of
customers. Although customers
do not have much bargaining
power, they can easily switch to
another company based on the
terms and quality of services
provided
Threat of New Entrants
For updated information, please visit www.ibef.org
PORTER’S FIVE FORCE ANALYSIS
FINANCIAL SERVICES
Competitive Rivalry
Bargaining Power of Suppliers Bargaining Power of Customers
• Low bargaining power of
suppliers as the industry is
highly regulated by RBI
• Competitive rivalry between big players is intense in the industry
• Financial services companies often compete on the basis of offering
lower financing rates, higher deposit rates and investment services
• Low threat of substitutes
• Less number of substitutes
available for financial products
Substitute Products
Competitive
Rivalry
(High)
Threat of New
Entrants
(Medium)
Substitute
Products
(Low)
Bargaining
Power of
Customers
(Medium)
Bargaining
Power of
Suppliers
(Low)
• Stringent regulatory norms
prevent new entrants
• Customers prefer to invest their
money with a reputed financial
services company offering a wide
range of services

STRATEGIES ADOPTED
FINANCIAL SERVICES
2222MAY 2017 For updated information, please visit www.ibef.org
STRATEGIES ADOPTED
FINANCIAL SERVICES
Source: Ministry of External Affairs, RBI
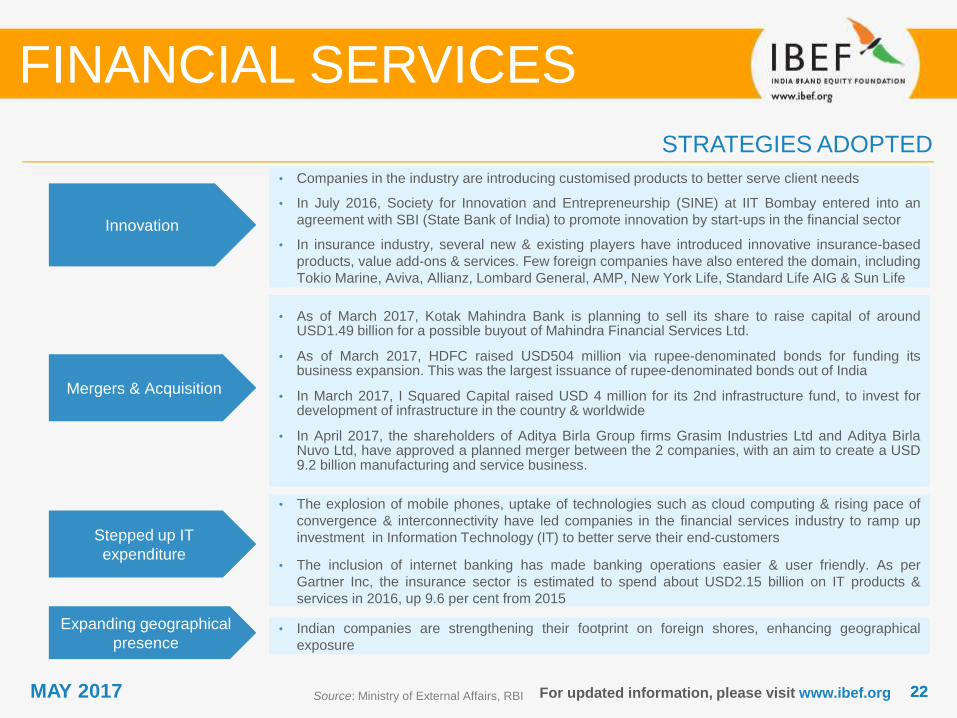
• Companies in the industry are introducing customised products to better serve client needs
• In July 2016, Society for Innovation and Entrepreneurship (SINE) at IIT Bombay entered into an
agreement with SBI (State Bank of India) to promote innovation by start-ups in the financial sector
• In insurance industry, several new & existing players have introduced innovative insurance-based
products, value add-ons & services. Few foreign companies have also entered the domain, including
Tokio Marine, Aviva, Allianz, Lombard General, AMP, New York Life, Standard Life AIG & Sun Life
• As of March 2017, Kotak Mahindra Bank is planning to sell its share to raise capital of aroundUSD1.49 billion for a possible buyout of Mahindra Financial Services Ltd.
• As of March 2017, HDFC raised USD504 million via rupee-denominated bonds for funding itsbusiness expansion. This was the largest issuance of rupee-denominated bonds out of India
• In March 2017, I Squared Capital raised USD 4 million for its 2nd infrastructure fund, to invest fordevelopment of infrastructure in the country & worldwide
• In April 2017, the shareholders of Aditya Birla Group firms Grasim Industries Ltd and Aditya BirlaNuvo Ltd, have approved a planned merger between the 2 companies, with an aim to create a USD9.2 billion manufacturing and service business.
• The explosion of mobile phones, uptake of technologies such as cloud computing & rising pace of
convergence & interconnectivity have led companies in the financial services industry to ramp up
investment in Information Technology (IT) to better serve their end-customers
• The inclusion of internet banking has made banking operations easier & user friendly. As per
Gartner Inc, the insurance sector is estimated to spend about USD2.15 billion on IT products &
services in 2016, up 9.6 per cent from 2015
• Indian companies are strengthening their footprint on foreign shores, enhancing geographical
exposure
Innovation
Mergers & Acquisition
Stepped up IT
expenditure
Expanding geographical
presence
GROWTH DRIVERS
FINANCIAL SERVICES
2424MAY 2017
620 632683
648 669715
765
846
940
2011 2012 2013 2014 2015 2016E 2017F 2018F 2019F
For updated information, please visit www.ibef.org
Gross national savings (USD billion)
Source: IMF, Reserve Bank of India,
Deloitte Center for Financial Services
Note: F – Forecasts, E –Estimated
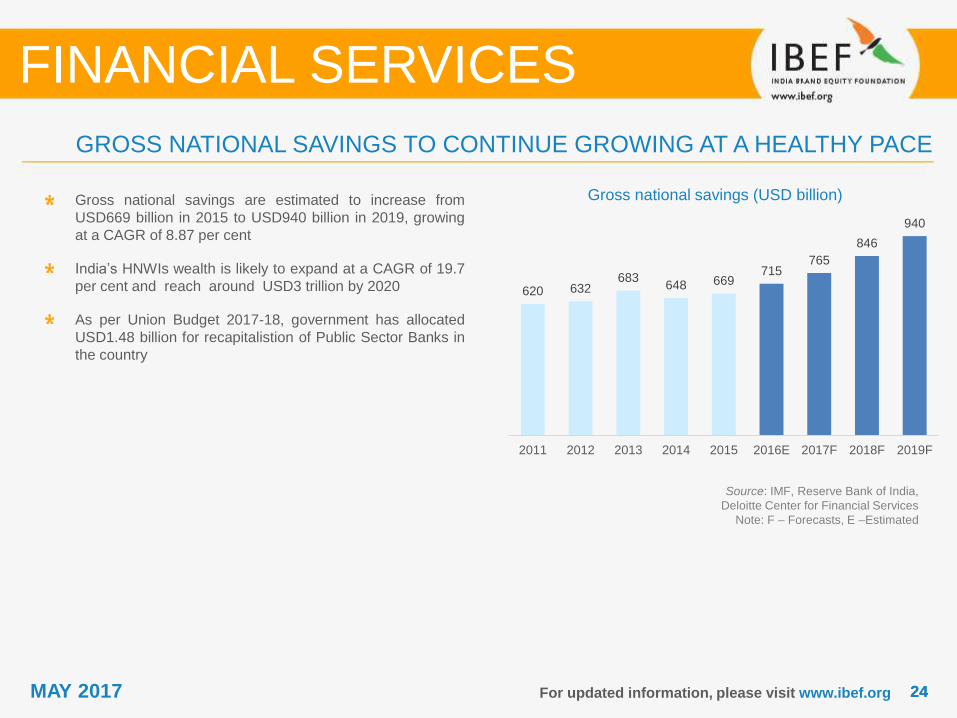
Gross national savings are estimated to increase from
USD669 billion in 2015 to USD940 billion in 2019, growing
at a CAGR of 8.87 per cent
India’s HNWIs wealth is likely to expand at a CAGR of 19.7
per cent and reach around USD3 trillion by 2020
As per Union Budget 2017-18, government has allocated
USD1.48 billion for recapitalistion of Public Sector Banks in
the country
GROSS NATIONAL SAVINGS TO CONTINUE GROWING AT A HEALTHY PACE
FINANCIAL SERVICES
2525MAY 2017
46
4
56
7
10
89
16
25 32
53
23
98 37
26
64
18
65
39
58
06
63
39
92
25
10
25
4
FY
04
FY
05
FY
06
FY
07
FY
08
FY
09
FY
10
FY
11
FY
12
FY
13
FY
14
FY
15
FY
16
For updated information, please visit www.ibef.org
Number of listed companies - NSE
Source: National Stock Exchange, TechSci Research
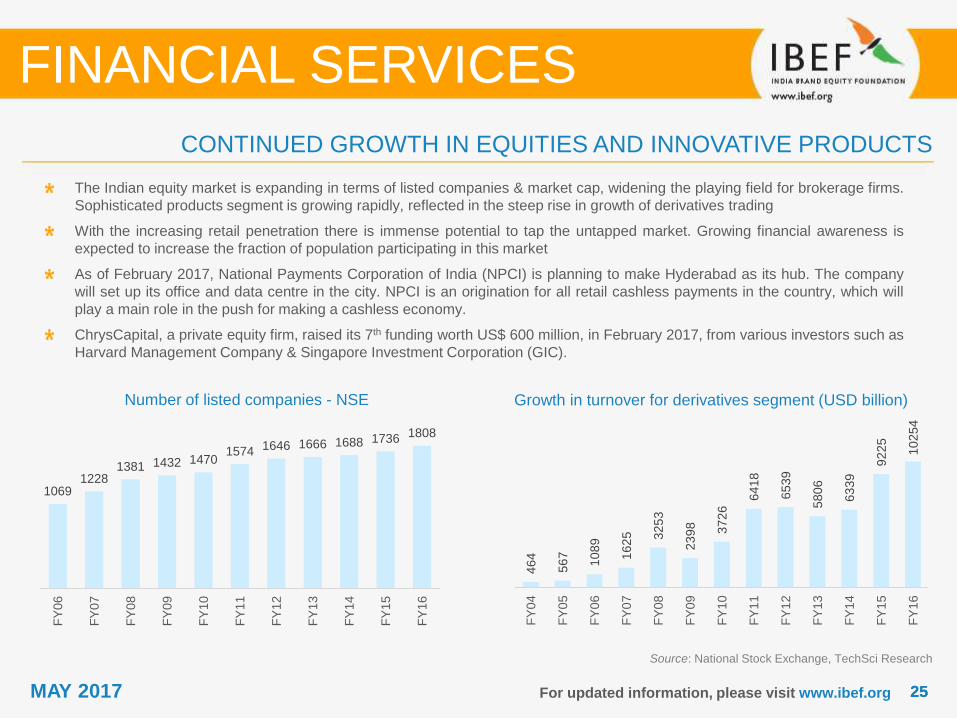
The Indian equity market is expanding in terms of listed companies & market cap, widening the playing field for brokerage firms.
Sophisticated products segment is growing rapidly, reflected in the steep rise in growth of derivatives trading
With the increasing retail penetration there is immense potential to tap the untapped market. Growing financial awareness is
expected to increase the fraction of population participating in this market
As of February 2017, National Payments Corporation of India (NPCI) is planning to make Hyderabad as its hub. The company
will set up its office and data centre in the city. NPCI is an origination for all retail cashless payments in the country, which will
play a main role in the push for making a cashless economy.
ChrysCapital, a private equity firm, raised its 7th funding worth US$ 600 million, in February 2017, from various investors such as
Harvard Management Company & Singapore Investment Corporation (GIC).
Growth in turnover for derivatives segment (USD billion)
FINANCIAL SERVICES
CONTINUED GROWTH IN EQUITIES AND INNOVATIVE PRODUCTS
10691228
1381 1432 14701574 1646 1666 1688 1736 1808
FY
06
FY
07
FY
08
FY
09
FY
10
FY
11
FY
12
FY
13
FY
14
FY
15
FY
16
2626MAY 2017 For updated information, please visit www.ibef.org
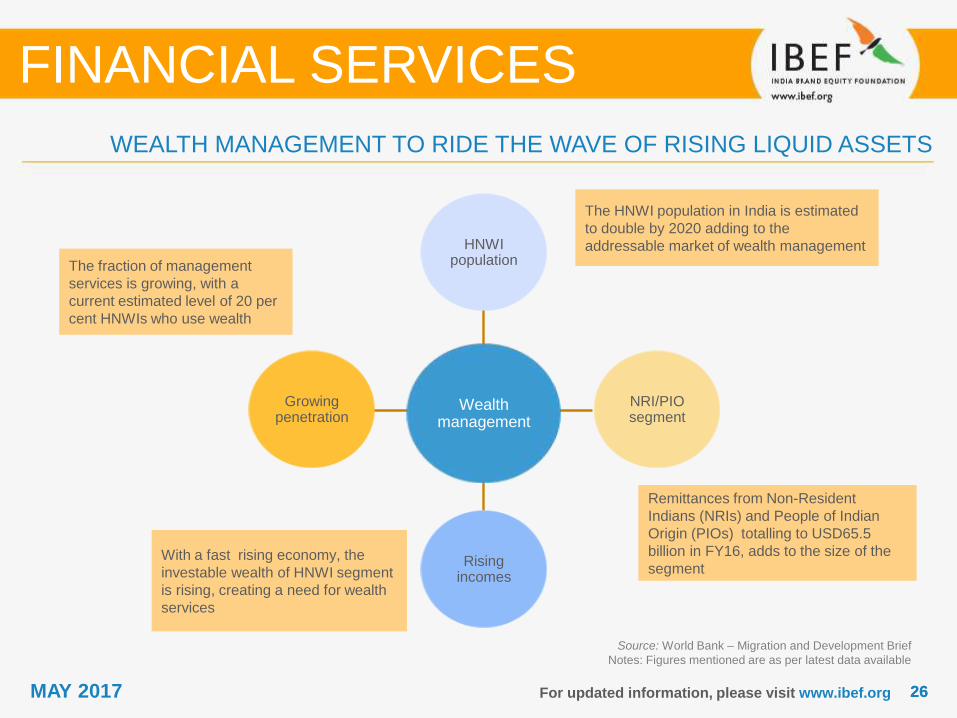
With a fast rising economy, the
investable wealth of HNWI segment
is rising, creating a need for wealth
services
Remittances from Non-Resident
Indians (NRIs) and People of Indian
Origin (PIOs) totalling to USD65.5
billion in FY16, adds to the size of the
segment
The HNWI population in India is estimated
to double by 2020 adding to the
addressable market of wealth management
FINANCIAL SERVICES
Wealth management
HNWI population
NRI/PIO segment
Rising incomes
Growing penetration
The fraction of management
services is growing, with a
current estimated level of 20 per
cent HNWIs who use wealth
WEALTH MANAGEMENT TO RIDE THE WAVE OF RISING LIQUID ASSETS
Source: World Bank – Migration and Development Brief
Notes: Figures mentioned are as per latest data available
2727MAY 2017 For updated information, please visit www.ibef.org
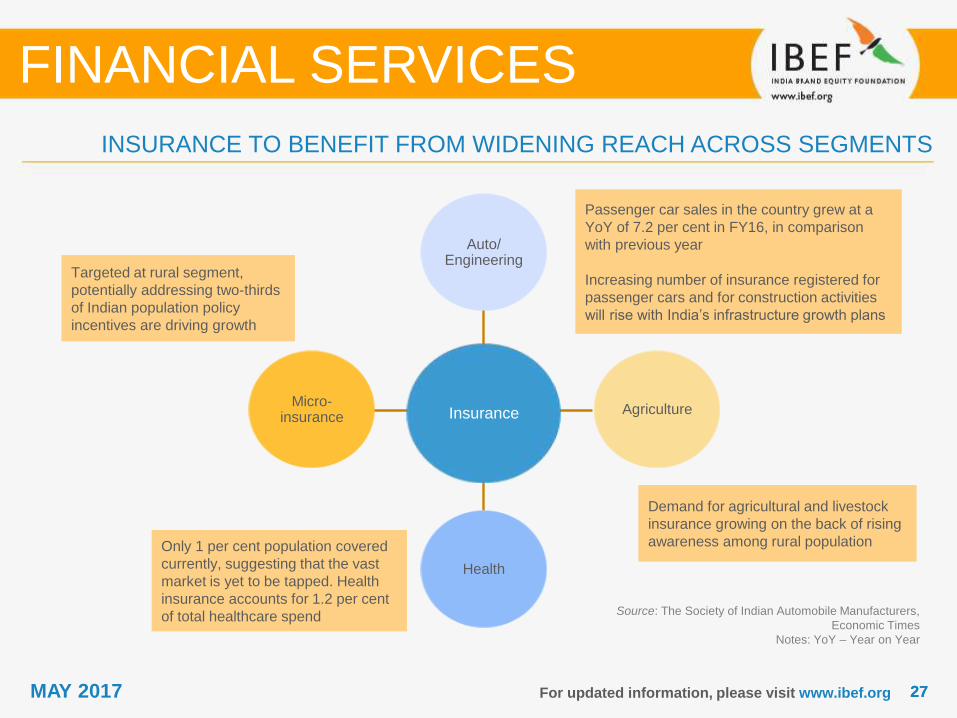
Only 1 per cent population covered
currently, suggesting that the vast
market is yet to be tapped. Health
insurance accounts for 1.2 per cent
of total healthcare spend
Demand for agricultural and livestock
insurance growing on the back of rising
awareness among rural population
Passenger car sales in the country grew at a
YoY of 7.2 per cent in FY16, in comparison
with previous year
Increasing number of insurance registered for
passenger cars and for construction activities
will rise with India’s infrastructure growth plans
FINANCIAL SERVICES
Insurance
Auto/ Engineering
Agriculture
Health
Micro-insurance
Targeted at rural segment,
potentially addressing two-thirds
of Indian population policy
incentives are driving growth
Source: The Society of Indian Automobile Manufacturers,
Economic Times
Notes: YoY – Year on Year
INSURANCE TO BENEFIT FROM WIDENING REACH ACROSS SEGMENTS
2828MAY 2017For updated information, please visit www.ibef.org
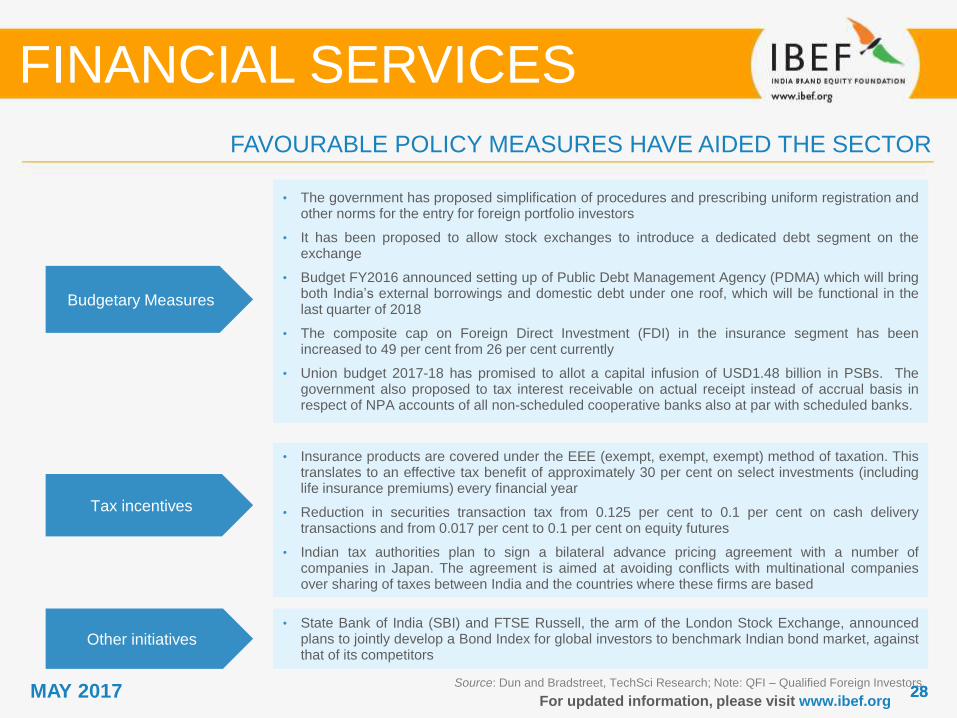
Budgetary Measures
• The government has proposed simplification of procedures and prescribing uniform registration andother norms for the entry for foreign portfolio investors
• It has been proposed to allow stock exchanges to introduce a dedicated debt segment on theexchange
• Budget FY2016 announced setting up of Public Debt Management Agency (PDMA) which will bringboth India’s external borrowings and domestic debt under one roof, which will be functional in thelast quarter of 2018
• The composite cap on Foreign Direct Investment (FDI) in the insurance segment has beenincreased to 49 per cent from 26 per cent currently
• Union budget 2017-18 has promised to allot a capital infusion of USD1.48 billion in PSBs. Thegovernment also proposed to tax interest receivable on actual receipt instead of accrual basis inrespect of NPA accounts of all non-scheduled cooperative banks also at par with scheduled banks.
Tax incentives
• Insurance products are covered under the EEE (exempt, exempt, exempt) method of taxation. Thistranslates to an effective tax benefit of approximately 30 per cent on select investments (includinglife insurance premiums) every financial year
• Reduction in securities transaction tax from 0.125 per cent to 0.1 per cent on cash deliverytransactions and from 0.017 per cent to 0.1 per cent on equity futures
• Indian tax authorities plan to sign a bilateral advance pricing agreement with a number ofcompanies in Japan. The agreement is aimed at avoiding conflicts with multinational companiesover sharing of taxes between India and the countries where these firms are based
Source: Dun and Bradstreet, TechSci Research; Note: QFI – Qualified Foreign Investors
FAVOURABLE POLICY MEASURES HAVE AIDED THE SECTOR
FINANCIAL SERVICES
Other initiatives • State Bank of India (SBI) and FTSE Russell, the arm of the London Stock Exchange, announced
plans to jointly develop a Bond Index for global investors to benchmark Indian bond market, againstthat of its competitors
2929MAY 2017 For updated information, please visit www.ibef.org
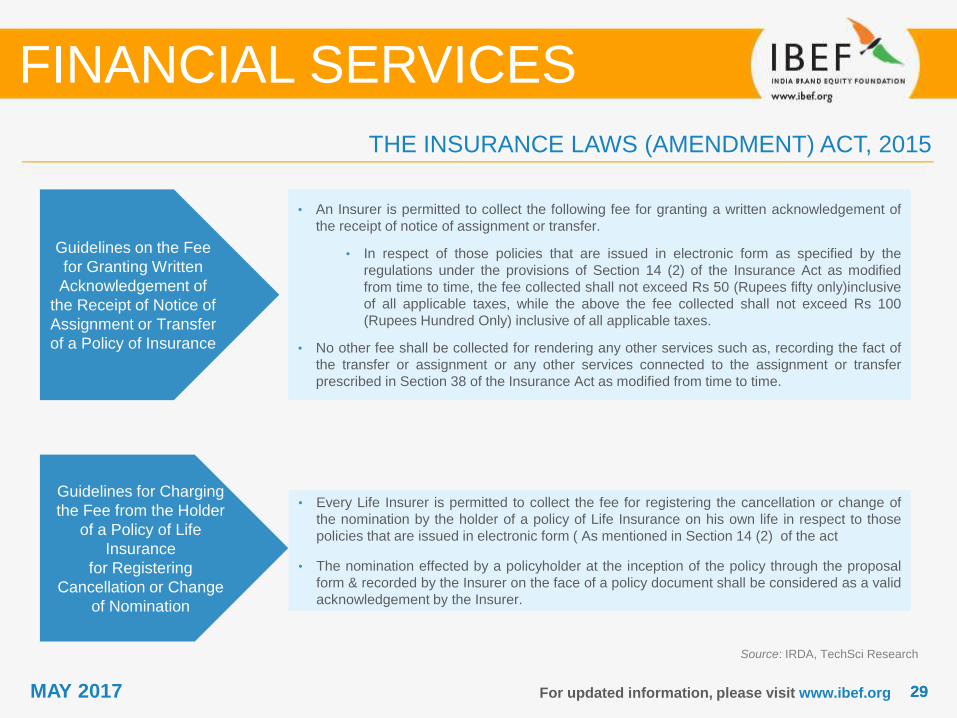
Guidelines on the Fee
for Granting Written
Acknowledgement of
the Receipt of Notice of
Assignment or Transfer
of a Policy of Insurance
• An Insurer is permitted to collect the following fee for granting a written acknowledgement of
the receipt of notice of assignment or transfer.
• In respect of those policies that are issued in electronic form as specified by the
regulations under the provisions of Section 14 (2) of the Insurance Act as modified
from time to time, the fee collected shall not exceed Rs 50 (Rupees fifty only)inclusive
of all applicable taxes, while the above the fee collected shall not exceed Rs 100
(Rupees Hundred Only) inclusive of all applicable taxes.
• No other fee shall be collected for rendering any other services such as, recording the fact of
the transfer or assignment or any other services connected to the assignment or transfer
prescribed in Section 38 of the Insurance Act as modified from time to time.
Guidelines for Charging
the Fee from the Holder
of a Policy of Life
Insurance
for Registering
Cancellation or Change
of Nomination
• Every Life Insurer is permitted to collect the fee for registering the cancellation or change of
the nomination by the holder of a policy of Life Insurance on his own life in respect to those
policies that are issued in electronic form ( As mentioned in Section 14 (2) of the act
• The nomination effected by a policyholder at the inception of the policy through the proposal
form & recorded by the Insurer on the face of a policy document shall be considered as a valid
acknowledgement by the Insurer.
THE INSURANCE LAWS (AMENDMENT) ACT, 2015
FINANCIAL SERVICES
Source: IRDA, TechSci Research
3030MAY 2017 For updated information, please visit www.ibef.org
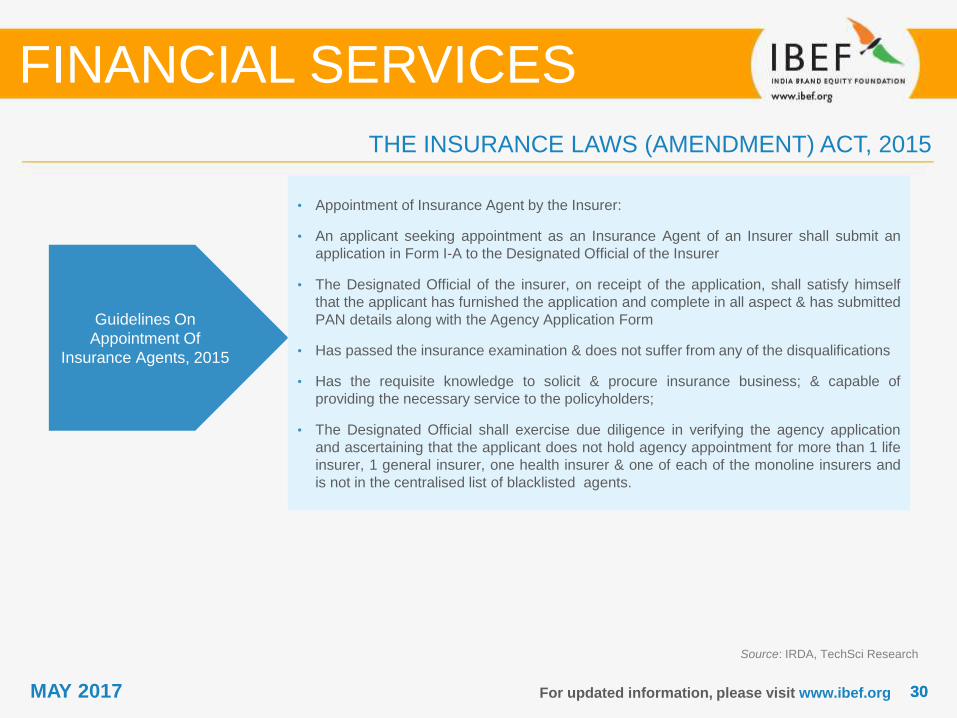
Guidelines On
Appointment Of
Insurance Agents, 2015
• Appointment of Insurance Agent by the Insurer:
• An applicant seeking appointment as an Insurance Agent of an Insurer shall submit an
application in Form I-A to the Designated Official of the Insurer
• The Designated Official of the insurer, on receipt of the application, shall satisfy himself
that the applicant has furnished the application and complete in all aspect & has submitted
PAN details along with the Agency Application Form
• Has passed the insurance examination & does not suffer from any of the disqualifications
• Has the requisite knowledge to solicit & procure insurance business; & capable of
providing the necessary service to the policyholders;
• The Designated Official shall exercise due diligence in verifying the agency application
and ascertaining that the applicant does not hold agency appointment for more than 1 life
insurer, 1 general insurer, one health insurer & one of each of the monoline insurers and
is not in the centralised list of blacklisted agents.
Source: IRDA, TechSci Research
THE INSURANCE LAWS (AMENDMENT) ACT, 2015
FINANCIAL SERVICES

OPPORTUNITIES
FINANCIAL SERVICES
3232MAY 2017 For updated information, please visit www.ibef.org
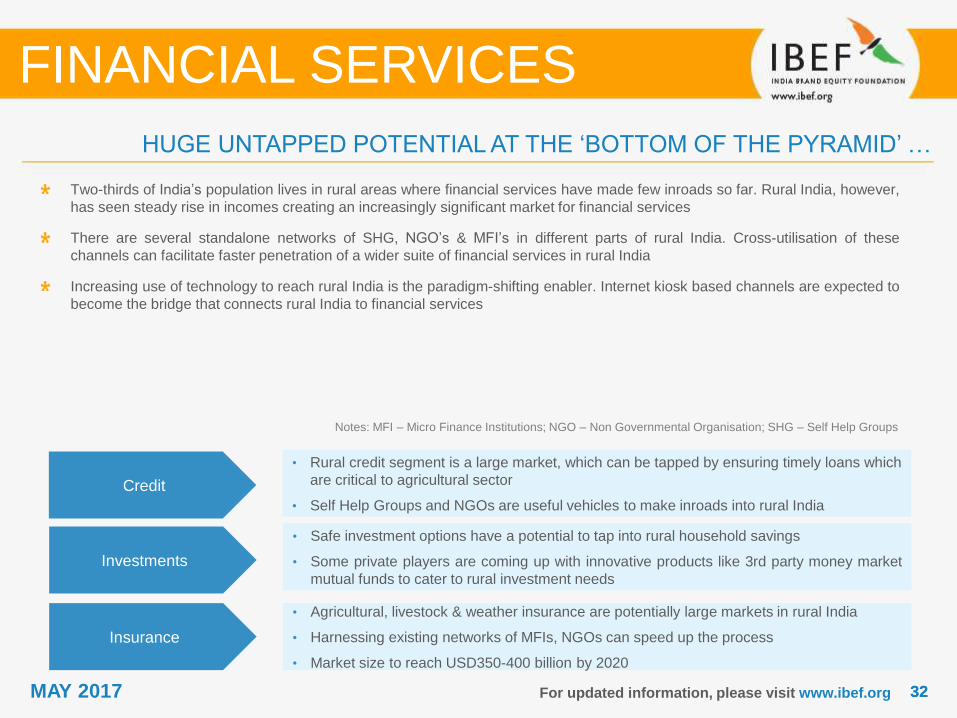
HUGE UNTAPPED POTENTIAL AT THE ‘BOTTOM OF THE PYRAMID’ …
Notes: MFI – Micro Finance Institutions; NGO – Non Governmental Organisation; SHG – Self Help Groups
Two-thirds of India’s population lives in rural areas where financial services have made few inroads so far. Rural India, however,
has seen steady rise in incomes creating an increasingly significant market for financial services
There are several standalone networks of SHG, NGO’s & MFI’s in different parts of rural India. Cross-utilisation of these
channels can facilitate faster penetration of a wider suite of financial services in rural India
Increasing use of technology to reach rural India is the paradigm-shifting enabler. Internet kiosk based channels are expected to
become the bridge that connects rural India to financial services
FINANCIAL SERVICES
Credit
• Rural credit segment is a large market, which can be tapped by ensuring timely loans which
are critical to agricultural sector
• Self Help Groups and NGOs are useful vehicles to make inroads into rural India
Investments
• Safe investment options have a potential to tap into rural household savings
• Some private players are coming up with innovative products like 3rd party money market
mutual funds to cater to rural investment needs
Insurance
• Agricultural, livestock & weather insurance are potentially large markets in rural India
• Harnessing existing networks of MFIs, NGOs can speed up the process
• Market size to reach USD350-400 billion by 2020
3333MAY 2017 For updated information, please visit www.ibef.org
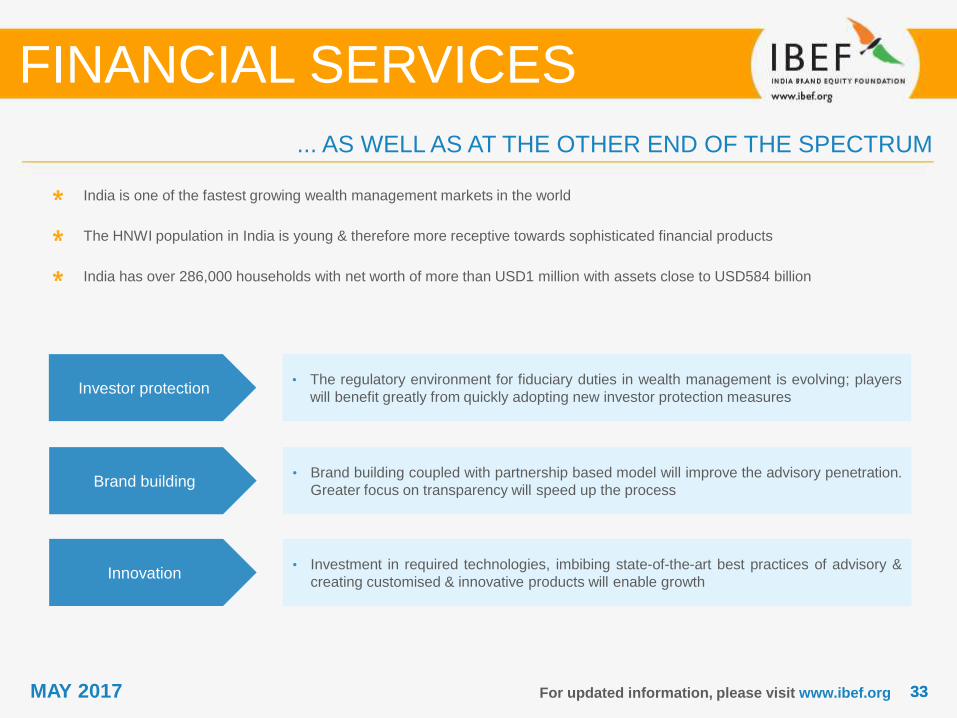
India is one of the fastest growing wealth management markets in the world
The HNWI population in India is young & therefore more receptive towards sophisticated financial products
India has over 286,000 households with net worth of more than USD1 million with assets close to USD584 billion
... AS WELL AS AT THE OTHER END OF THE SPECTRUM
FINANCIAL SERVICES
Investor protection• The regulatory environment for fiduciary duties in wealth management is evolving; players
will benefit greatly from quickly adopting new investor protection measures
Brand building• Brand building coupled with partnership based model will improve the advisory penetration.
Greater focus on transparency will speed up the process
Innovation• Investment in required technologies, imbibing state-of-the-art best practices of advisory &
creating customised & innovative products will enable growth
3434MAY 2017 For updated information, please visit www.ibef.org
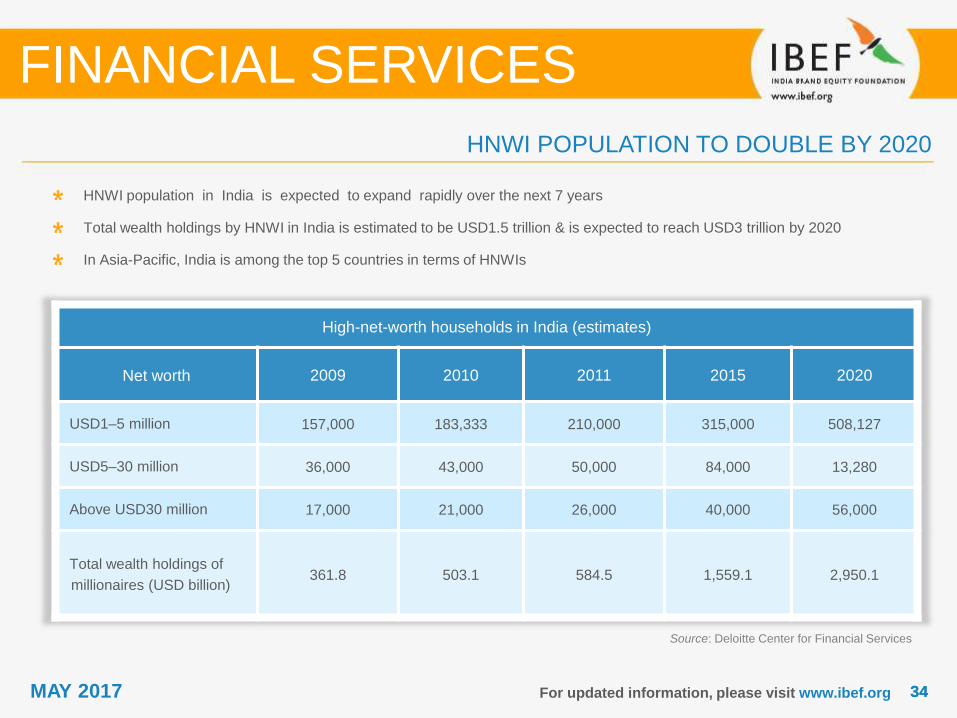
HNWI POPULATION TO DOUBLE BY 2020
Source: Deloitte Center for Financial Services
HNWI population in India is expected to expand rapidly over the next 7 years
Total wealth holdings by HNWI in India is estimated to be USD1.5 trillion & is expected to reach USD3 trillion by 2020
In Asia-Pacific, India is among the top 5 countries in terms of HNWIs
FINANCIAL SERVICES
High-net-worth households in India (estimates)
Net worth 2009 2010 2011 2015 2020
USD1–5 million 157,000 183,333 210,000 315,000 508,127
USD5–30 million 36,000 43,000 50,000 84,000 13,280
Above USD30 million 17,000 21,000 26,000 40,000 56,000
Total wealth holdings of
millionaires (USD billion)361.8 503.1 584.5 1,559.1 2,950.1

SUCCESS STORIES
FINANCIAL SERVICES
3636MAY 2017
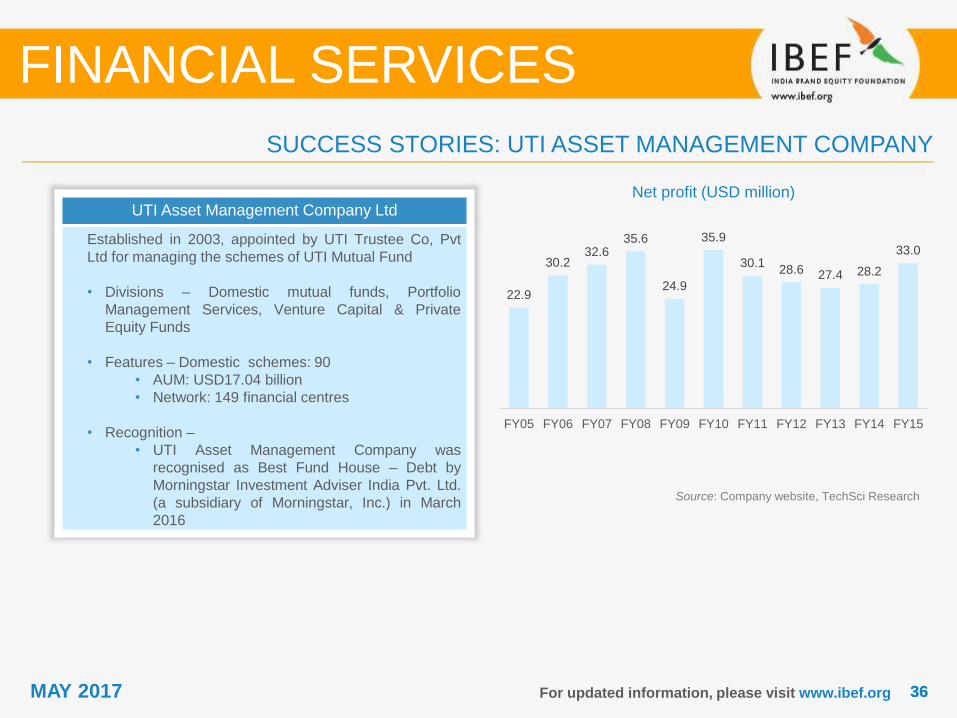
SUCCESS STORIES: UTI ASSET MANAGEMENT COMPANY
UTI Asset Management Company Ltd
Established in 2003, appointed by UTI Trustee Co, Pvt
Ltd for managing the schemes of UTI Mutual Fund
• Divisions – Domestic mutual funds, Portfolio
Management Services, Venture Capital & Private
Equity Funds
• Features – Domestic schemes: 90
• AUM: USD17.04 billion
• Network: 149 financial centres
• Recognition –
• UTI Asset Management Company was
recognised as Best Fund House – Debt by
Morningstar Investment Adviser India Pvt. Ltd.
(a subsidiary of Morningstar, Inc.) in March
2016
Net profit (USD million)
Source: Company website, TechSci Research
FINANCIAL SERVICES
For updated information, please visit www.ibef.org
22.9
30.232.6
35.6
24.9
35.9
30.128.6 27.4 28.2
33.0
FY05 FY06 FY07 FY08 FY09 FY10 FY11 FY12 FY13 FY14 FY15
3737MAY 2017
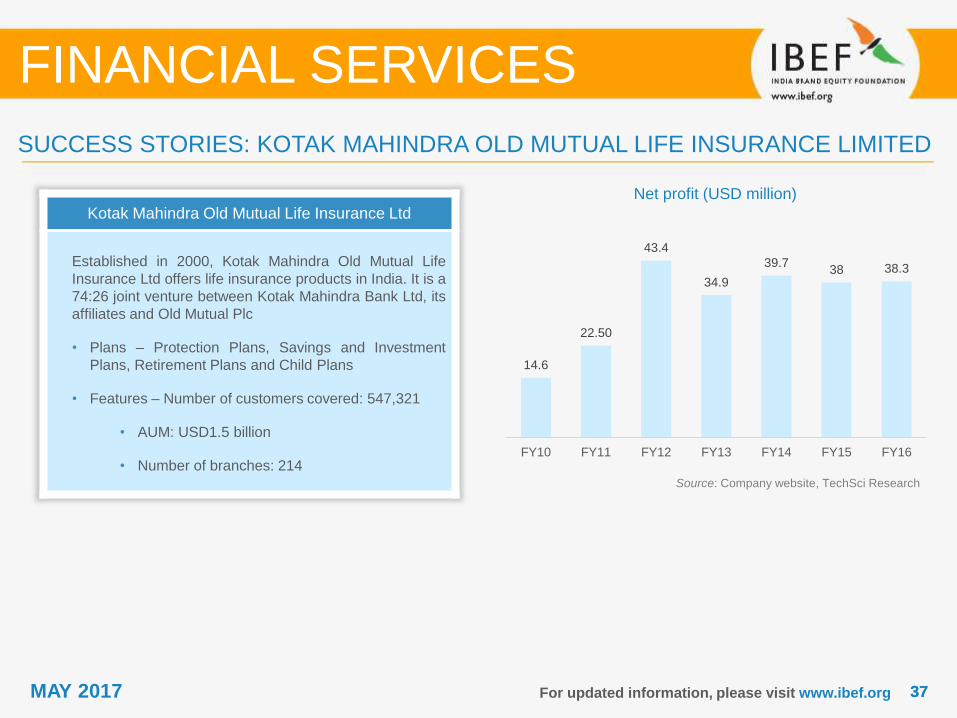
14.6
22.50
43.4
34.9
39.738 38.3
FY10 FY11 FY12 FY13 FY14 FY15 FY16
SUCCESS STORIES: KOTAK MAHINDRA OLD MUTUAL LIFE INSURANCE LIMITED
Kotak Mahindra Old Mutual Life Insurance Ltd
Established in 2000, Kotak Mahindra Old Mutual Life
Insurance Ltd offers life insurance products in India. It is a
74:26 joint venture between Kotak Mahindra Bank Ltd, its
affiliates and Old Mutual Plc
• Plans – Protection Plans, Savings and Investment
Plans, Retirement Plans and Child Plans
• Features – Number of customers covered: 547,321
• AUM: USD1.5 billion
• Number of branches: 214
Net profit (USD million)
Source: Company website, TechSci Research
FINANCIAL SERVICES
For updated information, please visit www.ibef.org
3838MAY 2017
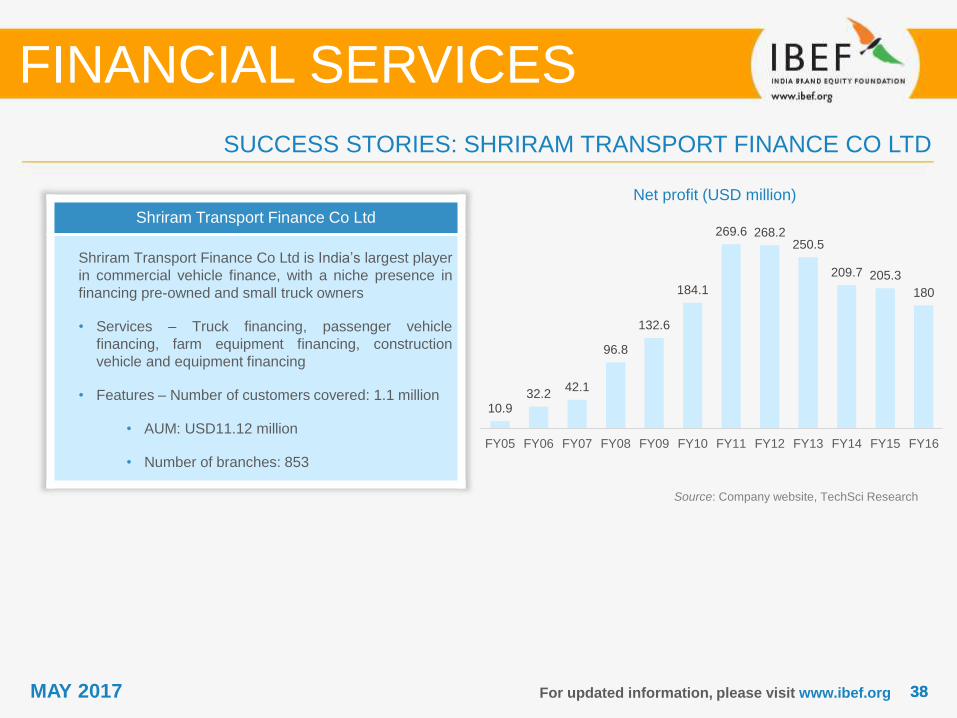
10.932.2
42.1
96.8
132.6
184.1
269.6 268.2250.5
209.7 205.3
180
FY05 FY06 FY07 FY08 FY09 FY10 FY11 FY12 FY13 FY14 FY15 FY16
For updated information, please visit www.ibef.org
SUCCESS STORIES: SHRIRAM TRANSPORT FINANCE CO LTD
Shriram Transport Finance Co Ltd
Shriram Transport Finance Co Ltd is India’s largest player
in commercial vehicle finance, with a niche presence in
financing pre-owned and small truck owners
• Services – Truck financing, passenger vehicle
financing, farm equipment financing, construction
vehicle and equipment financing
• Features – Number of customers covered: 1.1 million
• AUM: USD11.12 million
• Number of branches: 853
Net profit (USD million)
Source: Company website, TechSci Research
FINANCIAL SERVICES
3939MAY 2017
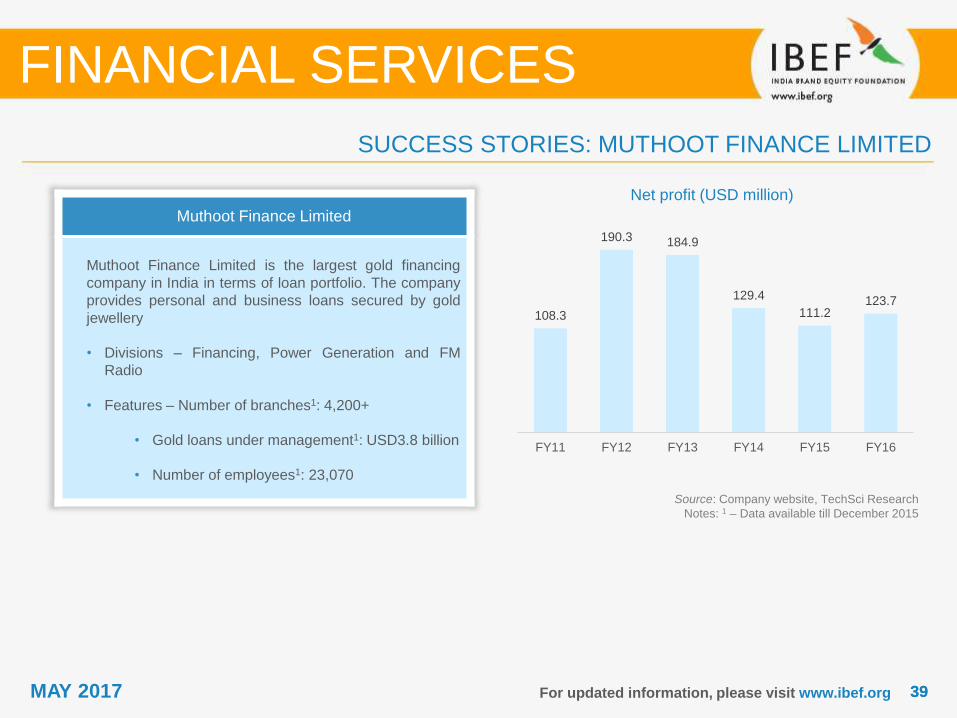
108.3
190.3 184.9
129.4
111.2123.7
FY11 FY12 FY13 FY14 FY15 FY16
For updated information, please visit www.ibef.org
SUCCESS STORIES: MUTHOOT FINANCE LIMITED
Muthoot Finance Limited
Muthoot Finance Limited is the largest gold financing
company in India in terms of loan portfolio. The company
provides personal and business loans secured by gold
jewellery
• Divisions – Financing, Power Generation and FM
Radio
• Features – Number of branches1: 4,200+
• Gold loans under management1: USD3.8 billion
• Number of employees1: 23,070
Net profit (USD million)
Source: Company website, TechSci Research
Notes: 1 – Data available till December 2015
FINANCIAL SERVICES

USEFUL INFORMATION
FINANCIAL SERVICES
4141MAY 2017
INDUSTRY ASSOCIATIONS
Insurance Brokers Association of India (IBAI)Maker Bhavan No 1, 4th Floor,
Sir V T Marg, Mumbai – 400 020
India
Phone: 91 11 22846544
E-mail: [email protected]
Association of Mutual Funds in India (AMFI)One Indiabulls Centre,
Tower 2, Wing B, 701,
841 Senapati Bapat Marg,
Elphinstone Road, Mumbai – 400 013
India
Phone: 91 11 24210093 / 24210383
Fax: 91 11 43346712
E-mail: [email protected]
Finance Industry Development Council (FIDC)222, Ashoka Shopping Centre,
II Floor, L T Road, Near G T Hospital
Mumbai – 400 001
India
Phone: 91 11 2267 5500
Fax: 91 11 2267 5600
E-mail: [email protected]
For updated information, please visit www.ibef.org
FINANCIAL SERVICES
4242MAY 2017
GLOSSARY
For updated information, please visit www.ibef.org
AUM: Assets Under Management
BSE: Bombay Stock Exchange
CAGR: Compound Annual Growth Rate
FII’s: Foreign Institutional Investors
GDP: Gross Domestic Product
HCV: Heavy Commercial Vehicle
HNWIs: High-Net-Worth Individuals
IRDA: Insurance Regulatory and Development Authority
LIC: Life Insurance Corporation
NBFCs: Non Banking Financial Company
NSE: National Stock Exchange
RBI: Reserve Bank of India
SEBI: Securities and Exchange Board of India
USD: US Dollar
FINANCIAL SERVICES
4343MAY 2017
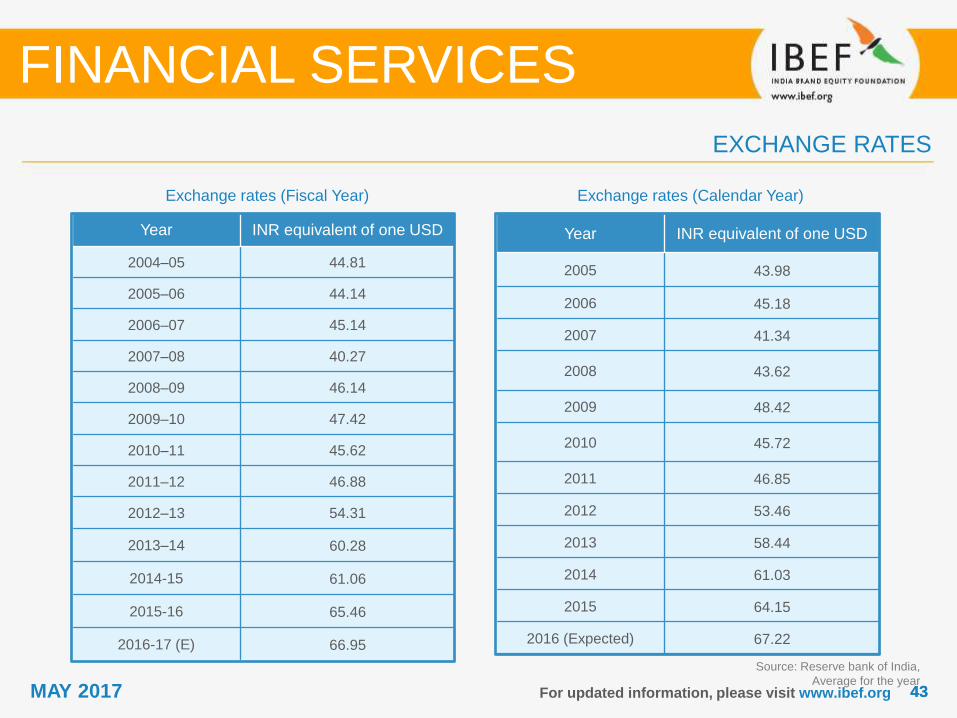
Year INR equivalent of one USD
2004–05 44.81
2005–06 44.14
2006–07 45.14
2007–08 40.27
2008–09 46.14
2009–10 47.42
2010–11 45.62
2011–12 46.88
2012–13 54.31
2013–14 60.28
2014-15 61.06
2015-16 65.46
2016-17 (E) 66.95
Year INR equivalent of one USD
2005 43.98
2006 45.18
2007 41.34
2008 43.62
2009 48.42
2010 45.72
2011 46.85
2012 53.46
2013 58.44
2014 61.03
2015 64.15
2016 (Expected) 67.22
Exchange rates (Fiscal Year)
For updated information, please visit www.ibef.org
EXCHANGE RATES
Exchange rates (Calendar Year)
Source: Reserve bank of India,
Average for the year
FINANCIAL SERVICES
4444MAY 2017
India Brand Equity Foundation (“IBEF”) engaged TechSci to prepare this presentation and the same has been
prepared by TechSci in consultation with IBEF.
All rights reserved. All copyright in this presentation and related works is solely and exclusively owned by IBEF. The
same may not be reproduced, wholly or in part in any material form (including photocopying or storing it in any
medium by electronic means and whether or not transiently or incidentally to some other use of this presentation),
modified or in any manner communicated to any third party except with the written approval of IBEF.
This presentation is for information purposes only. While due care has been taken during the compilation of this
presentation to ensure that the information is accurate to the best of TechSci and IBEF’s knowledge and belief, the
content is not to be construed in any manner whatsoever as a substitute for professional advice.
TechSci and IBEF neither recommend nor endorse any specific products or services that may have been mentioned in
this presentation and nor do they assume any liability or responsibility for the outcome of decisions taken as a result of
any reliance placed on this presentation.
Neither TechSci nor IBEF shall be liable for any direct or indirect damages that may arise due to any act or omission
on the part of the user due to any reliance placed or guidance taken from any portion of this presentation.
For updated information, please visit www.ibef.org
DISCLAIMER
FINANCIAL SERVICES
Recommended