Fertilizers Sector in Pakistan
- Cultivating Economy
October 2016
Significance of Fertilizers
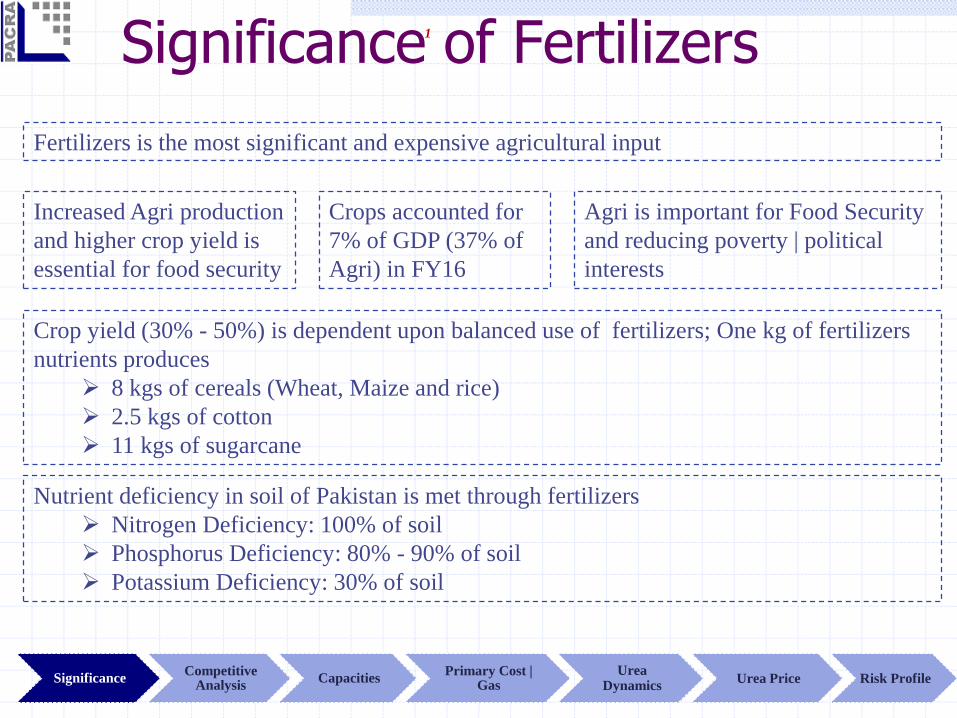
Fertilizers is the most significant and expensive agricultural input
Crops accounted for
7% of GDP (37% of
Agri) in FY16
Agri is important for Food Security
and reducing poverty | political
interests
Crop yield (30% - 50%) is dependent upon balanced use of fertilizers; One kg of fertilizers
nutrients produces
8 kgs of cereals (Wheat, Maize and rice)
2.5 kgs of cotton
11 kgs of sugarcane
Increased Agri production
and higher crop yield is
essential for food security
Nutrient deficiency in soil of Pakistan is met through fertilizers
Nitrogen Deficiency: 100% of soil
Phosphorus Deficiency: 80% - 90% of soil
Potassium Deficiency: 30% of soil
SignificanceCompetitive
AnalysisCapacities
Primary Cost | Gas
Urea Dynamics
Urea Price Risk Profile
1
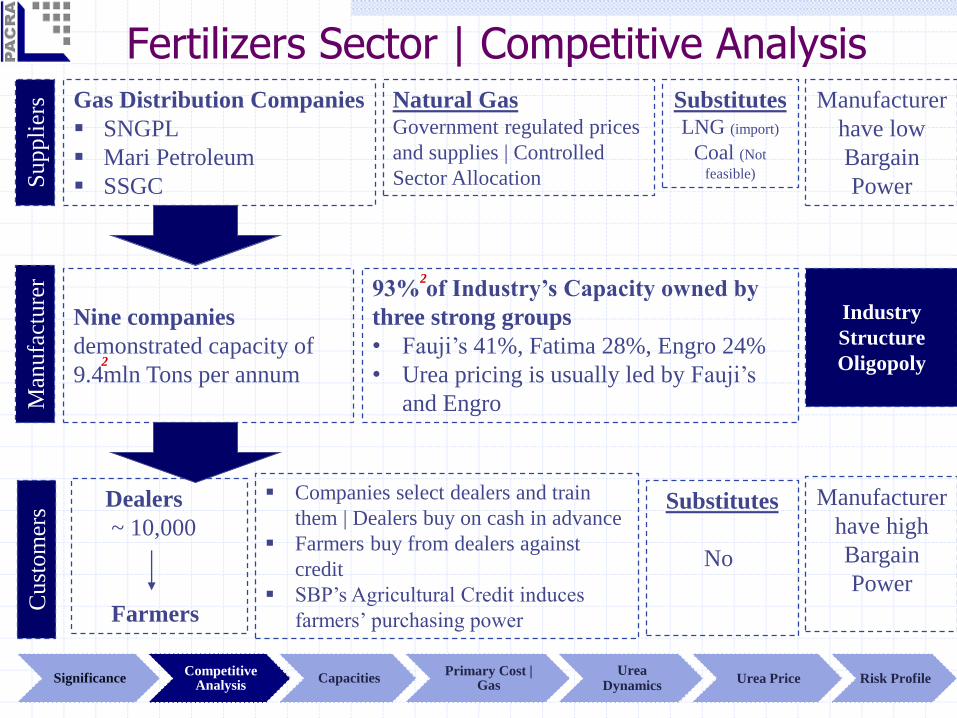
Fertilizers Sector | Competitive AnalysisS
uppli
ers Gas Distribution Companies
SNGPL
Mari Petroleum
SSGC
Natural Gas Government regulated prices
and supplies | Controlled
Sector Allocation
SubstitutesLNG (import)
Coal (Not
feasible)
Manufacturer
have low
Bargain
Power
Man
ufa
cture
r
Nine companies
demonstrated capacity of
9.4mln Tons per annum
93% of Industry’s Capacity owned by
three strong groups
• Fauji’s 41%, Fatima 28%, Engro 24%
• Urea pricing is usually led by Fauji’s
and Engro
Industry
Structure
Oligopoly
Cust
om
ers
Dealers
~ 10,000
Farmers
Companies select dealers and train
them | Dealers buy on cash in advance
Farmers buy from dealers against
credit
SBP’s Agricultural Credit induces
farmers’ purchasing power
Manufacturer
have high
Bargain
Power
Substitutes
No
2
2
SignificanceCompetitive
AnalysisCapacities
Primary Cost | Gas
Urea Dynamics
Urea Price Risk Profile
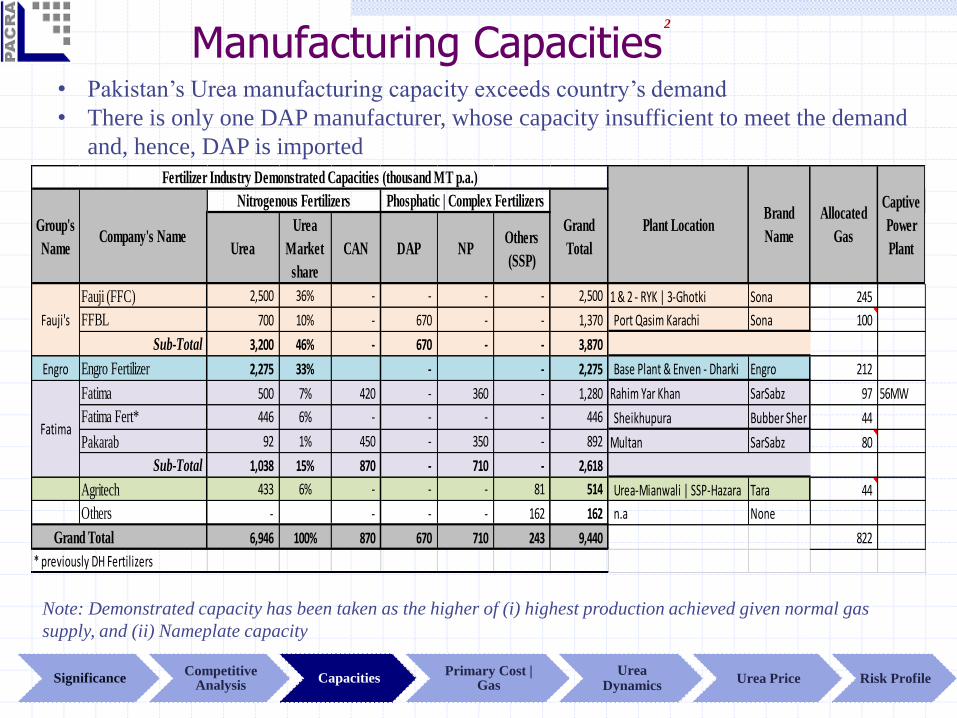
Manufacturing Capacities2
• Pakistan’s Urea manufacturing capacity exceeds country’s demand
• There is only one DAP manufacturer, whose capacity insufficient to meet the demand
and, hence, DAP is imported
Note: Demonstrated capacity has been taken as the higher of (i) highest production achieved given normal gas
supply, and (ii) Nameplate capacity
Urea
Urea
Market
share
CAN DAP NPOthers
(SSP)
Fauji (FFC) 2,500 36% - - - - 2,500 1 & 2 - RYK | 3-Ghotki Sona 245
FFBL 700 10% - 670 - - 1,370 Port Qasim Karachi Sona 100
Sub-Total 3,200 46% - 670 - - 3,870
Engro Engro Fertilizer 2,275 33% - - 2,275 Base Plant & Enven - Dharki Engro 212
Fatima 500 7% 420 - 360 - 1,280 Rahim Yar Khan SarSabz 97 56MW
Fatima Fert* 446 6% - - - - 446 Sheikhupura Bubber Sher 44
Pakarab 92 1% 450 - 350 - 892 Multan SarSabz 80
Sub-Total 1,038 15% 870 - 710 - 2,618
Agritech 433 6% - - - 81 514 Urea-Mianwali | SSP-Hazara Tara 44
Others - - - - 162 162 n.a None
Grand Total 6,946 100% 870 670 710 243 9,440 822
* previously DH Fertilizers
Fauji's
Fatima
Nitrogenous Fertilizers Phosphatic | Complex Fertilizers
Grand
TotalCompany's Name
Group's
Name
Plant LocationBrand
Name
Allocated
Gas
Captive
Power
Plant
Fertilizer Industry Demonstrated Capacities (thousand MT p.a.)
SignificanceCompetitive
AnalysisCapacities
Primary Cost | Gas
Urea Dynamics
Urea Price Risk Profile
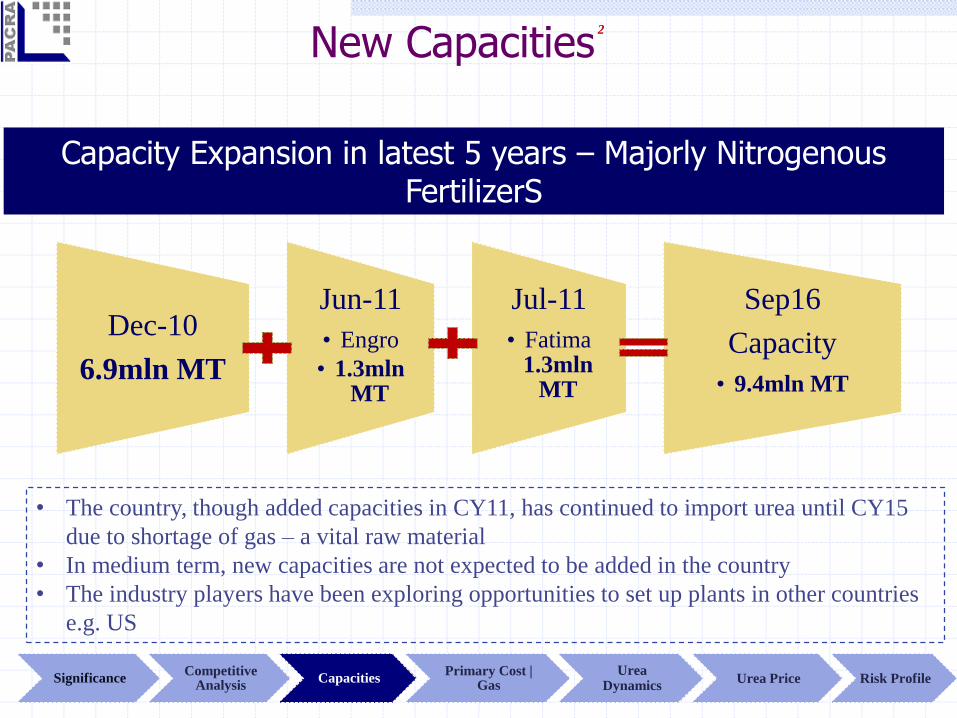
New Capacities
Dec-10
6.9mln MT
Jun-11
• Engro
• 1.3mln MT
Jul-11
• Fatima 1.3mln
MT
Sep16
Capacity
• 9.4mln MT
Capacity Expansion in latest 5 years – Majorly Nitrogenous FertilizerS
• The country, though added capacities in CY11, has continued to import urea until CY15
due to shortage of gas – a vital raw material
• In medium term, new capacities are not expected to be added in the country
• The industry players have been exploring opportunities to set up plants in other countries
e.g. US
2
SignificanceCompetitive
AnalysisCapacities
Primary Cost | Gas
Urea Dynamics
Urea Price Risk Profile
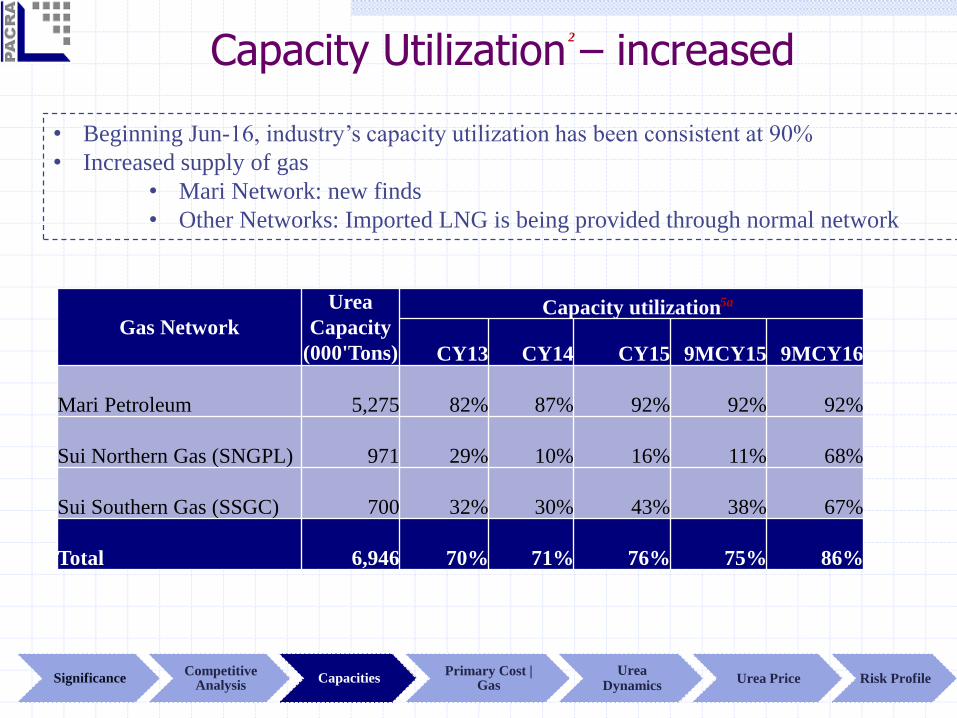
Capacity Utilization – increased
• Beginning Jun-16, industry’s capacity utilization has been consistent at 90%
• Increased supply of gas
• Mari Network: new finds
• Other Networks: Imported LNG is being provided through normal network
Gas Network
Urea
Capacity
(000'Tons)
Capacity utilization
CY13 CY14 CY15 9MCY15 9MCY16
Mari Petroleum 5,275 82% 87% 92% 92% 92%
Sui Northern Gas (SNGPL) 971 29% 10% 16% 11% 68%
Sui Southern Gas (SSGC) 700 32% 30% 43% 38% 67%
Total 6,946 70% 71% 76% 75% 86%
5a
2
SignificanceCompetitive
AnalysisCapacities
Primary Cost | Gas
Urea Dynamics
Urea Price Risk Profile
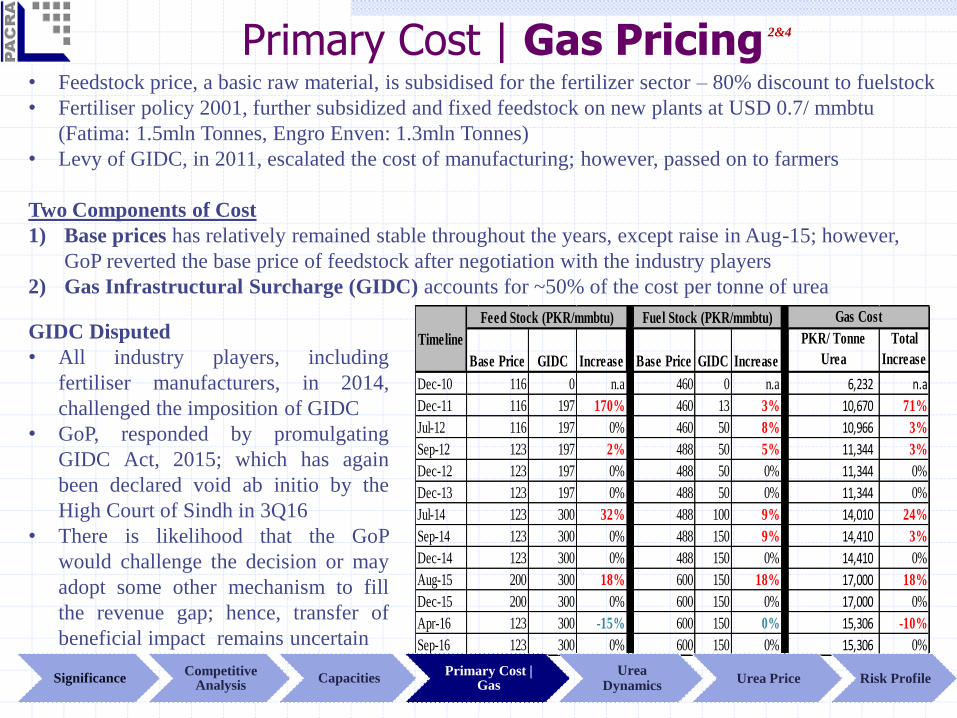
Primary Cost | Gas Pricing• Feedstock price, a basic raw material, is subsidised for the fertilizer sector – 80% discount to fuelstock
• Fertiliser policy 2001, further subsidized and fixed feedstock on new plants at USD 0.7/ mmbtu
(Fatima: 1.5mln Tonnes, Engro Enven: 1.3mln Tonnes)
• Levy of GIDC, in 2011, escalated the cost of manufacturing; however, passed on to farmers
Two Components of Cost
1) Base prices has relatively remained stable throughout the years, except raise in Aug-15; however,
GoP reverted the base price of feedstock after negotiation with the industry players
2) Gas Infrastructural Surcharge (GIDC) accounts for ~50% of the cost per tonne of urea
Base Price GIDC Increase Base Price GIDC Increase
PKR/ Tonne
Urea
Total
Increase
Dec-10 116 0 n.a 460 0 n.a 6,232 n.a
Dec-11 116 197 170% 460 13 3% 10,670 71%
Jul-12 116 197 0% 460 50 8% 10,966 3%
Sep-12 123 197 2% 488 50 5% 11,344 3%
Dec-12 123 197 0% 488 50 0% 11,344 0%
Dec-13 123 197 0% 488 50 0% 11,344 0%
Jul-14 123 300 32% 488 100 9% 14,010 24%
Sep-14 123 300 0% 488 150 9% 14,410 3%
Dec-14 123 300 0% 488 150 0% 14,410 0%
Aug-15 200 300 18% 600 150 18% 17,000 18%
Dec-15 200 300 0% 600 150 0% 17,000 0%
Apr-16 123 300 -15% 600 150 0% 15,306 -10%
Sep-16 123 300 0% 600 150 0% 15,306 0%
Gas CostFuel Stock (PKR/mmbtu)Feed Stock (PKR/mmbtu)
TimelineGIDC Disputed
• All industry players, including
fertiliser manufacturers, in 2014,
challenged the imposition of GIDC
• GoP, responded by promulgating
GIDC Act, 2015; which has again
been declared void ab initio by the
High Court of Sindh in 3Q16
• There is likelihood that the GoP
would challenge the decision or may
adopt some other mechanism to fill
the revenue gap; hence, transfer of
beneficial impact remains uncertain
2&4
SignificanceCompetitive
AnalysisCapacities
Primary Cost | Gas
Urea Dynamics
Urea Price Risk Profile
UREA Performance
Country’s largest selling Nitrogenous Fertilizer
Government support – subsidy of PKR 340/bag Reduction in GST from 17% to 5% (PKR 184/bag)
Cash Subsidy (PKR 156/bag)
Effective Jul-16
SignificanceCompetitive
AnalysisCapacities
Primary Cost | Gas
Urea Dynamics
Urea Price Risk Profile
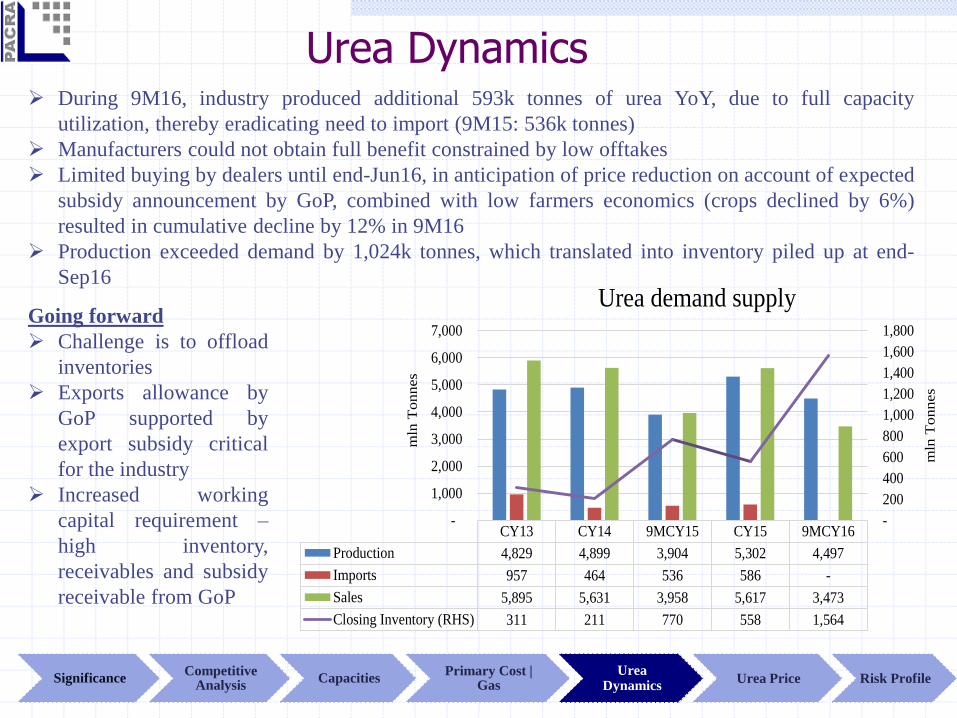
Urea Dynamics During 9M16, industry produced additional 593k tonnes of urea YoY, due to full capacity
utilization, thereby eradicating need to import (9M15: 536k tonnes)
Manufacturers could not obtain full benefit constrained by low offtakes
Limited buying by dealers until end-Jun16, in anticipation of price reduction on account of expected
subsidy announcement by GoP, combined with low farmers economics (crops declined by 6%)
resulted in cumulative decline by 12% in 9M16
Production exceeded demand by 1,024k tonnes, which translated into inventory piled up at end-
Sep16
Going forward
Challenge is to offload
inventories
Exports allowance by
GoP supported by
export subsidy critical
for the industry
Increased working
capital requirement –
high inventory,
receivables and subsidy
receivable from GoP
CY13 CY14 9MCY15 CY15 9MCY16
Production 4,829 4,899 3,904 5,302 4,497
Imports 957 464 536 586 -
Sales 5,895 5,631 3,958 5,617 3,473
Closing Inventory (RHS) 311 211 770 558 1,564
-
200
400
600
800
1,000
1,200
1,400
1,600
1,800
-
1,000
2,000
3,000
4,000
5,000
6,000
7,000
mln
Tonnes
mln
Tonnes
Urea demand supply
SignificanceCompetitive
AnalysisCapacities
Primary Cost | Gas
Urea Dynamics
Urea Price Risk Profile
-20%
-10%
0%
10%
20%
30%
40%
-
100
200
300
400
500
600
Cu
sh
ion
%
per T
on
US
D P
er T
on
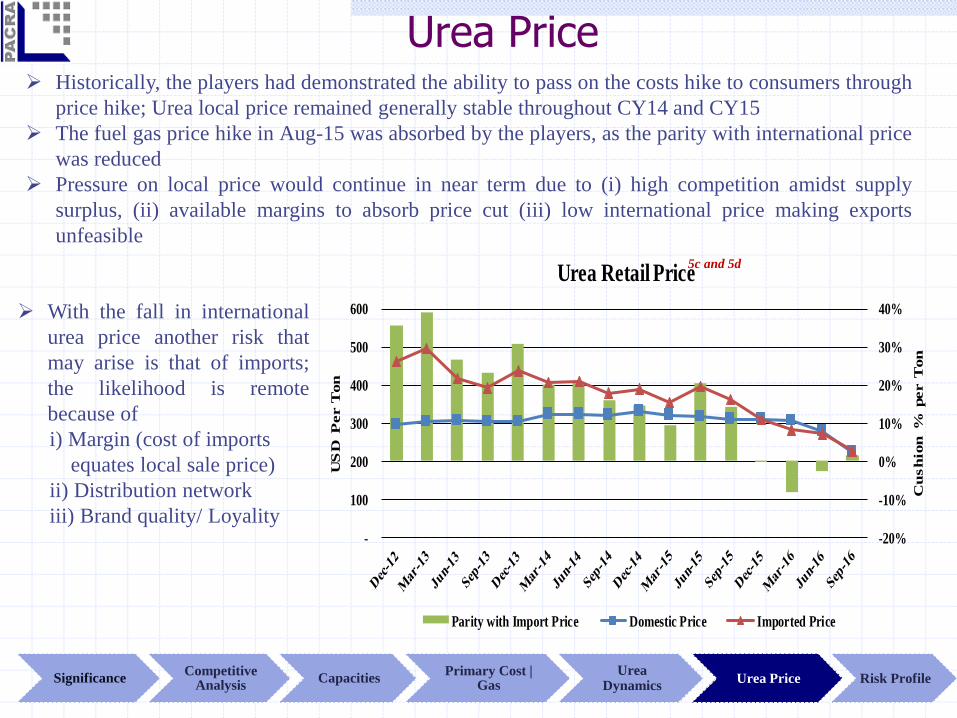
Urea Retail Price
Parity with Import Price Domestic Price Imported Price
Urea Price
5c and 5d
Historically, the players had demonstrated the ability to pass on the costs hike to consumers through
price hike; Urea local price remained generally stable throughout CY14 and CY15
The fuel gas price hike in Aug-15 was absorbed by the players, as the parity with international price
was reduced
Pressure on local price would continue in near term due to (i) high competition amidst supply
surplus, (ii) available margins to absorb price cut (iii) low international price making exports
unfeasible
With the fall in international
urea price another risk that
may arise is that of imports;
the likelihood is remote
because of
i) Margin (cost of imports
equates local sale price)
ii) Distribution network
iii) Brand quality/ Loyality
SignificanceCompetitive
AnalysisCapacities
Primary Cost | Gas
Urea Dynamics
Urea Price Risk Profile
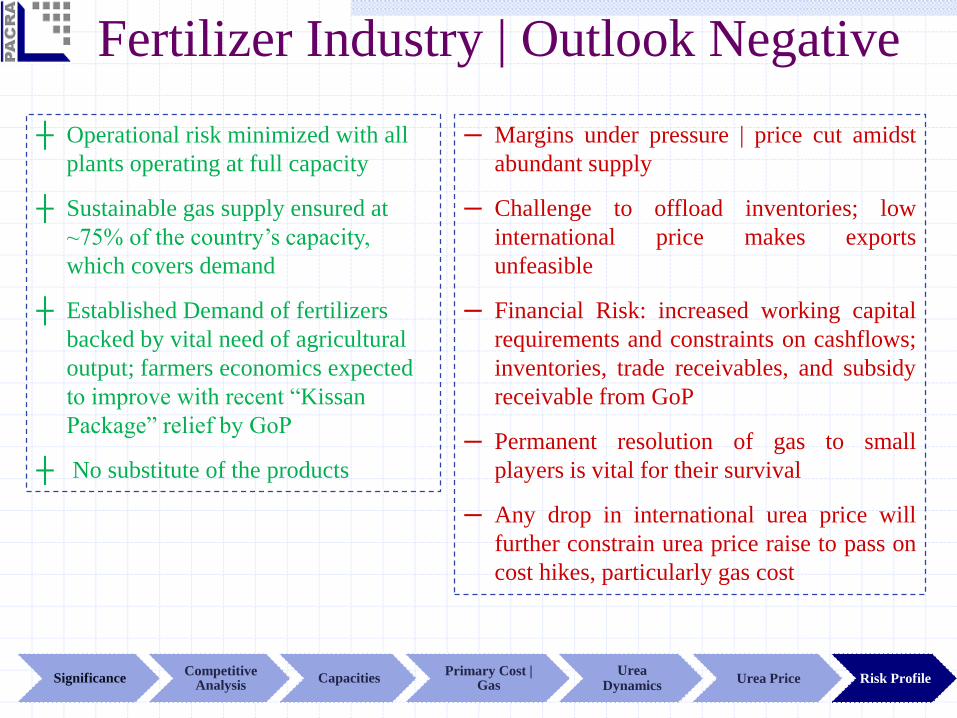
Fertilizer Industry | Outlook Negative
┼ Operational risk minimized with all
plants operating at full capacity
┼ Sustainable gas supply ensured at
~75% of the country’s capacity,
which covers demand
┼ Established Demand of fertilizers
backed by vital need of agricultural
output; farmers economics expected
to improve with recent “Kissan
Package” relief by GoP
┼ No substitute of the products
─ Margins under pressure | price cut amidst
abundant supply
─ Challenge to offload inventories; low
international price makes exports
unfeasible
─ Financial Risk: increased working capital
requirements and constraints on cashflows;
inventories, trade receivables, and subsidy
receivable from GoP
─ Permanent resolution of gas to small
players is vital for their survival
─ Any drop in international urea price will
further constrain urea price raise to pass on
cost hikes, particularly gas cost
SignificanceCompetitive
AnalysisCapacities
Primary Cost | Gas
Urea Dynamics
Urea Price Risk Profile
Bibliography
1. Pakistan Economic Survey 2015-16, issued by Finance Division Government of Pakistan – Chapter 2_Agriculture,
Page_23, Chapter 1_Growth and Investments, page_6,7,8
2. PACRA’s in-house research and database
3. National Fertilizer Development Centre (NFDC) Monthly Report
a. Annexure 11_ Fertilizer Production by Product and Manufacturer
b. Annexure 5_ Plant wise Production Sales and Stock position
c. Section 9_Fertilizer Prices, Table 7_Average Fertilizer Retail Prices
d. Section 9_Fertilizer Prices, Table 8_International Prices
4. Oil and Gas Regulatory Authority, Notified Gas Prices Consumer Gas Prices
DISCLAIMERPACRA has used due care in preparation of this document. Our information has been obtained from sources
we consider to be reliable but its accuracy or completeness is not guaranteed. The information in this
document may be copied or otherwise reproduced, in whole or in part, provided the source is duly
acknowledged. The presentation should not be relied upon as professional advice.
Analysts
Amara S. Gondal
Jhangeer Hanif
Shoaib Afzal
Mahina Majid
Muneeb Rashid
Contact Number: +92 42 3586 9504
Thank You
Recommended