Februari 2013 1
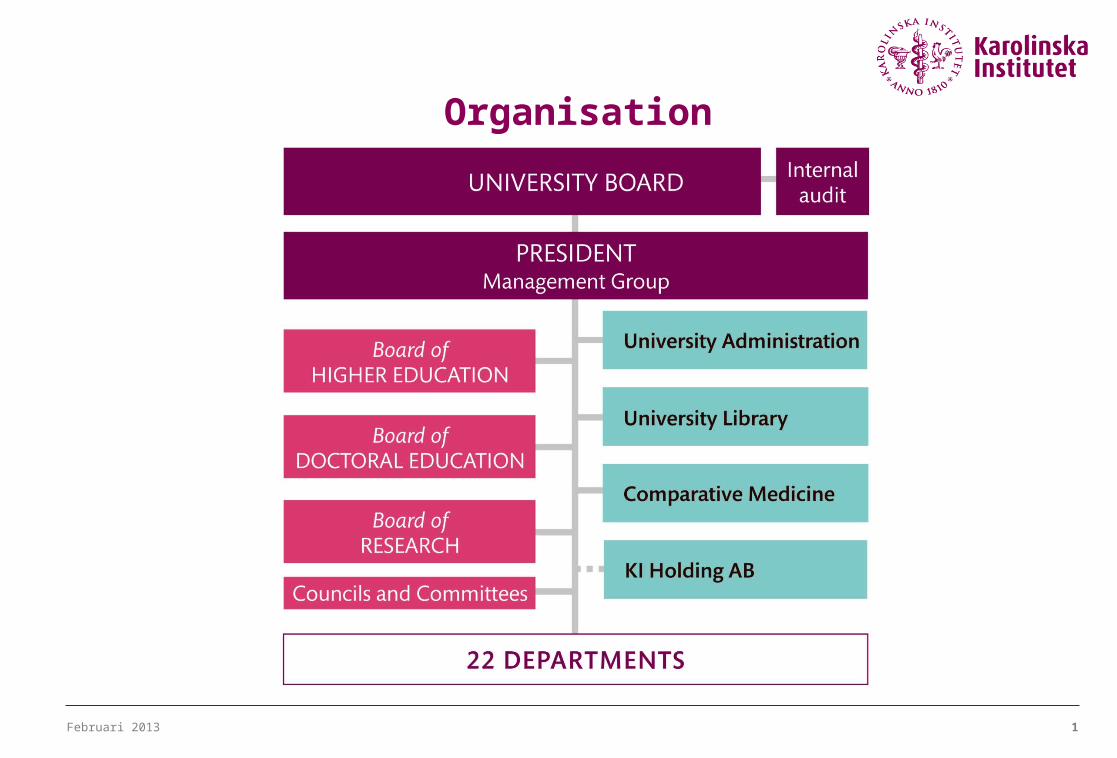
Organisation
22
Februari 2013 2
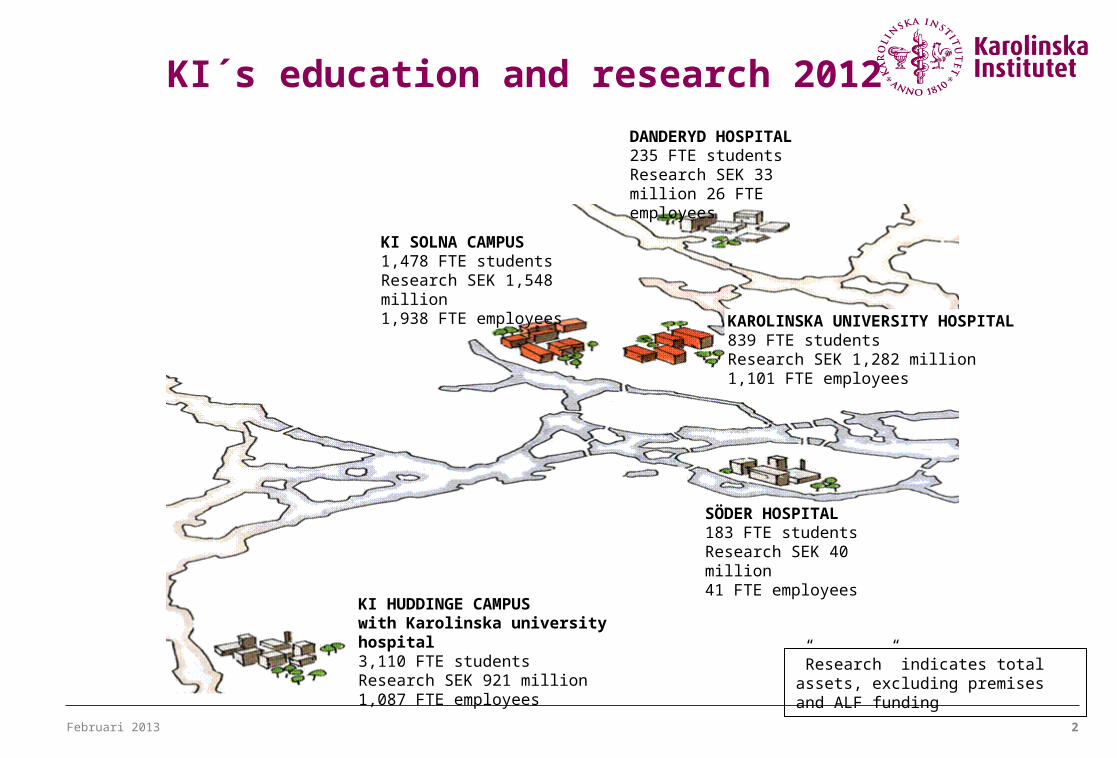
KI´s education and research 2012
22
DANDERYD HOSPITAL235 FTE studentsResearch SEK 33 million 26 FTE employees
KAROLINSKA UNIVERSITY HOSPITAL839 FTE studentsResearch SEK 1,282 million 1,101 FTE employees
KI SOLNA CAMPUS 1,478 FTE studentsResearch SEK 1,548 million1,938 FTE employees
SÖDER HOSPITAL183 FTE studentsResearch SEK 40 million 41 FTE employees
KI HUDDINGE CAMPUSwith Karolinska university hospital3,110 FTE studentsResearch SEK 921 million 1,087 FTE employees
”Research” indicates total assets, excluding premises and ALF funding
Februari 2013 3
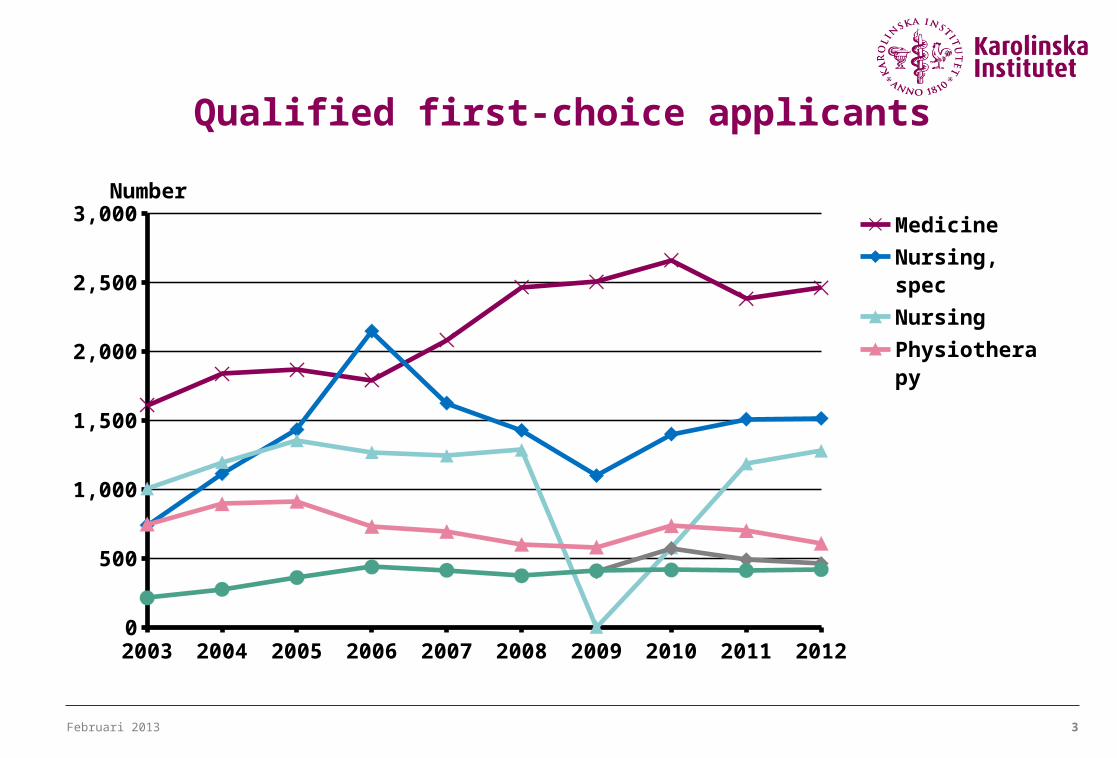
Qualified first-choice applicants
2003 2004 2005 2006 2007 2008 2009 2010 2011 20120
500
1,000
1,500
2,000
2,500
3,000 Medicine
Nursing, spec
Nursing
Physiotherapy
Psychology
Dentistry
Number
Februari 2013 4
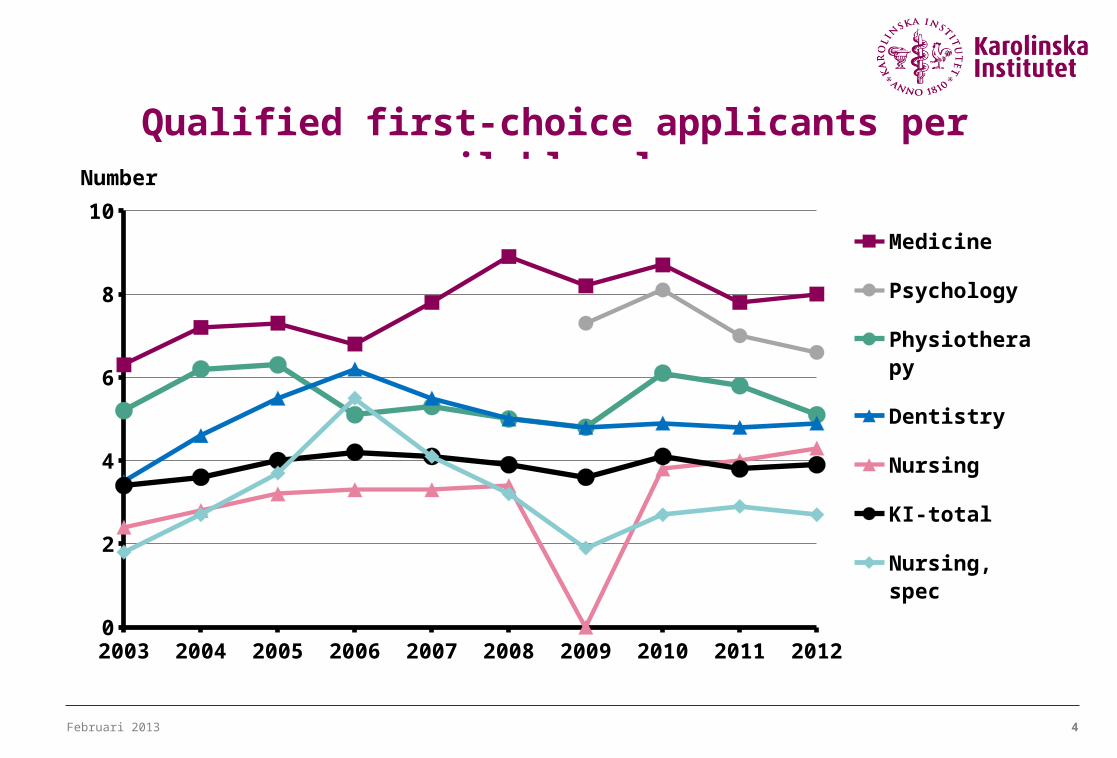
Qualified first-choice applicants per available place
2003 2004 2005 2006 2007 2008 2009 2010 2011 20120
2
4
6
8
10
Medicine
Psychology
Physiotherapy
Dentistry
Nursing
KI-total
Nursing, spec
Number
Februari 2013 5
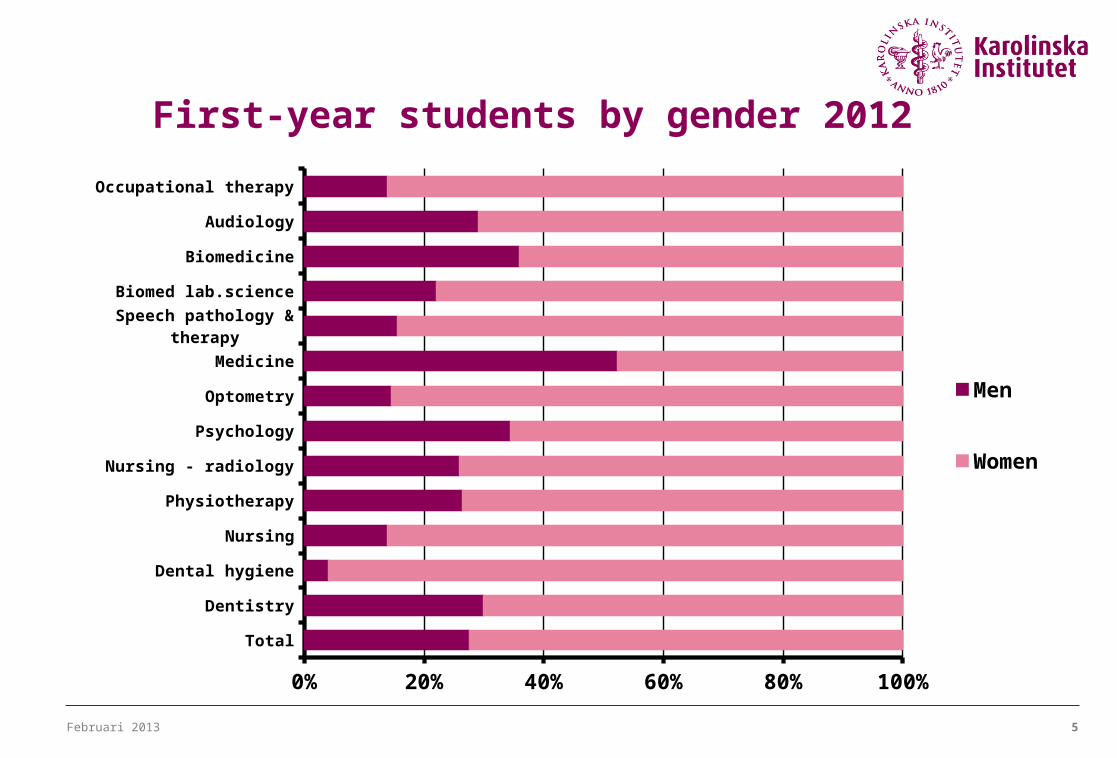
First-year students by gender 2012
Total
Dentistry
Dental hygiene
Nursing
Physiotherapy
Nursing - radiology
Psychology
Optometry
Medicine
Speech pathology & therapy
Biomed lab.science
Biomedicine
Audiology
Occupational therapy
0% 20% 40% 60% 80% 100%
Men
Women
Februari 2013 6
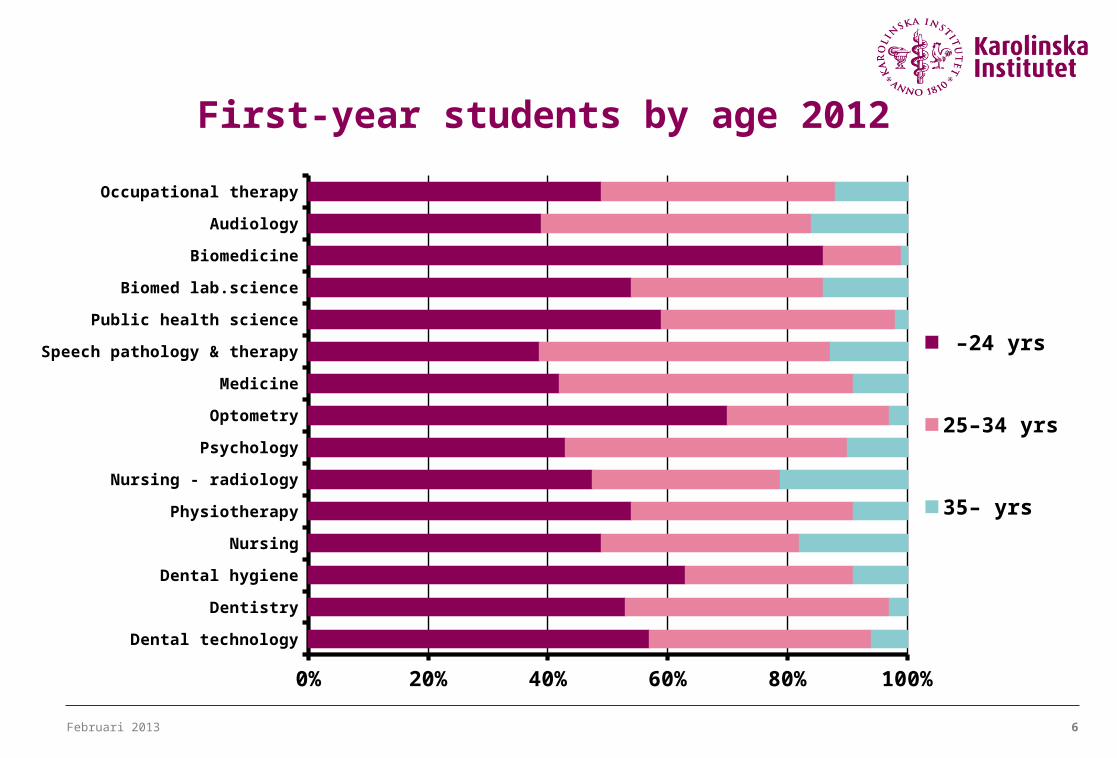
First-year students by age 2012
Dental technology
Dentistry
Dental hygiene
Nursing
Physiotherapy
Nursing - radiology
Psychology
Optometry
Medicine
Speech pathology & therapy
Public health science
Biomed lab.science
Biomedicine
Audiology
Occupational therapy
0% 20% 40% 60% 80% 100%
–24 yrs
25–34 yrs
35– yrs
Februari 2013 7
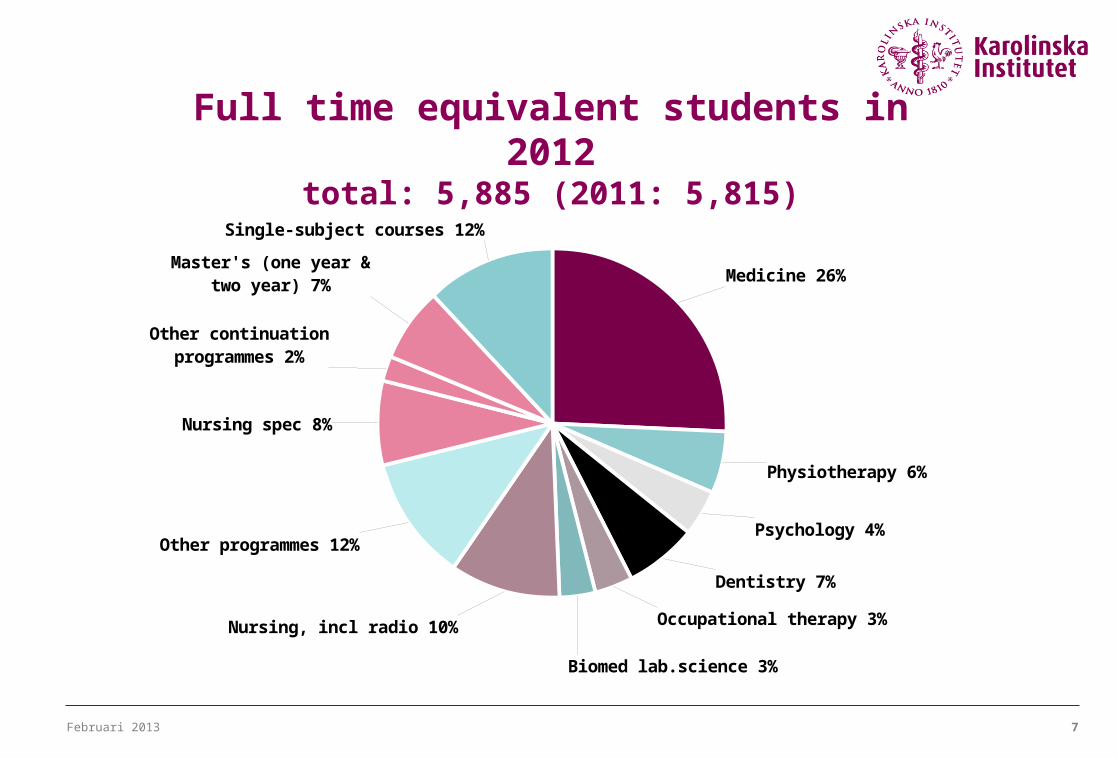
Full time equivalent students in 2012total: 5,885 (2011: 5,815)
Medicine 26%
Physiotherapy 6%
Psychology 4%
Dentistry 7%
Occupational therapy 3%
Biomed lab.science 3%
Nursing, incl radio 10%
Other programmes 12%
Nursing spec 8%
Other continuation programmes 2%
Master's (one year & two year) 7%
Single-subject courses 12%
Februari 2013 8
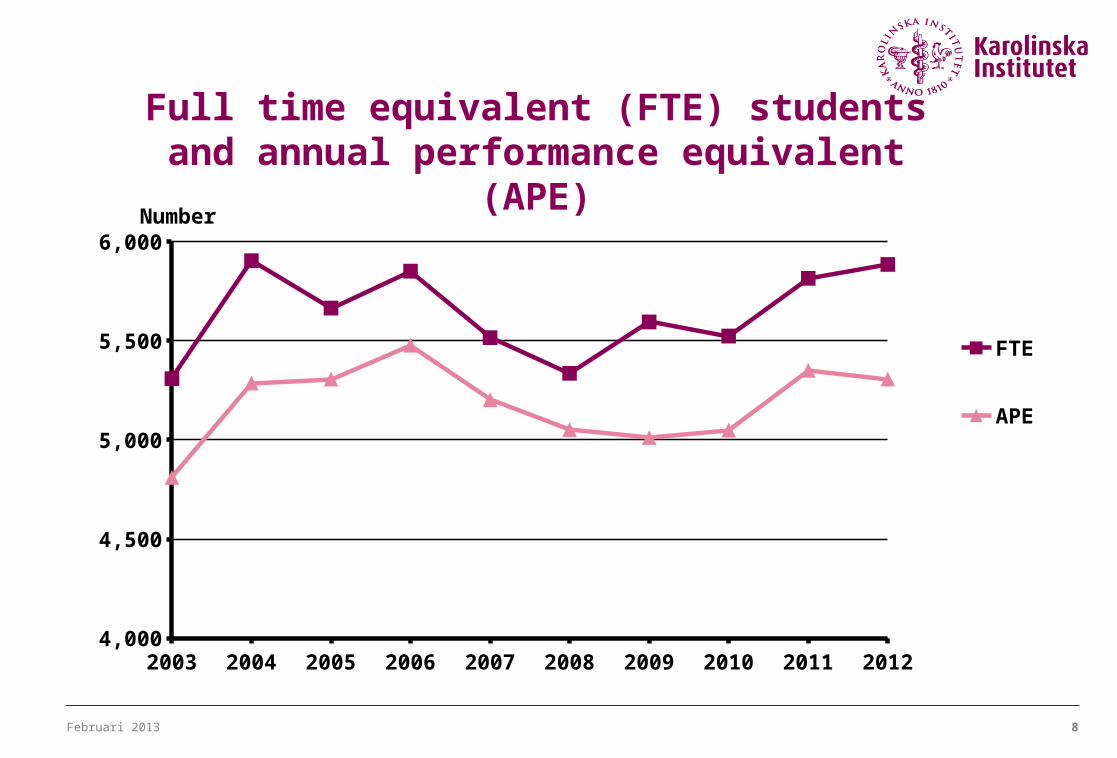
Full time equivalent (FTE) students and annual performance equivalent (APE)
2003 2004 2005 2006 2007 2008 2009 2010 2011 20124,000
4,500
5,000
5,500
6,000
FTE
APE
Number
Februari 2013 9
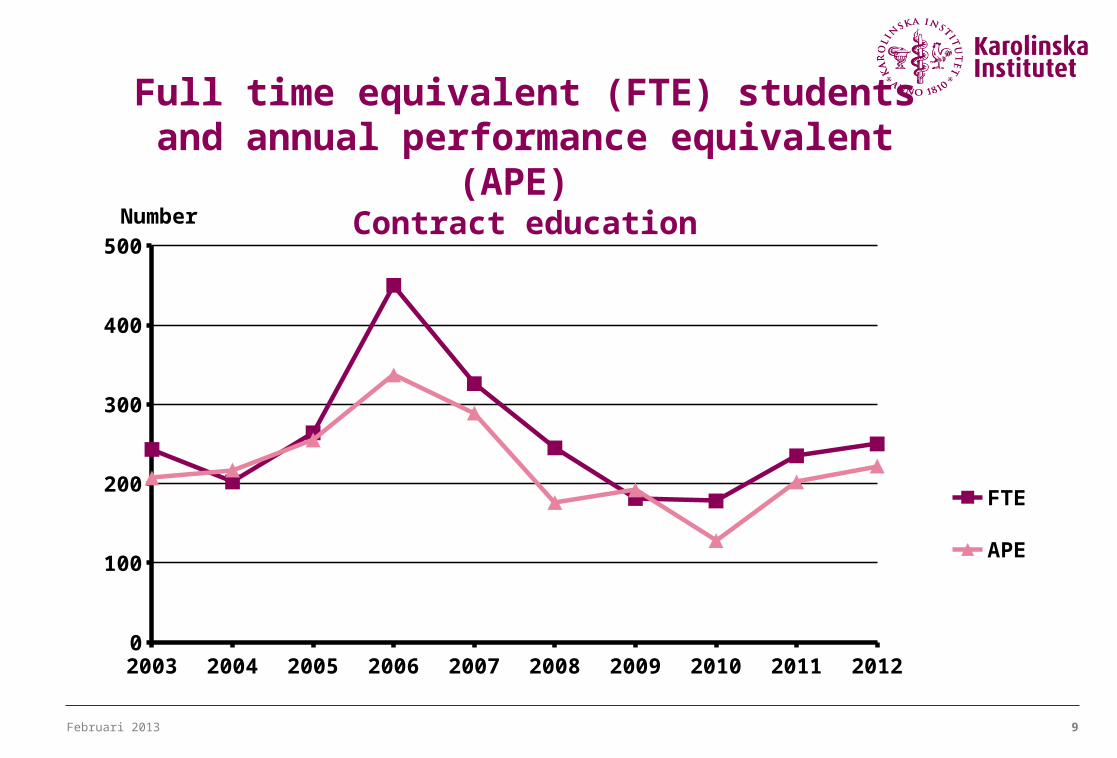
Full time equivalent (FTE) students and annual performance equivalent (APE)
Contract education
2003 2004 2005 2006 2007 2008 2009 2010 2011 20120
100
200
300
400
500
FTE
APE
Number
Februari 2013 10
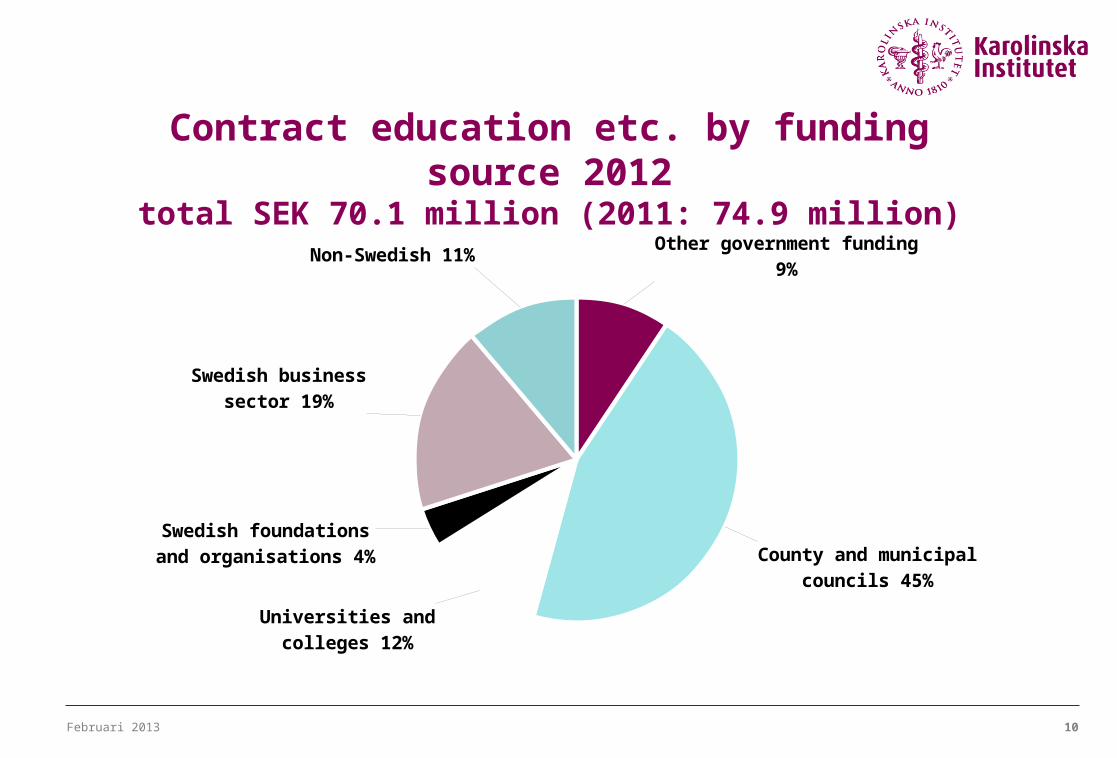
Contract education etc. by funding source 2012total SEK 70.1 million (2011: 74.9 million)
Other government funding 9%
County and municipal councils 45%
Universities and col-leges 12%
Swedish foundations and organisations 4%
Swedish business sec-tor 19%
Non-Swedish 11%
Februari 2013 11
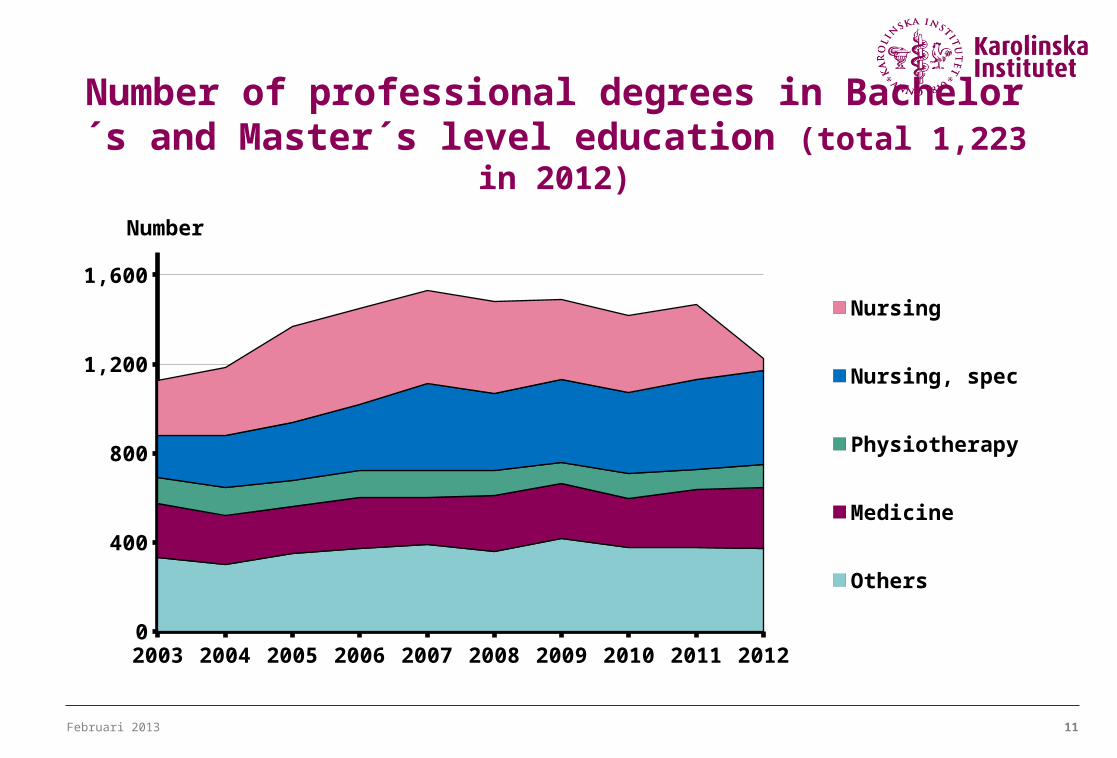
Number of professional degrees in Bachelor´s and Master´s level education (total 1,223 in 2012)
2003 2004 2005 2006 2007 2008 2009 2010 2011 20120
400
800
1,200
1,600
Nursing
Nursing, spec
Physiotherapy
Medicine
Others
Number
Februari 2013 12
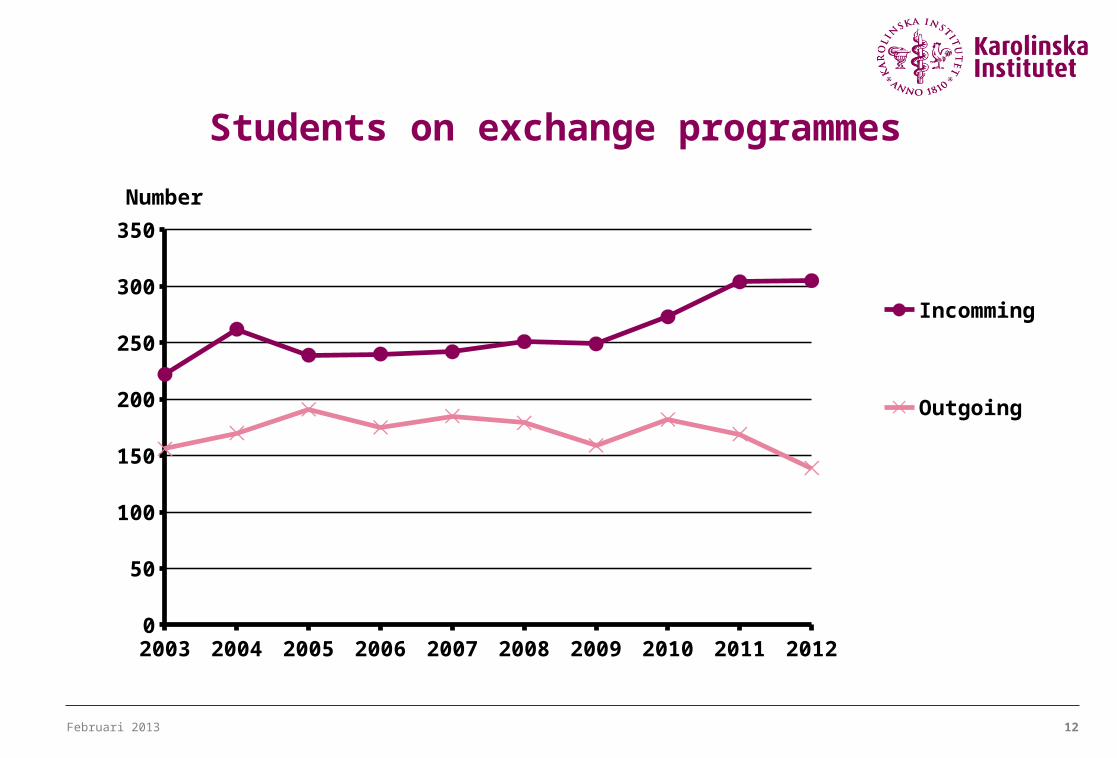
Students on exchange programmes
2003 2004 2005 2006 2007 2008 2009 2010 2011 20120
50
100
150
200
250
300
350
Incomming
Outgoing
Number
Februari 2013 13
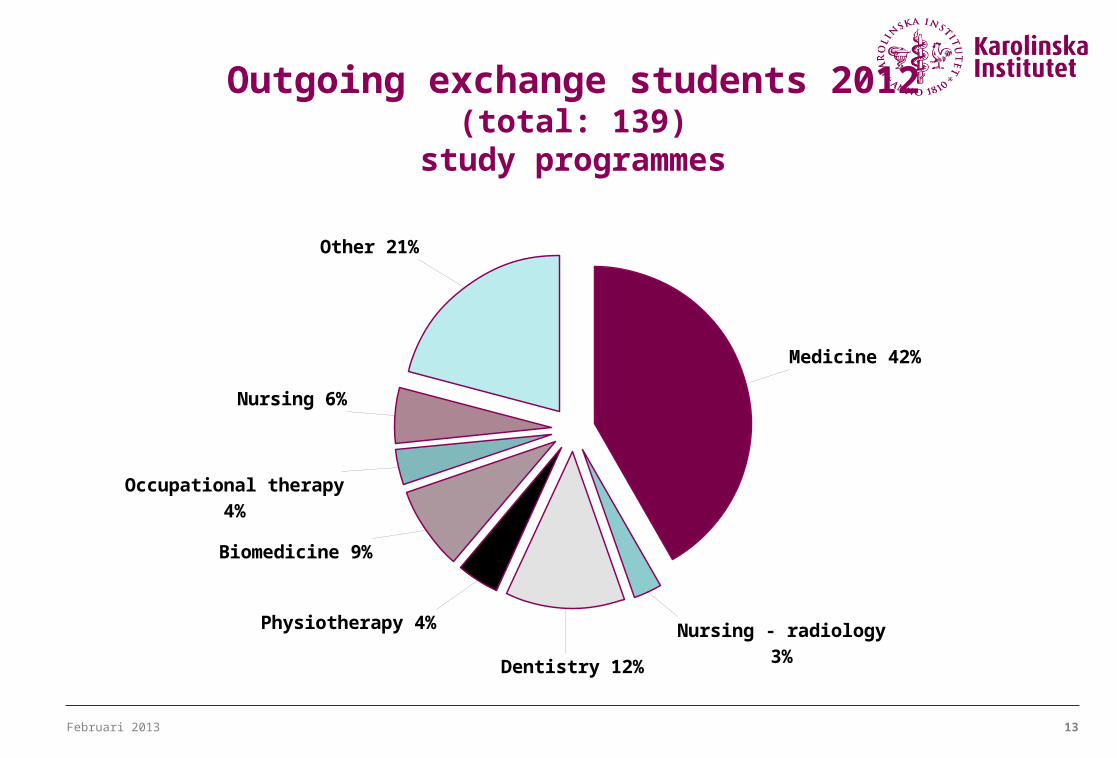
Medicine 42%
Nursing - radiology 3%
Dentistry 12%
Physiotherapy 4%
Biomedicine 9%
Occupational therapy 4%
Nursing 6%
Other 21%
Outgoing exchange students 2012 (total: 139)study programmes
Februari 2013 14
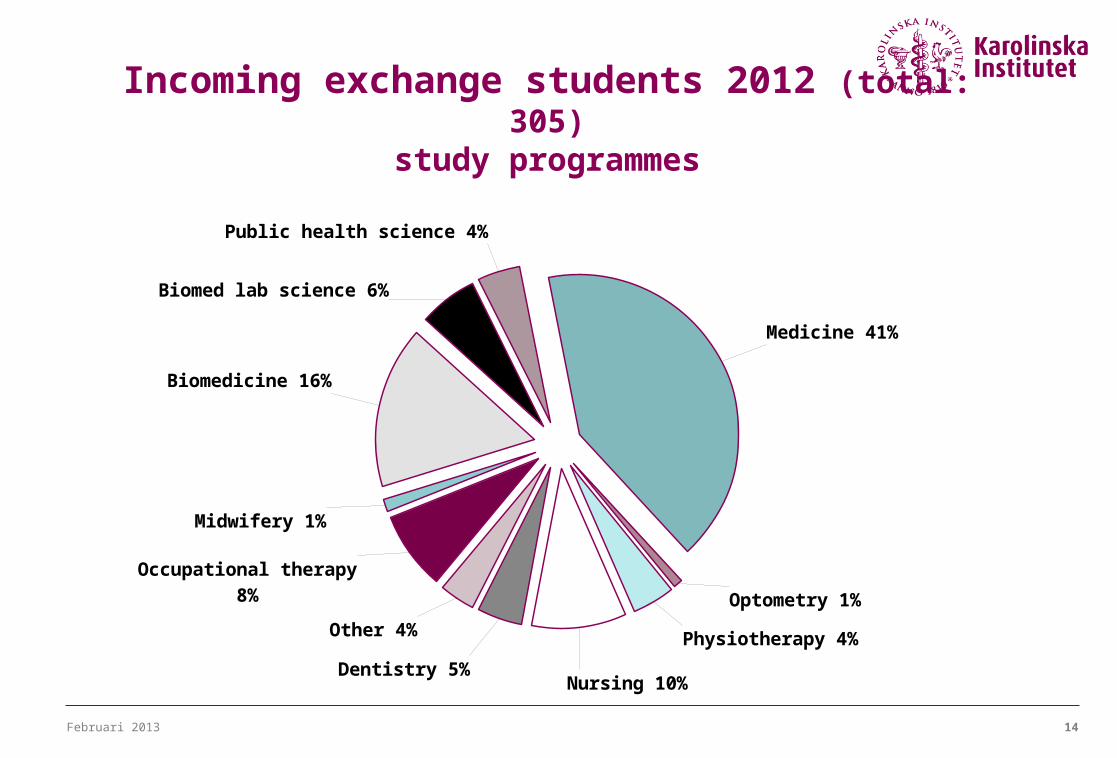
Occupational therapy 8%
Midwifery 1%
Biomedicine 16%
Biomed lab science 6%
Public health science 4%
Medicine 41%
Optometry 1%
Physiotherapy 4%
Nursing 10%Dentistry 5%
Other 4%
Incoming exchange students 2012 (total: 305)study programmes
Februari 2013 15
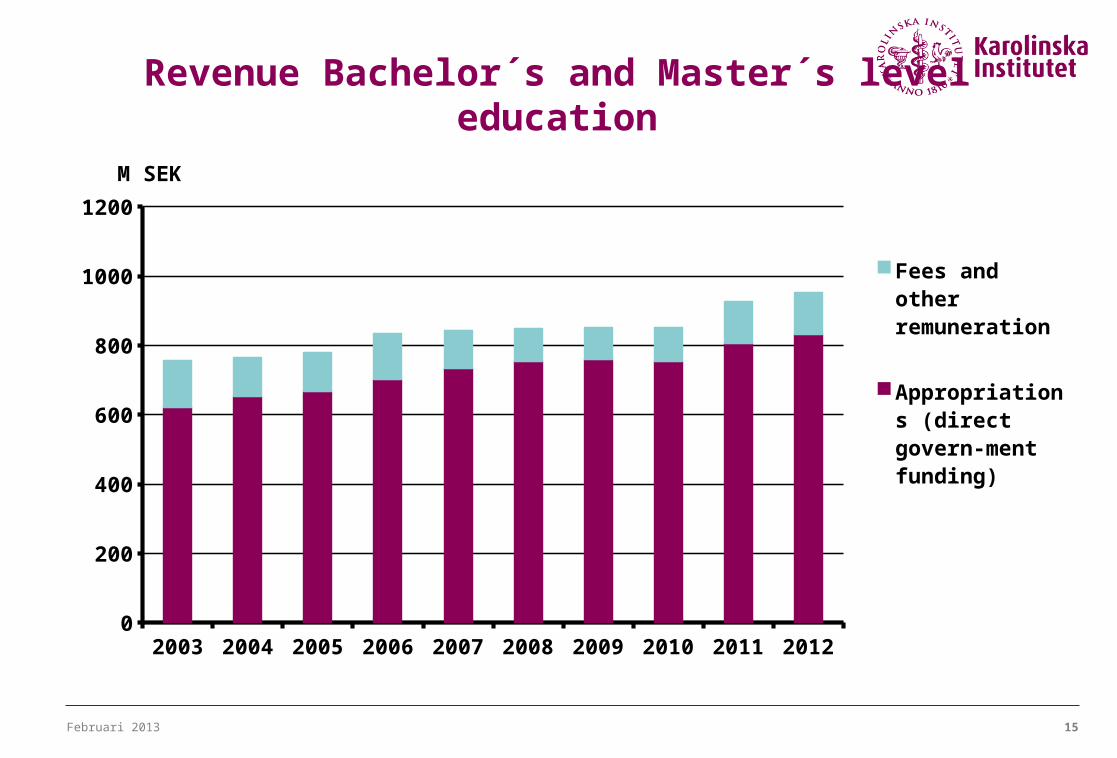
Revenue Bachelor´s and Master´s level education
2003 2004 2005 2006 2007 2008 2009 2010 2011 20120
200
400
600
800
1000
1200
Fees and other remuneration
Appropriations (direct govern-ment funding)
M SEK
Februari 2013 16
2002 2003 2004 2005 2006 2007 2008 2009 2010 20110
500
1,000
1,500
2,000
2,500
3,000
3,500
4,000
4,500
5,000
5,500
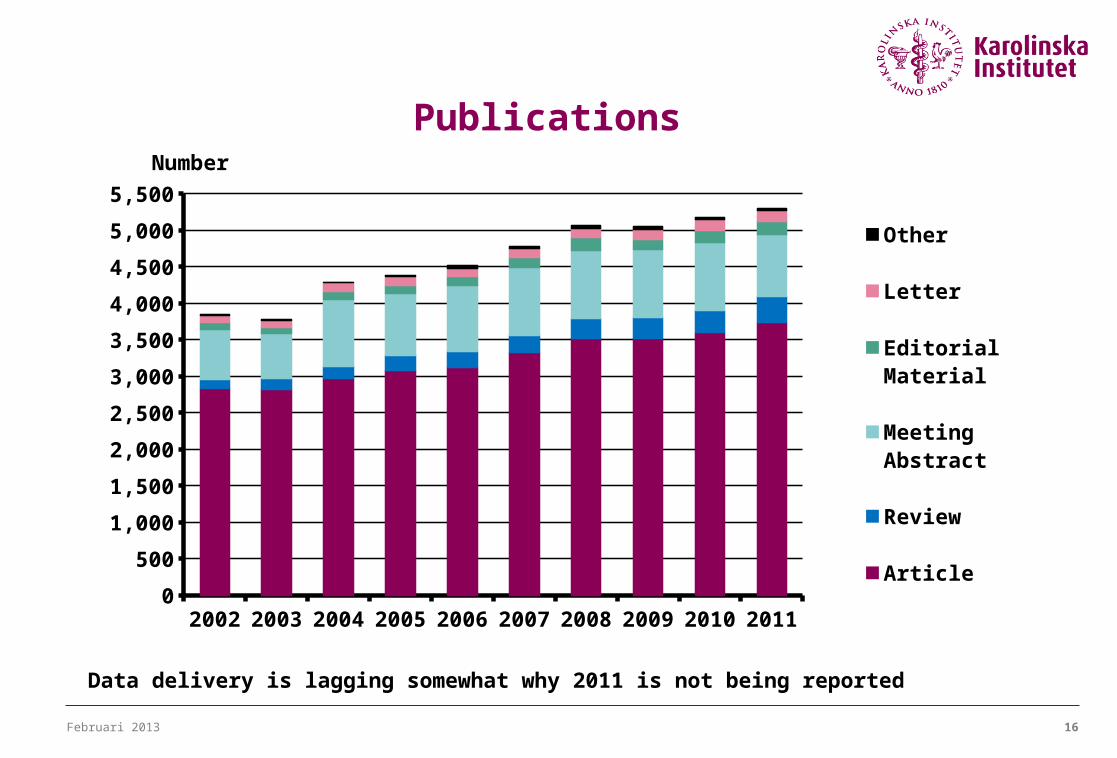
Other
Letter
Editorial Material
Meeting Abstract
Review
Article
Number
Publications
Data delivery is lagging somewhat why 2011 is not being reported
Februari 2013 17
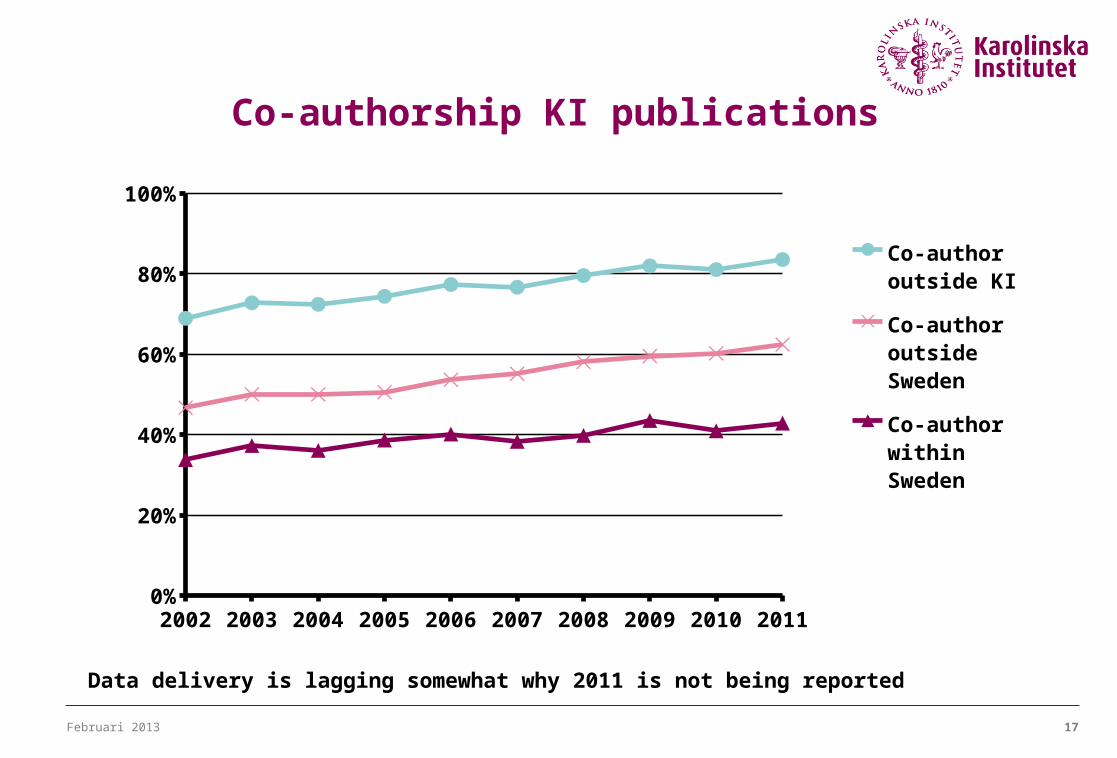
Co-authorship KI publications
2002 2003 2004 2005 2006 2007 2008 2009 2010 20110%
20%
40%
60%
80%
100%
Co-author outside KI
Co-author outside Sweden
Co-author within Sweden
Data delivery is lagging somewhat why 2011 is not being reported
Februari 2013 18
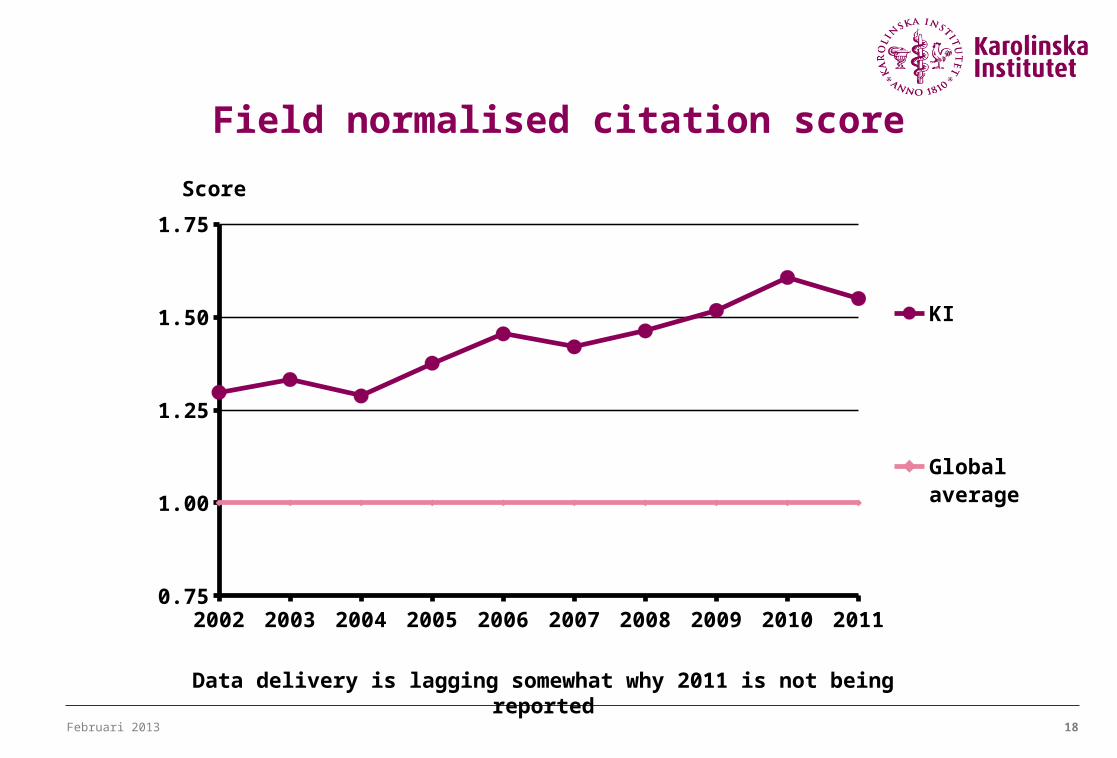
Field normalised citation score
2002 2003 2004 2005 2006 2007 2008 2009 2010 20110.75
1.00
1.25
1.50
1.75
KI
Global average
Score
Data delivery is lagging somewhat why 2011 is not being reported
Februari 2013 19
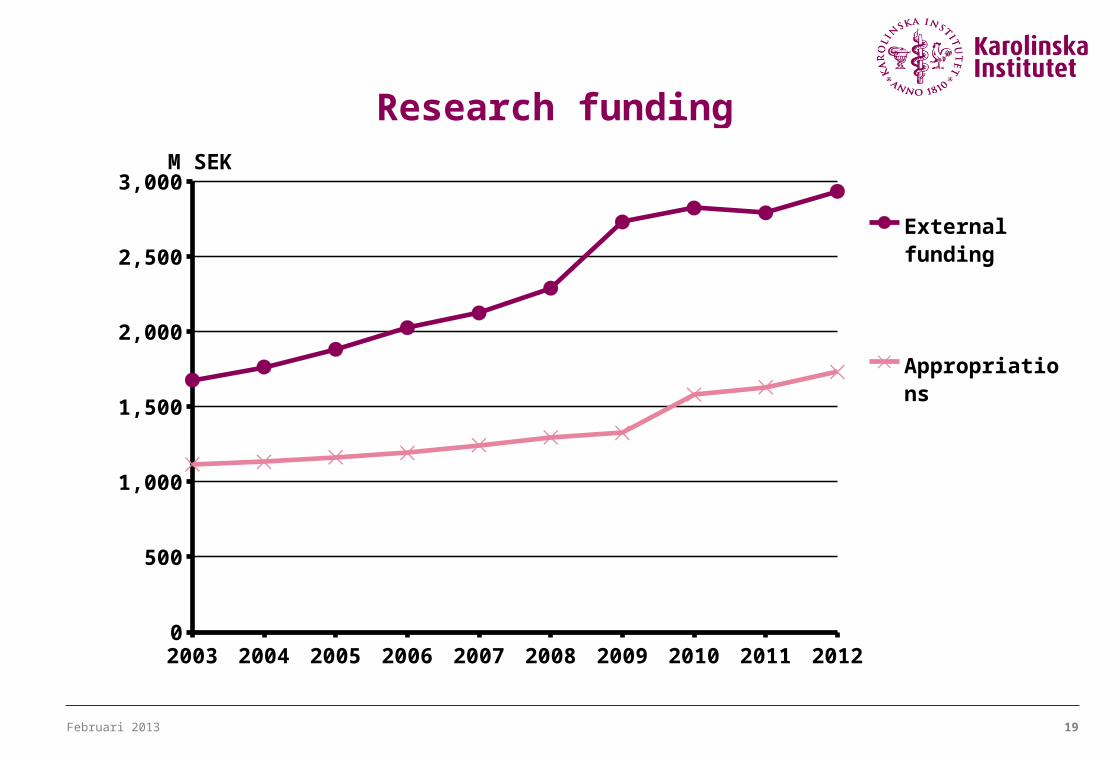
Research funding
2003 2004 2005 2006 2007 2008 2009 2010 2011 20120
500
1,000
1,500
2,000
2,500
3,000
External fund-ing
Appropriations
M SEK
Februari 2013 20
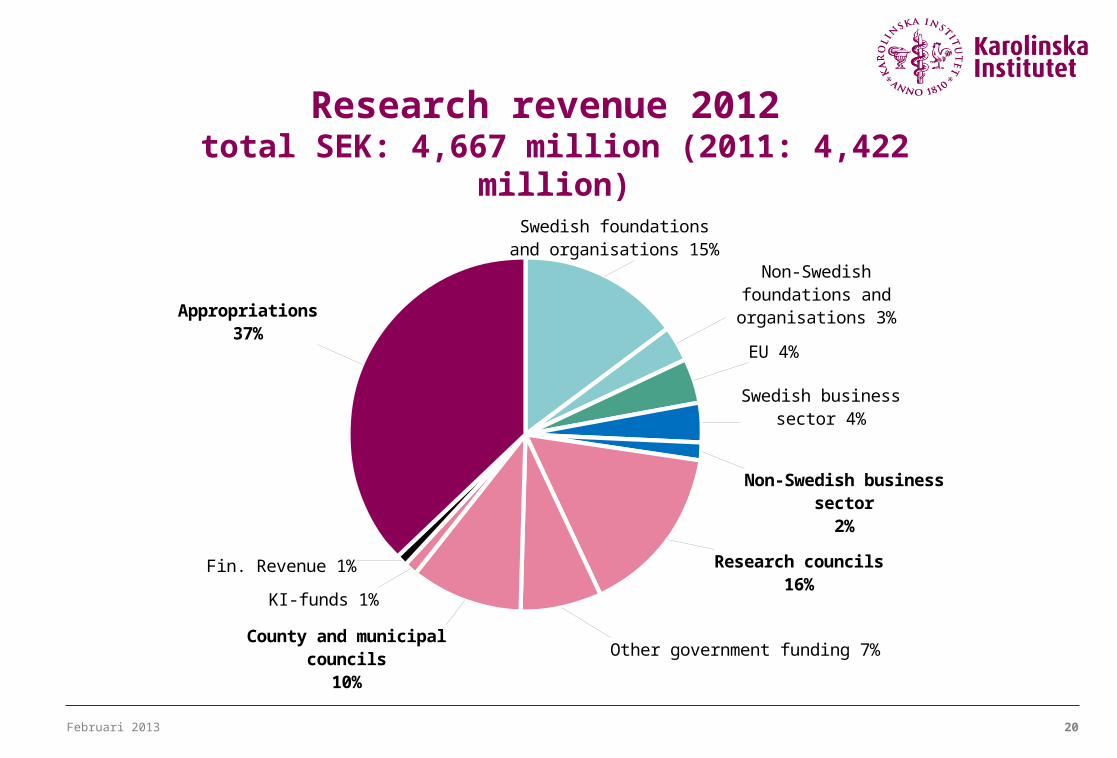
Research revenue 2012 total SEK: 4,667 million (2011: 4,422 million)
Swedish foundations and organisations 15%
Non-Swedish foundations and organisations 3%
EU 4%
Swedish business sector 4%
Non-Swedish business sector
2%
Research councils16%
Other government funding 7%County and municipal councils
10%
KI-funds 1%
Fin. Revenue 1%
Appropriations37%
Februari 2013 21
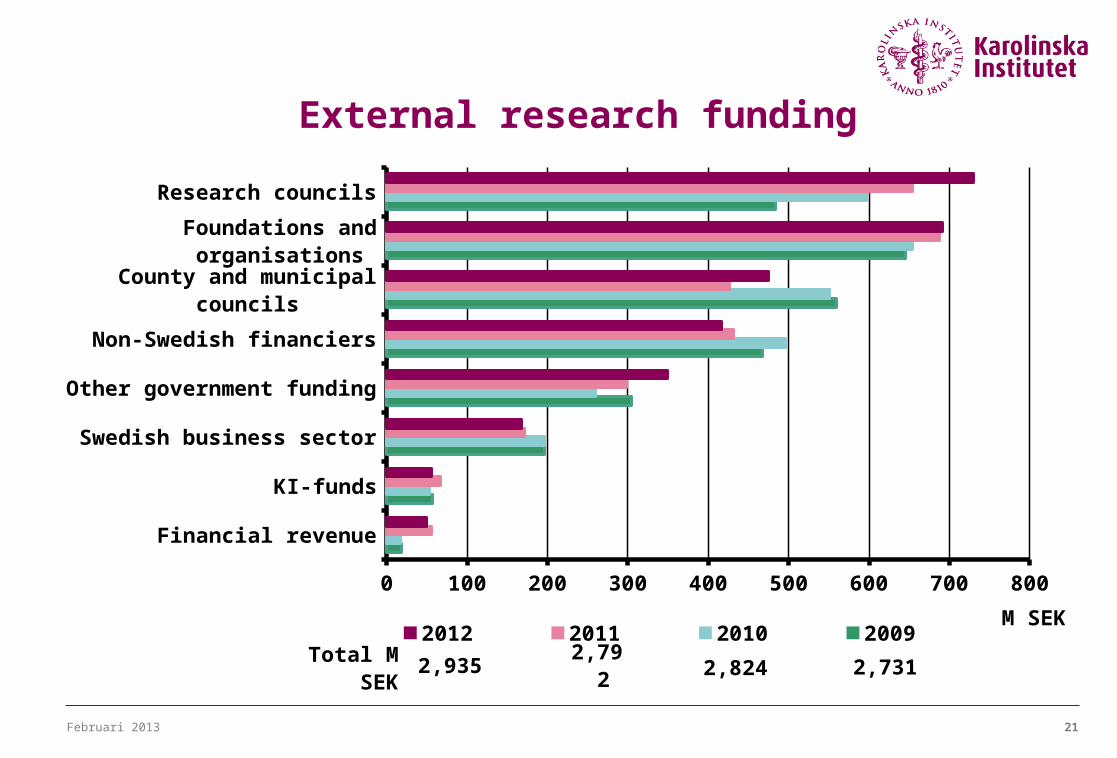
External research funding
Financial revenue
KI-funds
Swedish business sector
Other government funding
Non-Swedish financiers
County and municipal councils
Foundations and organisations
Research councils
0 100 200 300 400 500 600 700 800
2012 2011 2010 2009M SEK
Total M SEK 2,824 2,792 2,935 2,731

Februari 2013 22
Revenue from EU
2003 2004 2005 2006 2007 2008 2009 2010 2011 20120
50
100
150
200
250M SEK
Stipend
Februari 2013 23
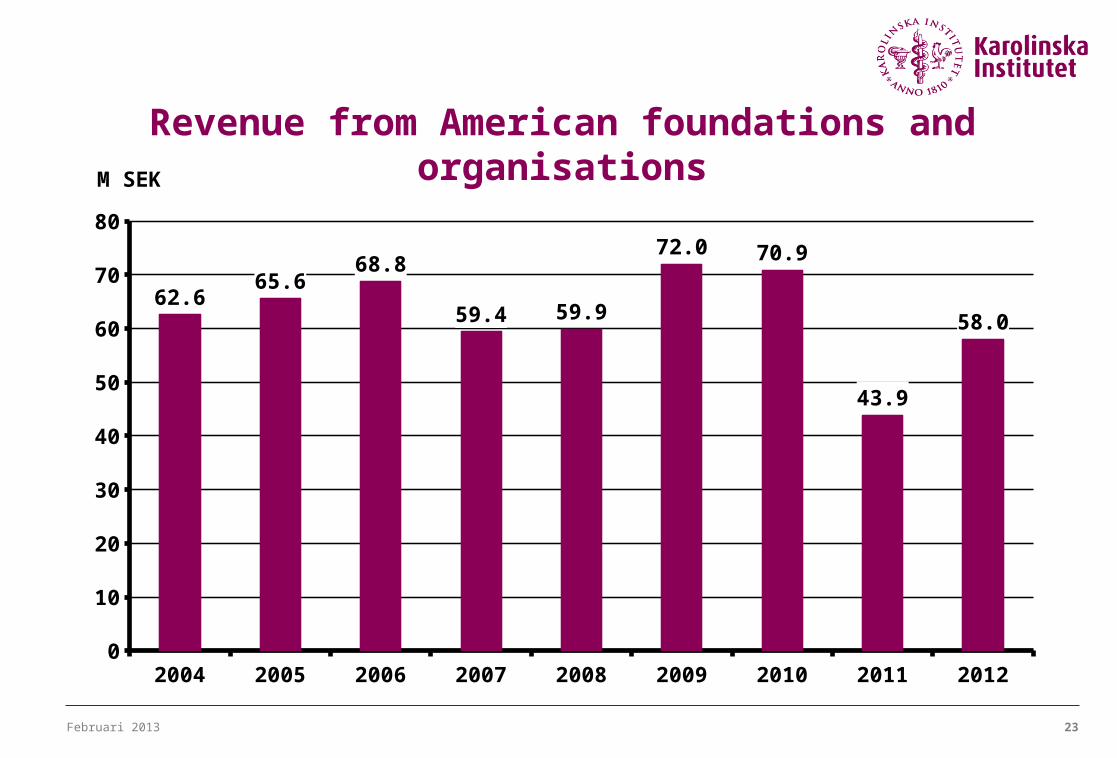
Revenue from American foundations and organisations
2004 2005 2006 2007 2008 2009 2010 2011 20120
10
20
30
40
50
60
70
80
62.665.6
68.8
59.4 59.9
72.0 70.9
43.9
58.0
M SEK
Februari 2013 24
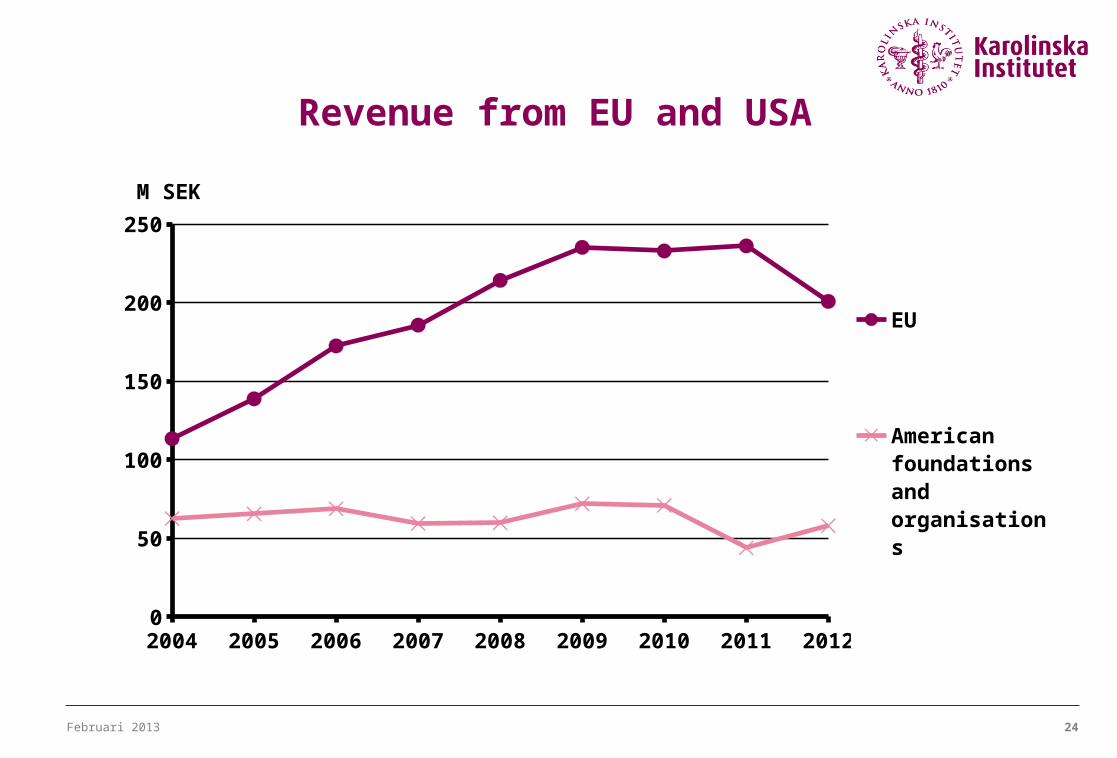
Revenue from EU and USA
2004 2005 2006 2007 2008 2009 2010 2011 20120
50
100
150
200
250
EU
American foundations and organisa-tions
M SEK
Februari 2013 25
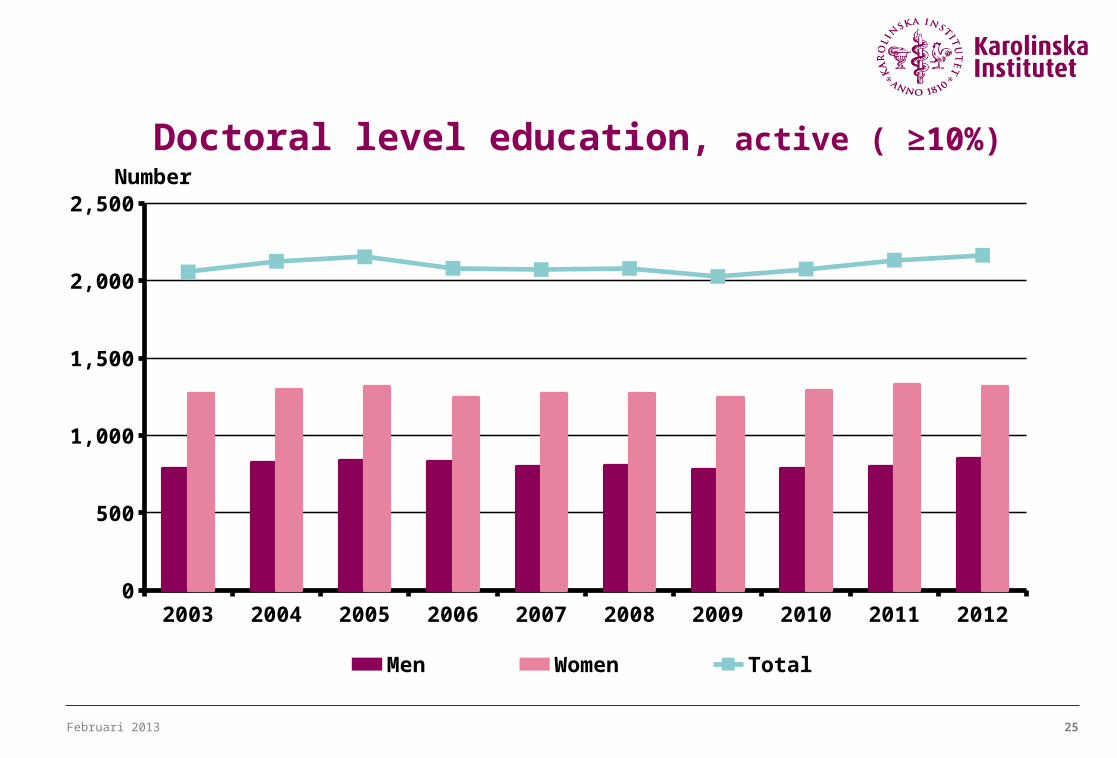
Doctoral level education, active ( ≥10%)
2003 2004 2005 2006 2007 2008 2009 2010 2011 20120
500
1,000
1,500
2,000
2,500
Men Women Total
Number
Februari 2013 26
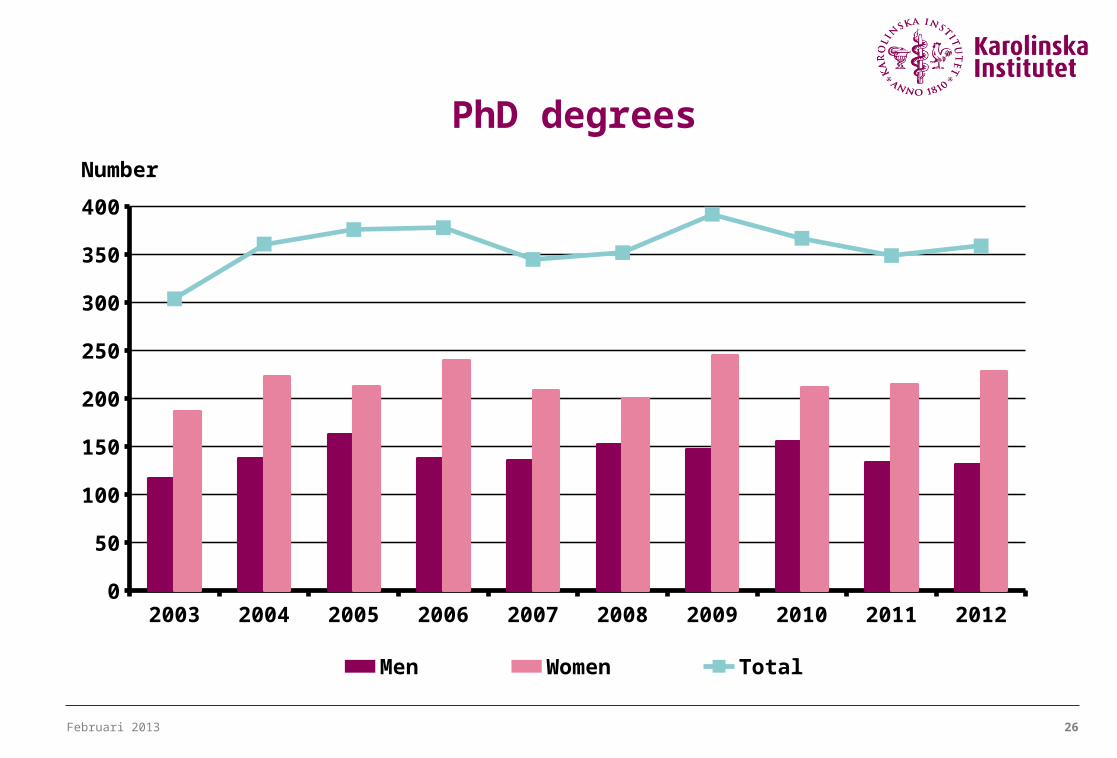
PhD degrees
2003 2004 2005 2006 2007 2008 2009 2010 2011 20120
50
100
150
200
250
300
350
400
Men Women Total
Number
Februari 2013 27
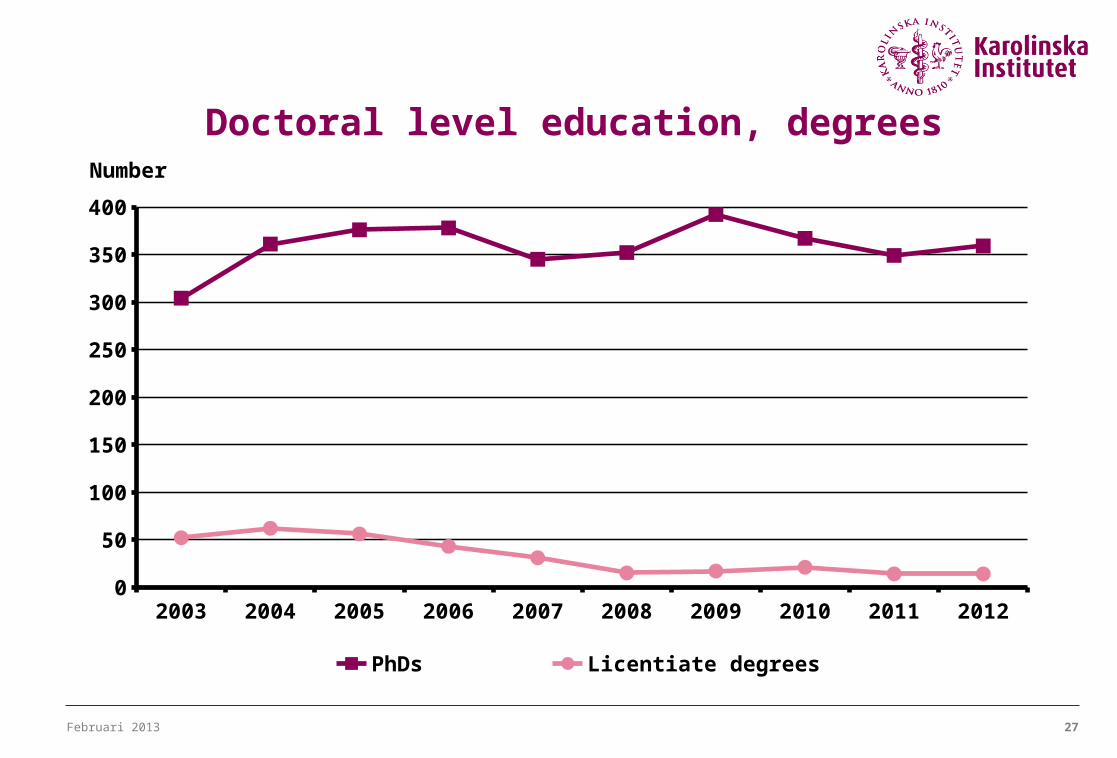
Doctoral level education, degrees
2003 2004 2005 2006 2007 2008 2009 2010 2011 20120
50
100
150
200
250
300
350
400
PhDs Licentiate degrees
Number
Februari 2013 28
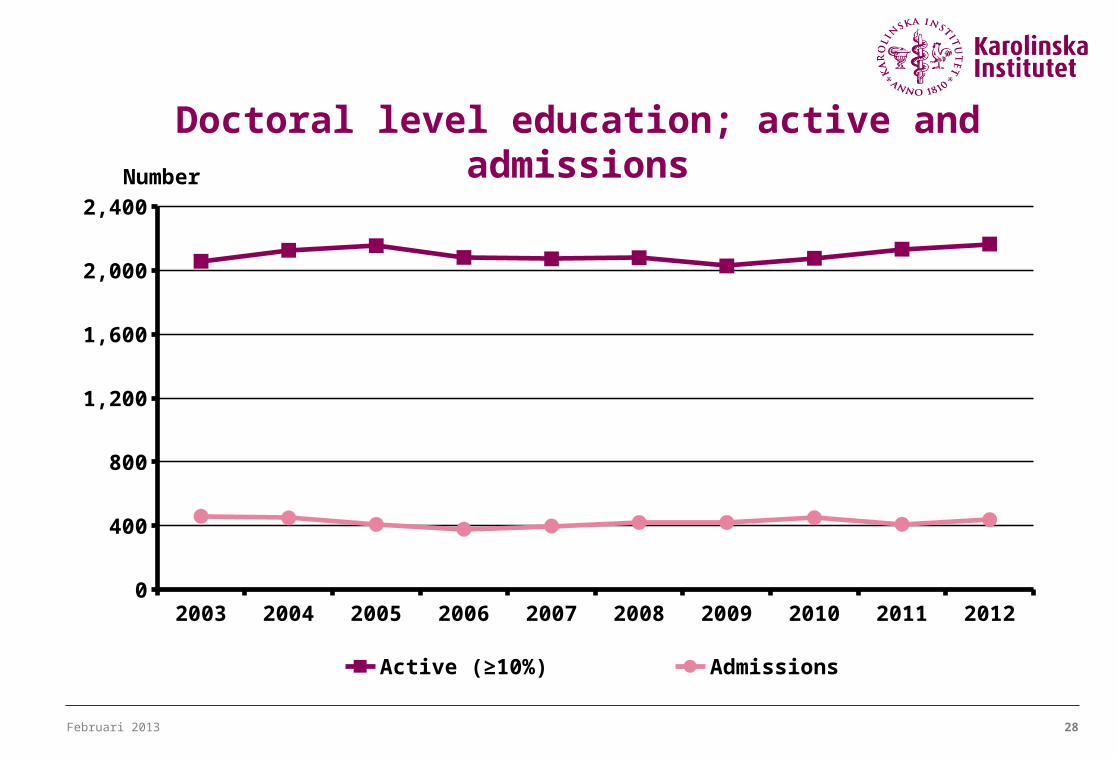
Doctoral level education; active and admissions
2003 2004 2005 2006 2007 2008 2009 2010 2011 20120
400
800
1,200
1,600
2,000
2,400
Active (≥10%) Admissions
Number
Februari 2013 29
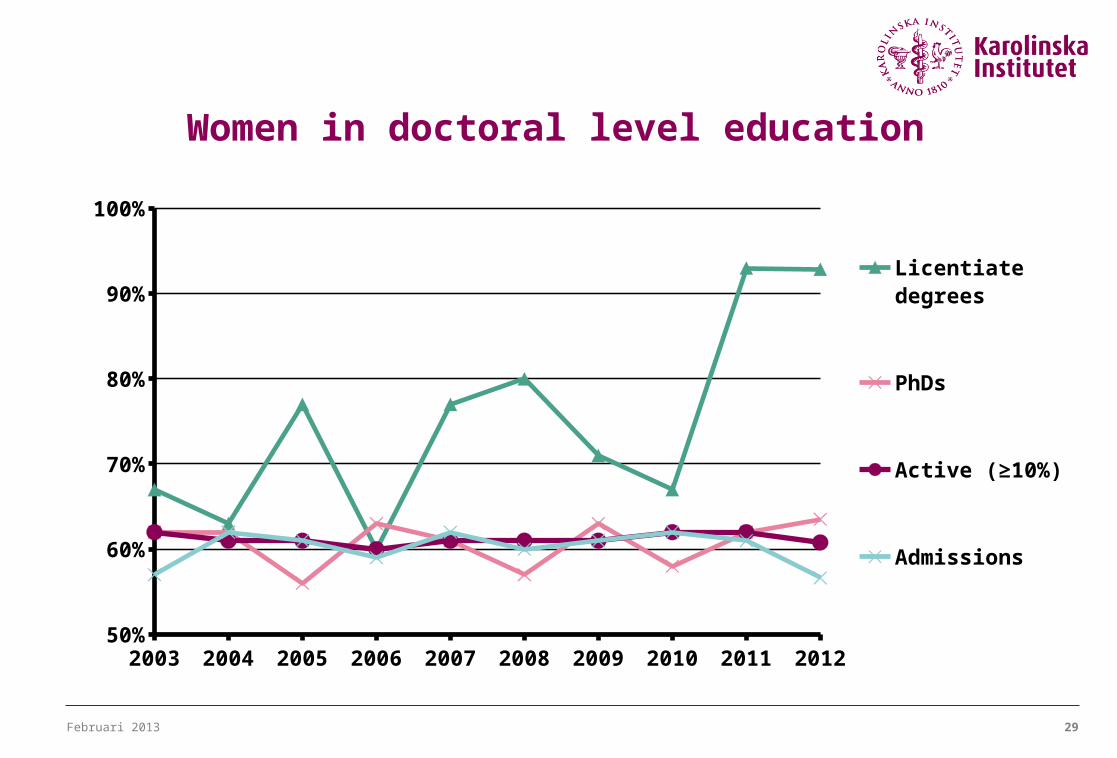
Women in doctoral level education
2003 2004 2005 2006 2007 2008 2009 2010 2011 201250%
60%
70%
80%
90%
100%
Licentiate degrees
PhDs
Active (≥10%)
Admissions
Februari 2013 30
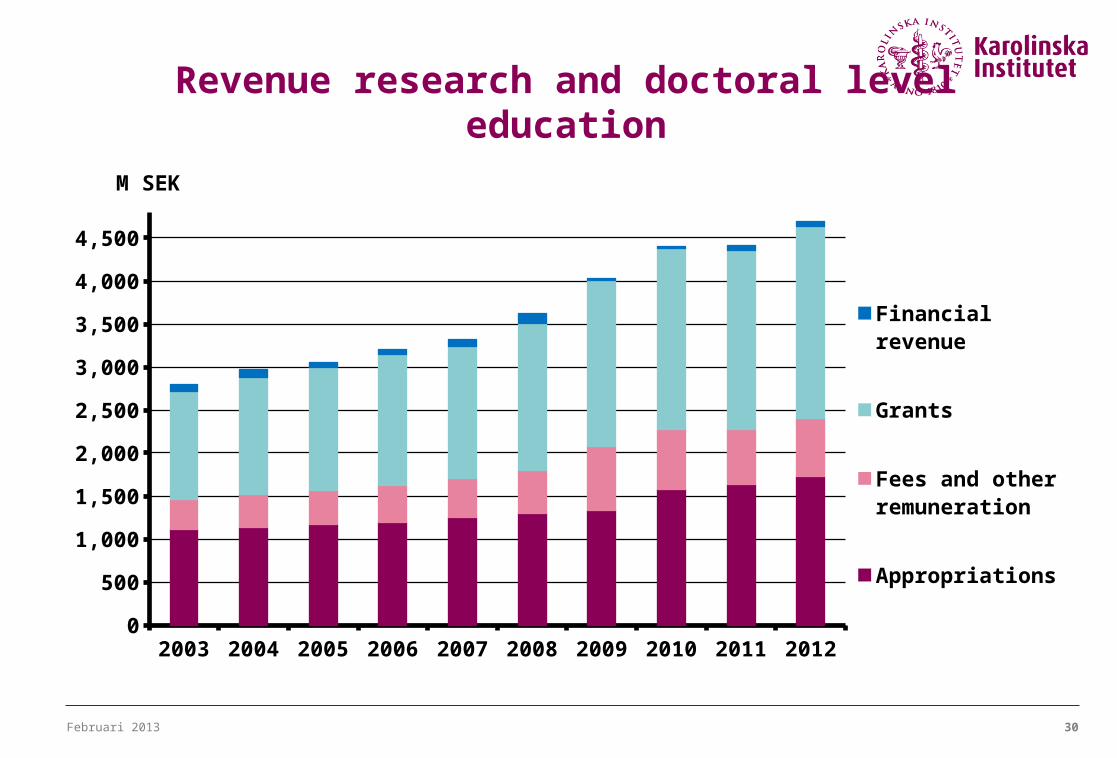
Revenue research and doctoral level education
2003 2004 2005 2006 2007 2008 2009 2010 2011 20120
500
1,000
1,500
2,000
2,500
3,000
3,500
4,000
4,500
Financial revenue
Grants
Fees and other remuneration
Appropriations
M SEK
Februari 2013 31
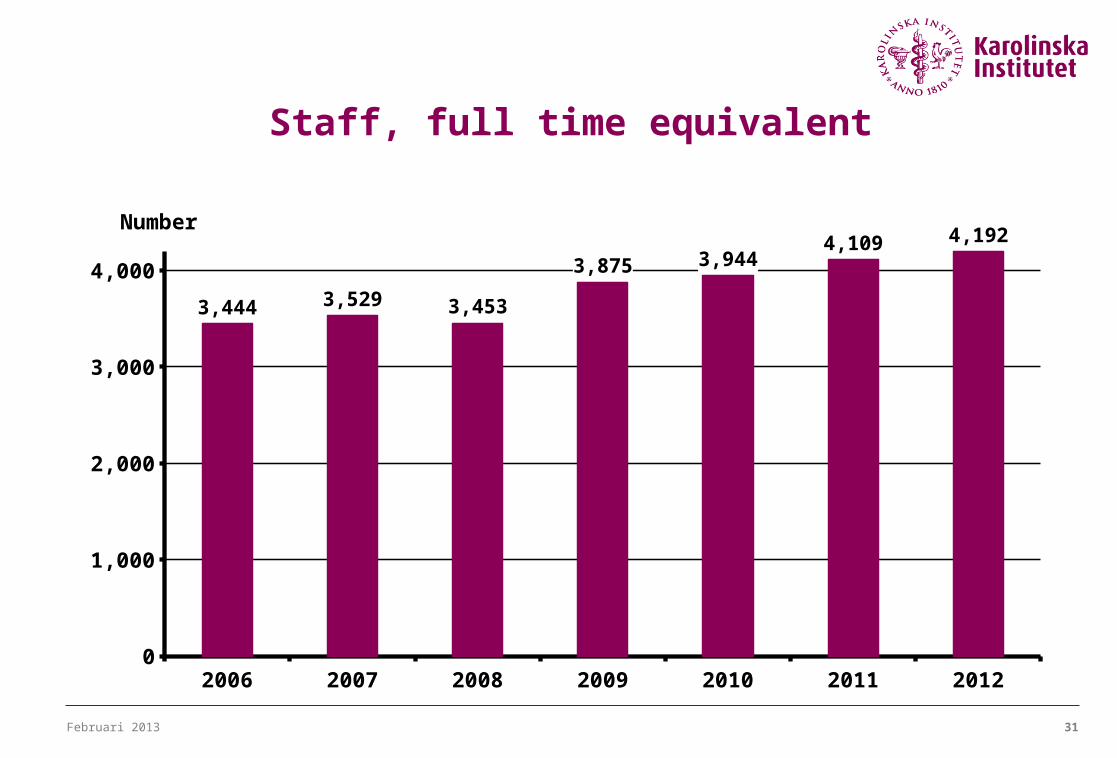
Staff, full time equivalent
2006 2007 2008 2009 2010 2011 20120
1,000
2,000
3,000
4,000
3,444 3,529 3,453
3,875 3,9444,109 4,192
Number
Februari 2013 32
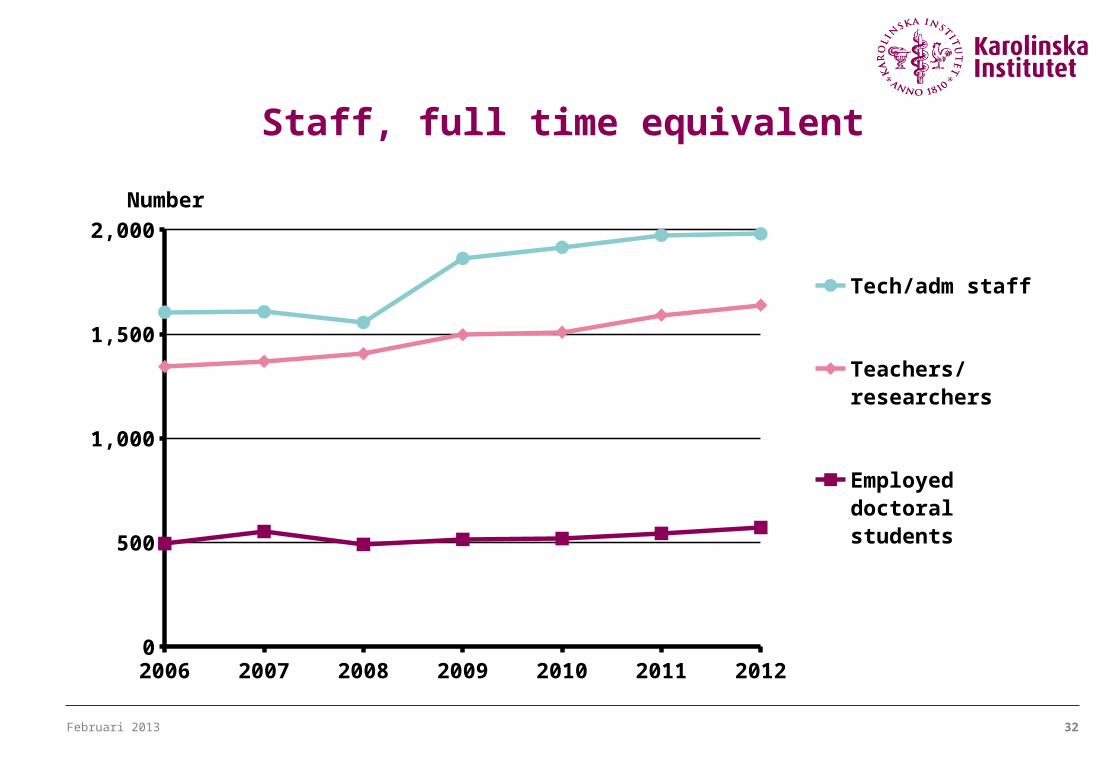
Staff, full time equivalent
2006 2007 2008 2009 2010 2011 20120
500
1,000
1,500
2,000
Tech/adm staff
Teachers/ researchers
Employed doc-toral students
Number
Februari 2013 33
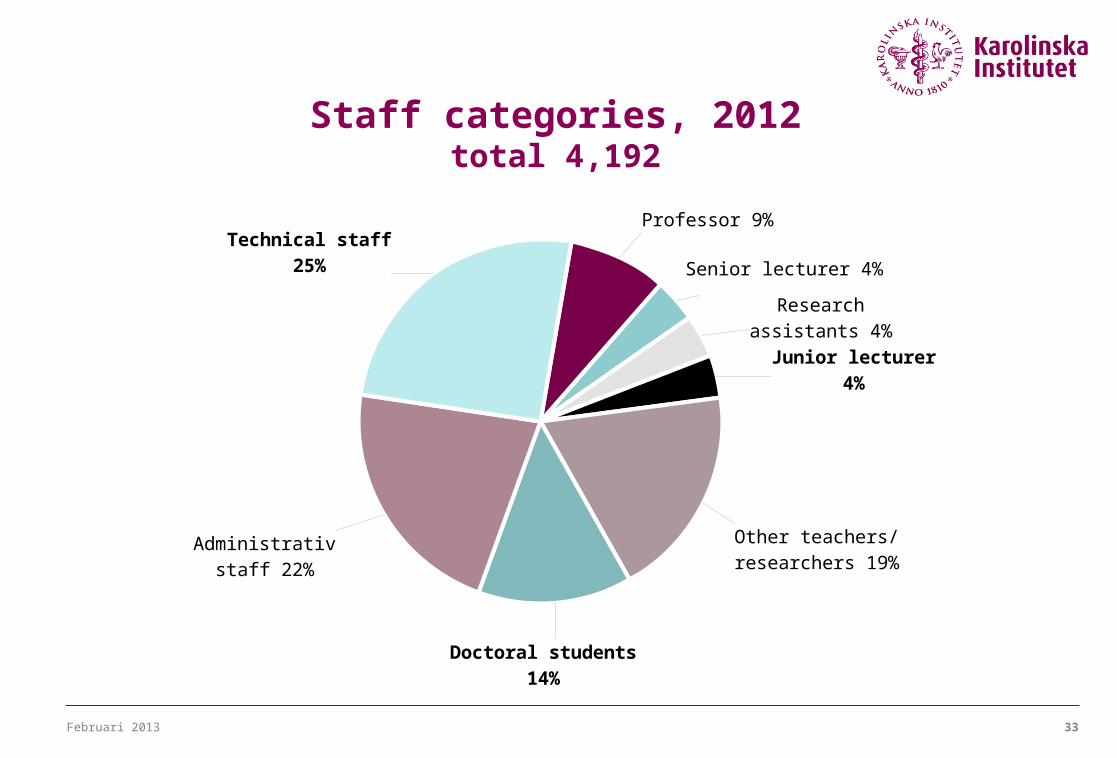
Staff categories, 2012total 4,192
Professor 9%
Senior lecturer 4%Research assistants
4%
Junior lecturer4%
Other teachers/ researchers 19%
Doctoral students14%
Administrativ staff 22%
Technical staff25%

Februari 2013 34
Staff categories: by gender, 2012total 4,192
Admin. staff
Technical staff
Doct. students
Researcher
Junior lecturer
Research assist.
Senior lecturer
Professor
Women (tot 2,678) Men (tot 1,514)
800 200400600 4002000 800600
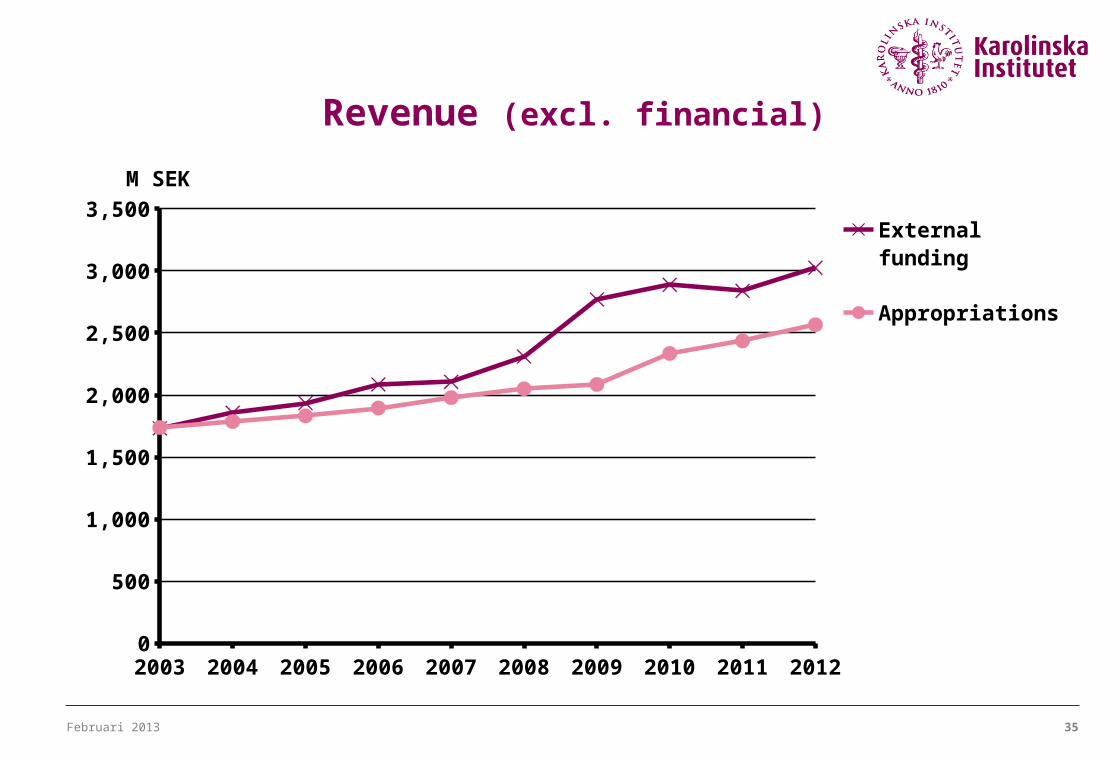
Februari 2013 35
Revenue (excl. financial)
2003 2004 2005 2006 2007 2008 2009 2010 2011 20120
500
1,000
1,500
2,000
2,500
3,000
3,500
External funding
Appropriations
M SEK
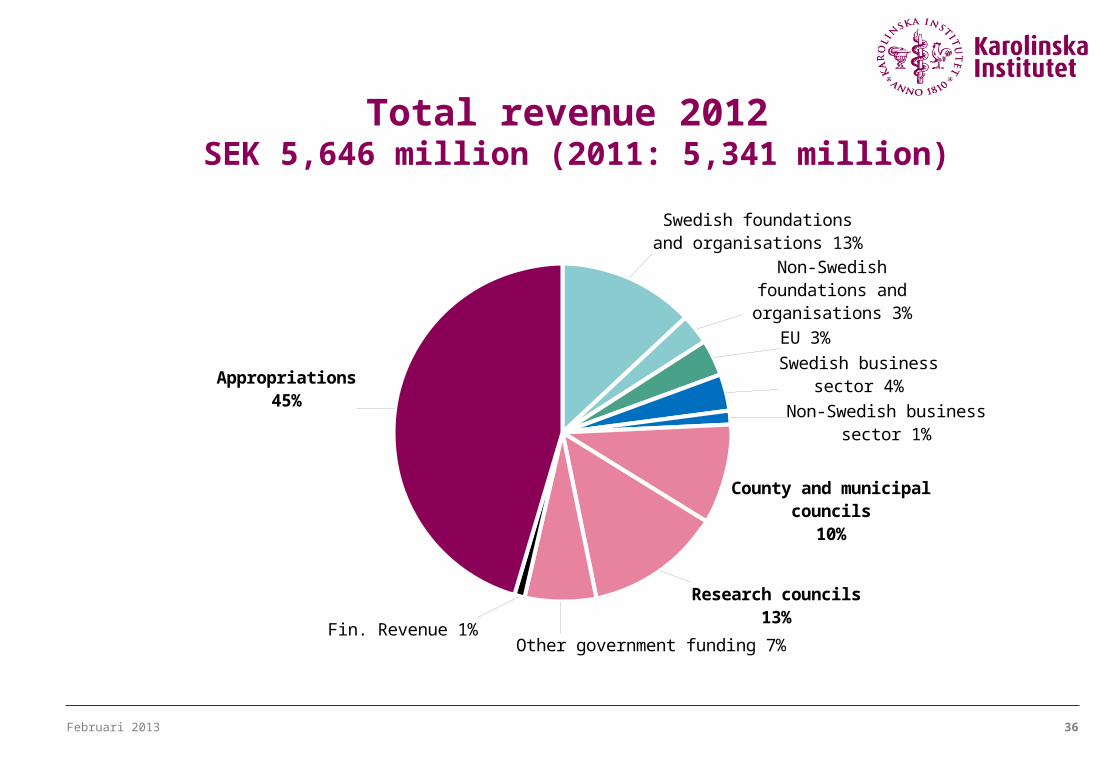
Februari 2013 36
Total revenue 2012 SEK 5,646 million (2011: 5,341 million)
Swedish foundations and organisations 13%
Non-Swedish foundations and organisations 3%
EU 3%
Swedish business sector 4%
Non-Swedish business sec-tor 1%
County and municipal councils
10%
Research councils13%
Other government funding 7%Fin. Revenue 1%
Appropriations45%
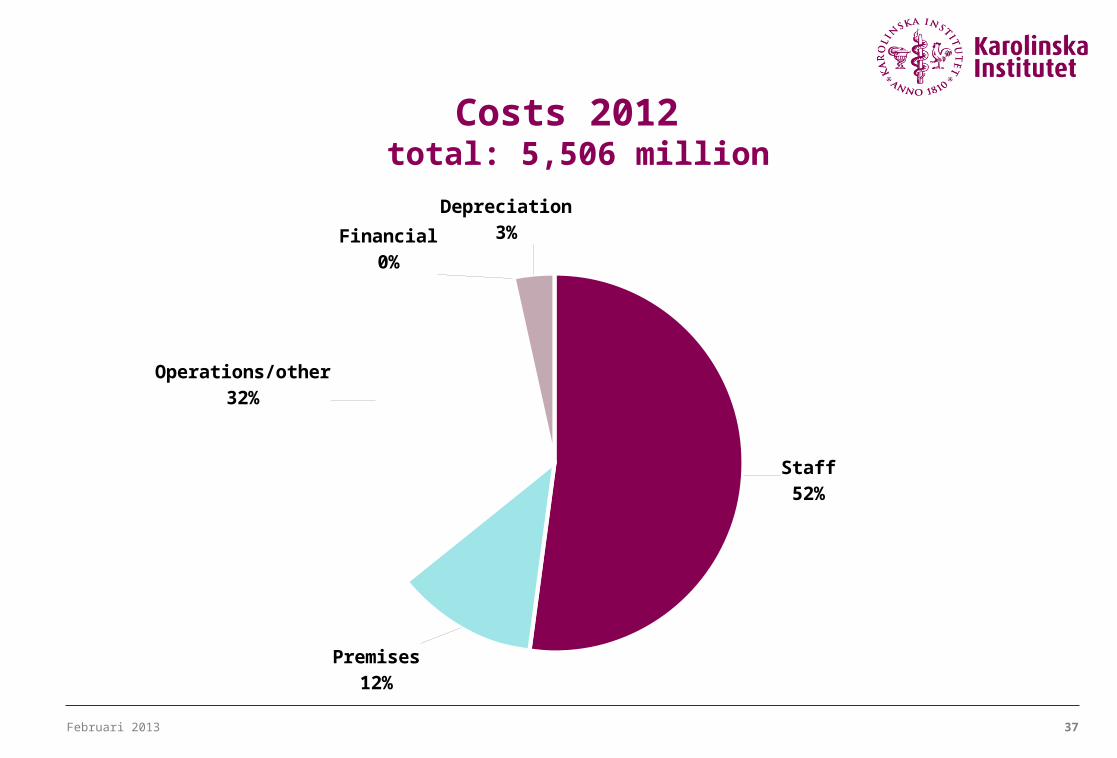
Februari 2013 37
Costs 2012 total: 5,506 million
Staff52%
Premises12%
Operations/other32%
Financial0%
Depreciation3%
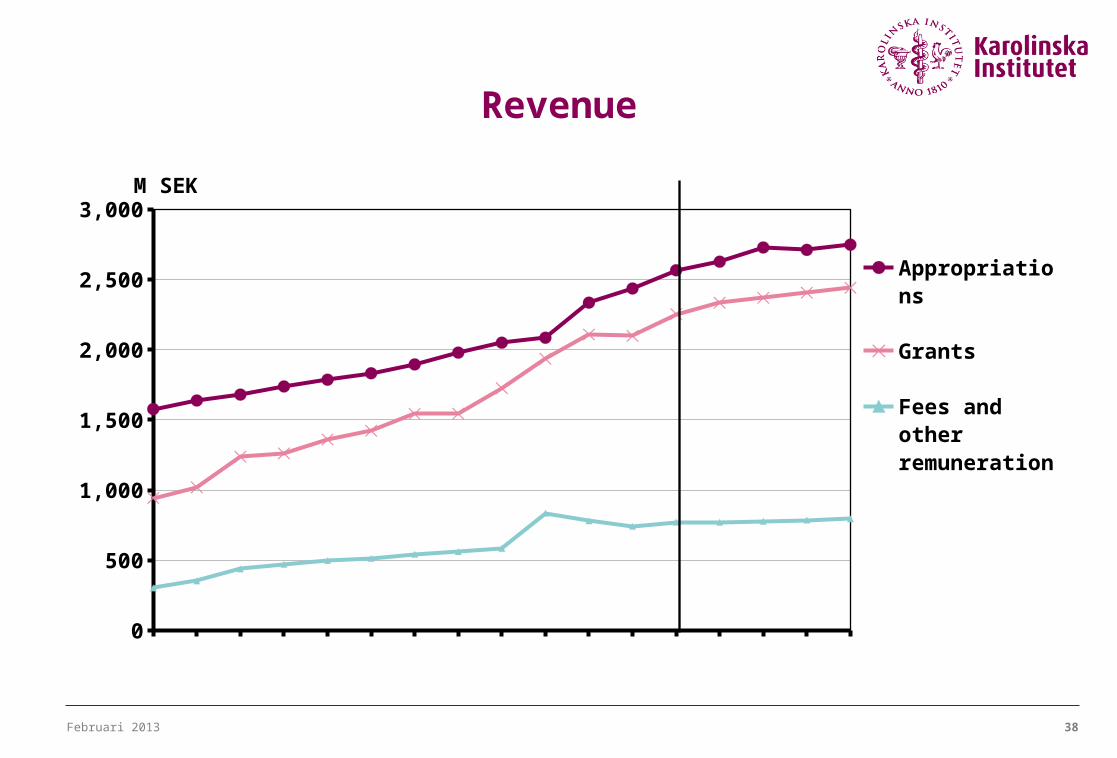
Februari 2013 38
Revenue
2000
2005
2010
2015
0
500
1,000
1,500
2,000
2,500
3,000
Appropriations
Grants
Fees and other remuneration
M SEK
Februari 2013 39
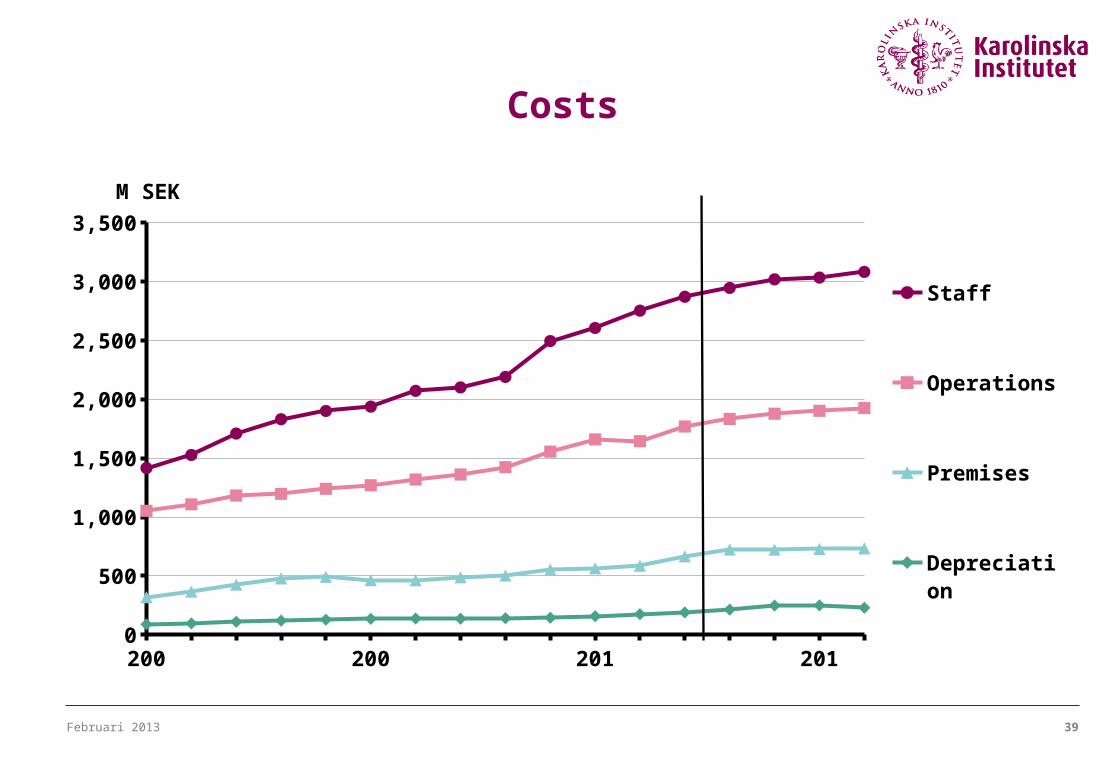
Costs
2000
2005
2010
2015
0
500
1,000
1,500
2,000
2,500
3,000
3,500
Staff
Operations
Premises
Depreciation
M SEK
Recommended