Factors Influencing Decomposition of Surface Litter from the Cerrado in Central Brazil
R.G. ZeppR.G. Zepp11, M. Molina, M. Molina11, M. , M. CyterskiCyterski11, K. Kisselle, K. Kisselle22, A.R. , A.R.
KozovitsKozovits33, M.R.S.S. Silva, M.R.S.S. Silva44, D.A. da , D.A. da SilvaSilva44, and M.M.C. Bustamante, and M.M.C. Bustamante44
11U.S. EPA, Athens GA; U.S. EPA, Athens GA; 2 2 Austin College, Austin College, Sherman TX; Sherman TX; 33Universidade Federal de Universidade Federal de Ouro Preto; Ouro Preto; 44Universidade de Universidade de Brasília Brasília

OUTLINEOUTLINE
Pathways for effects of light and Pathways for effects of light and fertilization on surface litter fertilization on surface litter decompositiondecomposition
Action spectra for Action spectra for photodecompositionphotodecomposition
Comparisons to field studiesComparisons to field studiesFertilization effects Fertilization effects

Projected Changes in Amazon Vegetation CoverProjected Changes in Amazon Vegetation CoverCox et al, 2004Cox et al, 2004

Pathways for Plant Litter Pathways for Plant Litter Transformation and TransportTransformation and Transport
COCO22
Litter Litter Microbial biomassMicrobial biomassRefractory OMRefractory OM
Leaching, runoffLeaching, runoff
DOM(CDOM)DOM(CDOM)Leaching, runoffLeaching, runoff
CDOM is colored (chromophoric) dissolved organic matter-important in remote sensing of color; UV protection
Light,Fertilization

H C2 O
Formaldehyde Acetaldehyde
H C2 O
H
Acetone
C
O
H C3 H 3C
Glyoxal
C
O
H C
O
H
Methylglyoxal
CH C3 C
O O
HCO
Carbon Monoxide
COS
Carbonyl Sulfide
Biologically Labile and/or Biologically Labile and/or VolatileVolatile Photoproducts of Aquatic Dissolved Photoproducts of Aquatic Dissolved
Organic Matter (DOM)Organic Matter (DOM)
Volatile Organic Compounds
Glyoxylate
COOC
O
H
Ammonium
NH4+
Carbon Dioxide
CO2R-C C -R'
C2 - C4

Light-induced Litter Decomposition in Patagonian Steppe
Austin and Vivanco, 2006

Competing Effects of Solar Ultraviolet Competing Effects of Solar Ultraviolet Radiation on Plant Litter DecompositionRadiation on Plant Litter Decomposition
• Enhances decomposition by direct Enhances decomposition by direct photoreactions (open, arid ecosystems)photoreactions (open, arid ecosystems)
• Slows decomposition by inhibition ofSlows decomposition by inhibition ofdecomposers (e.g. fungi)decomposers (e.g. fungi)
• Changes leaf composition in growing Changes leaf composition in growing plants thus altering decompositionplants thus altering decomposition

Processes Driving Trace Gas Exchange Processes Driving Trace Gas Exchange In Terrestrial EcosystemsIn Terrestrial Ecosystems
microbial recycling
degradation
root turnover
groundwater loss
runoff litter
photosynthesisCO22
CO22
CO
CH44
CO NMHCCH4(?)
microbial oxidation
respiration
abioticproduction
litter

Species
CO
flux
, m
ol m
-2 h
r-1
0
10
20
30
40
50
60
70Kielmeyera coriaceaQualea grandifloraBrachiaria sp.Sheflera macrocarpumVochysia ellipticaVochysia thyrsoidea
CO Fluxes From Sunlight-Exposed LitterCO Fluxes From Sunlight-Exposed Litter

Developing Relationships Required to Developing Relationships Required to ModelModel
Sunlight-Induced Decomposition of Plant Sunlight-Induced Decomposition of Plant LitterLitter
General Approach: Determine action spectra using Rundel General Approach: Determine action spectra using Rundel technique (Rundel, technique (Rundel, Physiol. Plant.Physiol. Plant., 58, (1986) 360-366.), 58, (1986) 360-366.)
Steps: -Determine decomposition rates by following certain-Determine decomposition rates by following certain indicators, e.g. weight loss, COindicators, e.g. weight loss, CO22 or CO production or CO production using filters that block UV using filters that block UV-Measure irradiance of filtered light-Measure irradiance of filtered light-Fit the data using exponential (or other) equation -Fit the data using exponential (or other) equation of form (EXP (a + b * Wavelength) of form (EXP (a + b * Wavelength) -Use Excel Solver to compute values of a and b
that minimize difference between observed and computed decomp rates

Filtered Irradiance Used to Determine Action Spectra For Litter Decomposition
Wavelength, nm
300 400 500 600 700
Irra
dian
ce, W
m-2
nm
-1
0.0
0.5
1.0
1.5
2.0
305 nm320 nm360 nm385 nm

CO Production from Various Cerrado Litter SourcesCO Production from Various Cerrado Litter SourcesExposed to Filtered Simulated Solar RadiationExposed to Filtered Simulated Solar Radiation
Filter Cutoff Wavelength (nm)
AM1 385 nm 360 nm 320 nm 305 nm
CO
Pro
duct
ion
(nL
CO
s-1
cm
-2)
0.00
0.01
0.02
0.03
0.04
Kielmeyera coriacea Qualea grandiflora Brachiaria sp. Sheflera macrocarpum Vochysia elliptica Vochysia thyrsoidea

SpeciesSpecies a b RMSESun Sun FluxFlux
Kielmeyera coriaceaKielmeyera coriacea -2.37 -0.0198 0.00131 0.0028
Qualea grandifloraQualea grandiflora 3.12 -0.0348 0.00165 0.0031
Brachiaria sp.Brachiaria sp. 8.63 -0.0507 0.00417 0.0034
Sheflera Sheflera macrocarpummacrocarpum 2.78 -0.0314 0.00484 0.0073
Vochysia ellipticaVochysia elliptica 7.55 -0.0448 0.00421 0.0085
Vochysia thyrsoideaVochysia thyrsoidea -0.40 -0.0219 0.00677 0.0093
Flux = a expFlux = a exp-b-bλλ
Equation and Data Describing LitterEquation and Data Describing LitterPhotodegradation FluxesPhotodegradation Fluxes

Action Action SpectraSpectra for Plant Litter Photodecomposition for Plant Litter Photodecomposition
Wavelength, nm
300 350 400 450 500
Rel
ativ
e A
ctio
n
1e-5
1e-4
1e-3
1e-2
1e-1
1e+0
1e+1
Brachiaria sp Kielmeyera coriacea Qualea grandiflora Sheflera macrocarpum Vochysia elliptica Vochysia thyrsoidea

Wavelength Effects for Sunlight-inducedDecomposition of Brachiaria sp
Wavelength, nm
300 320 340 360 380 400
Rel
ativ
e A
ctio
n
0.0
0.2
0.4
0.6
0.8
1.0
1.2
Irra
dian
ce o
r W
eigh
ted
irrad
ianc
e
(W m
-2 n
m-1
)
0.0
0.2
0.4
0.6
0.8
1.0
1.2
UVB
IrradianceWavelength
Weighted irradiance

CO flux = 7.5 x 10⁻⁶ x (PAR)
CO2 flux = (7.5 -15) x 10-6 x (PAR)(PAR expressed as W m-2)
For Cerrado CO2 in dry season
est. 0.3-0.6 µmol m-2 s-1
~15-30% of observed
Estimated Relationship Estimated Relationship Between Degradation and Between Degradation and Photosynthetically Active Photosynthetically Active
Radiation (PAR)Radiation (PAR)

Litter CO Fluxes Observed in Cerrado SitesLitter CO Fluxes Observed in Cerrado SitesKisselle et al., 2002Kisselle et al., 2002
With litterWithout litter

Fertilizer Effects: Long-term Fertilizer Effects: Long-term Incubation ExperimentIncubation Experiment
Collect Soil samples 0-10 cm10-20 cmSieving
Addition of Soil and Nutrients to Jars
Measure
•CO2 (Licor)
•CO (Trace A)
•Fertilizers added: N, P, N+P•All fertilizers added in granular form•Jars were incubated in the dark at room temperature, at 60% WHC for 143 days.

Fertilization Effects on Average COFertilization Effects on Average CO22 Flux Flux from Soils (0-10 cm Depth)from Soils (0-10 cm Depth)
0
1
2
3
4
5
6
1 11 20 32 41 53 62 82 102 126 143Days
CO2
flux
(um
oles
CO
2 m
-2 s
-1)
Control 0-10cm
N 0-10 cm
P 0-10 cm
N+P 0-10 cm

Fertilization Effects on Exponential Decay Constants for the Active and
Slow C Pools in Cerrado Soils
TreatmentsOriginal Soil Depth (cm)
Act. C ka
Slow C ks
Control 0-10 0.52 0.03
N 1.03 0.03
P 2.26 0.02
N+P 0.62 0.03
Control 10-20 0.06 0.00
N 0.13 0.00
P 0.23 0.01
N+P 0.13 0.01
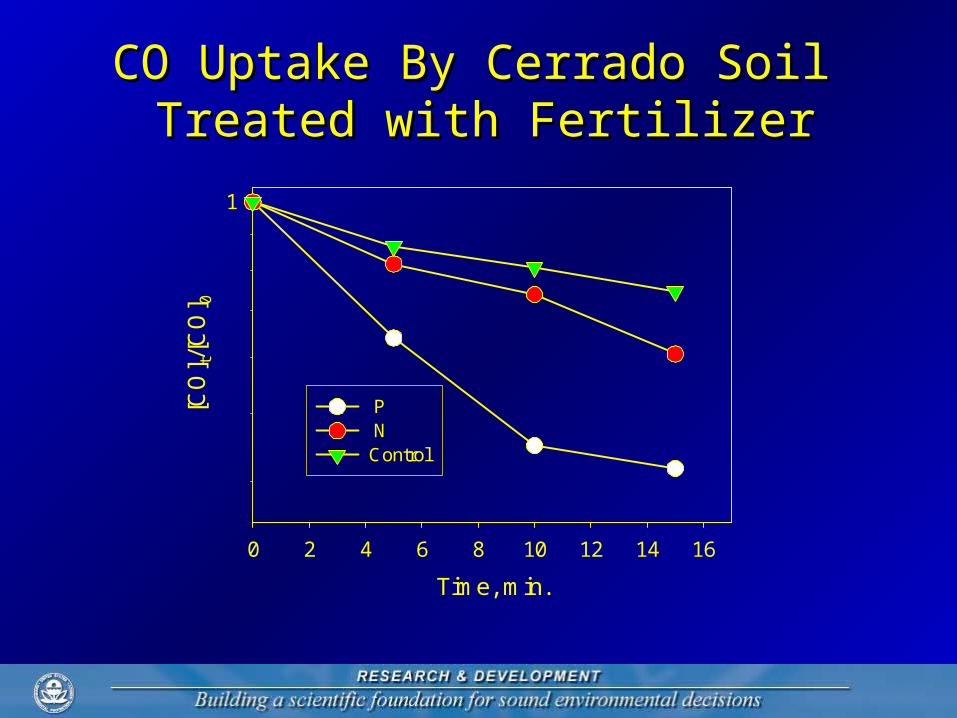
Time, min.
0 2 4 6 8 10 12 14 16
[CO
] t/[C
O] 0
1
P N Control
CO Uptake By Cerrado SoilCO Uptake By Cerrado Soil Treated with FertilizerTreated with Fertilizer

De
po
sitio
n V
elo
city
, cm
s-1
0.000
0.002
0.004
0.006
0.008
0.010
0.012
0.014
ControlNP
Deposition Velocities for CO UptakeDeposition Velocities for CO Uptake By Soil Treated With FertilizerBy Soil Treated With Fertilizer

Summary of Results Summary of Results and Conclusionsand Conclusions
• Litter photodegradation is a significant CO source and loss pathway for surface litter in the Cerrado during dry season.
• Action spectra for litter photodegradation are species dependent and induced primarily by UV component of sunlight
• Fertilizer addition, esp. P, increases the microbial respiration of the labile C of surface SOM from Cerrado s.s. and enhances CO uptake
Recommended