FACT BOOK
2002
Compiled by
Heather Rossiter Institutional Analyst
Centre for Institutional Analysis and Planning
This report is also available at: http://www.mun.ca/ciap/factbook.html
030-023-11-02-350

INTRODUCTION
The Centre for Institutional Analysis and Planning (CIAP) is pleased to present our 14th annual Fact Book. This publication is now available in this printed format and an electronic version. You will find it plus other reports and information, on our Web page at: http://www.mun.ca/ciap. Over the course of the academic year, university offices responsible for maintaining permanent records are called upon to satisfy the data requirements of a variety of users. We realize that no project of this scope can be all things to all people; therefore, some readers may have questions that are not completely answered by this book's contents. Before you begin your analysis, please note the following items that apply to the entire publication; issues that are specific to particular sections have been presented at the beginning of that section. Where data in a table is an aggregate of several components, this book presents the data in a series of related tables. The first table shows the combined totals, and subsequent tables in the series show the individual components. For example, Table 5 has three segments: 5A describes total student graduate and undergraduate enrolment by faculty and school; and Tables 5B and 5C, respectively, show the full-time and part-time components. Because of the similarity of many of the tables, please read the title and any footnotes carefully. As well, similar data in seemingly comparable tables may have been taken over slightly different time frames. This document is the end product of data and suggestions that were contributed by the following departments. We are grateful to the staff at:
Alumni Affairs and Development Financial and Administrative Services Human Resources Marine Institute Office of Research Office of the Registrar University Library
If you would like further information regarding any tables found either in this publication or on our Web page, the Centre for Institutional Analysis and Planning (737-4016) will be pleased to assist.
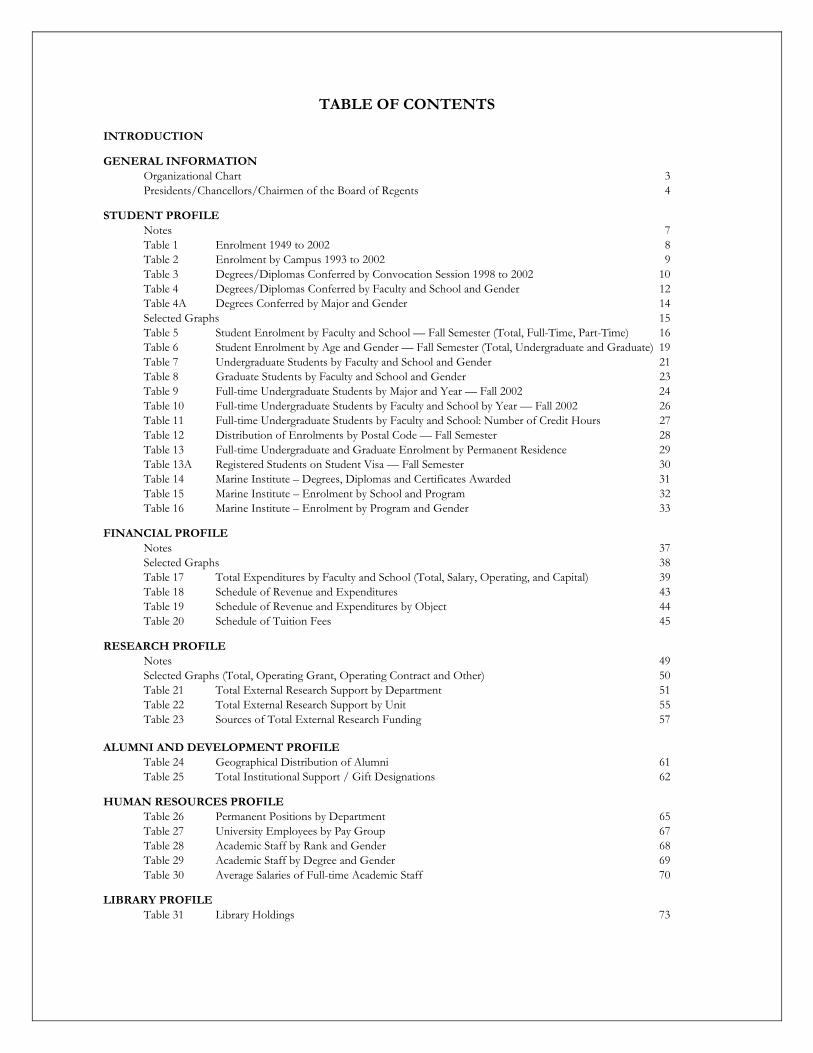
TABLE OF CONTENTS INTRODUCTION
GENERAL INFORMATION Organizational Chart 3
Presidents/Chancellors/Chairmen of the Board of Regents 4
STUDENT PROFILE Notes 7 Table 1 Enrolment 1949 to 2002 8 Table 2 Enrolment by Campus 1993 to 2002 9 Table 3 Degrees/Diplomas Conferred by Convocation Session 1998 to 2002 10 Table 4 Degrees/Diplomas Conferred by Faculty and School and Gender 12 Table 4A Degrees Conferred by Major and Gender 14
Selected Graphs 15 Table 5 Student Enrolment by Faculty and School — Fall Semester (Total, Full-Time, Part-Time) 16 Table 6 Student Enrolment by Age and Gender — Fall Semester (Total, Undergraduate and Graduate) 19 Table 7 Undergraduate Students by Faculty and School and Gender 21 Table 8 Graduate Students by Faculty and School and Gender 23 Table 9 Full-time Undergraduate Students by Major and Year — Fall 2002 24 Table 10 Full-time Undergraduate Students by Faculty and School by Year — Fall 2002 26 Table 11 Full-time Undergraduate Students by Faculty and School: Number of Credit Hours 27 Table 12 Distribution of Enrolments by Postal Code — Fall Semester 28 Table 13 Full-time Undergraduate and Graduate Enrolment by Permanent Residence 29
Table 13A Registered Students on Student Visa — Fall Semester 30 Table 14 Marine Institute – Degrees, Diplomas and Certificates Awarded 31 Table 15 Marine Institute – Enrolment by School and Program 32 Table 16 Marine Institute – Enrolment by Program and Gender 33
FINANCIAL PROFILE Notes 37 Selected Graphs 38 Table 17 Total Expenditures by Faculty and School (Total, Salary, Operating, and Capital) 39 Table 18 Schedule of Revenue and Expenditures 43 Table 19 Schedule of Revenue and Expenditures by Object 44 Table 20 Schedule of Tuition Fees 45
RESEARCH PROFILE Notes 49 Selected Graphs (Total, Operating Grant, Operating Contract and Other) 50 Table 21 Total External Research Support by Department 51 Table 22 Total External Research Support by Unit 55 Table 23 Sources of Total External Research Funding 57 ALUMNI AND DEVELOPMENT PROFILE Table 24 Geographical Distribution of Alumni 61 Table 25 Total Institutional Support / Gift Designations 62
HUMAN RESOURCES PROFILE Table 26 Permanent Positions by Department 65 Table 27 University Employees by Pay Group 67 Table 28 Academic Staff by Rank and Gender 68 Table 29 Academic Staff by Degree and Gender 69
Table 30 Average Salaries of Full-time Academic Staff 70
LIBRARY PROFILE Table 31 Library Holdings 73
General
Information

Memorial University of Newfoundland Fact Book 2002 3
Organizational Chart – November 2002
MEMORIAL UNIVERSITY OF NEWFOUNDLANDNovember 2002
T. Pound-CurtisDirector
Financial & Administrative Services
T.W. BusseyDirector
Computing & Communications
G. McDonaldDirector
Human Resources
D. MilesDirector
Facilities Management
W.W. ThistleVice-President (Administration &
Finance) & Legal Counsel
J. StrawbridgeDirector
Faculty Relations
A. CollinsActing Dean
Faculty of Education
C. JablonskiInterim Dean
School of Graduate Studies
A. FowlerPrincipal
Sir Wilfred Grenfell College
C. HiggsDirector
Human Kinetics & Recreation
G.W. CollinsRegistrar
I. BowmerDean
Faculty of Medicine
L. HensmanActing Director
School of Pharmacy
S. Birnie-Lefcovitch Director
School of Social Work
D. GrahamDean
Faculty of Arts
R. LucasDean
Faculty of Science
T. GordonDirector
School of Music
R.H.EllisUniversity Librarian
Queen Elizabeth II Library
G. GormanDean
Faculty of Business Administration
C. OrchardDirector
School of Nursing
M. Haddera Acting Dean, Faculty of Engineering
& Applied Science
L. O'ReillyExecutive Director
Fisheries & Marine Institute
P. Chancey Director, Centre for
Institutional Analysis and Planning
D. WhalenInterim Director
Division of Lifelong Learning
A. M. VaughanInterim Director
Distance Education & Learning Technology
K. CracknellHarlow Campus
S.Perry-MaidmentActing Director
International Student Recruitment and Support
T. BorlaseDirector
Labrador Institute
M. CollinsAssociate Vice-President
(Academic)
E. SimpsonVice-President
(Academic)
G. HurleyDirector
Counselling Centre
C. LeonardDirector
Student Support Programs
R. HarpurDirector
Student Health Services
B. JohnstonDirector
Housing, Food & Conference Services
R. SheaDirector
Career Development & Experiential Learning
L. WalkerDean
Student Affairs & Services
L. HusaDirector
Animal Care
A. DickinsonExecutive DirectorInternational Centre
R. SheppardDirector
Technical Services
B. CoxDirector
Office of Research
C. W. LoomisVice-President
Research & International Relations
J. KearseyDirector
Alumni Affairs & Development
V. CollinsDirector
University Relations
P. GrattanDirector, Memorial University of
Nfld. Art Gallery Inc.
J. WhittickPresident & C.E.O.
C-CORE
D. KingPresident & C.E.O.
Genesis Group
K. W. NichollsDirector, Memorial University of
Nfld. Botanical Gardens Inc.
A. RichardsonDirector
MUN Recreation Complex, Inc.
A. MeisenPresident and Vice-Chancellor
4 Memorial University of Newfoundland Fact Book 2002
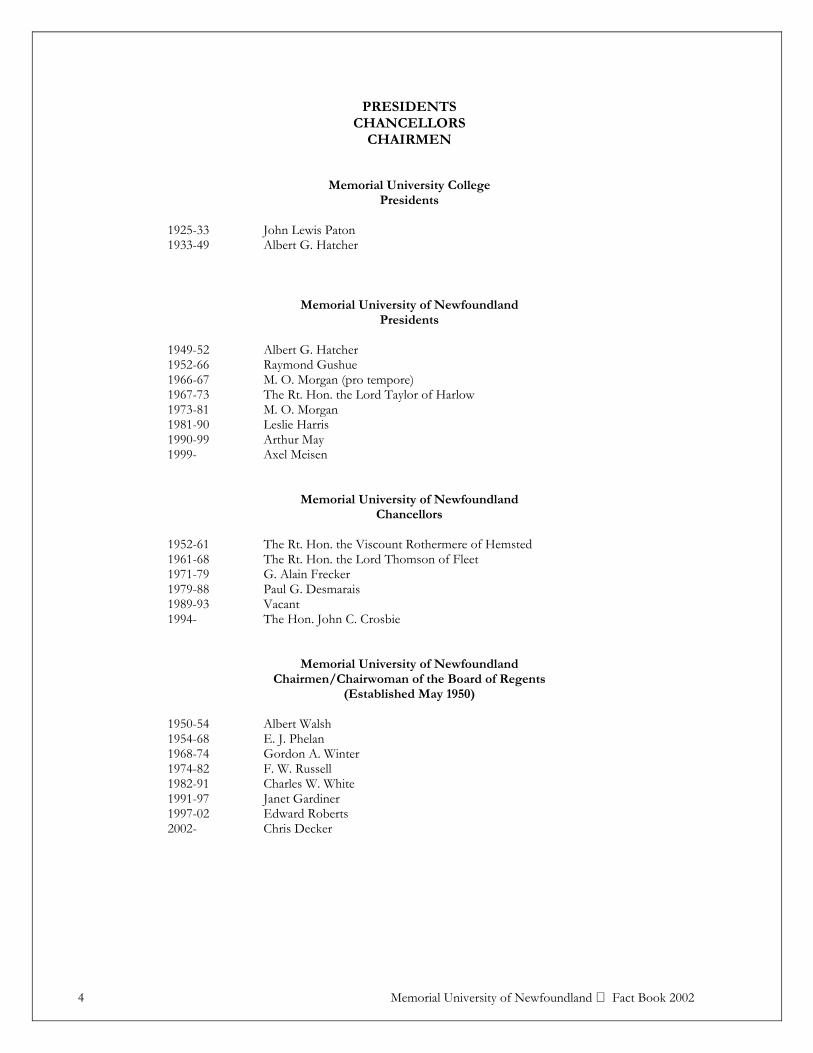
PRESIDENTS
CHANCELLORS CHAIRMEN
Memorial University College Presidents
1925-33 John Lewis Paton 1933-49 Albert G. Hatcher
Memorial University of Newfoundland Presidents
1949-52 Albert G. Hatcher 1952-66 Raymond Gushue 1966-67 M. O. Morgan (pro tempore) 1967-73 The Rt. Hon. the Lord Taylor of Harlow 1973-81 M. O. Morgan 1981-90 Leslie Harris 1990-99 Arthur May 1999- Axel Meisen
Memorial University of Newfoundland Chancellors
1952-61 The Rt. Hon. the Viscount Rothermere of Hemsted 1961-68 The Rt. Hon. the Lord Thomson of Fleet 1971-79 G. Alain Frecker 1979-88 Paul G. Desmarais 1989-93 Vacant 1994- The Hon. John C. Crosbie
Memorial University of Newfoundland Chairmen/Chairwoman of the Board of Regents
(Established May 1950)
1950-54 Albert Walsh 1954-68 E. J. Phelan 1968-74 Gordon A. Winter 1974-82 F. W. Russell 1982-91 Charles W. White 1991-97 Janet Gardiner 1997-02 Edward Roberts 2002- Chris Decker

Memorial University of Newfoundland Fact Book 2002 5
Student
Profile
Memorial University of Newfoundland Fact Book 2002 7
Student Profile
Notes The data found in this section of the Fact Book has been compiled by the Office of the Registrar from their computerized files. The following definitions (as found in the university Calendar) and explanations should be noted: Definitions: 1. Undergraduate students are categorized as follows:
• first-year students have earned fewer than 18 credit hours; • second-year students have earned not fewer than 18 credit hours; third-year students have earned not fewer than 48
credit hours; • fourth-year students have earned not fewer than 78 credit hours; and • fifth-year students are those who have earned not fewer than 108 credit hours.
2. Full-time undergraduate students: students who have been duly admitted to this university and who are duly registered for the duration of any semester or session in at least nine credit hours or the equivalent are termed full-time students. For the spring semester (including intersession and summer session), students who register for a total of at least nine credit hours, whether they be session courses or semester courses, such that the student is taking at least one course at any time during the twelve-week semester, will be deemed to be full-time students (reference university Calendar 2002-2003, page 57).
Part-time undergraduate students: students who have been duly admitted to the university and who are registered for fewer than nine credit hours or the equivalent in any semester or session are termed part-time students (reference university Calendar 2002-2003, page 57).
3. A graduate student is one who has been admitted to a graduate degree or a graduate diploma program. A full-time
graduate student is one who registers as such, devotes full time to his or her academic program and may not commit more than 24 hours a week working time, including teaching assistant or research assistant duties, to matters other than the degree program (reference university Calendar 2002-2003, page 446).
A part-time graduate student is one who is registered for the duration of a semester and is not classified as full-time (reference university Calendar 2002-2003, page 446).
Explanations: 1. Only enrolment data from the fall semester are shown in this Fact Book. 2. Enrolment data shown in Tables 1 and 2 differ from enrolment data shown in other tables. The data in Tables 1 and 2
are compiled at the end of the regular registration period. All other enrolment data are taken at the end of the drop period. 3. Data recorded are as indicated on students’ application for admission/readmission and other appropriate forms.
4. The ‘unspecified’ category in student enrolment includes ‘not applicable’, ‘not specified’, ‘undeclared’ and ‘other’. 5. In 1983-84 first-year enrolment was reduced significantly because of the implementation of Grade XII in
Newfoundland and Labrador schools. 6. Table 14, 15 and 16 refer to Marine Institute students.
8 Memorial University of Newfoundland Fact Book 2002
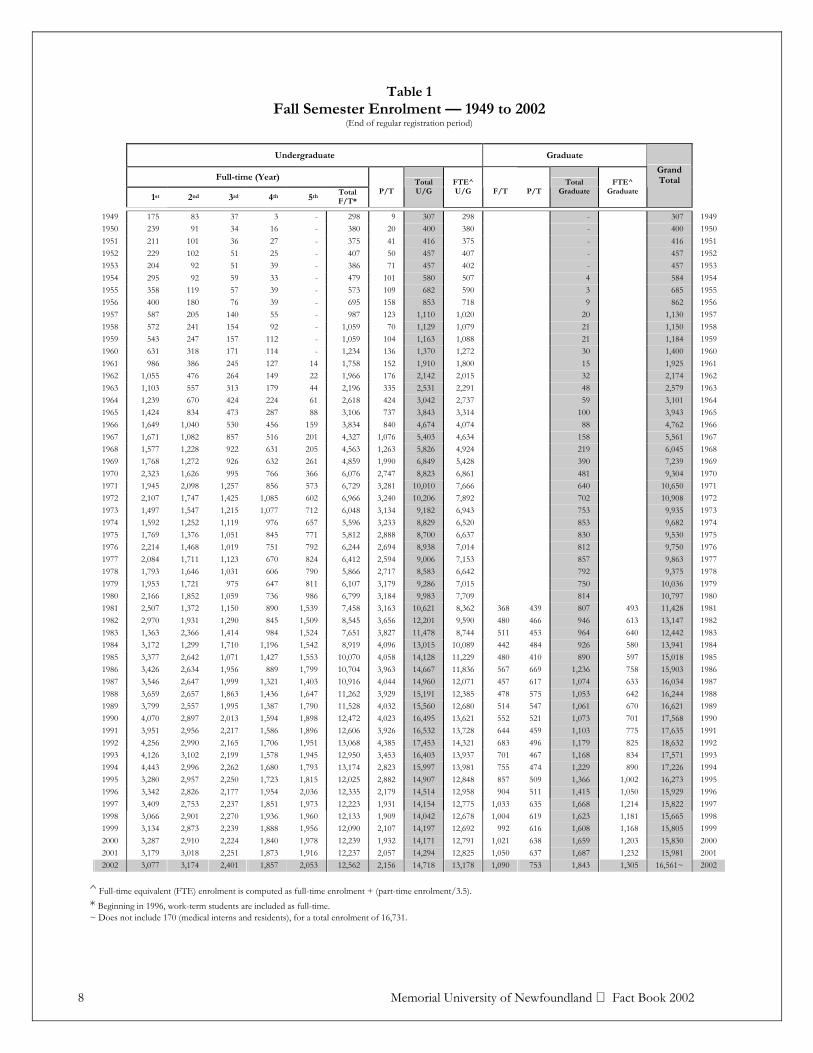
Table 1 Fall Semester Enrolment — 1949 to 2002
(End of regular registration period)
Undergraduate Graduate
Full-time (Year)
1st 2nd 3rd 4th 5th Total F/T*
P/T
Total U/G
FTE^ U/G
F/T
P/T
Total Graduate
FTE^ Graduate
Grand Total
1949 175 83 37 3 - 298 9 307 298 - 307 19491950 239 91 34 16 - 380 20 400 380 - 400 19501951 211 101 36 27 - 375 41 416 375 - 416 19511952 229 102 51 25 - 407 50 457 407 - 457 19521953 204 92 51 39 - 386 71 457 402 - 457 19531954 295 92 59 33 - 479 101 580 507 4 584 19541955 358 119 57 39 - 573 109 682 590 3 685 19551956 400 180 76 39 - 695 158 853 718 9 862 19561957 587 205 140 55 - 987 123 1,110 1,020 20 1,130 19571958 572 241 154 92 - 1,059 70 1,129 1,079 21 1,150 19581959 543 247 157 112 - 1,059 104 1,163 1,088 21 1,184 19591960 631 318 171 114 - 1,234 136 1,370 1,272 30 1,400 19601961 986 386 245 127 14 1,758 152 1,910 1,800 15 1,925 19611962 1,055 476 264 149 22 1,966 176 2,142 2,015 32 2,174 19621963 1,103 557 313 179 44 2,196 335 2,531 2,291 48 2,579 19631964 1,239 670 424 224 61 2,618 424 3,042 2,737 59 3,101 19641965 1,424 834 473 287 88 3,106 737 3,843 3,314 100 3,943 19651966 1,649 1,040 530 456 159 3,834 840 4,674 4,074 88 4,762 19661967 1,671 1,082 857 516 201 4,327 1,076 5,403 4,634 158 5,561 19671968 1,577 1,228 922 631 205 4,563 1,263 5,826 4,924 219 6,045 19681969 1,768 1,272 926 632 261 4,859 1,990 6,849 5,428 390 7,239 19691970 2,323 1,626 995 766 366 6,076 2,747 8,823 6,861 481 9,304 19701971 1,945 2,098 1,257 856 573 6,729 3,281 10,010 7,666 640 10,650 19711972 2,107 1,747 1,425 1,085 602 6,966 3,240 10,206 7,892 702 10,908 19721973 1,497 1,547 1,215 1,077 712 6,048 3,134 9,182 6,943 753 9,935 19731974 1,592 1,252 1,119 976 657 5,596 3,233 8,829 6,520 853 9,682 19741975 1,769 1,376 1,051 845 771 5,812 2,888 8,700 6,637 830 9,530 19751976 2,214 1,468 1,019 751 792 6,244 2,694 8,938 7,014 812 9,750 19761977 2,084 1,711 1,123 670 824 6,412 2,594 9,006 7,153 857 9,863 19771978 1,793 1,646 1,031 606 790 5,866 2,717 8,583 6,642 792 9,375 19781979 1,953 1,721 975 647 811 6,107 3,179 9,286 7,015 750 10,036 19791980 2,166 1,852 1,059 736 986 6,799 3,184 9,983 7,709 814 10,797 19801981 2,507 1,372 1,150 890 1,539 7,458 3,163 10,621 8,362 368 439 807 493 11,428 19811982 2,970 1,931 1,290 845 1,509 8,545 3,656 12,201 9,590 480 466 946 613 13,147 19821983 1,363 2,366 1,414 984 1,524 7,651 3,827 11,478 8,744 511 453 964 640 12,442 19831984 3,172 1,299 1,710 1,196 1,542 8,919 4,096 13,015 10,089 442 484 926 580 13,941 19841985 3,377 2,642 1,071 1,427 1,553 10,070 4,058 14,128 11,229 480 410 890 597 15,018 19851986 3,426 2,634 1,956 889 1,799 10,704 3,963 14,667 11,836 567 669 1,236 758 15,903 19861987 3,546 2,647 1,999 1,321 1,403 10,916 4,044 14,960 12,071 457 617 1,074 633 16,034 19871988 3,659 2,657 1,863 1,436 1,647 11,262 3,929 15,191 12,385 478 575 1,053 642 16,244 19881989 3,799 2,557 1,995 1,387 1,790 11,528 4,032 15,560 12,680 514 547 1,061 670 16,621 19891990 4,070 2,897 2,013 1,594 1,898 12,472 4,023 16,495 13,621 552 521 1,073 701 17,568 19901991 3,951 2,956 2,217 1,586 1,896 12,606 3,926 16,532 13,728 644 459 1,103 775 17,635 19911992 4,256 2,990 2,165 1,706 1,951 13,068 4,385 17,453 14,321 683 496 1,179 825 18,632 19921993 4,126 3,102 2,199 1,578 1,945 12,950 3,453 16,403 13,937 701 467 1,168 834 17,571 19931994 4,443 2,996 2,262 1,680 1,793 13,174 2,823 15,997 13,981 755 474 1,229 890 17,226 19941995 3,280 2,957 2,250 1,723 1,815 12,025 2,882 14,907 12,848 857 509 1,366 1,002 16,273 19951996 3,342 2,826 2,177 1,954 2,036 12,335 2,179 14,514 12,958 904 511 1,415 1,050 15,929 19961997 3,409 2,753 2,237 1,851 1,973 12,223 1,931 14,154 12,775 1,033 635 1,668 1,214 15,822 19971998 3,066 2,901 2,270 1,936 1,960 12,133 1,909 14,042 12,678 1,004 619 1,623 1,181 15,665 1998 1999 3,134 2,873 2,239 1,888 1,956 12,090 2,107 14,197 12,692 992 616 1,608 1,168 15,805 1999 2000 3,287 2,910 2,224 1,840 1,978 12,239 1,932 14,171 12,791 1,021 638 1,659 1,203 15,830 2000 2001 3,179 3,018 2,251 1,873 1,916 12,237 2,057 14,294 12,825 1,050 637 1,687 1,232 15,981 2001 2002 3,077 3,174 2,401 1,857 2,053 12,562 2,156 14,718 13,178 1,090 753 1,843 1,305 16,561~ 2002
^ Full-time equivalent (FTE) enrolment is computed as full-time enrolment + (part-time enrolment/3.5).
* Beginning in 1996, work-term students are included as full-time. ~ Does not include 170 (medical interns and residents), for a total enrolment of 16,731.

Memorial University of Newfoundland Fact Book 2002 9
Table 2 Fall Semester Enrolment by Campus — 1993 to 2002
(End of regular registration period)
2002 2001 2000 1999 1998 1997 1996 1995 1994 1993
UNDERGRADUATE ST. JOHN'S Full-time * 10,939 10,607 10,632 10,540 10,701 10,406 10,772 10,322 11,321 11,143
Part-time St. John's 1,093 1,071 1,009 1,121 1,024 1,107 1,401 1,913 1,957 2,459 Off-campus 1,001 907 858 922 831 754 675 821 720 806Total part-time 2,094 1,978 1,867 2,043 1,855 1,861 2,076 2,734 2,677 3,265
Total St. John's 13,033 12,585 12,499 12,583 12,556 12,267 12,848 13,056 13,998 14,408
SIR WILFRED GRENFELL COLLEGE Full-time 987 1,010 1,006 958 975 1,038 1,032 1,000 1,102 1,126Part-time 51 66 54 56 44 52 83 98 102 109
Total SWGC 1,038 1,076 1,060 1,014 1,019 1,090 1,115 1,098 1,204 1,235
Regional Colleges ^ 0 0 0 0 0 380 382 753 795 760
Centre for Nursing Studies/ Western Regional
647 633 612 600 467 329 169 - - -
Total Undergraduate 14,718 14,294 14,171 14,197 14,042 14,154 14,514 14,907 15,997 16,403
GRADUATE
Full-time 1,090 1,050 1,021 992 1,004 1,033 904 857 755 701 Part-time 753 637 638 616 619 635 511 509 474 467Total Graduate 1,843 1,687 1,659 1,608 1,623 1,668 1,415 1,366 1,229 1,168
Grand Total 16,561~ 15,981 15,830 15,805 15,665 15,822 15,929 16,273 17,226 17,571 * Beginning in 1996, work-term students are included as full-time. ~ Does not include post-graduate enrolment of 170 (medical interns and residents), for a total enrolment of 16,731. ^ Program discontinued as of August 31, 1998.
10 Memorial University of Newfoundland Fact Book 2002
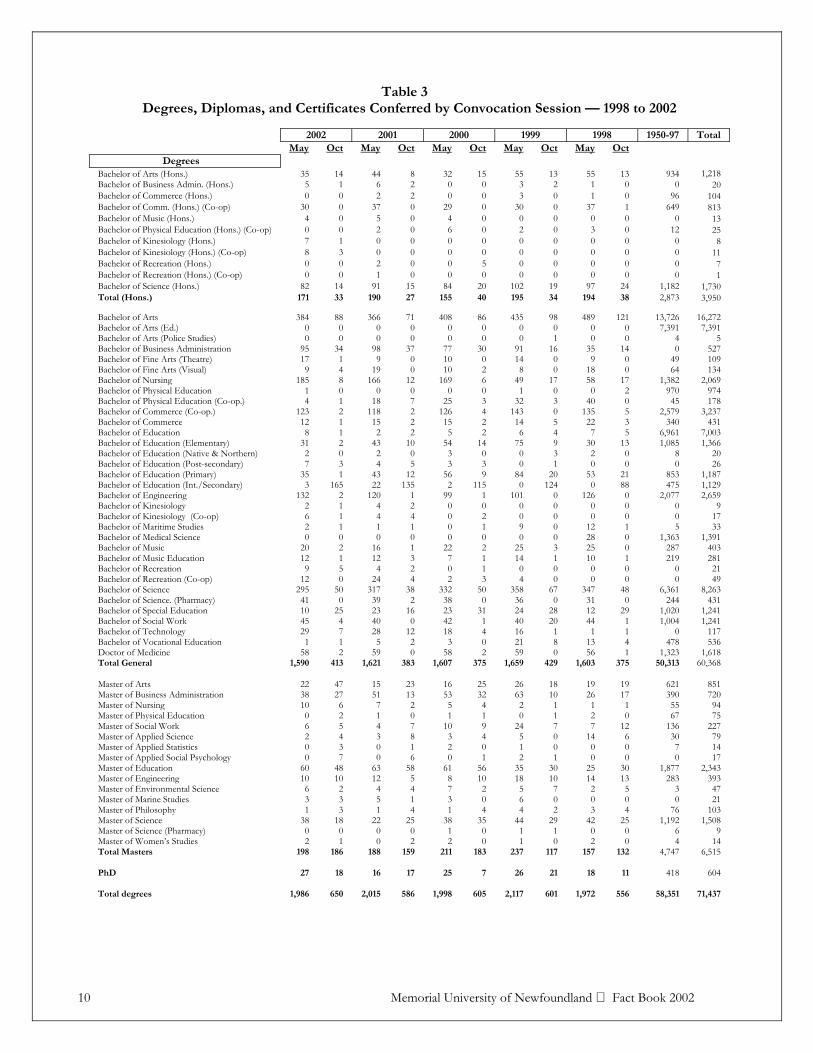
Table 3 Degrees, Diplomas, and Certificates Conferred by Convocation Session — 1998 to 2002
2002 2001 2000 1999 1998 1950-97 Total
May Oct May Oct May Oct May Oct May Oct Degrees
Bachelor of Arts (Hons.) 35 14 44 8 32 15 55 13 55 13 934 1,218 Bachelor of Business Admin. (Hons.) 5 1 6 2 0 0 3 2 1 0 0 20 Bachelor of Commerce (Hons.) 0 0 2 2 0 0 3 0 1 0 96 104 Bachelor of Comm. (Hons.) (Co-op) 30 0 37 0 29 0 30 0 37 1 649 813 Bachelor of Music (Hons.) 4 0 5 0 4 0 0 0 0 0 0 13 Bachelor of Physical Education (Hons.) (Co-op) 0 0 2 0 6 0 2 0 3 0 12 25 Bachelor of Kinesiology (Hons.) 7 1 0 0 0 0 0 0 0 0 0 8 Bachelor of Kinesiology (Hons.) (Co-op) 8 3 0 0 0 0 0 0 0 0 0 11 Bachelor of Recreation (Hons.) 0 0 2 0 0 5 0 0 0 0 0 7 Bachelor of Recreation (Hons.) (Co-op) 0 0 1 0 0 0 0 0 0 0 0 1 Bachelor of Science (Hons.) 82 14 91 15 84 20 102 19 97 24 1,182 1,730 Total (Hons.) 171 33 190 27 155 40 195 34 194 38 2,873 3,950 Bachelor of Arts 384 88 366 71 408 86 435 98 489 121 13,726 16,272 Bachelor of Arts (Ed.) 0 0 0 0 0 0 0 0 0 0 7,391 7,391 Bachelor of Arts (Police Studies) 0 0 0 0 0 0 0 1 0 0 4 5 Bachelor of Business Administration 95 34 98 37 77 30 91 16 35 14 0 527 Bachelor of Fine Arts (Theatre) 17 1 9 0 10 0 14 0 9 0 49 109 Bachelor of Fine Arts (Visual) 9 4 19 0 10 2 8 0 18 0 64 134 Bachelor of Nursing 185 8 166 12 169 6 49 17 58 17 1,382 2,069 Bachelor of Physical Education 1 0 0 0 0 0 1 0 0 2 970 974 Bachelor of Physical Education (Co-op.) 4 1 18 7 25 3 32 3 40 0 45 178 Bachelor of Commerce (Co-op.) 123 2 118 2 126 4 143 0 135 5 2,579 3,237 Bachelor of Commerce 12 1 15 2 15 2 14 5 22 3 340 431 Bachelor of Education 8 1 2 2 5 2 6 4 7 5 6,961 7,003 Bachelor of Education (Elementary) 31 2 43 10 54 14 75 9 30 13 1,085 1,366 Bachelor of Education (Native & Northern) 2 0 2 0 3 0 0 3 2 0 8 20 Bachelor of Education (Post-secondary) 7 3 4 5 3 3 0 1 0 0 0 26 Bachelor of Education (Primary) 35 1 43 12 56 9 84 20 53 21 853 1,187 Bachelor of Education (Int./Secondary) 3 165 22 135 2 115 0 124 0 88 475 1,129 Bachelor of Engineering 132 2 120 1 99 1 101 0 126 0 2,077 2,659 Bachelor of Kinesiology 2 1 4 2 0 0 0 0 0 0 0 9 Bachelor of Kinesiology (Co-op) 6 1 4 4 0 2 0 0 0 0 0 17 Bachelor of Maritime Studies 2 1 1 1 0 1 9 0 12 1 5 33 Bachelor of Medical Science 0 0 0 0 0 0 0 0 28 0 1,363 1,391 Bachelor of Music 20 2 16 1 22 2 25 3 25 0 287 403 Bachelor of Music Education 12 1 12 3 7 1 14 1 10 1 219 281 Bachelor of Recreation 9 5 4 2 0 1 0 0 0 0 0 21 Bachelor of Recreation (Co-op) 12 0 24 4 2 3 4 0 0 0 0 49 Bachelor of Science 295 50 317 38 332 50 358 67 347 48 6,361 8,263 Bachelor of Science. (Pharmacy) 41 0 39 2 38 0 36 0 31 0 244 431 Bachelor of Special Education 10 25 23 16 23 31 24 28 12 29 1,020 1,241 Bachelor of Social Work 45 4 40 0 42 1 40 20 44 1 1,004 1,241 Bachelor of Technology 29 7 28 12 18 4 16 1 1 1 0 117 Bachelor of Vocational Education 1 1 5 2 3 0 21 8 13 4 478 536 Doctor of Medicine 58 2 59 0 58 2 59 0 56 1 1,323 1,618 Total General 1,590 413 1,621 383 1,607 375 1,659 429 1,603 375 50,313 60,368 Master of Arts 22 47 15 23 16 25 26 18 19 19 621 851 Master of Business Administration 38 27 51 13 53 32 63 10 26 17 390 720 Master of Nursing 10 6 7 2 5 4 2 1 1 1 55 94 Master of Physical Education 0 2 1 0 1 1 0 1 2 0 67 75 Master of Social Work 6 5 4 7 10 9 24 7 7 12 136 227 Master of Applied Science 2 4 3 8 3 4 5 0 14 6 30 79 Master of Applied Statistics 0 3 0 1 2 0 1 0 0 0 7 14 Master of Applied Social Psychology 0 7 0 6 0 1 2 1 0 0 0 17 Master of Education 60 48 63 58 61 56 35 30 25 30 1,877 2,343 Master of Engineering 10 10 12 5 8 10 18 10 14 13 283 393 Master of Environmental Science 6 2 4 4 7 2 5 7 2 5 3 47 Master of Marine Studies 3 3 5 1 3 0 6 0 0 0 0 21 Master of Philosophy 1 3 1 4 1 4 4 2 3 4 76 103 Master of Science 38 18 22 25 38 35 44 29 42 25 1,192 1,508 Master of Science (Pharmacy) 0 0 0 0 1 0 1 1 0 0 6 9 Master of Women’s Studies 2 1 0 2 2 0 1 0 2 0 4 14 Total Masters 198 186 188 159 211 183 237 117 157 132 4,747 6,515 PhD 27 18 16 17 25 7 26 21 18 11 418 604 Total degrees 1,986 650 2,015 586 1,998 605 2,117 601 1,972 556 58,351 71,437
Memorial University of Newfoundland Fact Book 2002 11
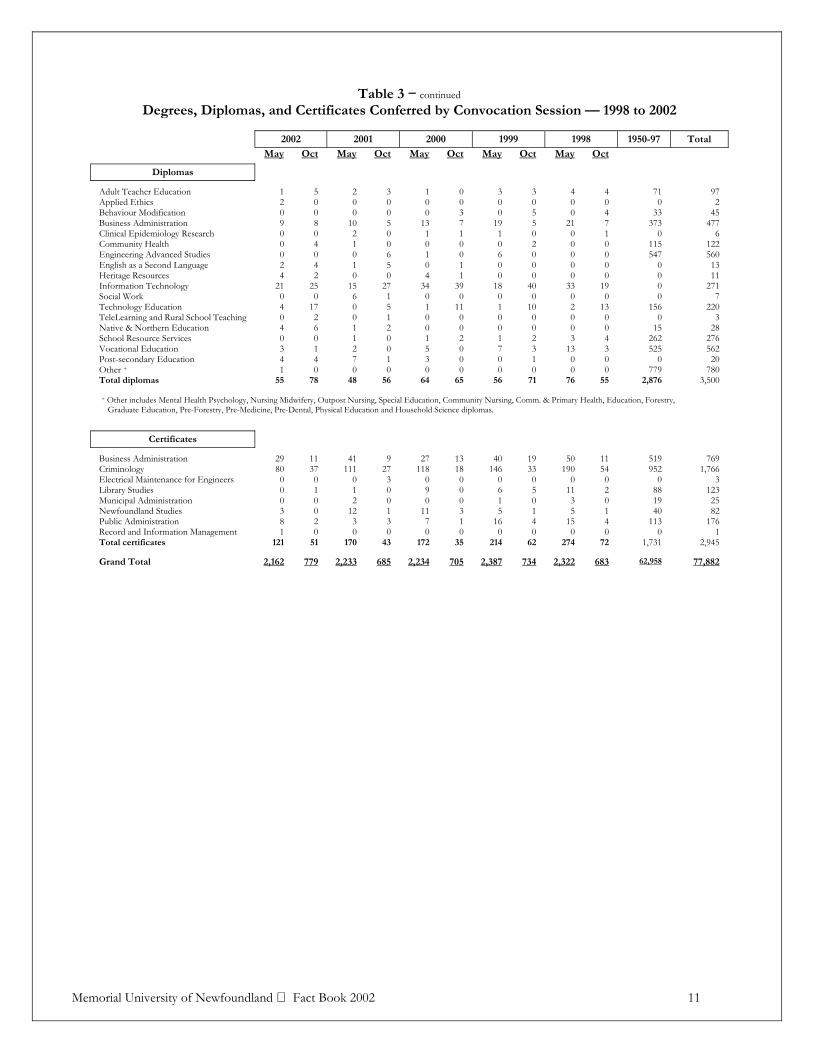
Table 3 − continued
Degrees, Diplomas, and Certificates Conferred by Convocation Session — 1998 to 2002
2002 2001 2000 1999 1998 1950-97 Total
May Oct May Oct May Oct May Oct May Oct
Diplomas
Adult Teacher Education 1 5 2 3 1 0 3 3 4 4 71 97 Applied Ethics 2 0 0 0 0 0 0 0 0 0 0 2 Behaviour Modification 0 0 0 0 0 3 0 5 0 4 33 45 Business Administration 9 8 10 5 13 7 19 5 21 7 373 477 Clinical Epidemiology Research 0 0 2 0 1 1 1 0 0 1 0 6 Community Health 0 4 1 0 0 0 0 2 0 0 115 122 Engineering Advanced Studies 0 0 0 6 1 0 6 0 0 0 547 560 English as a Second Language 2 4 1 5 0 1 0 0 0 0 0 13 Heritage Resources 4 2 0 0 4 1 0 0 0 0 0 11 Information Technology 21 25 15 27 34 39 18 40 33 19 0 271 Social Work 0 0 6 1 0 0 0 0 0 0 0 7 Technology Education 4 17 0 5 1 11 1 10 2 13 156 220 TeleLearning and Rural School Teaching 0 2 0 1 0 0 0 0 0 0 0 3 Native & Northern Education 4 6 1 2 0 0 0 0 0 0 15 28 School Resource Services 0 0 1 0 1 2 1 2 3 4 262 276 Vocational Education 3 1 2 0 5 0 7 3 13 3 525 562 Post-secondary Education 4 4 7 1 3 0 0 1 0 0 0 20 Other + 1 0 0 0 0 0 0 0 0 0 779 780 Total diplomas 55 78 48 56 64 65 56 71 76 55 2,876 3,500 + Other includes Mental Health Psychology, Nursing Midwifery, Outpost Nursing, Special Education, Community Nursing, Comm. & Primary Health, Education, Forestry, Graduate Education, Pre-Forestry, Pre-Medicine, Pre-Dental, Physical Education and Household Science diplomas.
Certificates
Business Administration 29 11 41 9 27 13 40 19 50 11 519 769 Criminology 80 37 111 27 118 18 146 33 190 54 952 1,766 Electrical Maintenance for Engineers 0 0 0 3 0 0 0 0 0 0 0 3 Library Studies 0 1 1 0 9 0 6 5 11 2 88 123 Municipal Administration 0 0 2 0 0 0 1 0 3 0 19 25 Newfoundland Studies 3 0 12 1 11 3 5 1 5 1 40 82 Public Administration 8 2 3 3 7 1 16 4 15 4 113 176 Record and Information Management 1 0 0 0 0 0 0 0 0 0 0 1 Total certificates 121 51 170 43 172 35 214 62 274 72 1,731 2,945 Grand Total 2,162 779 2,233 685 2,234 705 2,387 734 2,322 683 62,958 77,882

12 Memorial University of Newfoundland Fact Book 2002
Table 4 Degrees, Diplomas and Certificates Conferred by Faculty and School and Gender — 1998 to 2002
2002 2001 2000 1999 1998 M F M F M F M F M F
Degrees ARTS (see Table 4A for degrees by major) Bachelor of Arts 154 317 137 300 177 317 176 357 202 408 Bachelor of Arts (Hons.) 27 22 23 29 21 26 28 40 20 48 Bachelor of Arts (Police Studies) 0 0 0 0 0 0 1 0 0 0 Master of Arts 30 39 14 24 19 23 20 24 19 19 Master of Philosophy 3 1 2 3 3 2 2 4 3 4 Master of Women’s Studies 0 3 0 2 0 2 0 1 0 2 Sub-total 214 382 176 358 220 370 227 426 244 481
SCIENCE (see Table 4A for degrees by major) Bachelor of Science 158 186 148 207 173 207 211 214 198 197 Bachelor of Science (Hons.) 39 57 51 55 46 58 58 63 61 60 Master of Science 28 28 17 30 34 39 33 40 31 36 Master of Applied Science 5 1 5 6 5 2 5 0 14 6 Master of Applied Social Psychology 1 6 2 4 0 1 1 2 0 0 Master of Applied Statistics 1 2 1 0 2 0 1 0 0 0 Master of Environmental Science 2 6 5 3 3 6 6 6 3 4 Sub-total 234 286 229 305 263 313 315 325 307 303
BUSINESS ADMINISTRATION Bachelor of Business Administration 62 67 61 74 48 59 60 47 28 21 Bachelor of Business Administration (Hons.) 3 3 3 5 0 0 2 3 0 1 Bachelor of Commerce 7 6 10 7 9 8 9 10 17 8 Bachelor of Commerce (Hons.) 0 0 2 2 0 0 2 1 1 0 Bachelor of Commerce (Co-op) 52 73 57 63 59 71 69 74 72 68 Bachelor of Commerce (Hons.)(Co-op) 10 20 14 23 3 26 13 17 19 19 Master of Business Administration 29 36 30 34 43 42 33 40 21 22 Sub-total 163 205 177 208 162 206 188 192 158 138
EDUCATION Bachelor of Education 5 4 0 4 3 4 5 5 7 5 Bachelor of Vocational Education 1 1 2 5 1 2 10 19 3 14 Bachelor of Special Education 4 31 3 36 0 54 4 48 5 36 Bachelor of Education (Elementary) 7 26 6 47 15 53 12 72 5 38 Bachelor of Education (Native & Northern) 1 1 0 2 0 3 1 2 0 2 Bachelor of Education. (Post-secondary) 3 7 3 6 2 4 0 1 0 0 Bachelor of Education (Primary) 0 36 2 53 3 62 8 96 5 69 Bachelor of Education (Int./Secondary) 66 102 70 87 55 62 43 81 46 42 Master of Education 43 65 49 72 46 72 25 40 17 38 Bachelor of Music Education 3 10 1 14 1 7 3 12 4 7 Sub-total 133 283 136 326 126 323 111 376 92 251
ENGINEERING (see Table 4A for degrees by major) Bachelor of Engineering 104 30 102 19 80 20 77 24 107 19 Master of Engineering 19 1 14 3 16 2 22 6 24 3
FINE ARTS Bachelor of Fine Arts (Theatre) 6 12 3 6 6 4 7 7 3 6 Bachelor of Fine Arts (Visual) 6 7 13 6 7 5 7 1 9 9
MARINE INSTITUTE Bachelor of Maritime Studies 2 1 2 0 1 0 8 1 12 1 Bachelor of Technology 26 10 27 13 17 5 15 2 2 0 Master of Marine Studies 4 2 3 3 2 1 4 2 0 0 MEDICINE Bachelor of Medical Science 0 0 0 0 0 0 0 0 16 12 Doctor of Medicine 32 28 27 32 33 27 29 30 26 31
MUSIC Bachelor of Music 6 16 3 14 5 19 7 21 7 18 Bachelor of Music (Hons.) 2 2 0 5 1 3 0 0 0 0
NURSING Bachelor of Nursing 23 170 16 162 17 158 6 60 4 71 Master of Nursing 0 16 0 9 0 9 0 3 0 2

Memorial University of Newfoundland Fact Book 2002 13
Table 4 − continued Degrees, Diplomas and Certificates Conferred by Faculty and School and Gender — 1998 to 2002
2002 2001 2000 1999 1998 M F M F M F M F M F
Degrees continued
PHARMACY Bachelor of Science (Pharmacy) 15 26 14 27 22 16 21 15 13 18 Master of Science. (Pharmacy) 0 0 0 0 1 0 1 1 0 0 HUMAN KINETICS & RECREATION Bachelor of Physical Education 1 0 0 0 0 0 1 0 2 0 Bachelor of Physical Education (Co-op) 4 1 14 11 19 9 21 14 26 14 Bachelor of Physical Education (Hons.)(Co-op) 0 0 2 0 5 1 1 1 1 2 Bachelor of Kinesiology 2 1 1 5 0 0 0 0 0 0 Bachelor of Kinesiology (Co-op) 4 3 2 6 2 0 0 0 0 0 Bachelor of Kinesiology (Hons.) 1 7 0 0 0 0 0 0 0 0 Bachelor of Kinesiology (Co-op) (Hons.) 1 10 0 0 0 0 0 0 0 0 Bachelor of Recreation 11 3 4 2 1 0 0 0 0 0 Bachelor of Recreation (Co-op) 10 2 20 8 3 2 3 1 0 0 Bachelor of Recreation (Hons.) 0 0 0 2 0 0 0 0 0 0 Bachelor of Recreation (Hons.)(Co-op) 0 0 0 1 1 4 0 0 0 0 Master of Physical Education 2 0 0 1 1 1 0 1 1 1 Sub-total 36 27 43 36 32 17 26 17 30 17 SOCIAL WORK Bachelor of Social Work 4 45 9 31 7 36 8 52 8 37 Master of Social Work 3 8 1 10 2 17 5 26 1 18 PhD Arts 4 5 1 7 1 3 5 3 1 2 Engineering 9 0 5 1 4 0 8 0 5 2 Medicine 3 4 3 0 0 2 2 0 1 0 Science 16 2 11 5 16 4 24 4 14 4 Social Work 0 2 0 0 0 2 0 1 0 0 Sub-Total 32 13 20 13 21 11 39 8 21 8 Total degrees 1,064 1,570 1,015 1,586 1,041 1,562 1,123 1,595 1,084 1,444
Diplomas Adult Teacher Education 2 4 1 4 0 1 2 4 3 5 Applied Ethics 1 1 0 0 0 0 0 0 0 0 Behaviour Modification 0 0 0 0 1 2 0 5 0 4 Business Administration 5 12 7 8 7 13 13 11 21 7 Clinical Epidemiology Research 0 0 2 0 1 1 1 0 0 1 Community Health 0 4 0 1 0 0 1 1 0 0 Community and Public Health 0 1 0 0 0 0 0 0 0 0 Engineering Adv. Studies 0 0 6 0 1 0 6 0 0 0 English as a Second Language 0 6 1 5 0 1 0 0 0 0 Heritage Resources 2 4 0 0 4 1 0 0 0 0 Information Technology 29 17 27 15 42 31 28 30 26 26 Social Work 0 0 0 7 0 0 0 0 0 0 Technology Education 13 8 5 0 11 1 6 8 11 4 TeleLearning and Rural School Teaching 0 2 0 1 0 0 0 0 0 0 Native & Northern 2 8 0 3 0 0 0 0 0 0 School Resource Services 0 0 0 1 0 3 1 2 0 7 Vocational Education 0 4 1 1 0 5 2 5 7 9 Post-secondary Education 2 6 5 3 1 2 0 1 0 0 Total diplomas 56 77 55 49 68 61 60 67 68 63
Certificates
Business Administration 15 25 14 36 17 23 20 39 14 47 Criminology 27 90 32 106 23 113 39 140 71 173 Electrical Maintenance for Engineers 0 0 3 0 0 0 0 0 0 0 Library Studies 0 1 1 0 1 8 5 6 1 12 Municipal Administration 0 0 0 2 0 0 0 1 2 1 Newfoundland Studies 1 2 1 12 6 8 1 5 4 2 Public Administration 5 5 4 2 5 3 10 10 11 8 Records and Information Management 0 1 0 0 0 0 0 0 0 0 Total certificates 48 124 55 158 52 155 75 201 103 243 Grand total 1,168 1,771 1,125 1,793 1,161 1,778 1,258 1,863 1,255 1,750

14 Memorial University of Newfoundland Fact Book 2002
Table 4A Undergraduate Degrees Conferred by Major and Gender — 1998 to 2002
2002 2001 2000 1999 1998 M F M F M F M F M F
FACULTY OF ARTS Anthropology (Social & Cult.) 8 7 2 7 3 7 9 12 1 10 Anthropology (Archaeology) 7 17 11 9 5 13 4 8 10 10 Canadian Studies 1 1 0 2 0 1 0 1 1 1 Classical Studies 0 1 0 2 0 0 0 0 0 0 Classics 1 1 1 0 2 1 2 2 0 1 Cognitive Studies – SWGC 0 0 0 0 1 0 0 0 0 2 Computer Science 0 2 1 0 2 0 2 0 3 0 Drama & Music 0 1 0 0 0 1 0 1 0 0 Economics 5 6 4 8 10 6 10 7 23 10 Education – Elementary 0 0 0 0 0 0 0 0 0 1 English 35 72 31 63 39 69 33 70 33 75 Environmental Studies 2 3 2 7 8 3 0 0 0 0 Folklore 1 9 2 9 4 3 3 9 1 7 French 4 13 0 27 2 30 7 36 4 41 Spanish 0 0 0 0 0 1 0 1 0 0 Geography 1 3 6 2 9 2 11 2 13 9 German 5 3 2 3 1 4 0 2 3 3 Greek & Roman Studies 2 1 1 2 0 4 0 0 0 0 Russian (Lang. & Literature) 2 3 2 1 3 1 3 1 2 2 History 25 21 28 17 33 15 32 31 31 32 Humanities 0 0 3 0 0 0 0 0 0 0 Linguistics 2 20 3 10 1 16 1 17 0 17 Mathematics 1 0 0 0 0 0 0 0 0 0 Mathematics (Pure) 0 1 0 0 0 0 3 0 1 1 Statistics 0 0 0 0 0 0 0 0 0 1 Philosophy 13 6 8 6 6 6 11 2 7 6 Political Science 23 16 18 17 25 18 22 9 28 25 Psychology 12 46 4 45 6 45 8 55 11 58 Religious Studies 7 11 6 11 7 5 9 12 8 14 Sociology 20 64 22 73 23 80 33 103 38 115 Social and Cultural Studies 0 2 0 0 0 0 0 0 0 0 Sociology & Anthropology 4 9 3 8 8 10 2 15 4 13 Visual Arts 1 0 1 1 3 3 0 0 0 0 Not applicable 3 11 1 5 4 2 0 0 0 0 Sub-total 185 350 162 335 205 346 205 396 222 454
FACULTY OF ENGINEERING Civil 11 6 10 4 16 1 22 6 24 5 Computer and Communication 19 1 1 0 0 0 0 0 0 0 Electrical 26 7 39 11 30 7 22 7 43 3 Mechanical 35 14 38 2 28 9 22 5 33 9 Ocean & Naval Architecture 13 2 14 2 6 3 11 6 7 2 Sub-total 104 30 102 19 80 20 77 24 107 19
FACULTY OF SCIENCE Biochemistry 8 12 14 16 23 14 19 16 14 16 Biochemistry (Dietetics) 1 9 0 7 1 5 1 10 2 7 Biochemistry (Nutrition) 13 25 6 28 13 29 12 32 11 36 Biology 40 69 38 68 45 83 52 110 53 85 Biology (Cell/Microbiology) 0 0 0 1 2 0 1 0 0 2 Biology (Marine & Entom./Paras) 0 0 0 0 1 2 0 0 2 1 Chemistry 11 12 12 12 10 7 6 10 8 7 Computer Science 42 6 35 15 35 7 47 10 36 4 Computer Science (Software Engr.) 2 0 1 0 2 0 2 0 1 0 Earth Science 13 16 29 22 26 12 20 12 22 5 Earth Science (Geology) 0 0 0 0 0 0 0 0 6 4 Economics 3 3 3 1 3 2 1 2 0 0 Environmental Science (Biol.) 8 4 6 9 7 13 9 6 15 8 Environmental Science (Chem.) 3 2 1 2 3 5 5 1 7 6 Geography 17 11 18 9 14 10 35 17 24 16 Mathematics 0 0 0 0 0 0 1 0 0 0 Mathematics (Applied) 2 5 4 11 6 6 13 6 11 7 Mathematics (Pure) 7 9 7 10 5 5 11 6 13 11 Physics 8 2 4 3 9 1 15 2 16 4 Psychology 16 46 12 40 10 52 15 35 15 33 Behavioural Neuroscience 3 11 3 6 3 12 1 2 1 5 Statistics 0 1 6 2 1 1 3 0 2 0 Not applicable 0 0 0 0 1 2 0 0 0 0 Sub-total 197 243 199 262 220 268 269 277 259 257 Total 486 623 463 616 505 634 551 697 588 730

Memorial University of Newfoundland Fact Book 2002 15
(End of regular registration period)
49 54 59 64 69 74 79 84 89 94 99 '00 '01 '020
5,000
10,000
15,000
20,000
Degrees, Diplomas and Certificates Conferred1992 - 2002
92 93 94 95 96 97 98 99 '00 01 020
500
1,000
1,500
2,000
2,500
Undergraduate Graduate Dip./Cert.
Undergraduate and Graduate EnrolmentFull- and part-time

16 Memorial University of Newfoundland Fact Book 2002
Table 5A Student Enrolment by Faculty and School — Fall Semester
(End of drop period)
Faculty and School 2002 2001 2000 1999 1998
Undergraduate Students Total
Arts 3,979 3,842 3,733 3,766 3,642 Business Administration 906 928 972 962 1,007 Continuing Education 319 318 313 342 261 Education 960 764 709 662 745 Engineering & Applied Science 1,129 1,101 1,180 1,120 1,008 Fine Arts 158 157 160 148 138 Marine Institute 249 190 203 200 175 Medicine 236 247 243 244 243 Music 146 147 138 149 150 Nursing 910 890 869 876 784 Pharmacy 106 109 113 114 116 Human Kinetics & Recreation 311 281 281 272 215 Science 2,352 2,571 2,684 2,942 3,178 SWGC – Forestry 48 41 41 35 48 Social Work 123 129 129 130 147 Unspecified/Other 2,647 2,383 2,245 2,075 2,098 Sub-total 14,579 14,098 14,013 14,037 13,955
Graduate Students
Total Arts 315 330 314 281 289 Business Administration 162 173 176 211 220 Education 382 273 315 331 311 Engineering & Applied Science 154 137 122 120 106 Engineering and Science 0 0 0 1 6 Marine Institute 14 11 10 6 4 Medicine 135 140 115 96 91 Music 7 0 0 0 0 Nursing 69 54 57 55 49 Pharmacy 10 10 7 5 6 Human Kinetics & Recreation 37 26 9 8 8 Science 394 370 365 348 371 Social Work 58 62 49 60 86 Unspecified 15 7 22 0 2 Sub-total 1,752 1,593 1,561 1,522 1,549 Total 16,331 15,691 15,574 15,559 15,504
See notes at beginning of this section.

Memorial University of Newfoundland Fact Book 2002 17
Table 5B Student Enrolment by Faculty and School — Fall Semester
(End of drop period)
Faculty and School 2002 2001 2000 1999 1998
Undergraduate Students Full-time
Arts 3,486 3,384 3,276 3,285 3,204 Business Administration 795 823 872 874 925 Continuing Education 70 77 91 85 63 Education 794 593 541 482 567 Engineering & Applied Science 1,115 1,078 1,153 1,104 1,001 Fine Arts 155 152 154 143 134 Marine Institute 46 34 39 42 38 Medicine 235 246 241 243 243 Music 142 139 127 134 145 Nursing 841 821 799 790 663 Pharmacy 105 109 112 114 113 Human Kinetics & Recreation 297 268 269 266 204 Science 2,203 2,423 2,544 2,745 2,994 SWGC – Forestry 45 39 38 33 47 Social Work 108 109 110 111 120 Unspecified/Other 1,941 1,747 1,689 1,478 1,564 Sub-total 12,378 12,042 12,055 11,929 12,025
Graduate Students Full-time
Arts 277 287 275 257 260 Business Administration 64 74 72 100 102 Education 75 65 75 83 84 Engineering & Applied Science 105 90 84 82 76 Engineering and Science 0 0 0 0 1 Marine Institute 7 7 7 4 2 Medicine 83 84 68 65 58 Music 7 0 0 0 0 Nursing 11 14 11 9 15 Pharmacy 9 9 6 5 6 Human Kinetics & Recreation 22 18 7 8 5 Science 340 320 306 288 312 Social Work 29 30 23 34 36 Unspecified 1 0 0 0 2 Sub-total 1,030 998 934 935 959 Total 13,408 13,040 12,989 12,864 12,984
18 Memorial University of Newfoundland Fact Book 2002
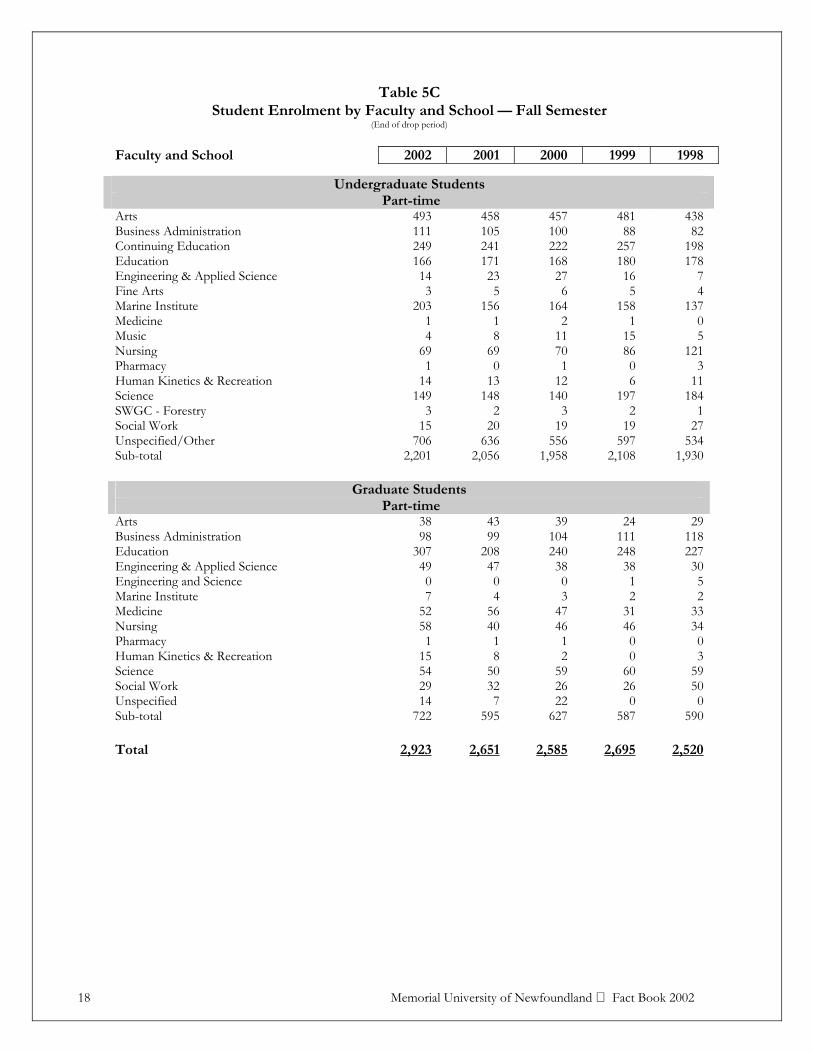
Table 5C Student Enrolment by Faculty and School — Fall Semester
(End of drop period)
Faculty and School 2002 2001 2000 1999 1998
Undergraduate Students Part-time
Arts 493 458 457 481 438 Business Administration 111 105 100 88 82 Continuing Education 249 241 222 257 198 Education 166 171 168 180 178 Engineering & Applied Science 14 23 27 16 7 Fine Arts 3 5 6 5 4 Marine Institute 203 156 164 158 137 Medicine 1 1 2 1 0 Music 4 8 11 15 5 Nursing 69 69 70 86 121 Pharmacy 1 0 1 0 3 Human Kinetics & Recreation 14 13 12 6 11 Science 149 148 140 197 184 SWGC - Forestry 3 2 3 2 1 Social Work 15 20 19 19 27 Unspecified/Other 706 636 556 597 534 Sub-total 2,201 2,056 1,958 2,108 1,930
Graduate Students
Part-time Arts 38 43 39 24 29 Business Administration 98 99 104 111 118 Education 307 208 240 248 227 Engineering & Applied Science 49 47 38 38 30 Engineering and Science 0 0 0 1 5 Marine Institute 7 4 3 2 2 Medicine 52 56 47 31 33 Nursing 58 40 46 46 34 Pharmacy 1 1 1 0 0 Human Kinetics & Recreation 15 8 2 0 3 Science 54 50 59 60 59 Social Work 29 32 26 26 50 Unspecified 14 7 22 0 0 Sub-total 722 595 627 587 590 Total 2,923 2,651 2,585 2,695 2,520

Memorial University of Newfoundland Fact Book 2002 19
Table 6A Total Enrolment by Age and Gender — Fall Semester
(End of drop period)
2002 2001 2000 Age M F Total M F Total M F Total
Full-time 16-18 719 1,276 1,995 768 1,304 2,072 785 1,421 2,206 19-20 1,480 2,639 4,119 1,466 2,530 3,996 1,441 2,403 3,844 21-23 1,703 2,615 4,318 1,640 2,523 4,163 1,704 2,487 4,191 24-25 495 713 1,208 494 603 1,097 518 561 1,079 26-30 452 564 1,016 457 543 1,000 435 538 973 >30 301 451 752 296 416 712 295 401 696 Sub-total 5,150 8,258 13,408 5,121 7,919 13,040 5,178 7,811 12,989
Part-time 16-18 7 9 16 11 12 23 16 12 28 19-20 47 79 126 51 92 143 53 77 130 21-23 140 167 107 114 167 281 117 161 278 24-25 91 153 244 78 146 224 108 136 244 26-30 249 390 639 228 321 549 182 337 519 >30 640 951 1,591 587 844 1,431 551 835 1,386 Sub-total 1,174 1,749 2,923 1,069 1,582 2,651 1,027 1,558 2,585 Total 6,324 10,007 16,331 6,190 9,501 15,691 6,205 9,369 15,574
See notes at beginning of this section.

20 Memorial University of Newfoundland Fact Book 2002
Table 6B Undergraduate Enrolment by Age and Gender — Fall Semester
(End of drop period)
2002 2001 2000
Age M F Total M F Total M F Total
Full-time 16-18 719 1,276 1,995 768 1,304 2,072 785 1,421 2,206 19-20 1,480 2,639 4,119 1,466 2,529 3,995 1,441 2,403 3,844 21-23 1,660 2,542 4,202 1,592 2,471 4,063 1,659 2,410 4,069 24-25 399 598 997 403 490 893 438 474 912 26-30 273 382 655 284 369 653 283 371 654 >30 136 274 410 132 234 366 130 240 370 Sub-total 4,667 7,711 12,378 4,645 7,397 12,042 4,736 7,319 12,055
Part-time 16-18 7 9 16 11 12 23 16 12 28 19-20 47 79 126 51 92 143 53 77 130 21-23 138 165 303 113 163 276 116 159 275 24-25 81 129 210 67 132 199 93 119 212 26-30 166 288 454 158 244 402 120 254 374 >30 403 689 1,092 380 633 1,013 354 585 939 Sub-total 842 1,359 2,201 780 1,276 2,056 752 1,206 1,958 Total 5,509 9,070 14,579 5,425 8,673 14,098 5,488 8,525 14,013
Memorial University of Newfoundland Fact Book 2002 21
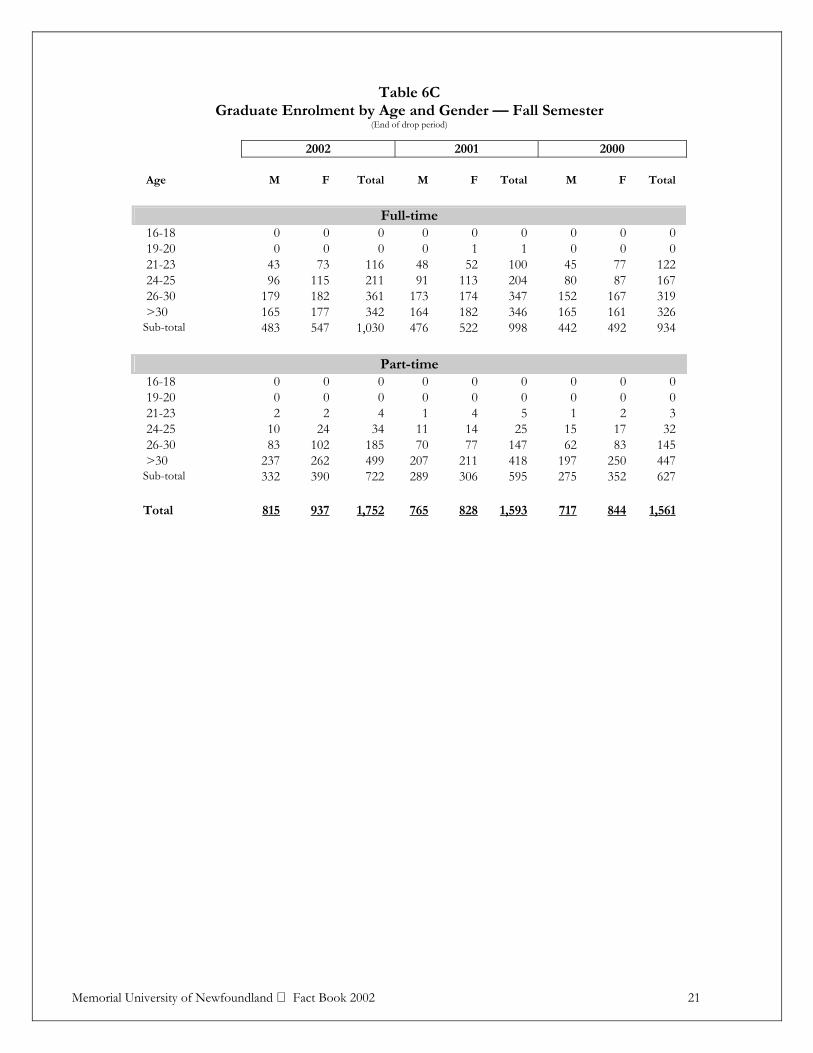
Table 6C Graduate Enrolment by Age and Gender — Fall Semester
(End of drop period)
2002 2001 2000 Age M F Total M F Total M F Total
Full-time 16-18 0 0 0 0 0 0 0 0 0 19-20 0 0 0 0 1 1 0 0 0 21-23 43 73 116 48 52 100 45 77 122 24-25 96 115 211 91 113 204 80 87 167 26-30 179 182 361 173 174 347 152 167 319 >30 165 177 342 164 182 346 165 161 326 Sub-total 483 547 1,030 476 522 998 442 492 934
Part-time 16-18 0 0 0 0 0 0 0 0 0 19-20 0 0 0 0 0 0 0 0 0 21-23 2 2 4 1 4 5 1 2 3 24-25 10 24 34 11 14 25 15 17 32 26-30 83 102 185 70 77 147 62 83 145 >30 237 262 499 207 211 418 197 250 447 Sub-total 332 390 722 289 306 595 275 352 627 Total 815 937 1,752 765 828 1,593 717 844 1,561
22 Memorial University of Newfoundland Fact Book 2002
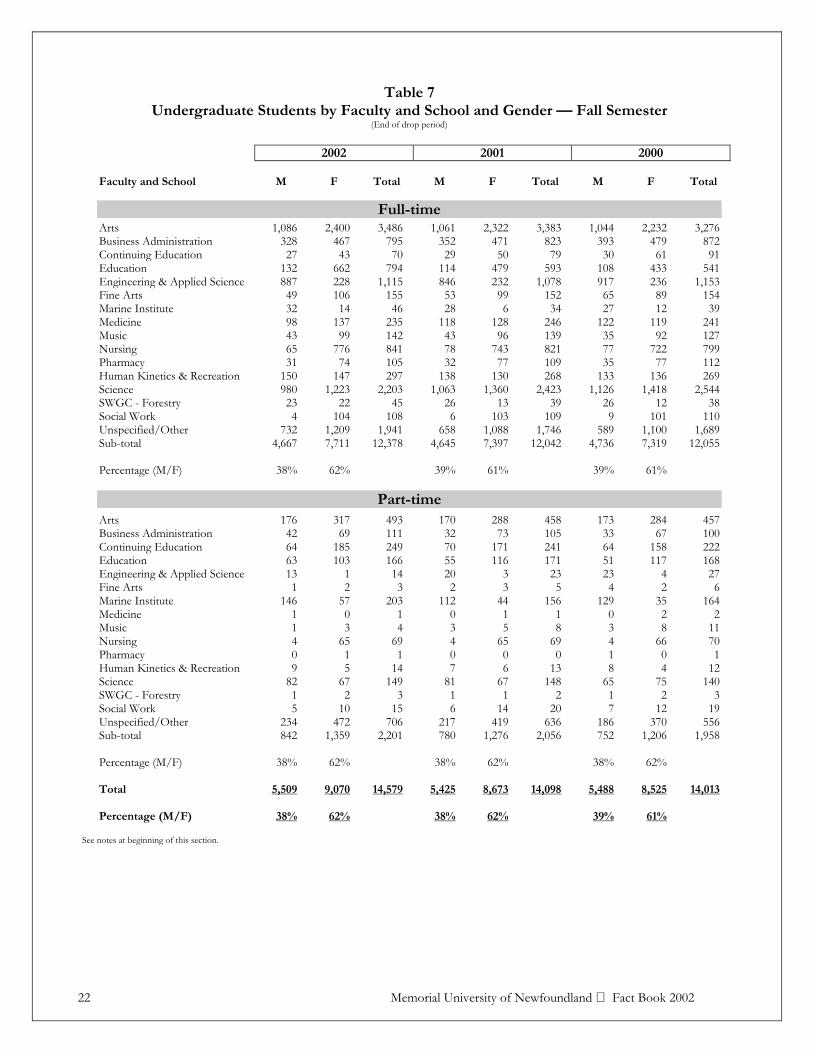
Table 7 Undergraduate Students by Faculty and School and Gender — Fall Semester
(End of drop period)
2002 2001 2000 Faculty and School M F Total M F Total M F Total
Full-time Arts 1,086 2,400 3,486 1,061 2,322 3,383 1,044 2,232 3,276 Business Administration 328 467 795 352 471 823 393 479 872 Continuing Education 27 43 70 29 50 79 30 61 91 Education 132 662 794 114 479 593 108 433 541 Engineering & Applied Science 887 228 1,115 846 232 1,078 917 236 1,153 Fine Arts 49 106 155 53 99 152 65 89 154 Marine Institute 32 14 46 28 6 34 27 12 39 Medicine 98 137 235 118 128 246 122 119 241 Music 43 99 142 43 96 139 35 92 127 Nursing 65 776 841 78 743 821 77 722 799 Pharmacy 31 74 105 32 77 109 35 77 112 Human Kinetics & Recreation 150 147 297 138 130 268 133 136 269 Science 980 1,223 2,203 1,063 1,360 2,423 1,126 1,418 2,544 SWGC - Forestry 23 22 45 26 13 39 26 12 38 Social Work 4 104 108 6 103 109 9 101 110 Unspecified/Other 732 1,209 1,941 658 1,088 1,746 589 1,100 1,689 Sub-total 4,667 7,711 12,378 4,645 7,397 12,042 4,736 7,319 12,055 Percentage (M/F) 38% 62% 39% 61% 39% 61%
Part-time Arts 176 317 493 170 288 458 173 284 457 Business Administration 42 69 111 32 73 105 33 67 100 Continuing Education 64 185 249 70 171 241 64 158 222 Education 63 103 166 55 116 171 51 117 168 Engineering & Applied Science 13 1 14 20 3 23 23 4 27 Fine Arts 1 2 3 2 3 5 4 2 6 Marine Institute 146 57 203 112 44 156 129 35 164 Medicine 1 0 1 0 1 1 0 2 2 Music 1 3 4 3 5 8 3 8 11 Nursing 4 65 69 4 65 69 4 66 70 Pharmacy 0 1 1 0 0 0 1 0 1 Human Kinetics & Recreation 9 5 14 7 6 13 8 4 12 Science 82 67 149 81 67 148 65 75 140 SWGC - Forestry 1 2 3 1 1 2 1 2 3 Social Work 5 10 15 6 14 20 7 12 19 Unspecified/Other 234 472 706 217 419 636 186 370 556 Sub-total 842 1,359 2,201 780 1,276 2,056 752 1,206 1,958 Percentage (M/F) 38% 62% 38% 62% 38% 62% Total 5,509 9,070 14,579 5,425 8,673 14,098 5,488 8,525 14,013 Percentage (M/F) 38% 62% 38% 62% 39% 61%
See notes at beginning of this section.

Memorial University of Newfoundland Fact Book 2002 23
Table 8 Graduate Students by Faculty and School and Gender — Fall Semester
(End of drop period)
2002 2001 2000 Faculty and School M F Total M F Total M F Total
Full-time
Arts 105 172 277 115 172 287 95 180 275 Business Administration 35 29 64 34 40 74 34 38 72 Education 24 51 75 19 46 65 29 46 75 Engineering & Applied Science 89 16 105 76 14 90 72 12 84 Marine Institute 4 3 7 4 3 7 4 3 7 Medicine 22 61 83 31 53 84 27 41 68 Music 4 3 7 0 0 0 0 0 0 Nursing 1 10 11 1 13 14 1 10 11 Pharmacy 4 5 9 5 4 9 2 4 6 Human Kinetics & Recreation 14 8 22 11 7 18 6 1 7 Science 172 168 340 172 148 320 166 140 306 Social Work 8 21 29 8 22 30 6 17 23 Unspecified 1 0 1 0 0 0 0 0 0 Sub-total 483 547 1,030 476 522 998 442 492 934
Part-time Arts 15 23 38 23 20 43 19 20 39 Business Administration 60 38 98 59 40 99 57 47 104 Education 140 167 307 101 107 208 107 133 240 Engineering & Applied Science 36 13 49 38 9 47 30 8 38 Engineering. & Science 0 0 0 0 0 0 0 0 0 Marine Institute 4 3 7 3 1 4 3 0 3 Medicine 22 30 52 18 38 56 16 31 47 Nursing 4 54 58 1 39 40 0 46 46 Pharmacy 0 1 1 0 1 1 0 1 1 Human Kinetics & Recreation 5 10 15 4 4 8 1 1 2 Science 32 22 54 33 17 50 32 27 59 Social Work 5 24 29 5 27 32 5 21 26 Unspecified 9 5 14 4 3 7 5 17 22 Sub-total 332 390 722 289 306 595 275 352 627
Total 815 937 1,752 765 828 1,593 717 844 1,561 See notes at beginning of this section.

24 Memorial University of Newfoundland Fact Book 2002
Table 9 Full-time Undergraduate Students by Major and Year — Fall 2002
(End of drop period)
Major * Y1 Y2 Y3 Y4 Y5 Total Anthropology 0 0 1 0 0 1 Anthropology – Archaeology 0 14 30 18 9 71 Anthropology – Social/Cultural 0 3 13 6 3 25 Behavioral Neuroscience 0 5 19 19 2 45 Biochemistry 0 20 32 40 6 98 Biochemistry – Dietetics 0 0 6 9 1 16 Biochemistry – Nutrition 0 10 24 28 13 75 Biology 0 31 74 64 27 196 Biology – Cell/Microbiology 0 0 0 0 3 3 Biology – Ecology/ Evolution. 0 0 0 1 0 1 Biology- Marine 0 0 0 2 0 2 Business Administration 9 127 168 237 250 791 Canadian Studies 0 2 1 0 0 3 Chemistry 0 10 23 4 3 40 Classics 0 2 1 0 1 4 Computer Science 3 30 50 56 19 158 Drama and Music 0 0 1 0 0 1 Earth Sciences 0 14 35 42 20 111 Economics 0 4 4 8 6 22 Economics Co-operative 0 2 3 1 0 6 Education – Adult Teacher 0 0 0 0 2 2 Education – Elementary 0 0 0 0 8 8 Education- Int/Sec Conjoint 4 1 1 1 12 19 Education – (Intermed/Secondary) 35 3 5 6 149 198 Education – Post-Secondary 1 0 0 1 1 3 Education- Post-sec. (first degree) 1 2 1 3 4 11 Education- Post-sec. (second degree) 0 1 0 1 1 3 Education – Primary/Elementary 0 0 150 156 214 520 Education – High School 0 0 1 0 0 1 Education – Secondary 0 0 1 0 0 1 Education – Special 0 0 0 0 22 22 Engineering 15 183 31 4 9 242 Engineering – Civil 0 2 27 24 60 113 Engineering – Computer 0 0 2 2 26 30 Engineering- Electrical/Computer 0 1 49 7 1 58 Engineering – Electrical 1 1 2 36 56 96 Engineering – Mechanical 0 0 68 62 110 240 Engineering – Ocean & Naval Arch. 3 2 19 10 26 60 Engineering – Term A/B ~ 196 68 10 1 1 276 English 3 57 106 103 33 302 English (SWGC) 13 15 18 13 2 61 Environmental Science – Biology 14 15 12 18 3 62 Environmental Science – Chemistry 5 6 5 8 1 25 Environmental Science 0 1 1 0 0 2 Environmental Studies 11 5 11 3 6 36 Folklore 0 5 11 5 1 22 Forestry 3 2 2 0 0 7 French 3 32 37 32 10 114 Geography 0 16 27 25 5 73 German 0 0 4 1 3 8 German Language & Literature 0 0 3 0 0 3 Greek & Roman Studies 0 1 3 1 1 6 Historical Studies 6 0 5 5 0 16 History 0 20 43 39 14 116 Humanities 0 0 1 0 0 1 Humanities (SWGC) 0 3 1 1 1 6 Kinesiology 23 18 29 35 12 117 Linguistics 0 1 13 8 2 24
Table continued on next page.

Memorial University of Newfoundland Fact Book 2002 25
Table 9 - continued Full-time Undergraduate Students by Major and Year — Fall 2002
(End of drop period)
Major * Y1 Y2 Y3 Y4 Y5 Total Mathematics – Applied 1 15 21 9 2 48 Mathematics – Pure 0 10 21 22 6 59 Medicine 21 31 28 2 153 235 Music 23 46 17 11 1 98 Music – Education 0 1 0 1 7 9 Music – History & Lit. 0 0 0 0 2 2 Music- Conjoint Degrees 0 0 2 13 11 26 Music – Performance 0 2 4 4 3 13 Music – Theory & Comp. 0 0 0 0 2 2 Nursing – Collaborative 71 159 195 151 239 815 Nursing- Fast Track 3 0 1 2 14 20 Nursing – Post RN 1 1 1 1 2 6 Pharmacy 0 0 24 25 56 105 Philosophy 1 4 5 5 1 16 Physical Education 1 1 2 3 4 11 Physical Education – Recreation 2 9 12 22 13 58 Physical Education – Teaching 8 40 28 17 18 111 Physics 0 3 16 11 11 41 Political Science 3 20 46 21 12 102 Pre-Biochemistry 39 20 2 0 1 62 Pre-Biochemistry (Dietetics) 3 7 2 0 0 12 Pre-Biochemistry (Nutrition) 3 2 1 2 1 9 Pre-Biology 63 42 13 3 4 125 Pre-Business Administration 205 139 72 25 5 446 Pre-Chemistry 12 11 4 0 1 28 Pre-Earth Science 8 10 2 0 0 20 Pre-Education (Elementary) 12 27 15 2 2 58 Pre-Education (Primary/Elementary) 213 184 43 2 4 446 Pre-Education (Primary) 20 53 29 3 2 107 Pre- Engineering 0 1 0 0 0 1 Pre-Pharmacy 87 91 15 2 2 197 Pre-Psychology 27 25 6 0 2 60 Pre-Social Work 55 92 29 5 1 182 Psychology 0 51 84 76 38 249 Psychology (SWGC) 19 42 31 28 7 127 Religious Studies 0 3 5 12 3 23 Russian Lang. & Literature 0 3 2 5 2 12 Social/Cultural Studies 0 4 3 3 0 10 Social Work (first degree) 0 0 26 20 58 104 Social Work (second degree) 0 1 0 0 3 4 Sociology 0 20 48 55 22 145 Sociology & Anthropology 0 1 10 9 1 21 Spanish 0 0 1 0 0 1 Statistics 0 0 0 4 1 5 Theatre 12 16 19 17 7 71 Visual Arts 19 20 19 18 13 89 Not applicable 45 34 10 6 10 105 Not specified 1,676 1,118 262 73 107 3,236
Other 30 18 6 7 12 73 Total 3,032 3,112 2,366 1,843 2,025 12,378
* First majors only for those in faculties (students can declare more than one major). ~ Engineering Term A/B and Pre- designations as indicated on students’ applications.
26 Memorial University of Newfoundland Fact Book 2002
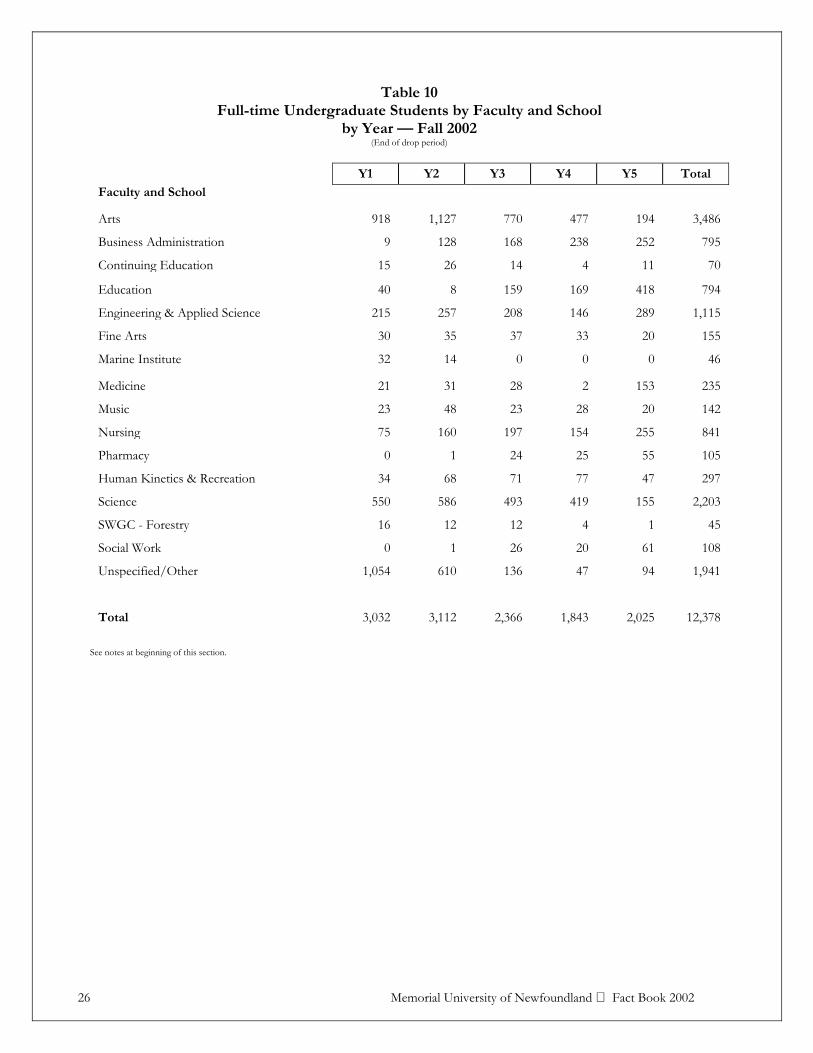
Table 10 Full-time Undergraduate Students by Faculty and School
by Year — Fall 2002 (End of drop period)
Y1 Y2 Y3 Y4 Y5 Total Faculty and School
Arts 918 1,127 770 477 194 3,486
Business Administration 9 128 168 238 252 795
Continuing Education 15 26 14 4 11 70
Education 40 8 159 169 418 794
Engineering & Applied Science 215 257 208 146 289 1,115
Fine Arts 30 35 37 33 20 155
Marine Institute 32 14 0 0 0 46
Medicine 21 31 28 2 153 235
Music 23 48 23 28 20 142
Nursing 75 160 197 154 255 841
Pharmacy 0 1 24 25 55 105
Human Kinetics & Recreation 34 68 71 77 47 297
Science 550 586 493 419 155 2,203
SWGC - Forestry 16 12 12 4 1 45
Social Work 0 1 26 20 61 108
Unspecified/Other 1,054 610 136 47 94 1,941
Total 3,032 3,112 2,366 1,843 2,025 12,378
See notes at beginning of this section.

Memorial University of Newfoundland Fact Book 2002 27
Table 11 Full-time Undergraduate Students by Faculty and School
Number of Credits Hours — Fall 2002 (End of drop period)
0 – 30 31 - 60 61 - 90 91 - 120 > 120 Total Faculty and School
Arts 1,636 864 575 337 74 3,486
Business Administration 86 95 205 324 85 795
Continuing Education 31 20 5 5 9 70
Education 44 60 201 171 318 794
Engineering & Applied Science 384 209 131 223 168 1,115
Fine Arts 55 31 24 36 9 155
Marine Institute 45 1 0 0 0 46
Medicine 24 51 5 17 138 235
Music 42 35 25 22 18 142
Nursing 164 175 182 178 142 841
Pharmacy 1 13 17 26 48 105
Human Kinetics & Recreation 77 65 66 71 18 297
Science 938 500 414 294 57 2,203
SWGC - Forestry 22 12 9 2 0 45
Social Work 1 20 12 24 51 108
Unspecified/Other 1,517 242 67 58 57 1,941
Total 5,067 2,393 1,938 1,788 1,192 12,378
See notes at beginning of this section.

28 Memorial University of Newfoundland Fact Book 2002
Table 12 Distribution of Enrolments by Postal Code — Fall Semester Labrador not to scale Full-time Undergraduate and Graduate
(End of drop period)
Postal Code Region 2002 2001 2000 1999
A0A St. John's Area #1 1,157 1,275 1,323 1,364 A0B St. John's Area #2 544 547 550 529 A1A-A1G St. John's 3,707 3,817 3,977 4,108 AIK Torbay 225 226 209 192 A1L Paradise 279 320 320 296 A1N Mount Pearl 1,052 1,033 1,053 1,032 A1S Goulds 204 205 204 219 A1W-A1X Conception Bay South 380 367 331 355 A1Y Carbonear 121 112 107 103 A0C Clarenville North 228 215 209 206 A0E Clarenville South 580 554 554 531 A0G Gander Area 556 552 559 542 A1V Gander 170 168 156 149 A0H Grand Falls Area 283 282 277 266 A2A Grand Falls 169 151 152 146 A2B Grand Falls-Windsor 40 36 38 19 A0J Springdale Area 114 113 104 98 A0K Deer Lake Area, Labrador
& Northern Pen. 506 545 610 583
A0N Stephenville Area 148 124 115 113 A2N Stephenville 118 119 102 99 A0L Corner Brook Area 171 170 165 162 A2H Corner Brook 650 659 673 650 A0M Channel/Port aux Basques 147 159 137 159 A0P Goose Bay 57 50 64 48 A2V Labrador City 96 109 90 83 A0R Churchill Falls-Wabush 27 30 25 23 All others 324 1,102 885 789 NL Student Subtotal 12,053 Intl. Student Subtotal 420 Other Canadian Subtotal 592 Unknown Subtotal 343 Total 13,408* 13,040 12,989 12,864
* Beginning in 2002, only Newfoundland students are portrayed by postal code distribution.

Memorial University of Newfoundland Fact Book 2002 29
Table 13 Full-time Undergraduate and Graduate Enrolment by Permanent Residence
Fall Semester (End of drop period)
2002 2001 2000
UG Grad Total UG Grad Total UG Grad Total
Nova Scotia 140 24 164 103 22 125 92 26 118
Prince Edward Island 24 7 31 19 9 28 17 10 27
New Brunswick 69 16 85 47 17 64 36 15 51
Quebec 20 10 30 14 6 20 14 7 21
Ontario 125 65 190 94 65 159 90 52 142
Manitoba 2 6 8 1 5 6 3 5 8
Saskatchewan 5 4 9 5 4 9 2 5 7
Alberta 19 13 32 28 13 41 20 9 29
British Columbia 28 14 42 28 16 44 22 12 34
Northwest Territories 1 0 1 1 3 4 2 1 3
Nunavut 0 0 0 2 0 2 2 0 2
Yukon 0 0 0 1 0 1 2 0 2
Out-of-province total 433 159 592 343 160 503 302 142 444
International Total * 178 242 420 109 210 319 123 203 326
Newfoundland Total 11,463 590 12,053 11,590 628 12,218 11,630 589 12,219
Unknown 304 39 343 - - - - - -
Grand Total 12,378 1,030 13,408 12,042 998 13,040 12,055 934 12,989
* See Table 13A

30 Memorial University of Newfoundland Fact Book 2002
Table 13A Full-time International Students — Fall Semester
2002 2001 2000
Citizenship UG GRAD Total UG GRAD Total UG GRAD Total Citizenship Argentina 0 2 2 0 0 0 0 0 0 ArgentinaAsia 1 0 1 0 0 0 0 0 0 Asia Australia 0 1 1 0 1 1 0 1 1 Australia Bahrain1 1 0 1 1 0 1 1 0 1 Bahrain Bangladesh 7 16 23 3 9 12 1 9 10 Bangladesh Belgium 2 1 3 0 1 1 0 0 0 Belgium Botswana 0 2 2 0 2 2 0 3 3 Botswana Brazil 1 3 4 1 3 4 1 4 5 Brazil Cambodia 0 0 0 0 2 2 0 2 2 Cambodia Cameroon 1 0 1 0 0 0 0 0 0 C`ameroon Central African Rep. 0 0 0 1 0 1 1 0 1 Central African Rep.Ceylon 0 3 3 0 1 1 0 0 0 Ceylon Chile 0 3 3 0 4 4 0 3 3 Chile China (People’s Republic of) 21 61 82 4 56 60 10 49 59 China (People’s Republic of) Colombia 2 1 3 1 0 1 0 0 0 Columbia Croatia 1 1 2 0 0 0 0 0 0 Croatia Czechoslovakia 0 1 1 0 1 1 0 1 1 Czechoslovakia Cyprus 1 1 2 0 1 1 0 0 0 Cyprus Denmark 5 0 5 0 0 0 3 0 3 Denmark Dominican Republic 1 0 1 1 0 1 1 0 1 Dominican RepublicEgypt 0 3 3 0 1 1 0 4 4 Egypt England 0 1 1 0 4 4 1 3 4 England Ethiopia 1 0 1 0 1 1 1 0 1 Ethiopia France 0 4 4 0 3 3 1 3 4 France Germany 4 2 6 2 2 4 2 2 4 Germany Ghana 2 0 2 5 1 6 3 1 4 Ghana Greece 1 3 4 1 3 4 1 1 2 Greece Guatemala 2 0 2 1 0 1 1 0 1 Guatemala Iceland 0 1 1 0 1 1 0 0 0 Iceland India 24 21 45 8 14 22 9 17 26 India Indonesia 0 6 6 0 9 9 0 11 11 Indonesia Iran 1 3 4 1 2 3 1 0 1 Iran Ireland 4 1 5 0 2 2 0 1 1 Ireland Israel 2 0 2 0 0 0 0 0 0 Israel Italy 1 2 3 2 1 3 1 2 3 Italy Jamaica 1 0 1 1 0 1 1 0 1 Jamaica Japan 2 1 3 0 1 1 0 1 1 Japan Jordan 0 6 6 1 4 5 1 5 6 Jordan Kenya 1 2 3 1 3 4 0 3 3 Kenya Kuwait 0 0 0 0 1 1 0 1 1 Kuwait Lebanon 0 0 0 1 0 1 1 0 1 Lebanon Libya 0 1 1 0 1 1 0 1 1 Libya Malawi 1 1 2 1 1 2 1 0 1 Malawi Malaysia 8 2 10 14 1 15 13 1 14 Malaysia Maldive Islands 0 1 1 0 0 0 0 0 0 Maldive Islands Mauritius 2 0 2 0 0 0 0 0 0 Mauritius Mexico 3 4 7 0 3 3 0 2 2 Mexico Myanmar 0 0 0 0 0 0 0 1 1 Myanmar Nepal 1 0 1 0 2 2 0 2 2 Nepal Netherlands 0 3 3 0 3 3 0 2 2 Netherlands New Zealand 0 2 2 0 2 2 0 1 1 New Zealand Nigeria 6 3 9 4 4 8 0 6 6 Nigeria North Korea 1 0 1 0 0 0 0 1 1 North Korea Norway 3 1 4 2 0 2 1 0 1 Norway Pakistan 7 3 10 3 2 5 4 2 6 Pakistan Palestine 0 4 4 0 2 2 0 0 0 Palestine Peru 0 2 2 0 1 1 0 1 1 Peru Philippines 0 1 1 0 0 0 0 1 1 Philippines Poland 0 2 2 0 1 1 0 1 1 Poland Portugal 1 3 4 1 2 3 1 0 1 Portugal Romania 0 0 0 0 2 2 0 2 2 Romania Saudi Arabia 0 0 0 0 1 1 0 1 1 Saudi Arabia Scotland 2 1 3 0 1 1 0 1 1 Scotland South Africa 1 0 1 0 0 0 0 0 0 South Africa South Korea 0 2 2 1 0 1 2 1 3 South Korea Spain 1 2 3 0 2 2 0 1 1 Spain Sri Lanka 1 11 12 1 10 11 1 13 14 Sri Lanka Sweden 6 0 6 2 0 2 3 0 3 Sweden Switzerland 1 0 1 1 1 2 1 1 2 Switzerland Syria 0 1 1 0 1 1 0 0 0 Syria Taiwan 0 1 1 0 0 0 1 0 1 Taiwan Tanzania 0 0 0 0 0 0 1 1 2 Tanzania Thailand 7 1 8 3 1 4 1 1 2 Thailand Tunisia 0 0 0 0 0 0 1 0 1 Tunisia Turkey 1 3 4 0 2 2 1 1 2 Turkey Ukraine 0 2 2 0 0 0 0 0 0 Ukraine United Kingdom 1 4 5 2 4 6 1 4 5 United Kingdom United States 31 25 56 37 23 60 46 25 71 United States USSR (former) 0 1 1 0 1 1 0 1 1 USSR (former) Vietnam (People’s Republic of) 0 1 1 0 0 0 0 0 0 Vietnam (People’s republic of)Yugoslavia 0 1 1 0 1 1 0 1 1 Yugoslavia Zimbabwe 0 0 0 1 0 1 1 0 1 Zimbabwe Unknown 3 1 4 0 0 0 1 0 1 Unknown Total 178 242 420 109 210 319 123 203 326 Total
Memorial University of Newfoundland Fact Book 2002 31
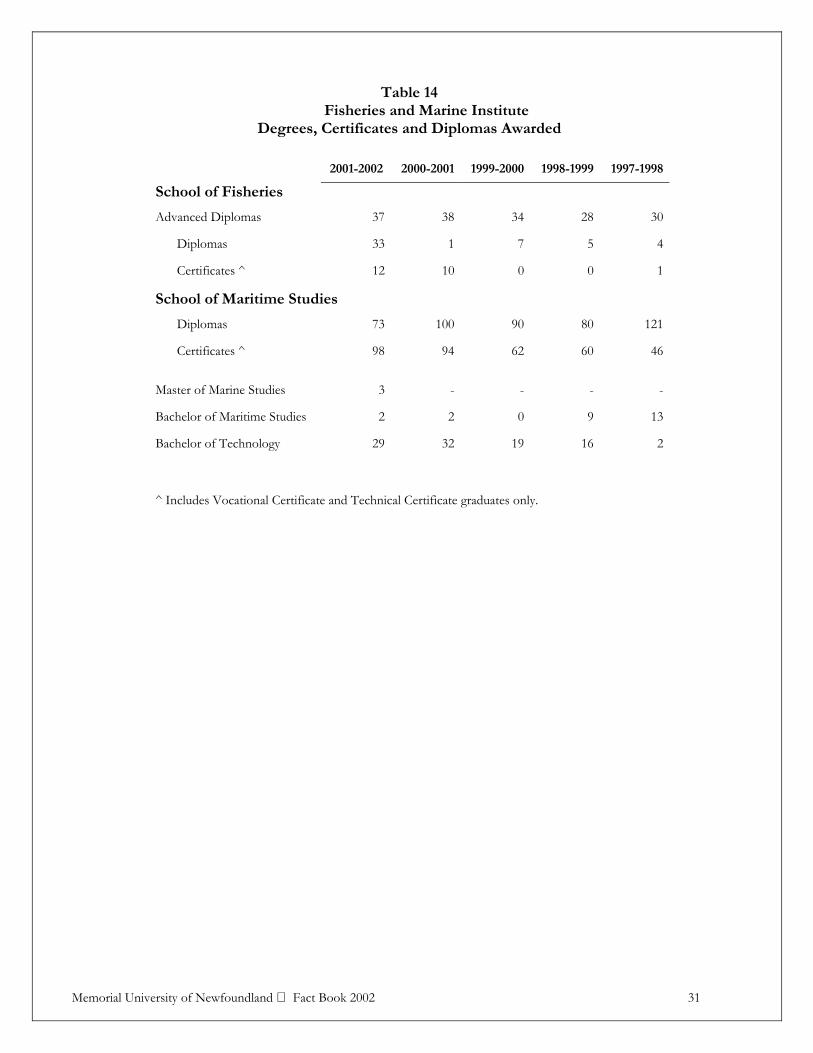
Table 14 Fisheries and Marine Institute
Degrees, Certificates and Diplomas Awarded
2001-2002 2000-2001 1999-2000 1998-1999 1997-1998
School of Fisheries
Advanced Diplomas 37 38 34 28 30
Diplomas 33 1 7 5 4
Certificates ^ 12 10 0 0 1
School of Maritime Studies
Diplomas 73 100 90 80 121
Certificates ^ 98 94 62 60 46
Master of Marine Studies 3 - - - -
Bachelor of Maritime Studies 2 2 0 9 13
Bachelor of Technology 29 32 19 16 2
^ Includes Vocational Certificate and Technical Certificate graduates only.
32 Memorial University of Newfoundland Fact Book 2002
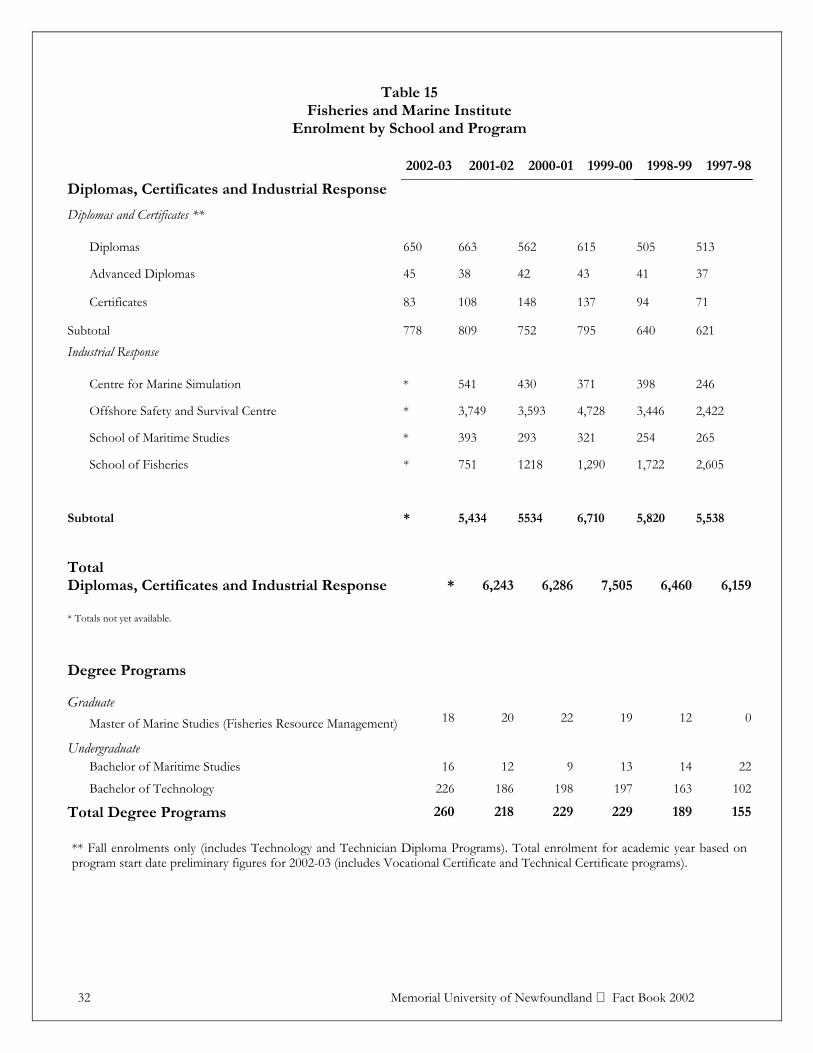
Table 15 Fisheries and Marine Institute
Enrolment by School and Program
2002-03 2001-02 2000-01 1999-00 1998-99 1997-98
Diplomas, Certificates and Industrial Response
Diplomas and Certificates **
Diplomas 650 663 562 615 505 513
Advanced Diplomas 45 38 42 43 41 37
Certificates 83 108 148 137 94 71
Subtotal 778 809 752 795 640 621
Industrial Response
Centre for Marine Simulation * 541 430 371 398 246
Offshore Safety and Survival Centre * 3,749 3,593 4,728 3,446 2,422
School of Maritime Studies * 393 293 321 254 265
School of Fisheries * 751 1218 1,290 1,722 2,605
Subtotal * 5,434 5534 6,710 5,820 5,538
Total Diplomas, Certificates and Industrial Response
* 6,243 6,286 7,505 6,460 6,159
* Totals not yet available.
Degree Programs
Graduate
Master of Marine Studies (Fisheries Resource Management) 18 20 22 19 12 0
Undergraduate Bachelor of Maritime Studies 16 12 9 13 14 22
Bachelor of Technology 226 186 198 197 163 102
Total Degree Programs 260 218 229 229 189 155 ** Fall enrolments only (includes Technology and Technician Diploma Programs). Total enrolment for academic year based on program start date preliminary figures for 2002-03 (includes Vocational Certificate and Technical Certificate programs).
Memorial University of Newfoundland Fact Book 2002 33
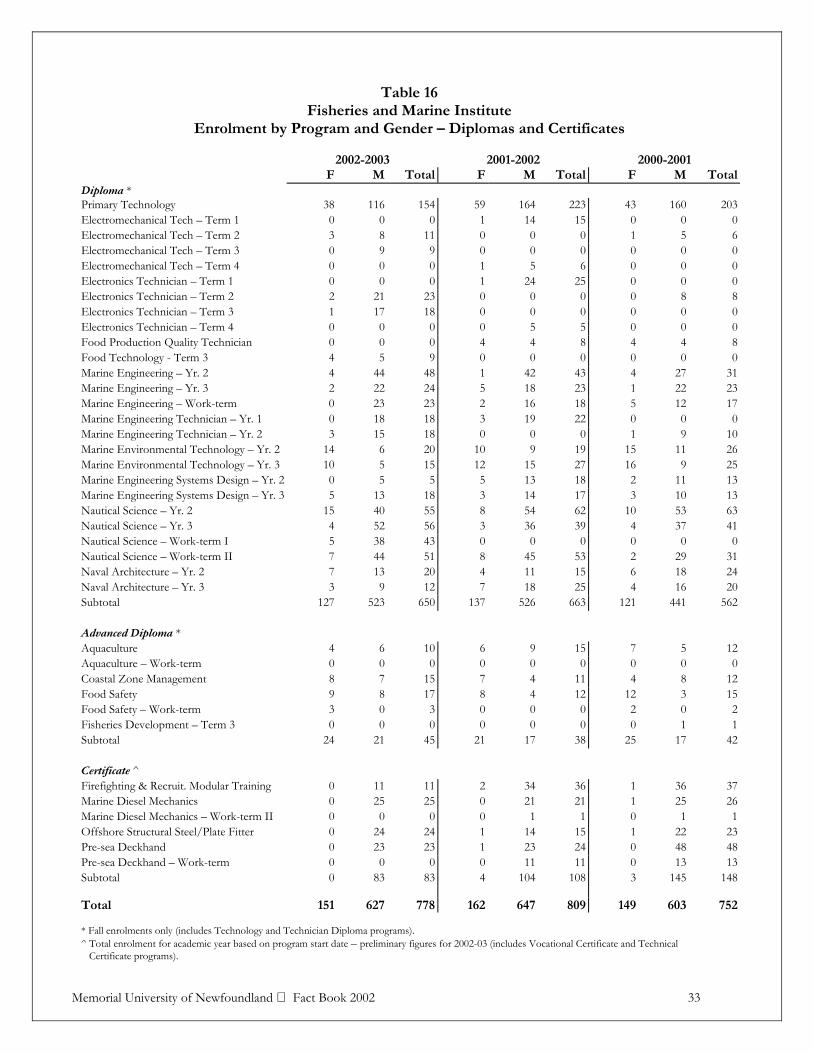
Table 16 Fisheries and Marine Institute
Enrolment by Program and Gender – Diplomas and Certificates
2002-2003
2001-2002
2000-2001
F M Total F M Total F M TotalDiploma * Primary Technology 38 116 154 59 164 223 43 160 203Electromechanical Tech – Term 1 0 0 0 1 14 15 0 0 0Electromechanical Tech – Term 2 3 8 11 0 0 0 1 5 6Electromechanical Tech – Term 3 0 9 9 0 0 0 0 0 0Electromechanical Tech – Term 4 0 0 0 1 5 6 0 0 0Electronics Technician – Term 1 0 0 0 1 24 25 0 0 0Electronics Technician – Term 2 2 21 23 0 0 0 0 8 8Electronics Technician – Term 3 1 17 18 0 0 0 0 0 0Electronics Technician – Term 4 0 0 0 0 5 5 0 0 0Food Production Quality Technician 0 0 0 4 4 8 4 4 8Food Technology - Term 3 4 5 9 0 0 0 0 0 0Marine Engineering – Yr. 2 4 44 48 1 42 43 4 27 31Marine Engineering – Yr. 3 2 22 24 5 18 23 1 22 23Marine Engineering – Work-term 0 23 23 2 16 18 5 12 17Marine Engineering Technician – Yr. 1 0 18 18 3 19 22 0 0 0Marine Engineering Technician – Yr. 2 3 15 18 0 0 0 1 9 10Marine Environmental Technology – Yr. 2 14 6 20 10 9 19 15 11 26Marine Environmental Technology – Yr. 3 10 5 15 12 15 27 16 9 25Marine Engineering Systems Design – Yr. 2 0 5 5 5 13 18 2 11 13Marine Engineering Systems Design – Yr. 3 5 13 18 3 14 17 3 10 13Nautical Science – Yr. 2 15 40 55 8 54 62 10 53 63Nautical Science – Yr. 3 4 52 56 3 36 39 4 37 41Nautical Science – Work-term I 5 38 43 0 0 0 0 0 0Nautical Science – Work-term II 7 44 51 8 45 53 2 29 31Naval Architecture – Yr. 2 7 13 20 4 11 15 6 18 24Naval Architecture – Yr. 3 3 9 12 7 18 25 4 16 20Subtotal 127 523 650 137 526 663 121 441 562
Advanced Diploma * Aquaculture 4 6 10 6 9 15 7 5 12Aquaculture – Work-term 0 0 0 0 0 0 0 0 0Coastal Zone Management 8 7 15 7 4 11 4 8 12Food Safety 9 8 17 8 4 12 12 3 15Food Safety – Work-term 3 0 3 0 0 0 2 0 2Fisheries Development – Term 3 0 0 0 0 0 0 0 1 1Subtotal 24 21 45 21 17 38 25 17 42
Certificate ^ Firefighting & Recruit. Modular Training 0 11 11 2 34 36 1 36 37Marine Diesel Mechanics 0 25 25 0 21 21 1 25 26Marine Diesel Mechanics – Work-term II 0 0 0 0 1 1 0 1 1Offshore Structural Steel/Plate Fitter 0 24 24 1 14 15 1 22 23Pre-sea Deckhand 0 23 23 1 23 24 0 48 48Pre-sea Deckhand – Work-term 0 0 0 0 11 11 0 13 13Subtotal 0 83 83 4 104 108 3 145 148
Total 151 627 778 162 647 809 149 603 752 * Fall enrolments only (includes Technology and Technician Diploma programs). ^ Total enrolment for academic year based on program start date – preliminary figures for 2002-03 (includes Vocational Certificate and Technical Certificate programs).
Memorial University of Newfoundland Fact Book 2002 35
Financial
Profile

Memorial University of Newfoundland Fact Book 2002 37
Financial Profile
Notes The figures for University Operations are extracted from the Consolidated Financial Statements and the Unaudited Supporting Schedules of the annual audited statements. * Effective April 1, 1997, the Canadian Institute of Chartered Accountants introduced five new handbook sections effecting university financial statement preparation and presentation. Departmental expenditures include the cost of fringe benefits, staff recruitment and staff settlement expenses. Note 1: The figures for Sir Wilfred Grenfell College include operating costs for physical plant. Note 2: Expenditures for Technical Services are netted against internal recoveries. Note 3: Faculty of Medicine includes the operating costs for physical plant and technical services. Note 4: Figures for the Marine Institute include costs for transportation, marine and operational building services.
Figures for general building services such as heat and light, and snow clearing, which are provided by the provincial Department of Works, Services and Transportation, are not included.
Note 5: During the 2000/01 year, the School of Continuing Education was divided into two distinct schools: the
Division of Distance Education and Learning Technologies and the Division of Lifelong Learning. Figures for the fiscal year 2000/01 have been updated from the Fact Book 2001 to reflect the change.
Figures may vary from audited financial statements due to restatement of prior years' figures if required.

38 Memorial University of Newfoundland Fact Book 2002
Operating Expenditures
1997-19981998-1999
1999-20002000-2001
2001-2002
Fiscal year
$0
$50
$100
$150
$200
$250M
illio
ns
Academic &Acad. Supp.
Facilities Mngmt.
Administrative Depts.
Comp. & Comm.
Library
Student Services75.8%
7.7%
7.5%
3.4%3.4%
2.3%
2001-2002

Memorial University of Newfoundland Fact Book 2002 39
Table 17A Total Expenditures by Faculty and School
Operations For the Five Year Period Ending 31 March 2002
Reflects gross departmental expenditures 2001/02 2000/01 1999/00 1998/99 1997/98
FACULTIES ($000)
Arts 21,214 19,405 18,765 18,801 18,436
Business Administration 6,055 5,781 5,628 5,843 4,956
Education 6,306 5,803 5,689 5,687 5,494
Engineering & Applied Science 6,765 6,378 6,113 6,115 5,956
Medicine 22,778 21,564 20,565 20,060 19,349 Note 3*
Science 28,473 26,412 26,009 25,914 25,984
SCHOOLS/DIVISIONS
Distance Education and Learning Tech. 3,298 3,027 4,700 4,424 3,835 Note 5*
Lifelong Learning 1,753 1,507 - - - Note 5*
Graduate Studies 3,338 2,948 2,892 2,963 3,015
Music 1,678 1,457 1,285 1,349 1,193
Nursing 2,848 2,449 2,215 2,231 2,100
Pharmacy 1,199 1,239 1,175 1,268 1,167
Human Kinetics & Recreation 2,328 2,111 1,931 1,748 1,758
Social Work 1,861 1,748 1,756 1,640 1,524
OTHER DIVISIONS
Sir Wilfred Grenfell College 12,468 11,013 10,748 10,266 9,794 Note 1*
Co-operative Education 693 682 640 651 719
Labrador Institute 148 223 238 269 232
Animal Care Unit 305 351 261 247 233
Fisheries & Marine Institute 20,595 18,938 17,484 15,960 15,462 Note 4*
Technical Services 2,331 2,465 1,922 2,058 2,111 Note 2*
SUPPORT SERVICES
Administrative Departments 14,488 12,569 11,708 11,337 11,566
Computing & Communications 7,688 7,904 7,903 7,354 8,262
Library 10,887 10,648 9,564 9,571 9,631
Student Services 4,424 4,624 4,143 4,171 4,267
Facilities Management 14,872 15,171 13,784 12,132 12,352
Total * 198,793 186,417 177,118 172,059 169,396
* See notes at beginning of this section.
40 Memorial University of Newfoundland Fact Book 2002
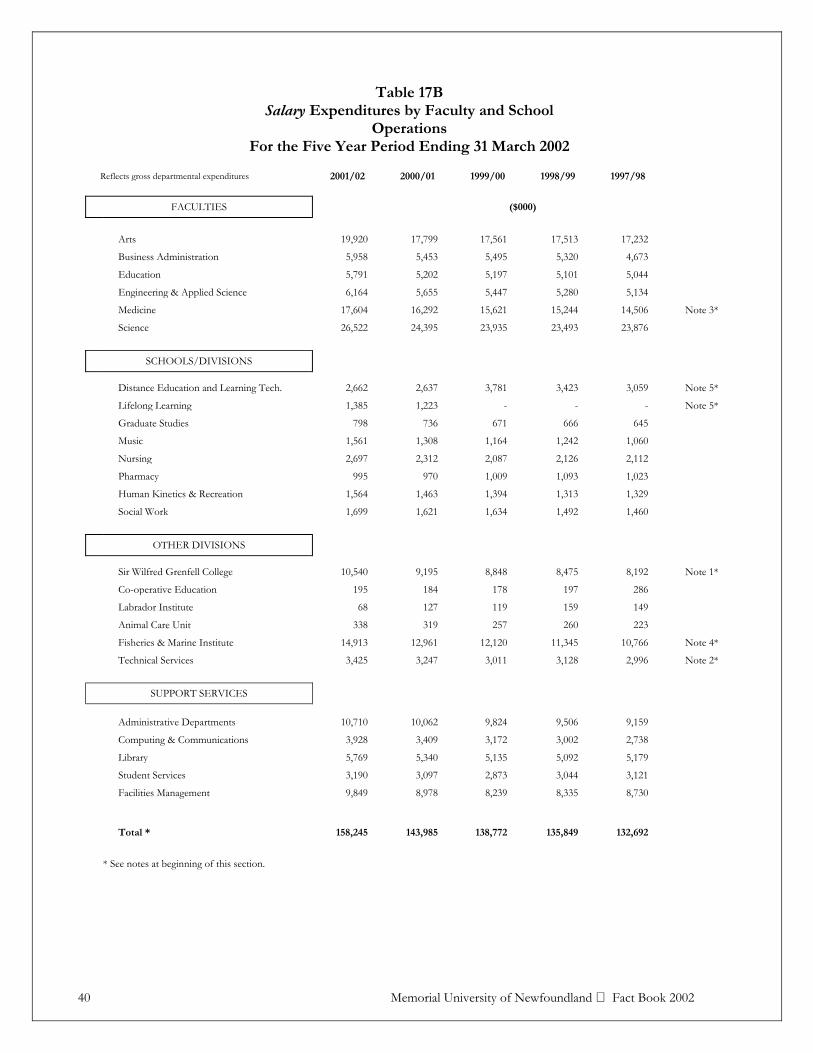
Table 17B Salary Expenditures by Faculty and School
Operations For the Five Year Period Ending 31 March 2002
Reflects gross departmental expenditures 2001/02 2000/01 1999/00 1998/99 1997/98
FACULTIES ($000)
Arts 19,920 17,799 17,561 17,513 17,232
Business Administration 5,958 5,453 5,495 5,320 4,673
Education 5,791 5,202 5,197 5,101 5,044
Engineering & Applied Science 6,164 5,655 5,447 5,280 5,134
Medicine 17,604 16,292 15,621 15,244 14,506 Note 3*
Science 26,522 24,395 23,935 23,493 23,876
SCHOOLS/DIVISIONS
Distance Education and Learning Tech. 2,662 2,637 3,781 3,423 3,059 Note 5*
Lifelong Learning 1,385 1,223 - - - Note 5*
Graduate Studies 798 736 671 666 645
Music 1,561 1,308 1,164 1,242 1,060
Nursing 2,697 2,312 2,087 2,126 2,112
Pharmacy 995 970 1,009 1,093 1,023
Human Kinetics & Recreation 1,564 1,463 1,394 1,313 1,329
Social Work 1,699 1,621 1,634 1,492 1,460
OTHER DIVISIONS
Sir Wilfred Grenfell College 10,540 9,195 8,848 8,475 8,192 Note 1*
Co-operative Education 195 184 178 197 286
Labrador Institute 68 127 119 159 149
Animal Care Unit 338 319 257 260 223
Fisheries & Marine Institute 14,913 12,961 12,120 11,345 10,766 Note 4*
Technical Services 3,425 3,247 3,011 3,128 2,996 Note 2*
SUPPORT SERVICES
Administrative Departments 10,710 10,062 9,824 9,506 9,159
Computing & Communications 3,928 3,409 3,172 3,002 2,738
Library 5,769 5,340 5,135 5,092 5,179
Student Services 3,190 3,097 2,873 3,044 3,121
Facilities Management 9,849 8,978 8,239 8,335 8,730
Total * 158,245 143,985 138,772 135,849 132,692
* See notes at beginning of this section.

Memorial University of Newfoundland Fact Book 2002 41
Table 17C Operating Expenditures by Faculty and School
Operations For the Five Year Period Ending 31 March 2002
Reflects gross departmental expenditures 2001/02 2000/01 1999/00 1998/99 1997/98
FACULTIES ($000)
Arts 1,158 1,067 1,136 1,144 1,078 Business Administration 61 301 97 399 186 Education 501 545 447 509 431 Engineering & Applied Science 469 517 439 558 583 Medicine 4,953 5,085 4,779 4,662 4,666 Note 3* Science 1,347 1,464 1,600 1,869 1,555
SCHOOLS/DIVISIONS
Distance Education and Learning Tech 331 204 514 831 599 Note 5*
Lifelong Learning 365 232 - - - Note 5*
Graduate Studies 2,524 2,193 2,209 2,294 2,321 Music 96 133 107 92 90 Nursing 122 76 95 54 (15) Pharmacy 159 160 145 150 127 Human Kinetics & Recreation 669 514 506 384 382 Social Work 135 96 99 112 55
OTHER DIVISIONS
Sir Wilfred Grenfell College 1,645 1,613 1,519 1,637 1,414 Note 1* Co-operative Education 497 494 456 450 422 Labrador Institute 80 90 116 109 79 Animal Care Unit (61) (43) (21) (28) (11) Fisheries & Marine Institute 4,857 5,106 4,583 4,309 4,420 Note 4* Technical Services (1,216) (991) (1,125) (1,100) (901) Note 2*
SUPPORT SERVICES
Administrative Departments 2,488 2,282 1,766 1,407 1,971 Computing & Communications 2,299 2,850 3,638 3,590 4,740 Library 5,089 5,262 4,259 4,441 4,391 Student Services 1,112 1,361 1,197 1,082 1,069 Facilities Management 3,392 4,276 3,151 2,914 4,470
Total * 33,072 34,887 31,712 31,869 34,122 * See notes at beginning of this section

42 Memorial University of Newfoundland Fact Book 2002
Table 17D Capital Expenditures by Faculty and School
Operations For the Five Year Period Ending 31 March 2002
Reflects gross departmental expenditures 2001/02 2000/01 1999/00 1998/99 1997/98
FACULTIES ($000)
Arts 136 539 68 144 126 Business Administration 36 27 36 124 97 Education 14 56 45 77 19 Engineering & Applied Science 132 206 227 277 239 Medicine 221 187 165 154 177 Note 3*
Science 604 553 474 552 553
SCHOOLS/DIVISIONS
Distance Education and Learning Tech. 37 80 405 170 177 Note 5*
Lifelong Learning 271 159 - - - Note 5*
Graduate Studies 16 19 12 3 49 Music 21 16 14 15 43 Nursing 29 61 33 51 3 Pharmacy 45 109 21 25 17 Human Kinetics & Recreation 95 134 31 51 47 Social Work 27 31 23 36 9
OTHER DIVISIONS
Sir Wilfred Grenfell College 283 205 381 154 188 Note 1* Co-operative Education 1 4 6 4 11 Labrador Institute 0 6 3 1 4 Animal Care Unit 28 75 25 15 21 Fisheries & Marine Institute 825 871 781 306 276 Note 4* Technical Services 122 209 36 30 16 Note 2*
SUPPORT SERVICES
Administrative Departments 1,290 225 118 424 436 Computing & Communications 1,461 1,645 1,093 762 784 Library 29 46 170 38 61 Student Services 122 166 73 45 77 Facilities Management 1,631 1,917 2,394 883 (848)
Total * 7,476 7,546 6,634 4,341 2,582 * See notes at beginning of this section.
Memorial University of Newfoundland Fact Book 2002 43
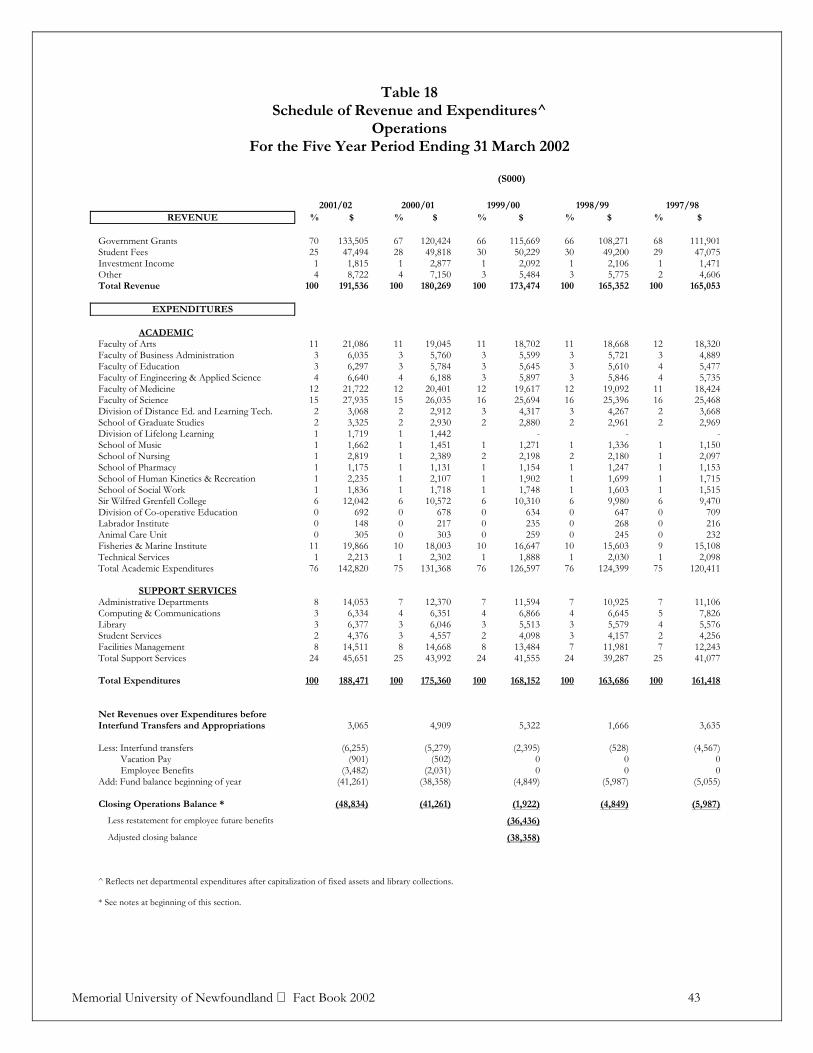
Table 18 Schedule of Revenue and Expenditures^
Operations For the Five Year Period Ending 31 March 2002
(S000)
2001/02 2000/01 1999/00 1998/99 1997/98 REVENUE % $ % $ % $ % $ % $
Government Grants 70 133,505 67 120,424 66 115,669 66 108,271 68 111,901 Student Fees 25 47,494 28 49,818 30 50,229 30 49,200 29 47,075 Investment Income 1 1,815 1 2,877 1 2,092 1 2,106 1 1,471 Other 4 8,722 4 7,150 3 5,484 3 5,775 2 4,606 Total Revenue 100 191,536 100 180,269 100 173,474 100 165,352 100 165,053
EXPENDITURES ACADEMIC Faculty of Arts 11 21,086 11 19,045 11 18,702 11 18,668 12 18,320 Faculty of Business Administration 3 6,035 3 5,760 3 5,599 3 5,721 3 4,889 Faculty of Education 3 6,297 3 5,784 3 5,645 3 5,610 4 5,477 Faculty of Engineering & Applied Science 4 6,640 4 6,188 3 5,897 3 5,846 4 5,735 Faculty of Medicine 12 21,722 12 20,401 12 19,617 12 19,092 11 18,424 Faculty of Science 15 27,935 15 26,035 16 25,694 16 25,396 16 25,468 Division of Distance Ed. and Learning Tech. 2 3,068 2 2,912 3 4,317 3 4,267 2 3,668 School of Graduate Studies 2 3,325 2 2,930 2 2,880 2 2,961 2 2,969 Division of Lifelong Learning 1 1,719 1 1,442 - - - School of Music 1 1,662 1 1,451 1 1,271 1 1,336 1 1,150 School of Nursing 1 2,819 1 2,389 2 2,198 2 2,180 1 2,097 School of Pharmacy 1 1,175 1 1,131 1 1,154 1 1,247 1 1,153 School of Human Kinetics & Recreation 1 2,235 1 2,107 1 1,902 1 1,699 1 1,715 School of Social Work 1 1,836 1 1,718 1 1,748 1 1,603 1 1,515 Sir Wilfred Grenfell College 6 12,042 6 10,572 6 10,310 6 9,980 6 9,470 Division of Co-operative Education 0 692 0 678 0 634 0 647 0 709 Labrador Institute 0 148 0 217 0 235 0 268 0 216 Animal Care Unit 0 305 0 303 0 259 0 245 0 232 Fisheries & Marine Institute 11 19,866 10 18,003 10 16,647 10 15,603 9 15,108 Technical Services 1 2,213 1 2,302 1 1,888 1 2,030 1 2,098 Total Academic Expenditures 76 142,820 75 131,368 76 126,597 76 124,399 75 120,411 SUPPORT SERVICES Administrative Departments 8 14,053 7 12,370 7 11,594 7 10,925 7 11,106 Computing & Communications 3 6,334 4 6,351 4 6,866 4 6,645 5 7,826 Library 3 6,377 3 6,046 3 5,513 3 5,579 4 5,576 Student Services 2 4,376 3 4,557 2 4,098 3 4,157 2 4,256 Facilities Management 8 14,511 8 14,668 8 13,484 7 11,981 7 12,243 Total Support Services 24 45,651 25 43,992 24 41,555 24 39,287 25 41,077 Total Expenditures 100 188,471 100 175,360 100 168,152 100 163,686 100 161,418
Net Revenues over Expenditures before Interfund Transfers and Appropriations
3,065
4,909
5,322
1,666
3,635 Less: Interfund transfers Vacation Pay Employee Benefits
(6,255) (901)
(3,482)
(5,279) (502)
(2,031)
(2,395) 0 0
(528) 0 0
(4,567) 0 0
Add: Fund balance beginning of year (41,261) (38,358) (4,849) (5,987) (5,055) Closing Operations Balance * (48,834) (41,261) (1,922) (4,849) (5,987)
Less restatement for employee future benefits (36,436)
Adjusted closing balance (38,358)
^ Reflects net departmental expenditures after capitalization of fixed assets and library collections. * See notes at beginning of this section.

44 Memorial University of Newfoundland Fact Book 2002
Table 19 Schedule of Revenue and Expenditures by Object^
Operations For the Five Year Period Ending 31 March 2002
2001/02 2000/01 1999/00 1998/99 1997/98
% $000 % $000 % $000 % $000 % $000 REVENUE
Government Grants 70 133,505 67 120,424 66 115,669 66 108,271 68 111,901 Student Fees 25 47,494 28 49,818 30 50,229 30 49,200 29 47,075 Investment Income 1 1,815 1 2,877 1 2,092 1 2,106 1 1,471 Other 4 8,722 4 7,150 3 5,484 3 5,775 2 4,606 Total Revenue 100 191,536 100 180,269 100 173,474 100 165,352 100 165,053
EXPENDITURES
Salaries & employee benefits 84 158,245 82 143,984 83 138,772 83 135,849 82 132,692 Travel 3 5,444 3 4,860 3 4,691 3 4,655 3 3,970 Materials & supplies 5 9,844 6 10,136 5 8,860 6 9,399 6 9,577 Building renovations 1 2,843 1 2,377 2 2,748 1 1,048 0 (280) Library acquisitions 0 266 0 329 0 265 0 364 0 239 Scholarships & bursaries 2 4,500 2 4,173 3 4,522 3 4,416 3 4,846 Utilities 6 11,477 7 11,931 6 10,380 6 9,367 7 10,878 Furniture & equipment 1 1,110 1 1,891 1 2,130 1 1,550 1 1,467 Externally contracted services 4 6,763 4 6,365 4 6,161 4 6,100 4 6,959 Professional fees 1 2,124 1 2,332 2 2,716 1 2,399 1 2,680 Other 1 1,506 1 1,420 0 1,465 0 1,319 0 989 External cost recoveries (8) (15,651) (8) (14,438) (9) (14,558) (8) (12,780) (8) (12,599) Total Expenditures 100 188,471 100 175,360 100 168,152 100 163,686 100 161,418 Net Revenues over Expenditures before Interfund Transfers and Appropriations
3,065
4,909
5,322
1,666
3,635
Less: Interfund transfers Vacation Pay
(6,255) (901)
(5,279) (502)
(2,395) 0
(528) 0
(4,567) 0
Employee Benefits (3,482) (2,031) 0 0 0 Add: Fund balance beginning of year (41,261) (38,358) (4,849) (5,987) (5,055) Closing Operations Balance * (48,834) (41,261) (1,922) (4,849) (5,987)
Less restatement for employee future benefits (36,436) Adjusted closing balance (38,358)
^ Reflects net departmental expenditures after capitalization of fixed assets and library collections. * See notes at beginning of this section.
Memorial University of Newfoundland Fact Book 2002 45
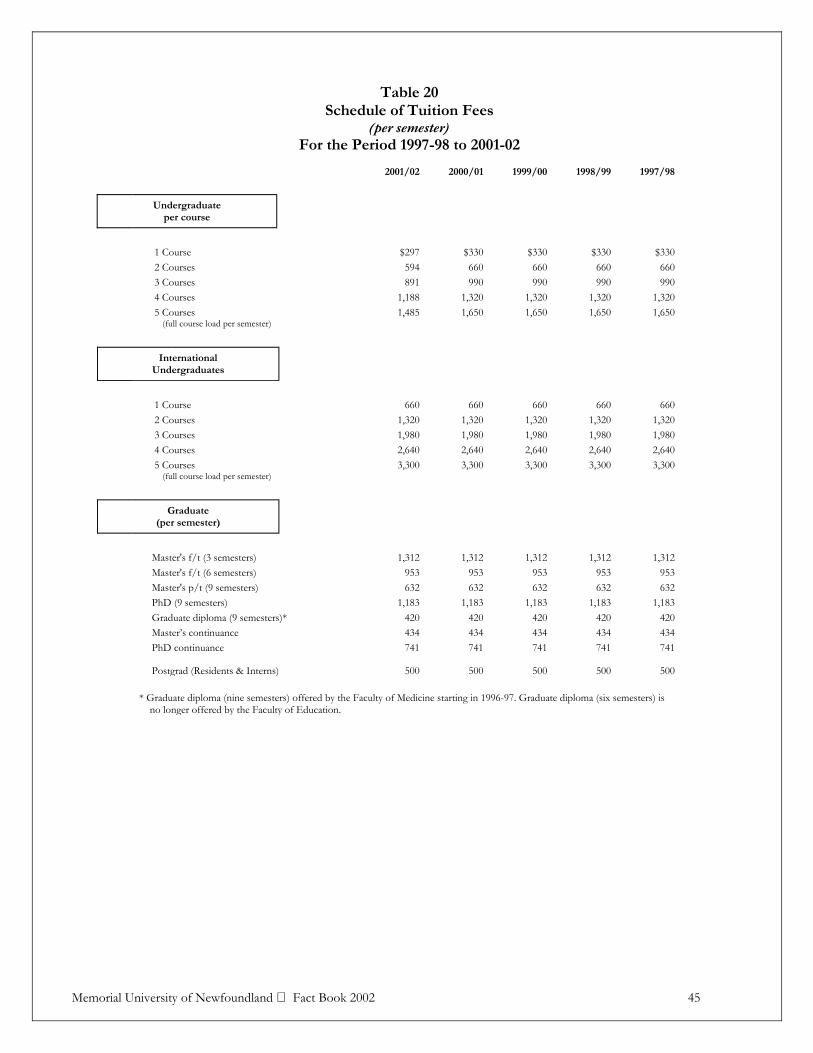
Table 20 Schedule of Tuition Fees
(per semester) For the Period 1997-98 to 2001-02
2001/02 2000/01 1999/00 1998/99 1997/98
Undergraduate per course
1 Course $297 $330 $330 $330 $330 2 Courses 594 660 660 660 660 3 Courses 891 990 990 990 990 4 Courses 1,188 1,320 1,320 1,320 1,320 5 Courses (full course load per semester)
1,485 1,650 1,650 1,650 1,650
International
Undergraduates
1 Course 660 660 660 660 660 2 Courses 1,320 1,320 1,320 1,320 1,320 3 Courses 1,980 1,980 1,980 1,980 1,980 4 Courses 2,640 2,640 2,640 2,640 2,640 5 Courses (full course load per semester)
3,300 3,300 3,300 3,300 3,300
Graduate
(per semester)
Master's f/t (3 semesters) 1,312 1,312 1,312 1,312 1,312 Master's f/t (6 semesters) 953 953 953 953 953 Master's p/t (9 semesters) 632 632 632 632 632 PhD (9 semesters) 1,183 1,183 1,183 1,183 1,183 Graduate diploma (9 semesters)* 420 420 420 420 420 Master’s continuance 434 434 434 434 434 PhD continuance 741 741 741 741 741
Postgrad (Residents & Interns) 500 500 500 500 500
* Graduate diploma (nine semesters) offered by the Faculty of Medicine starting in 1996-97. Graduate diploma (six semesters) is no longer offered by the Faculty of Education.
Memorial University of Newfoundland Fact Book 2002 47
Research
Profile

Memorial University of Newfoundland Fact Book 2002 49
Research Profile
Notes 1. The data used in these tables have been compiled from the records of the Office of Research, which publishes an annual
Inventory of Sponsored Projects of funded research projects after circulating preliminary lists to faculties and departments for crosschecking. Copies of the Inventory of Sponsored Projects are available from the Office of Research. The Office of Research figures are derived from notices of awards sent to successful applicants. In some cases, researchers receive more or less money in a given year than is originally pledged and recorded.
2. In 1986-87, the Office of Research began to keep track of the non-financial external support for university research — such
items include free supplies involved in experiments, access to off-campus equipment, computer or other facilities and ship-time for researchers at sea.
3. Included in the "Other" category are grants and/or awards for:
Conferences/workshops/symposia Equipment Fellowship General support awardsInfrastructure In-kind Scholarship Ship time Studentship Research chairs Research personnel awards Travel
4. In addition to the standard operating grant, the category of Operating Grants includes the following:
Career Collaborative special projectsCollaborative project grants Development Lithoprobe Major facilities access Partnership Publication Strategic Team
5. In-kind is not regarded as a funding category. Instead, it is recorded as a type of funding like cash. All in-kind counts (2001-
2002 total is 85) have already been included in the various funding categories e.g., if a sponsor provides an in-kind contribution as an operating grant, one operating grant is counted.
6. The amounts reported under operating grants for the Federal Government and the Ocean Sciences Centre includes the full
value of the 1999-2000 amount ($3,600,000) awarded for AquaNet, a Network funded under the Networks of Centres of Excellence Program.
7. On February 29, 1992, the Newfoundland and Labrador Institute of Fisheries and Marine Technology (Marine Institute)
became a part of Memorial University. Not included here is revenue earned by the Marine Institute for industry response, and applied research and development activities.
8. Operating Grants are awarded to individuals or teams to cover part or all of the direct costs of particular research projects.
They often include provisions for salaries paid to graduate students and other assistants, the university’s share of fringe benefits costs, and the expense of materials, technical services, field travel and computing.
9. Operating Contracts are similar to operating grants but involve a contractual agreement that is more formal than the terms of
a conventional grant. By means of a contract, the sponsor normally acquires an interest in the results of the research and can enforce strict time, scope and reporting requirements; university policy, however, is that investigators retain the right to publish, subject to a reasonable deferral period.
10. Table 23 counts should be read as ‘pieces’ of funding from the various sponsor categories. In order to categorize the counts
in this way, some duplication results. For example, Federal/Provincial Cooperation Agreements are received as one operating contract, however, in order to record a count of funding from both levels of Government, one is entered in Federal Government and one is entered in Provincial Government. The overstatements that occur in the 2001-2002 data as a result of this practice are as follows: Chairs are overstated by 8; Operating Contracts are overstated by 49; Operating Grants (including partnerships) are overstated by 14; Infrastructure are overstated by 9.

50 Memorial University of Newfoundland Fact Book 2002
* Other includes chairs, conferences/workshops/ symposia, general support grants, infrastructure, research personnel awards, travel, equipment, and in-kind support.

Memorial University of Newfoundland Fact Book 2002 51
Table 21A Total External Research Support by Department 1997-1998 to 2001-2002
Faculty 2001-02 2000-01 1999-00 1998-99 1997-98
# $ # $ # $ # $ # $ ARTS Dean's Office 2 188,790 5 226,142 4 131,140 9 175,372 7 74,098Anthropology 26 1,169,000 21 759,006 18 528,660 16 479,789 12 386,279Classics 5 48,786 2 23,750 1 7,250 4 9,988 5 29,690Economics 7 254,659 4 181,500 5 179,862 4 28,359 4 46,130English 4 11,945 9 30,632 5 31,858 6 30,282 4 19,279Folklore 4 30,669 1 20,000 2 12,500 3 12,090 5 19,085French & Spanish 1 715 4 22,210 2 2,605 1 1,105 2 2,210Geography 10 102,785 10 143,835 6 37,620 5 33,988 7 56,390German & Russian 1 6,521 0 0 0 0 0 0 0 0History 15 773,781 8 649,636 12 97,005 8 65,202 9 68,082Linguistics 3 37,439 5 54,333 5 36,946 3 21,188 3 23,605Philosophy 0 0 1 1,105 1 1,105 0 0 1 10,000Political Science 5 34,185 1 315,000 2 151,105 3 156,005 3 169,105Public Policy Research Centre 6 158,638 0 0 0 0 0 0 0 0Religious Studies 4 29,965 2 20,352 1 1,105 1 1,105 2 4,600Sociology 8 211,274 10 176,975 10 176,288 1 29,377 3 12,210Women's Studies 0 0 0 0 0 0 0 0 0 0ARTS Total 101 3,059,152 83 2,624,476 74 1,395,049 64 1,043,850 67 920,763 BUSINESS 13 546,923 16 746,667 10 580,939 14 540,584 16 499,626 EDUCATION 7 74,290 12 469,479 21 694,202 13 332,166 20 288,596 ENGINEERING 57 2,413,628 57 1,707,809 58 2,013,223 59 1,515,311 74 1,707,721 MARINE INSTITUTE 45 5,245,867 49 4,686,371 46 4,915,085 50 5,110,488 60 4,019,902 MEDICINE 259 8,925,329 204 6,962,831 201 6,088,764 174 5,047,144 169 5,162,824 SCIENCE Dean’s Office 0 0 0 0 0 0 1 8,000 0 0Biochemistry 38 1,543,954 32 1,245,342 37 1,533,177 36 1,536,396 48 1,330,390Biology 45 1,085,712 42 722,918 38 615,671 33 571,596 44 1,588,910Chemistry 23 638,275 30 1,282,027 23 1,105,965 24 822,481 23 560,989Computer Science 9 282,458 11 303,866 14 281,024 13 443,269 15 195,248Earth Science/CERR 44 6,360,798 38 4,587,831 38 1,483,328 40 1,868,020 52 1,367,955Math & Stats 24 304,760 24 322,906 23 364,367 16 220,643 17 183,031OSC 40 5,238,610 42 5,958,619 44 5,884,245 46 5,129,167 63 3,059,570Physics 32 2,619,844 39 2,791,104 19 1,393,706 19 1,519,718 24 1,388,127Psychology 30 746,250 23 512,562 24 455,905 18 380,794 26 388,766SCIENCE Total 285 18,820,661 281 17,727,175 260 13,117,388 246 12,500,084 312 10,062,986 SCHOOLS Continuing Education 0 0 6 337,860 5 785,022 4 448,820 3 180,712Graduate Studies 0 0 0 0 0 0 0 0 0 0Music 0 0 1 4,300 2 16,000 1 6,000 1 1,271Nursing 18 686,357 10 239,450 10 223,620 6 352,174 8 134,998Pharmacy 11 213,067 11 326,603 18 531,543 15 344,100 9 150,933Human Kinetics & Recreation 7 57,032 5 219,339 1 60,000 0 0 0 0Social Work 3 127,450 6 241,504 4 152,000 7 235,120 5 182,357SCHOOLS Total 39 1,083,906 39 1,369,056 40 1,768,185 33 1,386,214 26 650,271 Other units (Table 22A)
88 8,092,742 103 7,201,200 107 6,602,676 114 7,774,068 109 5,431,168
Total 894 48,262,498 844 43,495,064 817 37,175,511 767 35,249,909 853 28,743,857
See notes at beginning of this section.

52 Memorial University of Newfoundland Fact Book 2002
Table 21B Operating Grants by Department 1997-1998 to 2001-2002
Faculty 2001-2002 2000-2001 1999-2000 1998-1999 1997-1998
# $ # $ # $ # $ # $ ARTS Dean’s Office 0 0 1 40,000 2 62,500 4 85,910 3 46,105 Anthropology 17 660,625 16 642,400 11 387,426 9 321,588 9 354,607 Classics 5 48,786 2 23,750 1 7,250 4 9,988 5 29,690 Economics 5 203,944 4 181,500 3 171,000 1 3,536 2 5,600 English 1 9,800 5 26,212 3 17,260 3 27,547 3 10,495 Folklore 3 29,954 1 20,000 2 12,500 2 10,985 5 19,085 French & Spanish 0 0 0 0 0 0 0 0 2 2,210 Geography 6 87,490 5 130,520 3 24,410 2 24,778 4 36,210 German & Russian 1 6,521 0 0 0 0 0 0 0 0 History 6 732,648 5 634,926 6 91,849 4 60,506 9 68,082 Linguistics 2 36,903 4 45,333 3 25,650 2 20,083 3 23,605 Philosophy 0 0 0 0 0 0 0 0 0 0 Political Science 3 14,185 0 0 0 0 1 64,900 2 64,105 Public Policy Research Centre 1 26,439 0 0 0 0 0 0 0 0 Religious Studies 3 29,250 1 19,247 0 0 0 0 2 4,600 Sociology 6 169,866 7 123,765 7 104,366 1 29,377 2 2,210 Women's Studies 0 0 0 0 0 0 0 0 0 0 ARTS Total 59 2,056,411 51 1,887,653 41 904,211 33 659,198 51 666,604 BUSINESS 8 187,198 8 120,481 4 88,210 5 98,200 7 216,900 EDUCATION 3 70,000 7 334,598 12 451,110 7 155,300 9 220,142 ENGINEERING 39 1,034,911 35 783,593 39 1,018,884 43 770,612 50 852,509 MARINE INSTITUTE 2 40,425 6 42,828 3 58,905 3 56,100 0 0 MEDICINE 134 4,360,587 100 3,479,117 88 3,169,422 78 2,375,209 76 2,184,968 SCIENCE Dean's Office 0 0 0 0 0 0 0 0 0 0 Biochemistry 19 771,548 23 800,068 24 881,023 24 865,669 23 703,756 Biology 23 694,583 25 454,083 19 298,639 13 208,203 18 270,653 Chemistry 18 569,347 18 627,959 14 476,317 17 462,332 21 506,487 Computer Science 9 155,445 10 171,445 13 251,598 13 207,669 13 173,143 Earth Science/CERR 34 1,275,983 29 1,101,997 32 765,105 34 1,537,174 42 750,537 Math & Stats 19 269,814 22 301,525 21 287,486 15 219,842 17 183,031 OSC ^ 17 4,322,064 20 4,329,291 21 4,419,303 18 624,389 18 1,447,510 Physics 21 800,094 20 717,557 14 953,212 12 1,331,616 19 1,248,394 Psychology 19 494,577 13 316,397 11 257,873 14 368,156 15 317,583 SCIENCE Total 179 9,353,455 180 8,820,322 169 8,590,556 160 5,825,050 186 5,601,094 SCHOOLS Continuing Education 0 0 0 0 0 0 0 0 1 16,150 Graduate Studies 0 0 0 0 0 0 0 0 0 0 Music 0 0 1 4,300 1 6,000 1 6,000 1 1,271 Nursing 17 510,857 10 239,450 8 153,028 2 14,000 5 29,113 Pharmacy 2 99,288 4 210,272 11 429,508 7 218,747 4 69,524 Human Kinetics & Recreation 3 47,761 1 30,100 1 60,000 0 0 0 0 Social Work 0 0 1 29,573 3 52,000 4 84,500 5 182,357 SCHOOLS Total 22 657,906 17 513,695 24 700,536 14 323,247 16 298,415 Other units (Table 22B)
15 338,955 13 227,856 17 256,336 24 440,019 28 520,685
Total 461 18,099,848 417 16,210,143 397 15,238,170 367 10,702,935 423 10,561,317
^ The amounts reported under operating grants for the Federal Government and the Ocean Sciences Centre include the full value of the 1999-2000 amount
($3,600,000) awarded for AquaNet, a Network funded under the Networks of Centres of Excellence Program.

Memorial University of Newfoundland Fact Book 2002 53
Table 21C Operating Contracts by Department 1997-1998 to 2001-2002
Faculty 2001-2002 2000-2001 1999-2000 1998-1999 1997-1998
# $ # $ # $ # $ # $ ARTS Dean's Office 2 188,790 3 185,037 2 68,640 5 89,462 4 27,993 Anthropology 3 41,874 4 104,001 7 129,734 7 136,201 1 13,402 Classics 0 0 0 0 0 0 0 0 0 0 Economics 0 0 0 0 2 8,862 2 19,723 2 40,530 English 0 0 0 0 1 1,105 3 2,735 0 0 Folklore 0 0 0 0 0 0 1 1,105 0 0 French & Spanish 0 0 0 0 1 1,105 1 1,105 0 0 Geography 2 13,847 2 10,000 3 7,210 3 7,210 3 20,180 German & Russian 0 0 0 0 0 0 0 0 0 0 History 0 0 0 0 6 5,156 4 4,696 0 0 Linguistics 0 0 0 0 0 0 1 1,105 0 0 Philosophy 0 0 0 0 1 1,105 0 0 0 0 Political Science 0 0 1 315,000 2 151,105 2 91,105 1 105,000 Public Policy Research Centre 5 132,199 0 0 0 0 0 0 0 0 Religious Studies 0 0 0 0 1 1,105 1 1,105 0 0 Sociology 0 0 0 0 2 2,210 0 0 0 0 Women's Studies 0 0 0 0 0 0 0 0 0 0 ARTS Total 12 376,710 10 614,038 28 377,337 30 355,552 11 207,105 BUSINESS 4 157,640 7 401,354 5 314,729 8 434,651 9 282,726 EDUCATION 0 0 3 123,500 9 243,092 6 165,866 11 68,454 ENGINEERING 16 597,777 18 476,534 14 423,334 10 278,924 14 452,252 MARINE INSTITUTE 35 3,164,035 40 2,952,019 38 3,188,559 42 3,389,971 44 2,343,361 MEDICINE 96 3,059,460 86 2,666,088 98 2,404,959 82 2,189,028 87 2,825,895 SCIENCE Dean's Office 0 0 0 0 0 0 0 0 0 0 Biochemistry 6 410,695 4 278,456 9 268,510 11 516,664 20 485,098 Biology 17 362,698 12 203,410 18 214,672 19 241,256 23 1,181,881 Chemistry 0 0 3 93,751 6 192,443 5 87,428 1 40,390 Computer Science 0 0 0 0 1 1,381 0 0 1 4,160 Earth Science/CERR 1 6,000 1 4,800 3 7,562 4 196,346 5 428,236 Math & Stats 2 32,335 0 0 1 1,381 1 801 0 0 OSC 16 453,089 13 239,496 18 277,680 25 4,230,689 41 1,227,592 Physics 1 55,397 2 106,000 2 2,762 3 7,043 0 0 Psychology 9 248,427 8 193,403 13 198,032 4 12,638 10 66,683 SCIENCE Total 52 1,568,641 43 1,119,316 71 1,164,423 72 5,292,865 101 3,434,040 SCHOOLS Continuing Education 0 0 6 337,860 5 785,022 4 448,820 2 164,562 Graduate Studies 0 0 0 0 0 0 0 0 0 0 Music 0 0 0 0 0 0 0 0 0 0 Nursing 1 150,000 0 0 2 70,592 4 338,174 3 105,885 Pharmacy 0 0 0 0 0 0 0 0 0 0 Human Kinetics & Recreation 0 0 0 0 0 0 0 0 0 0 Social Work 1 9,450 1 85,050 0 0 2 50,620 0 0 SCHOOLS Total 2 159,450 7 422,910 7 855,614 10 837,614 5 270,447 Other units (Table 22C) 58 5,721,260 83 5,403,525 85 5,907,681 85 6,742,973 71 3,689,549 Total 275 14,804,973 297 14,179,284 355 14,879,728 345 19,687,444 353 13,573,829

54 Memorial University of Newfoundland Fact Book 2002
Table 21D Other Grants by Department 1997-1998 to 2001-2002
(Other includes chairs, conferences/workshops/symposia, general support grants, infrastructure, research personnel awards, travel, equipment and in-kind support)
Faculty 2001-2002 2000-2001 1999-2000 1998-1999 1997-1998 # $ # $ # $ # $ # $ ARTS Dean’s Office 0 0 1 1,105 0 0 0 0 0 0 Anthropology 6 466,501 1 12,605 0 11,500 0 22,000 2 18,270 Classics 0 0 0 0 0 0 0 0 0 0 Economics 2 50,715 0 0 0 0 1 5,100 0 0 English 3 2,145 4 4,420 1 13,493 0 0 1 8,784 Folklore 1 715 0 0 0 0 0 0 0 0 French & Spanish 1 715 4 22,210 1 1,500 0 0 0 0 Geography 2 1,448 3 3,315 0 6,000 0 2,000 0 0 German & Russian 0 0 0 0 0 0 0 0 0 0 History 9 41,133 3 14,710 0 0 0 0 0 0 Linguistics 1 536 1 9,000 2 11,296 0 0 0 0 Philosophy 0 0 1 1,105 0 0 0 0 1 10,000 Political Science 2 20,000 0 0 0 0 0 0 0 0 Public Policy Research Centre 0 0 0 0 0 0 0 0 0 0 Religious Studies 1 715 1 1,105 0 0 0 0 0 0 Sociology 2 41,408 3 53,210 1 69,710 0 0 1 10,000 Women's Studies 0 0 0 0 0 0 0 0 0 0 ARTS Total 30 626,031 22 122,785 5 113,499 1 29,100 5 47,054 BUSINESS 1 202,085 1 224,832 1 178,000 1 7,733 0 0 EDUCATION 4 4,290 2 11,381 0 0 0 11,000 0 0 ENGINEERING 2 780,940 4 447,682 5 571,005 6 465,775 10 402,960 MARINE INSTITUTE 8 2,041,407 3 1,691,524 5 1,667,621 5 1,664,417 16 1,676,541 MEDICINE 29 1,505,282 18 817,626 15 514,384 14 482,907 6 151,961 SCIENCE Dean's Office 0 0 0 0 0 0 1 8,000 0 0 Biochemistry 13 361,711 5 166,818 4 383,645 1 154,063 5 141,536 Biology 5 28,431 5 65,425 1 102,360 1 122,137 3 136,376 Chemistry 5 68,928 9 560,317 3 437,205 2 272,721 1 14,112 Computer Science 0 127,013 1 132,421 0 28,045 0 235,600 1 17,945
Earth Science/CERR 9 5,078,815 8 3,481,034 3 710,661 2 134,500 5 189,182 Math & Stats 3 2,611 2 21,381 1 75,500 0 0 0 0 OSC 7 463,457 9 1,389,832 5 1,187,262 3 274,089 4 384,468 Physics 10 1,764,353 17 1,967,547 3 437,732 4 181,059 5 139,733 Psychology 2 3,246 2 2,762 0 0 0 0 1 4,500 SCIENCE Total 54 7,898,565 58 7,787,537 20 3,362,410 14 1,382,169 25 1,027,852 SCHOOLS Continuing Education 0 0 0 0 0 0 0 0 0 0 Graduate Studies 0 0 0 0 0 0 0 0 0 0 Music 0 0 0 0 1 10,000 0 0 0 0 Nursing 0 25,500 0 0 0 0 0 0 0 0 Pharmacy 9 113,779 7 116,331 7 102,035 8 125,353 5 81,409 Human Kinetics & Recreation 4 9,271 4 189,239 0 0 0 0 0 0
Social Work 2 118,000 4 126,881 1 100,000 1 100,000 0 0 SCHOOLS Total 15 266,550 15 432,451 9 212,035 9 225,353 5 81,409 Other units (Table 22D) 15 2,032,527 7 1,569,819 5 438,659 5 591,076 10 1,220,934 Total 158 15,357,677 130 13,105,637 65 7,057,613 55 4,859,530 77 4,608,711

Memorial University of Newfoundland Fact Book 2002 55
Table 22A Total External Research Support by Unit 1997-1998 to 2001-2002
2001-2002 2000-2001 1999-2000 1998-1999 1997-1998 Other units # $ # $ # $ # $ # $ Art Gallery 0 0 0 0 0 0 0 0 0 0Botanical Garden 1 823 0 0 0 0 0 0 0 0C-CORE 56 4,915,934 75 4,987,767 75 5,599,883 82 6,623,519 77 4,367,426CCIFTD 0 0 0 0 3 194,894 6 384,013 9 621,868Computing & Communications 2 127,059 2 52,941 0 0 0 0 0 0Counselling Centre 0 0 2 44,000 0 0 1 1,500 0 0Educational Technology 0 0 0 0 0 0 0 0 0 0ISER 0 0 0 0 0 0 0 0 0 0Institutional Analysis & Planning 0 0 0 0 1 12,989 0 0 0 0International Centre 2 268,131 7 347,879 1 80,000 1 100,000 2 60,000Language Lab 0 0 0 0 1 1,105 0 0 0 0Library 7 1,321,498 4 23,642 1 6,000 3 22,000 0 0Labrador Institute 0 0 0 0 1 21,000 1 15,000 4 30,500Maritime History Archive 3 105,426 1 1,105 5 27,895 3 10,807 7 27,029P.J. Gardiner Institute 1 83,333 1 116,667 5 263,025 2 200,000 1 116,667President's Office 0 0 0 0 0 0 1 53,074 1 59,648Seabright/Genesis 3 458,571 2 398,571 2 141,429 1 90,000 0 0Sir Wilfred Grenfell College 5 46,930 5 32,430 8 73,250 7 103,930 2 19,620STEM~Net 0 0 0 0 0 0 0 0 2 113,610Student Affairs & Services 0 0 0 0 1 36,750 0 0 2 10,113Technical Services 1 21,980 0 0 0 0 0 0 0 0TETRA 0 0 0 0 1 20,382 3 48,475 2 4,687University Relations 0 0 0 0 0 0 1 4,000 0 0V. P. (Research) 6 742,074 4 1,196,198 2 124,074 2 117,750 0 0Other 1 983 0 0 0 0 0 0 0 0Other total 88 8,092,742 103 7,201,200 107 6,602,676 114 7,774,068 109 5,431,168
Table 22B Operating Grants by Unit 1996-1997 to 2001-2002
2001-2002 2000-2001 1999-2000 1998-1999 1997-1998 Other units # $ # $ # $ # $ # $ Art Gallery 0 0 0 0 0 0 0 0 0 0 Botanical Garden 0 0 0 0 0 0 0 0 0 0 C-CORE 6 174,748 6 147,426 8 196,626 13 344,832 16 457,156 CCIFTD 0 0 0 0 0 0 0 0 0 0 Computing & Communication 0 0 0 0 0 0 0 0 0 0 Counselling Centre 0 0 2 44,000 0 0 1 1,500 0 0 Educational Technology 0 0 0 0 0 0 0 0 0 0 ISER 0 0 0 0 0 0 0 0 0 0 Institutional Analysis & Planning 0 0 0 0 0 0 0 0 0 0 International Centre 0 0 0 0 0 0 0 0 0 0 Library 2 13,468 1 10,000 0 0 2 16,000 0 0 Labrador Institute 0 0 0 0 0 0 1 15,000 4 30,500 Language Lab 0 0 0 0 0 0 0 0 0 0 Maritime History Archive 2 103,809 0 0 4 26,790 2 9,702 7 27,029 P.J. Gardiner Institute 0 0 0 0 0 0 0 0 0 0 President's Office 0 0 0 0 0 0 0 0 0 0 Seabright/Genesis 0 0 0 0 0 0 0 0 0 0 Sir Wilfred Grenfell College 5 46,930 4 26,430 5 32,920 4 48,985 1 6,000 STEM~Net 0 0 0 0 0 0 0 0 0 0 Student Affairs & Services 0 0 0 0 0 0 0 0 0 0 Technical Services 0 0 0 0 0 0 0 0 0 0 TETRA 0 0 0 0 0 0 0 0 0 0 University Relations 0 0 0 0 0 0 1 4,000 0 0 V. P. (Research) 0 0 0 0 0 0 0 0 0 0 Other 0 0 0 0 0 0 0 0 0 0 Other total 15 338,955 13 227,856 17 256,336 24 440,019 28 520,685
See notes at beginning of this section.
56 Memorial University of Newfoundland Fact Book 2002
Table 22C Operating Contracts by Unit 1997-1998 to 2001-2002
2001-02 2000-01 1999-00 1998-99 1997-98 Other units # $ # $ # $ # $ # $ Art Gallery 0 0 0 0 0 0 0 0 0 0 Botanical Garden 0 0 0 0 0 0 0 0 0 0 C-CORE 49 4,591,186 66 4,236,825 66 5,129,857 68 5,937,770 52 2,748,984 CCIFTD 0 0 0 0 3 194,894 6 384,013 9 621,868 Computing & Communications 2 127,059 2 52,941 0 0 0 0 0 0 Counselling Centre 0 0 0 0 0 0 0 0 0 0 Educational Technology 0 0 0 0 0 0 0 0 0 0 ISER 0 0 0 0 0 0 0 0 0 0 Institutional Analysis & Planning 0 0 0 0 1 12,989 0 0 0 0 International Centre 2 268,131 7 347,879 1 80,000 1 100,000 2 60,000 Labrador Institute 0 0 0 0 0 0 0 0 0 0 Language Lab 0 0 0 0 1 1,105 0 0 0 0 Library 0 0 3 13,642 1 6,000 1 6,000 0 0 Maritime History Archive 0 0 0 0 1 1,105 1 1,105 0 0 P.J. Gardiner Institute 1 83,333 1 116,667 5 263,025 2 200,000 1 116,667 President's Office 0 0 0 0 0 0 0 0 0 0 Seabright/Genesis 1 308,571 1 308,571 1 51,429 0 0 0 0 Sir Wilfred Grenfell College 0 0 1 6,000 2 39,145 2 47,860 1 13,620 STEM~Net 0 0 0 0 0 0 0 0 2 113,610 Student Affairs & Services 0 0 0 0 1 36,750 0 0 2 10,113 Technical Services 1 21,980 0 0 0 0 0 0 0 0 TETRA 0 0 0 0 1 20,382 3 48,475 2 4,687 University Relations 0 0 0 0 0 0 0 0 0 0 V. P. (Research) 2 321,000 2 321,000 1 71,000 1 17,750 0 0 Other 0 0 0 0 0 0 0 0 0 0 Other total 58 5,721,260 83 5,403,525 85 5,907,681 85 6,742,973 71 3,689,549
Table 22D
Other Grants by Unit 1997-1998 to 2001-2002 (Other includes chairs, conferences/workshops/symposia, general support grants, infrastructure, research personnel awards, travel, equipment and in-kind support)
2001-02 2000-01 1999-00 1998-99 1997-98 Other units # $ # $ # $ # $ # $ Art Gallery 0 0 0 0 0 0 0 0 0 0 Botanical Garden 1 823 0 0 0 0 0 0 0 0 C-CORE 1 150,000 3 603,516 1 273,400 1 340,917 9 1,164,286 CCIFTD 0 0 0 0 0 0 0 0 0 0 Computing & Communications 0 0 0 0 0 0 0 0 0 0 Counselling Centre 0 0 0 0 0 0 0 0 0 0 Educational Technology 0 0 0 0 0 0 0 0 0 0 ISER 0 0 0 0 0 0 0 0 0 0 Institutional Analysis & Planning 0 0 0 0 0 0 0 0 0 0 International Centre 0 0 0 0 0 0 0 0 0 0 Labrador Institute 0 0 0 0 1 21,000 0 0 0 0 Language Lab 0 0 0 0 0 0 0 0 0 0 Library 5 1,308,030 0 0 0 0 0 0 0 0 Maritime History Archive 1 1,617 1 1,105 0 0 0 0 0 0 P.J. Gardiner Institute 0 0 0 0 0 0 0 0 0 0 President's Office 0 0 0 0 0 0 1 53,074 1 59,648 Seabright/Genesis 2 150,000 1 90,000 1 90,000 1 90,000 0 0 Sir Wilfred Grenfell College 0 0 0 0 1 1,185 1 7,085 0 0 STEM~Net 0 0 0 0 0 0 0 0 0 0 Student Affairs & Services 0 0 0 0 0 0 0 0 0 0 Technical Services 0 0 0 0 0 0 0 0 0 0 TETRA 0 0 0 0 0 0 0 0 0 0 University Relations 0 0 0 0 0 0 0 0 0 0 V. P. (Research) 4 421,074 2 875,198 1 53,074 1 100,000 0 0 Other 1 983 0 0 0 0 0 0 0 0 Other total 15 2,032,527 7 1,569,819 5 438,659 5 591,076 10 1,220,934

Memorial University of Newfoundland Fact Book 2002 57
Table 23A Sources of Total External Research Funding 1997-1998 to 2001-2002
2001-02 2000-01 1999-00 1998-99 1997-98
AGENCY # $ # $ # $ # $ # $
Federal Granting Councils NCE 10 3,761,265 10 3,808,000 - - - - - - CFI 7 1,431,144 9 2,799,025 - - - - - - CRC 3 325,000 - - - - - - - - MRC/CIHR 69 3,416,215 51 2,754,225 44 1,827,572 36 1,568,503 30 1,219,842 NSERC 181 7,316,760 195 7,138,434 193 6,667,004 187 6,534,921 203 6,071,668 SSHRC 35 1,762,804 32 1,196,489 33 864,866 20 277,308 21 337,285 Total Councils 305 18,013,188 297 17,696,173 270 9,359,442 243 8,380,732 254 7,628,795 Federal Government 210 8,923,204 212 8,819,594 215 12,231,616 186 11,110,829 213 9,868,480 Provincial Government 71 2,045,019 60 1,346,576 74 1,194,613 63 1,808,568 57 1,219,911 Canadian Non-profit Agencies 167 3,541,977 117 2,695,635 123 4,177,743 130 3,133,814 124 2,900,925 Foreign Non-profit Agencies 18 432,470 10 238,790 9 233,737 14 219,951 26 1,152,968 Canadian Business 169 7,094,658 197 7,132,310 199 7,308,374 198 6,643,223 164 4,536,688 Canadian Individual 7 62,925 6 266,007 2 6,606 5 54,674 n/a n/a Foreign Business 22 8,049,252 33 5,299,979 27 2,663,380 34 3,898,118 15 1,436,090 United States Government 5 99,806 - - - - - - - -
Total 974 48,262,499 932 43,495,064 919 37,175,511 873 35,249,909 853 28,743,857
See notes at beginning of this section .
Table 23B Sources of Operating Grant Funding 1997-1998 to 2001-2002
2001-02 2000-01 1999-00 1998-99 1997-98
AGENCY # $ # $ # $ # $ # $ Federal Granting Councils NCE 10 3,761,265 10 3,808,000 - - - - - - CFI 0 0 0 0 - - - - - - CRC 0 0 - - - - - - - - MRC/CIHR 43 2,639,902 36 2,071,953 27 1,378,174 21 1,116,754 23 1,048,112 NSERC 161 5,360,184 167 4,949,623 170 5,008,950 167 5,284,129 186 5,118,837 SSHRC 31 1,616,397 26 1,057,749 27 648,549 19 224,234 16 239,367 Total Councils 245 13,377,747 239 11,887,325 224 7,035,673 207 6,625,117 225 6,476,316
Federal Government 43 1,295,178 55 1,571,202 62 5,457,138 37 1,539,429 84 1,782,977
Provincial Government 38 596,108 37 647,264 48 343,320 33 419,267 15 217,064
Canadian Non-profit Agencies 98 1,899,772 68 1,644,379 69 1,730,887 64 1,422,296 66 1,472,023
Foreign Non-profit Agencies 9 264,514 4 96,569 4 101,735 5 60,142 4 90,669
Canadian Business 41 666,529 26 363,404 29 569,417 36 628,429 26 453,280 Canadian Individual 0 0 0 0 0 0 0 0 n/a n/a
Foreign Business 1 0 0 0 0 0 4 8,255 3 68,988 United States Government 0 0 - - - - - - - - Total 475 18.099,848 429 16,210,143 436 15,238,170 386 10,702,935 423 10,561,317
58 Memorial University of Newfoundland Fact Book 2002
Table 23C Sources of Operating Contract Funding 1997-1998 to 2001-2002
2001-02 2000-01 1999-00 1998-99 1997-98
AGENCY # $ # $ # $ # $ # $ Federal Granting Councils NCE 0 0 0 0 - - - - - - CFI 0 0 0 0 - - - - - - CRC 0 0 - - - - - - - - MRC/CIHR 0 0 0 0 0 0 0 0 0 0 NSERC 0 0 0 0 0 0 0 0 0 0 SSHRC 0 0 0 0 0 0 0 0 0 0 Total Councils 0 0 0 0 0 0 0 0 0 0 Federal Government 96 4,997,417 106 5,853,926 146 5,800,340 146 8,858,217 120 6,289,446 Provincial Government 21 436,552 21 384,312 24 535,693 25 1,062,818 39 502,804 Canadian Non-profit Agencies 53 1,148,456 37 730,126 40 552,194 56 929,141 50 1,231,080 Foreign Non-profit Agencies 5 92,101 5 130,214 4 84,607 7 119,020 19 1,045,200 Canadian Business 118 4,484,858 160 4,925,240 163 5,392,708 157 4,969,878 115 3,215,643 Canadian Individual 7 11,600 5 13,612 2 3,806 5 4,274 n/a n/a Foreign Business 20 3,534,183 30 2,141,854 27 2,510,380 29 3,744,096 10 1,289,656 United States Government 5 99,806 - - - - - - - - Total 325 14,804,973 364 14,179,284 406 14,879,728 425 19,687,444 353 13,573,829
Table 23D
Sources of Other Grant Funding 1997-1998 to 2001-2002 (Other includes chairs, conferences/workshops/symposia, general support grants, infrastructure, research personnel awards, travel, equipment and in-kind support)
2001-02 2000-01 1999-00 1998-99 1997-98
AGENCY # $ # $ # $ # $ # $ Federal Granting Councils NCE 0 0 0 0 - - - - - - CFI 7 1,431,144 9 2,799,025 - - - - - - CRC 3 325,000 - - - - - - - - MRC/CIHR 26 776,313 15 682,272 17 449,398 15 451,749 7 171,730 NSERC 20 1,956,576 28 2,188,811 23 1,658,054 20 1,250,792 17 882,831 SSHRC 4 146,407 6 138,740 6 216,317 1 53,074 5 97,918 Total Councils 60 4,635,441 58 5,808,848 46 2,323,769 36 1,755,615 29 1,152,479 Federal Government 71 2,630,609 51 1,394,466 7 974,138 3 713,183 9 1,796,057 Provincial Government 12 1,012,359 2 315,000 2 315,600 5 326,483 3 500,043 Canadian Non-profit Agencies 16 493,749 12 321,130 14 1,894,662 10 782,377 8 197,822
Foreign Non-profit Agencies 4 75,855 1 12,007 1 47,395 2 40,789 3 17,099 Canadian Business 10 1,943,271 11 2,036,061 6 1,349,049 5 1,095,316 23 867,765 Canadian Individual 0 51,325 1 60,000 0 0 0 0 n/a n/a Foreign Business 1 4,515,069 3 3,158,125 0 153,000 1 145,767 2 77,446 United States Government 0 0 - - - - - - - - Total 174 15,357,678 139 13,105,637 77 7,057,613 62 4,859,530 77 4,608,711

Memorial University of Newfoundland Fact Book 2002 59
Alumni and Development
Profile

Memorial University of Newfoundland Fact Book 2002 61
Table 24 Geographical Distribution of Alumni by Most Recent Address
2001-02 2000-01 1999-00 1998-99 1997-98
Newfoundland and Labrador 33,847 32,770 32,519 30,854 30,058
Alberta 1,477 1,496 1,354 1,259 973
British Columbia 1,008 1,047 1,007 958 864
Manitoba 165 162 146 135 117
New Brunswick 596 604 568 558 451
Nova Scotia 1,718 1,750 1,648 1,539 1,325
Northwest Territories 175 176 165 164 134
Nunavut 12 - - - -
Ontario 4,924 4,964 4,536 4,255 3,851
Prince Edward Island 182 174 158 129 114
Quebec 337 371 330 311 281
Saskatchewan 113 119 117 116 97
Yukon 25 26 27 22 22
United States 1,160 1,129 1,000 922 709
Other Countries 868 800 818 796 722
Total* 46,607 45,588 44,393 42,018 39,718
* Since 1949, Memorial has awarded over 68,000 degrees.

62 Memorial University of Newfoundland Fact Book 2002
Table 25 Total Institutional Support
2001-02 2000-01 1999-00 1998-99 1997-98
Individuals - Alumni $686,508 $1,169,760 $1,167,365 $731,927 $519,449
- Other 938,998 832,698 477,408 419,024 431,948
Corporations 1,581,054 2,086,210 3,364,409 2,374,268 2,391,402
Charitable/family foundations 996,490 522,352 140,025 663,933 741,816
Other charitable organizations/associations 268,362 224,615 157,809 308,430 143,225
Total ^ $4,471,412 $4,835,635 $5,307,016 $4,497,582 $4,227,840
^ Figures do not include pledges made for future years: $3,897,327.
Gift Designations
2001-02 2000-01 1999-00 1998-99 1997-98
Equipment $450 $2,300 $15,884 $107,606 $439
Faculty/School/College 983,702 383,053 271,072 267,871 374,216
Library 737,388 245,758 553,906 94,620 102,699
Physical Plant 110,511 83,120 110,064 464,680 616,143
Research 614,697 840,842 1,589,867 694,298 528,343
Student Aid 1,395,395 2,512,391 1,703,686 1,827,921 1,352,287
Unrestricted 349,277 608,452 911,650 829,248 1,126,464
Other designations 279,992 159,719 150,887 211,338 127,249
Total ~ $4,471,412 $4,835,635 $5,307,016 $4,497,582 $4,227,840
~ All gifts receipted from January 1, 1995 to December 31, 2000 have been counted in support of The Opportunity Fund.
Memorial University of Newfoundland Fact Book 2002 63
Human Resources
Profile
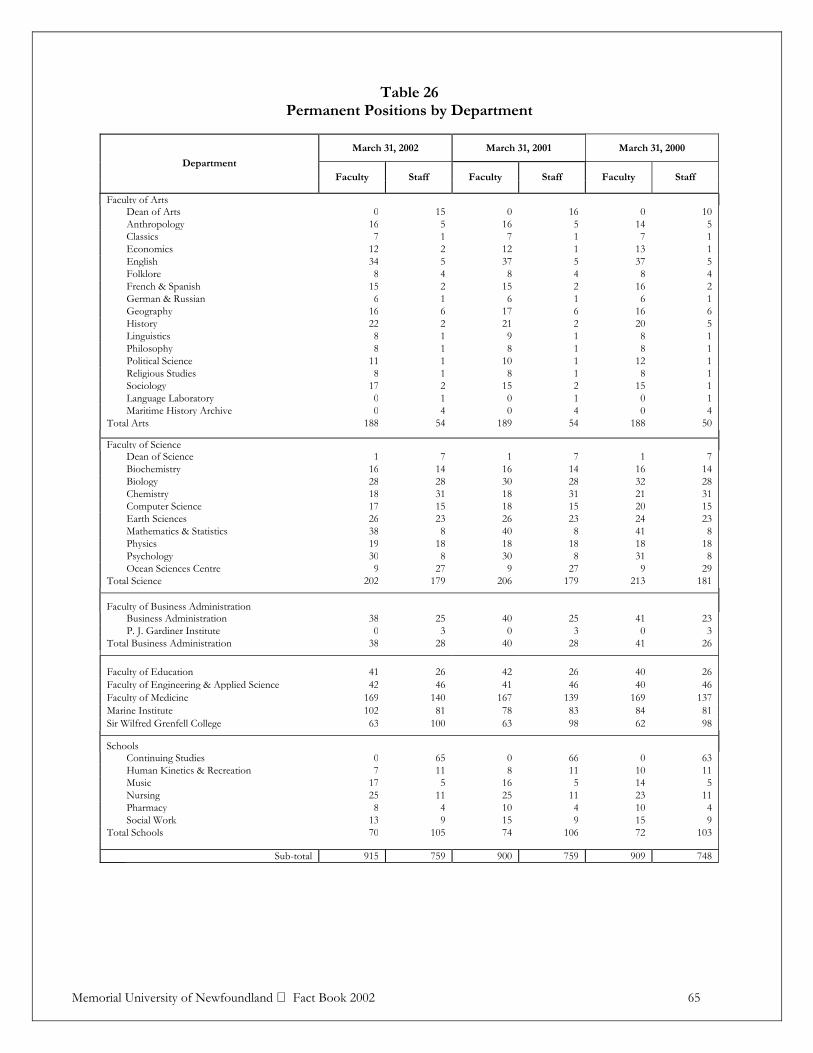
Memorial University of Newfoundland Fact Book 2002 65
Table 26 Permanent Positions by Department
March 31, 2002 March 31, 2001 March 31, 2000 Department
Faculty Staff Faculty Staff Faculty Staff Faculty of Arts
Dean of Arts 0 15 0 16 0 10Anthropology 16 5 16 5 14 5Classics 7 1 7 1 7 1Economics 12 2 12 1 13 1English 34 5 37 5 37 5Folklore 8 4 8 4 8 4French & Spanish 15 2 15 2 16 2German & Russian 6 1 6 1 6 1Geography 16 6 17 6 16 6History 22 2 21 2 20 5Linguistics 8 1 9 1 8 1Philosophy 8 1 8 1 8 1Political Science 11 1 10 1 12 1Religious Studies 8 1 8 1 8 1Sociology 17 2 15 2 15 1Language Laboratory 0 1 0 1 0 1Maritime History Archive 0 4 0 4 0 4
Total Arts 188 54 189 54 188 50
Faculty of Science Dean of Science 1 7 1 7 1 7Biochemistry 16 14 16 14 16 14Biology 28 28 30 28 32 28Chemistry 18 31 18 31 21 31Computer Science 17 15 18 15 20 15Earth Sciences 26 23 26 23 24 23Mathematics & Statistics 38 8 40 8 41 8Physics 19 18 18 18 18 18Psychology 30 8 30 8 31 8Ocean Sciences Centre 9 27 9 27 9 29
Total Science 202 179 206 179 213 181
Faculty of Business Administration Business Administration 38 25 40 25 41 23P. J. Gardiner Institute 0 3 0 3 0 3
Total Business Administration 38 28 40 28 41 26
Faculty of Education 41 26 42 26 40 26Faculty of Engineering & Applied Science 42 46 41 46 40 46Faculty of Medicine 169 140 167 139 169 137Marine Institute 102 81 78 83 84 81Sir Wilfred Grenfell College 63 100 63 98 62 98
Schools Continuing Studies 0 65 0 66 0 63Human Kinetics & Recreation 7 11 8 11 10 11Music 17 5 16 5 14 5Nursing 25 11 25 11 23 11Pharmacy 8 4 10 4 10 4Social Work 13 9 15 9 15 9
Total Schools 70 105 74 106 72 103
Sub-total 915 759 900 759 909 748

66 Memorial University of Newfoundland Fact Book 2002
Table 26 - continued
Permanent Positions by Department
March 31, 2002 March 31, 2001 March 31, 2000 Department
Faculty Staff Faculty Staff Faculty Staff Student Services
Bookstore 0 14 0 16 0 15Counselling Centre 4 5 4 4 4 4Student Support Programs ^ 0 9 0 8 0 8Student Affairs & Services 0 3 0 4 0 4Student Development 0 6 0 7 0 7Student Health Services 0 4 0 4 0 4Housing, Food and Conference Services 0 16 0 16 0 15
Total Student Services 4 57 4 59 4 57
Academic Support Animal Care Services 0 17 0 18 0 17Co-operative Education 0 4 0 4 0 4Graduate Studies 0 13 0 13 0 13Library 26 98 27 98 27 98Technical Services 0 99 0 99 0 98
Total Academic Support 26 231 27 232 27 230
Research Inst. for Social & Economic Research 0 2 0 2 0 5Office of Research 0 8 0 2 0 8Vice-President (Research) 0 2 0 2 0 2
Total Research 0 12 0 6 0 15
Administrative Units Alumni Affairs & Development 0 11 0 11 0 11Board of Regents 0 1 0 1 0 1Computing & Communications 0 65 0 65 0 63Facilities Management 0 283 0 296 0 268Financial and Administrative Services 0 85 0 83 0 82Human Resources 0 48 0 48 0 48Institutional Analysis & Planning 0 6 0 6 0 6Internal Audits 0 4 0 7 0 7Labour Relations 0 3 0 4 0 4President’s Office 0 5 0 5 0 5Office of the Registrar 0 47 0 47 0 46University Relations 0 22 0 22 0 22Vice-President (Academic) 0 4 0 4 0 4Vice-President (Admin. & Finance) 0 4 0 4 0 4
Total Administrative Units 0 588 0 603 0 571
Community Services Art Gallery 0 9 0 9 0 9Botanical Garden 0 5 0 5 0 5Labrador Institute for Northern Studies 0 3 0 3 0 3Memorial University Recreation Centre~ 0 23 0 23 0 23
Total Community Services 0 40 0 40 0 40
Grand Total * 945 1,687 931 1,699 940 1,661
* All academic administrative positions above the level of department head are designated as staff positions.
Professional librarians who are members of MUNFA are listed as faculty.
Includes only vacant staff positions. All vacant faculty positions are transferred to the Vice-President (Academic).
^ As of March 31st 2002, the former categories of General Student Services and Thomson Student Centre are grouped under the new category of Student Support Programs.
~ Memorial University Recreation Centre replaces the former category of Canada Games Park.

Memorial University of Newfoundland Fact Book 2002 67
Table 27 University Employees by Pay Group
March 31, 2002 March 31, 2001 March 31, 2000
Pay Group * Permanent Contractual Permanent Contractual Permanent Contractual
CUPE 659 198 661 186 592 139
CUPE - Canada Games Park 0 194 9 140 10 131
NAPE - Custodial 89 23 80 38 79 33
NAPE - Maintenance 78 17 79 20 76 24
NAPE - Security 45 21 42 18 45 15
NAPE - Marine Institute (MI) 61 24 63 23 64 22
Non-Bargaining - CGPark 0 16 9 4 6 1
Non-Bargaining – MI 5 3 5 3 5 3
Non-Bargaining MS 207 247 204 233 276 236
Non-Bargaining SM 13 0 12 0 12 0
Unclassified 1 96 1 53 1 53
Management 94 6 95 10 91 6
Management (MI) 15 5 15 5 12 6
Executive 41 0 34 0 41 0
Professional 71 29 72 34 94 33
Total Staff 1,379 879 1,381 767 1,404 702
Faculty – MUNFA 686 91 685 70 688 58
Faculty – Non-Bargaining 108 155 108 145 107 149
Faculty – Clinical 0 260 0 243 0 206
Faculty – Adjuncts 0 158 0 148 0 129
Faculty – Department Heads 66 0 68 0 68 0
Faculty – Exceptions 0 19 0 16 0 16
Instructors – MI (NAPE) 99 69 75 86 84 69
Total Faculty/Instructors 959 752 936 708 947 627
Sub-total 2,338 1,631 2,317 1,475 2,351 1,329
Agencies 0 176 0 164 0 157
Students 0 2,205 0 2,376 0 2,458
Grand Total 2,338 4,012 2,317 4,015 2,351 3,944
* Includes permanent, contractual and temporary employees. Does not include employees on long-term disability.

68 Memorial University of Newfoundland Fact Book 2002
Table 28 Academic Staff by Rank and Gender
Full-time March 31, 2002 March 31, 2001 March 31, 2000
F M F M F M
Rank
Full Professor 38 271 33 272 27 267
Associate Professor 114 236 110 252 113 254
Assistant Professor 98 118 80 103 76 95
Lecturer 18 7 19 13 1 1
Instructors Marine Institute^ 28 123 24 117 20 116
Librarian 29 10 31 10 29 8
Total 325 765 297 767 266 741
Part-time March 31, 2002 March 31, 2001 March 31, 2000
F M F M F M
Rank
Full Professor 0 0 0 0 0 1
Associate Professor 7 1 5 1 0 6
Assistant Professor 3 1 3 1 12 12
Lecturer 1 0 0 0 22 10
Instructors Marine Institute^ 1 16 1 19 1 16
Librarian 0 0 0 0 1 1
Total 12 18 9 21 36 46
^ Includes instructors, demonstrators and technical assistants.
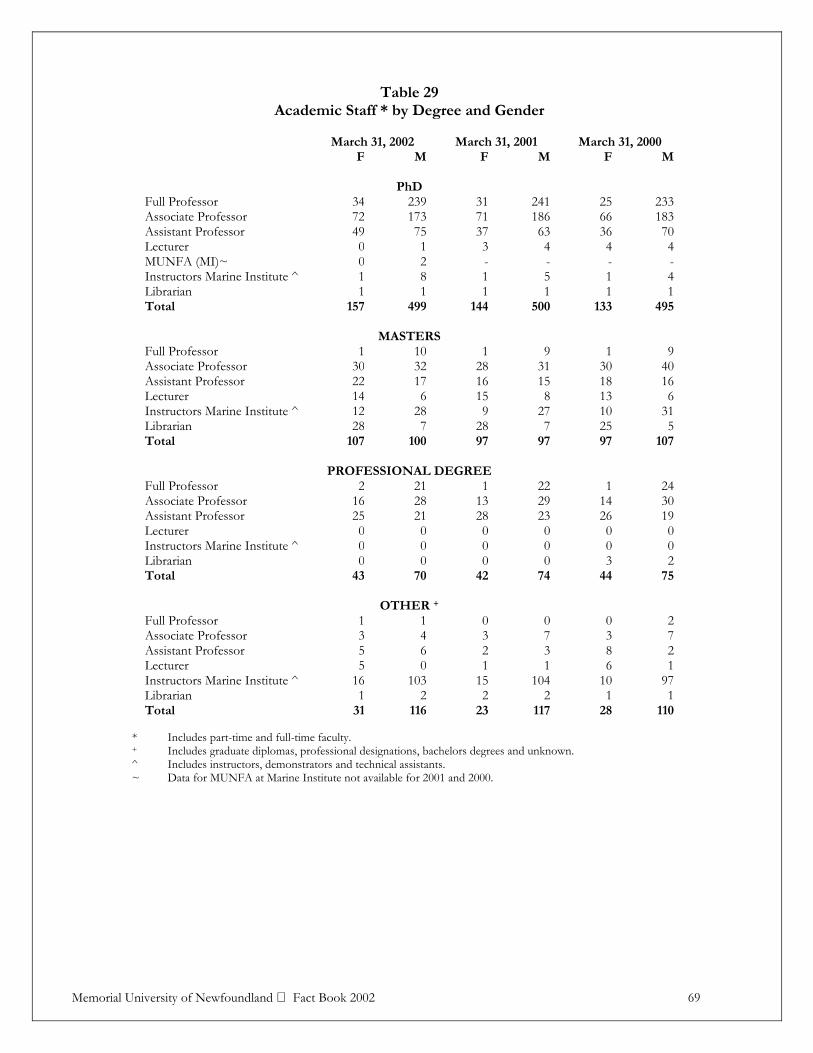
Memorial University of Newfoundland Fact Book 2002 69
Table 29 Academic Staff * by Degree and Gender
March 31, 2002 March 31, 2001 March 31, 2000 F M F M F M
PhD Full Professor 34 239 31 241 25 233Associate Professor 72 173 71 186 66 183Assistant Professor 49 75 37 63 36 70Lecturer 0 1 3 4 4 4MUNFA (MI)~ 0 2 - - - -Instructors Marine Institute ^ 1 8 1 5 1 4Librarian 1 1 1 1 1 1Total 157 499 144 500 133 495
MASTERS Full Professor 1 10 1 9 1 9Associate Professor 30 32 28 31 30 40Assistant Professor 22 17 16 15 18 16Lecturer 14 6 15 8 13 6Instructors Marine Institute ^ 12 28 9 27 10 31Librarian 28 7 28 7 25 5Total 107 100 97 97 97 107
PROFESSIONAL DEGREE Full Professor 2 21 1 22 1 24Associate Professor 16 28 13 29 14 30Assistant Professor 25 21 28 23 26 19Lecturer 0 0 0 0 0 0Instructors Marine Institute ^ 0 0 0 0 0 0Librarian 0 0 0 0 3 2Total 43 70 42 74 44 75
OTHER + Full Professor 1 1 0 0 0 2Associate Professor 3 4 3 7 3 7Assistant Professor 5 6 2 3 8 2Lecturer 5 0 1 1 6 1Instructors Marine Institute ^ 16 103 15 104 10 97Librarian 1 2 2 2 1 1Total 31 116 23 117 28 110
* Includes part-time and full-time faculty. + Includes graduate diplomas, professional designations, bachelors degrees and unknown. ^ Includes instructors, demonstrators and technical assistants. ~ Data for MUNFA at Marine Institute not available for 2001 and 2000.

70 Memorial University of Newfoundland Fact Book 2002
Table 30 Average Salaries^ of Full-time Academic Staff
By Faculty and School
Faculty and School March 31, 2002 March 31, 2001 March 31, 2000
Faculty of Arts $75,384 $73,890 $62,758Faculty of Education 76,467 73,402 63,128Faculty of Science 79,434 77,232 66,078School of Human Kinetics & Recreation 65,087 62,129 56,377Library 64,522 62,766 56,886Sir Wilfred Grenfell College 67,982 65,583 52,741Faculty of Engineering & Applied Science 76,710 74,100 67,402Faculty of Business Administration 77,500 73,989 64,470School of Social Work 78,090 75,013 63,476School of Music 65,495 59,364 48,230Counselling Centre 64,034 60,780 50,774Faculty of Medicine 69,580 68,453 61,406School of Nursing 68,101 65,147 54,299School of Pharmacy 70,064 70,421 60,067
^ Does not include Management and Executive (Pay Groups 50 and 60). Does not include Adjuncts and Clinicals (Pay Groups 72 and 73). Does not include Lecturer (Sessional) classes.
By Rank and Gender
March 31, 2002 March 31, 2001 March 31, 2000
Rank + F M F M F M
Full Professor $84,025 $87,162 $80,589 $84,945 $71,953 $76,036Associate Professor 69,993 72,658 68,235 70,932 60,736 63,097Assistant Professor 55,627 59,375 54,787 57,551 47,705 49,887Lecturer - - * * * * Librarian I 41,405 41,405 n/a n/a n/a n/aLibrarian II 51,312 53,564 49,526 51,181 44,944 46,640Librarian III 60,319 60,769 61,243 60,449 55,685 51,728 Librarian IV 73,517 72,140 71,855 69,386 67,555 64,194
+ Table contains permanent regular appointments. * Only one employee in this category. Salary not stated.
Memorial University of Newfoundland Fact Book 2002 71
Library
Profile

Memorial University of Newfoundland Fact Book 2002 73
Table 31 Library Holdings
Number of holdings* at the end of fiscal year 2001-02 2000-01 1999-00 1998-99 1997-98
Volumes of print materials
Total 1,740,065 1,724,807 1,682,821 1,645,864 1,604,215
Micro-materials
Microfilm (reels) 78,274 77,938 76,891 76,225 75,264
Microfiche (items unconverted to volume equivalents) 2,699,110 2,660,062 2,620,648 2,588,986 2,540,158
Micro-materials (converted to volume equivalents) 2,772,974^ 1,977,982 1,948,782 1,925,501 1,889,663
Non-print materials (excluding microforms)
Audio-visual holdings (titles) 18,566 18,867 18,607 18,214 17,970
Machine-readable holdings 3,653 3,110 2,239 1,492 1,149
Maps (sheets, etc.) 92,152 90,424 89,623 88,415 87,399
Drawings (ship blueprints) 4,644 4,534 4,534 4,500 4,500
Current serial titles (excluding government document serials or duplicates)
9,923 9,702 8,539 8,815 9,730
* Library holdings include: Queen Elizabeth II Library Health Sciences Library Music Resource Centre Sir Wilfred Grenfell College Library Exclude: Curriculum Materials Centre
^ The significant increase in 2001-2002 can be attributed to an adjustment that was made to the Health Sciences Library micro-materials information.
Recommended