Embed Size (px)
Citation preview
Memorial University of Newfoundland ENG 8926: Mechanical Design Project II
Mini Report #1
Vortex Wind Systems H.A.W.T Research, Design and Development
February 7th, 2014
Dan Follett - 200559359 Scott Guilcher - 200915585 Jeremy Tibbo - 200902690
Group M9

i | P a g e
Table of Contents
1 Introduction ............................................................................................................................. 1
2 Project Definition ..................................................................................................................... 1
3 Project Management Plan ....................................................................................................... 2
4 Market Analysis ....................................................................................................................... 2
5 Environmental Analysis ........................................................................................................... 3
6 Tool Evaluation ........................................................................................................................ 5
7 Prototyping Methods .............................................................................................................. 7
8 Testing Options ........................................................................................................................ 8
9 Conclusion ............................................................................................................................... 9
10 Works Cited ........................................................................................................................ 10
Appendices ...................................................................................................................................... iii
A1 – Market Analysis ................................................................................................................... iv
A2 – PROP-ID Inputs and Outputs ................................................................................................ v
A3 – Project Management Plan .................................................................................................. vi
ii | P a g e
List of Figures
Figure 1 - 30 Meter Elevation Wind Map of Newfoundland (Environment Canada, 2011) ........... 4
Figure 2 - Annual Distribution of Wind Direction (Diebel & Norda, 2013) ..................................... 4
Figure 3 - Annual Temperature Distribution 2013 (Diebel & Norda, 2013) ................................... 5
Figure 4 - Previously Fabricated Rapid Prototype ABS Blade ......................................................... 7
Figure 5 - Wind Tunnel Apparatus .................................................................................................. 8
1 | P a g e
1 Introduction
Residents of Newfoundland and Labrador are very familiar with cabin and cottage
lifestyles. Generally most residents power their retreat locations most commonly with
generators with the exception of some solar applications. These are can be costly. Due to rising
costs, generators can be expensive and a hassle as gasoline is needed each time the owner
would like to power there cabin. Most of these cabins are in remote locations where
transporting gasoline can be difficult and time consuming. Burning fuel also causes damage to
the earth’s atmosphere. Solar energy although much better than generators environmentally,
can pose high capital costs in comparison to a small wind turbine.
With the implementation of a simple, robust small horizontal axis wind turbine [HAWT],
owners can leave their cabin and return on weekends with the necessary power already stored
in batteries. Creating a low cost but effective turbine would allow for it to be a cost effective
and environmentally friendly solution to powering cottages and cabins in Newfoundland and
Labrador.
Vortex Wind Systems is in the process of designing a small wind turbine which will supply
the necessary power needed for a cabin or cottage. The target cabins are in remote areas
where connecting to the electrical grid is not an option therefore all power will be stored and
not added to the grid. The turbine will be sized in accordance to the power demands required
for powering lights, radio and other small appliances. Heat, stove, oven and large appliances
such as washers and dryers are rarely found in a remote cabin therefore it is not necessary to
accommodate their power demands.
2 Project Definition
The focus of the design project is to create a horizontal axis wind turbine capable of
providing power to a cabin to operate lights, radio, and other small appliances. Targeted users
would be located on the island of Newfoundland and require the power only during the
weekends; with the turbine generating and storing power throughout the week. Environmental
factors will be a major contributing factor in the design and operability of the system.
2 | P a g e
Optimization of the blades is a primary focus to ensure that the unique wind characteristics
of the island are used to their full potential and provide a dominant power curve in comparison
to the competitors. Harsh weather conditions on the island impose a higher risk of structural
and functional failure that will be mitigated through a robust and creative design. The final
result will be a turbine designed to withstand and optimized rural cabins of Newfoundland.
3 Project Management Plan
The project is separated into three phases: Front End Engineering and Design [FEED],
Detailed Engineering and Close Out. This report focuses on the Front End Engineering and
Design; a comprehensive research phase with the goal of developing initial design criteria. The
primary tasks completed, as highlighted by the Gantt chart in Appendix A3 were a Market
Analysis, an Environmental Study, Engineering Tool Development, and Prototype Method
research. The research completed in this phase has allowed for a clear path forward allowing
the team to successfully move from the FEED and into Detailed Engineering.
4 Market Analysis
In an effort to narrow down the design scope and size of the HAWT that we would pursue,
we began by conducting a market analysis of existing HAWTs within the industry on both a local
and international scale. By first looking into the scale of various global projects we were able to
conclude that a 500W HAWT would best suit a small cabin or cottage with low power demands
(500W Wind Turbine Projects, 2012). By then researching local contracts for existing HAWTs we
were able to not only see how existing HAWTs tie in with a cabins electrical set up but also
identify various challenges and obstacles that present themselves given Newfoundland’s
inclement weather.
We were able to determine that most cabins use a simple set up of a HAWT housing a
generator which runs to a inverter and subsequent multiple battery cell system for easy storage
so we ignored this going forward. We then determined that in an effort to not only create a
more efficient but robust HAWT, the following issues would need to be addressed:
3 | P a g e
Ice Control
Over Speed Control
Lightning Protection
Sub Zero Temperatures
Wildlife
Noise Control
We will discuss these topics further in Mini Report #2 as we continue to conduct more
research with respect to Newfoundland’s environmental conditions while developing our own
concept.
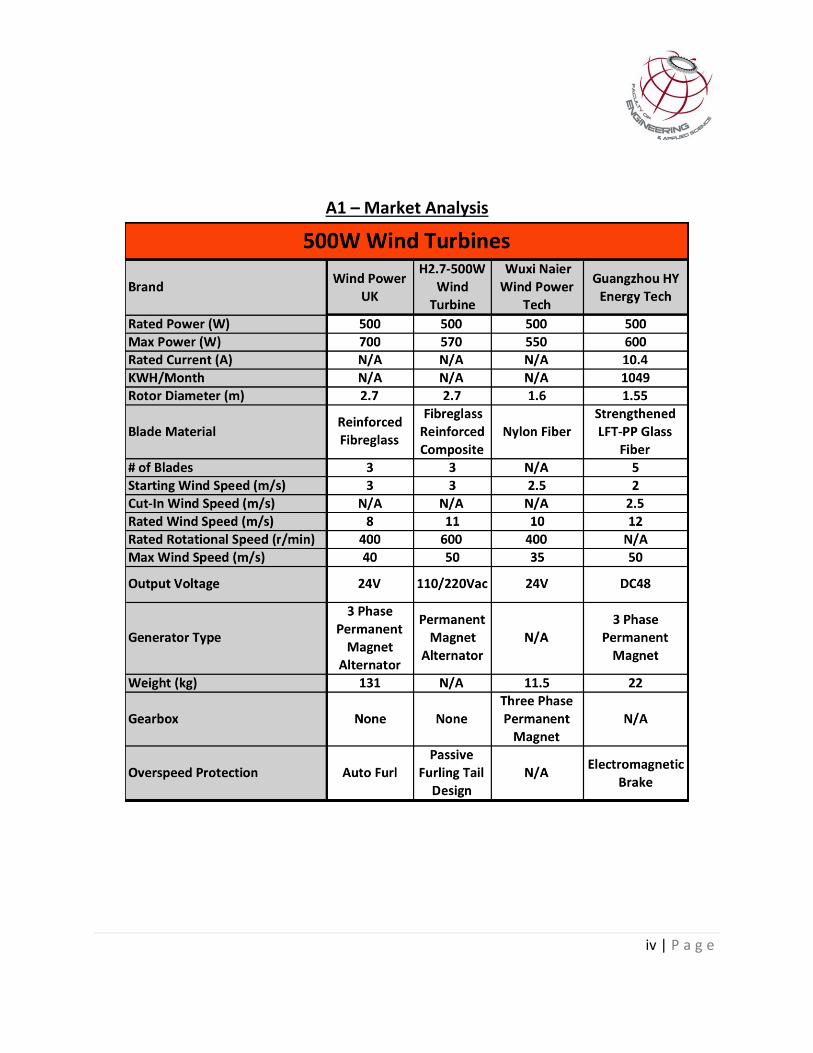
In establishing through our preliminary market analysis that we would design a 500W
HAWT, we then conducted a market comparison of existing of current models being offered to
establish some direction going forward. As shown below in Appendix A1, we included four of
the ten 500W turbines we compared which gave us the various specifications.
With this information we can then use the physical attributes above such as blade length
and material to guide our prototyping and testing methods while taking the start-up, cut-in and
max wind speed in addition to the rotational speed to tie in with our environment analysis and
again our testing methods.
5 Environmental Analysis
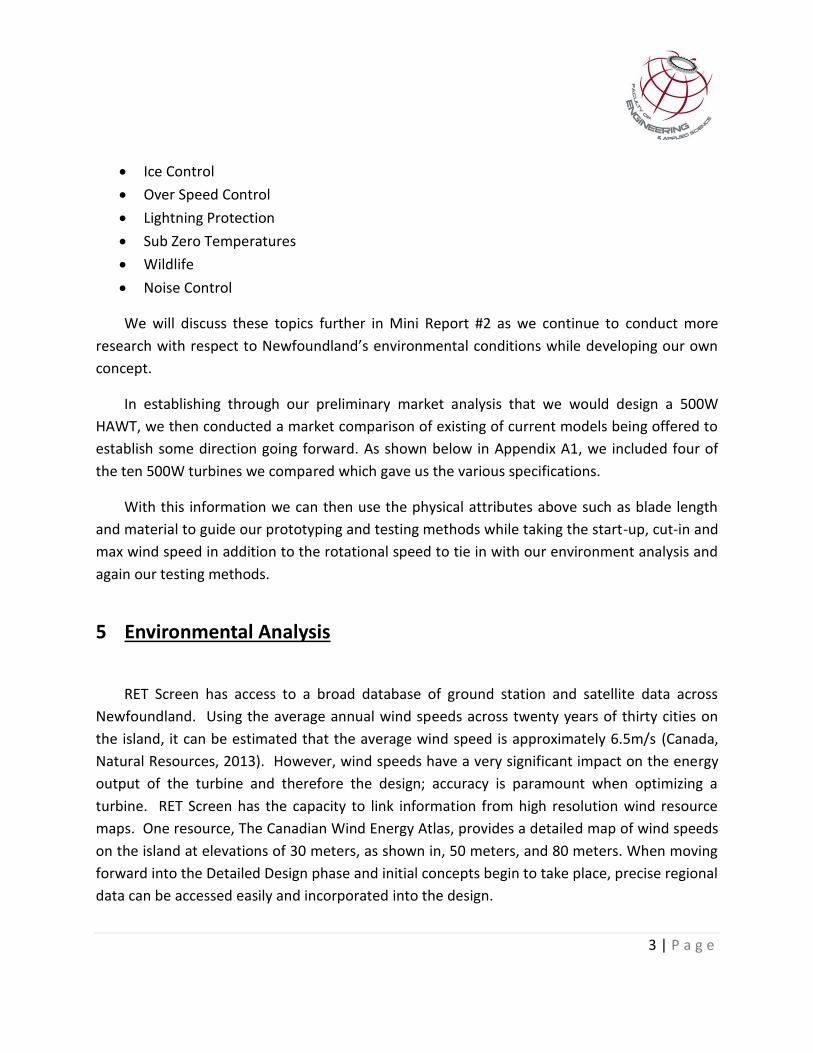
RET Screen has access to a broad database of ground station and satellite data across
Newfoundland. Using the average annual wind speeds across twenty years of thirty cities on
the island, it can be estimated that the average wind speed is approximately 6.5m/s (Canada,
Natural Resources, 2013). However, wind speeds have a very significant impact on the energy
output of the turbine and therefore the design; accuracy is paramount when optimizing a
turbine. RET Screen has the capacity to link information from high resolution wind resource
maps. One resource, The Canadian Wind Energy Atlas, provides a detailed map of wind speeds
on the island at elevations of 30 meters, as shown in, 50 meters, and 80 meters. When moving
forward into the Detailed Design phase and initial concepts begin to take place, precise regional
data can be accessed easily and incorporated into the design.
4 | P a g e
Figure 1 - 30 Meter Elevation Wind Map of Newfoundland (Environment Canada, 2011)
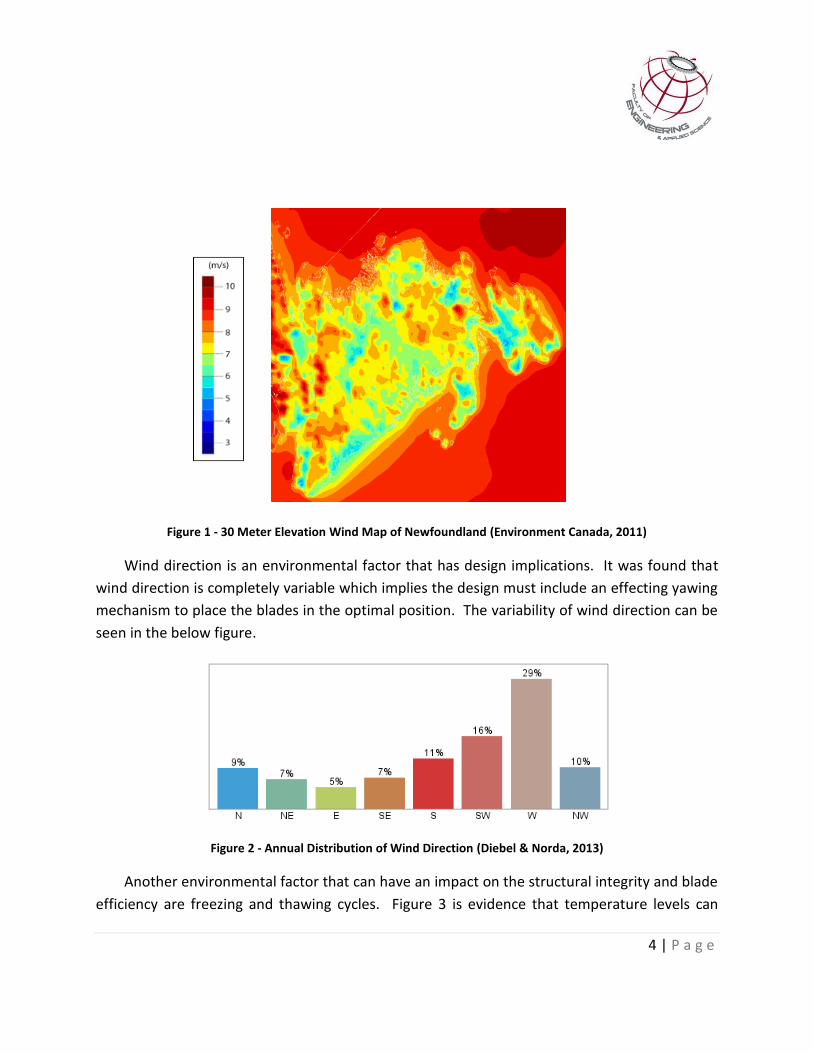
Wind direction is an environmental factor that has design implications. It was found that
wind direction is completely variable which implies the design must include an effecting yawing
mechanism to place the blades in the optimal position. The variability of wind direction can be
seen in the below figure.
Figure 2 - Annual Distribution of Wind Direction (Diebel & Norda, 2013)
Another environmental factor that can have an impact on the structural integrity and blade
efficiency are freezing and thawing cycles. Figure 3 is evidence that temperature levels can
5 | P a g e
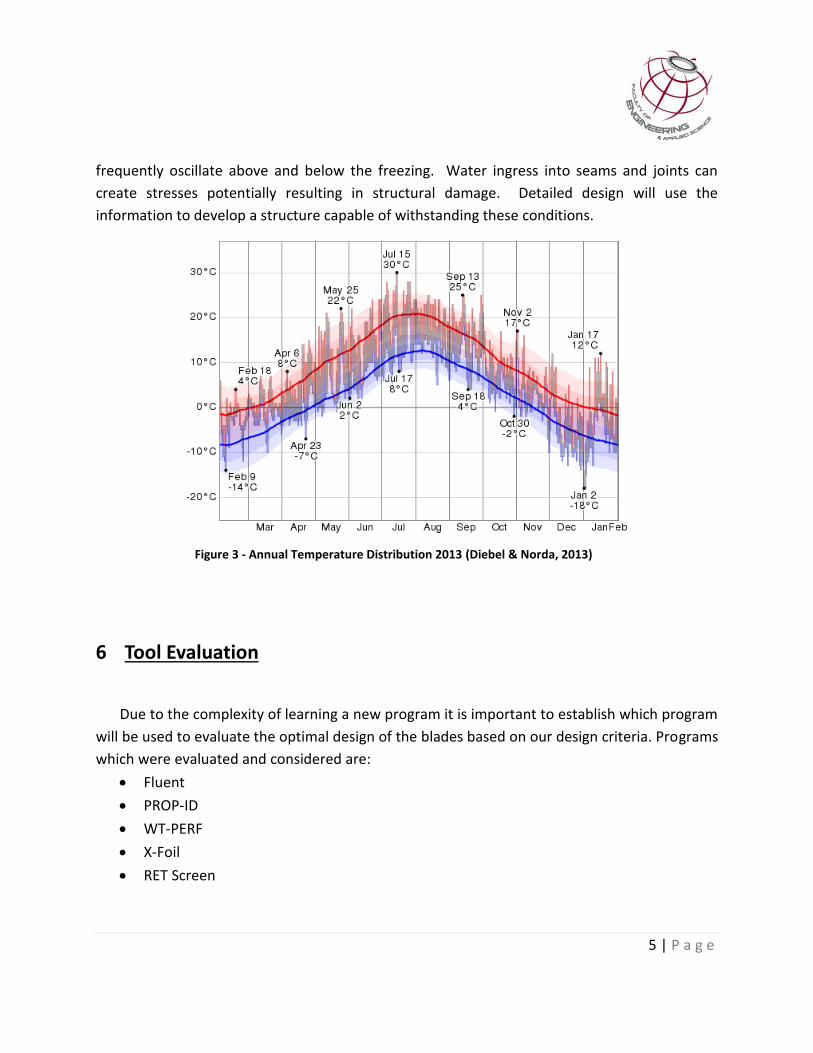
frequently oscillate above and below the freezing. Water ingress into seams and joints can
create stresses potentially resulting in structural damage. Detailed design will use the
information to develop a structure capable of withstanding these conditions.
6 Tool Evaluation
Due to the complexity of learning a new program it is important to establish which program
will be used to evaluate the optimal design of the blades based on our design criteria. Programs
which were evaluated and considered are:
Fluent
PROP-ID
WT-PERF
X-Foil
RET Screen
Figure 3 - Annual Temperature Distribution 2013 (Diebel & Norda, 2013)
6 | P a g e
After evaluating each software’s capabilities it was decided that Fluent or PROP-ID would be
suitable for the design of the turbine blades. Further narrowing it down, the final decision was
to use PROP-ID due to its upside. In comparison to Fluent, PROP-ID is believed to have a shorter
learning curve. Also PROP-ID is based on the blade element momentum theory and
incorporates stall regulated designs. Due to the scope of design and the attempt to keep the
design simple; the design will be made so that the blades will act under stall regulation at high
wind speeds for over speed protection.
To gain access to a copy of Fluent can be difficult and generally a Linux system is needed in
order to run the program. However PROP-ID can easily be downloaded from the University of
Illinois and is ran through the command window of any computer. Due to these reasons PROP-
ID is the final selection and is believed to be able to output all necessary information for an
optimal blade design based on design inputs. Some PROP-ID inputs are:
Tip loss effects
Hub loss effects
Air density
Stall regulation or non stall regulated options
Airfoil mode.
Number of blades
Outputs for the program consist of:
Blade design (twist, pitch, chord length etc)
Torque
Angle of attack
Lift, drag
Blade thickness
These are just a few examples of useful inputs and outputs available when using PROP-ID.
For more information and examples regarding input and output options refer to Appendix A2.
If needed for further evaluation of the blades, WT-PERF can be used for analysis purposes.
This has a limited amount of design capabilities in comparison to PROP-ID, however the analysis
functions may become useful if deemed necessary in future blade evaluations. WT-PERF is also
run through the command window of any computer and is free to download from the National
7 | P a g e
Renewable Energy Laboratory website. This will output torque, power curves and other forces
apparent on the turbine.
7 Prototyping Methods
In an effort to make a robust model capable of withstanding the environmental elements
in Newfoundland while still operating efficiently, a multitude of prototyping processes must be
considered with a budget in mind. Considering Memorial University’s access and availability
when it comes to in house materials and equipment we have chosen to stay in house for
prototyping considering the schedule and budgetary concerns involved in manufacturing a
working prototype in such a small window for testing.
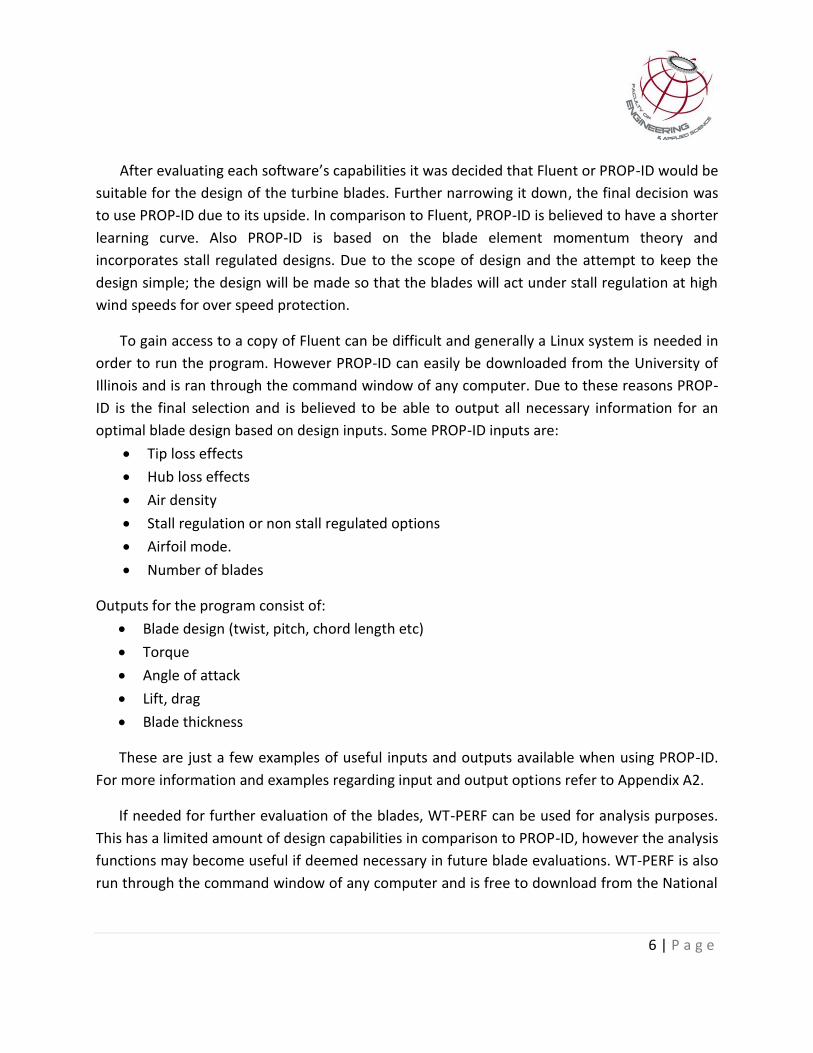
For us to create an accurate blade profile of our chosen design once created in SolidWorks,
we have chosen to use the rapid prototyping machine to fabricate the blade out of Acrylonitrile
butadiene styrene [ABS] in two pieces due to size restrictions to the machine.
ABS is a thermoplastic terpolymer created by polymerizing acrylonitrile and styrene in the
presence of polybutadiene. Due to a high enough glass transition temperature it is resistant to
unwanted deformation at elevated temperatures.
Figure 4 - Previously Fabricated Rapid Prototype ABS Blade
8 | P a g e
Once complete we will mate the two sections together to form one master model for
reproduction through the utilization of a reusable silicon injection mold using resin as our
material. The intention for this is that the cost of using the rapid prototyping machine at
roughly $10/hr for all three blades would go well beyond our budget so we have evaluated
other means for reproducing our blades. Silicon can be purchased and cast around our master
model with relative ease while injecting resin into the mold for a lightweight supplicate at a
much lower cost than ABS (Prototyping Processes , 2010).
8 Testing Options
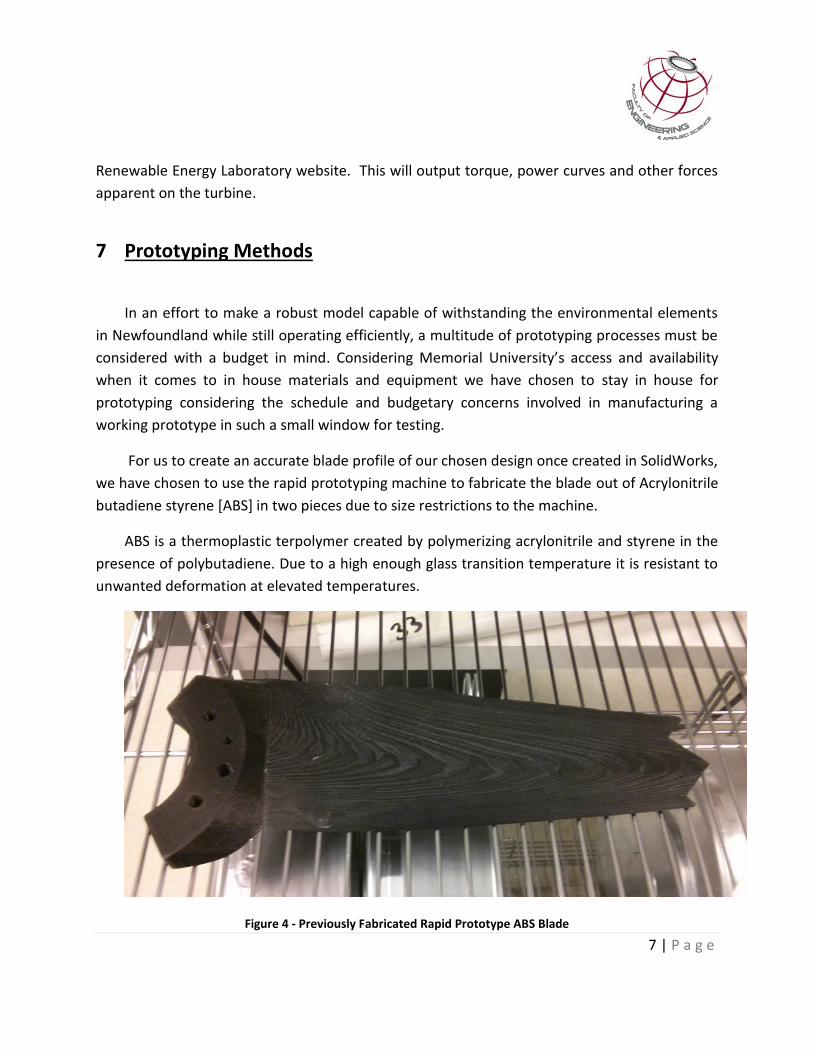
Two preliminary testing options have been considered at this point. Wind tunnel testing or
creating an outdoor prototype are the current proposed options. It is important to evaluate the
pros and cons of both of these to understand which option is appropriate in the short time
frame given and limited budget.
Figure 5 - Wind Tunnel Apparatus
Testing in the wind tunnel would be a cheaper option. It would also allow for the testing to
be performed at controlled wind speeds. Being able to control the wind speed would give a vast
9 | P a g e
amount of data points at any desired wind speed. However testing in this manner is limited due
to the size restriction. The wind tunnel only consists of a 4’ by 3’ cross sectional area which
would limit the size of the blade design. See Figure 5 - Wind Tunnel ApparatusFigure 5 for the
wind tunnel setup.
Furthermore, developing an outdoor prototype would allow for a realistic evaluation of the
wind turbine. It would allow for the turbine to experience changing wind directions and the
yawing action of the turbine could then be observed. It would also allow for the turbine to
experience the harsh Newfoundland weather environment. However, creating this type of
prototype on a limited budget may prove to be difficult. Also with a limited time restriction on
the project it may be time consuming to implement a prototype of this nature.
Both testing options have positive and negative aspects. Further evaluation will be needed
to which option will be the most suitable for Vortex Wind Systems. After the blades are
designed, a testing plan will be developed in accordance to the available budget and time
remaining in the project. This could be a combination of both options or simply one or the
other.
9 Conclusion
Resulting from the studies completed during FEED, the turbine will have the following
specifications:
Sizing: 500W
Downwind orientation
3 blade configuration
Fixed pitch
Active yaw
Stall regulated
With the successful completion off FEED the team will move forward with the Detailed
Design phase. Using PROP-ID the blades will be design and optimized using the results from the
environmental study and will follow our specified design focus.
10 | P a g e
10 Works Cited 500W Wind Turbine Projects. (2012). Retrieved from Hummer Small Wind Power:
www.hummerwindenergy.com/global-projects_5/500w-wind-turbine-projects_22
Canada, Natural Resources. (2013, August 28). RETScreen International. (Natural Resources
Canada) Retrieved 02 5, 2013, from http://www.retscreen.net/ang/home.php
Diebel, J., & Norda, J. (2013, 02 5). WeatherSpark. (Cedar Lake Ventures Inc) Retrieved 02 5,
2013, from http://weatherspark.com/
Environment Canada. (2011, March 10). Canadian Wind Energy Atlas. (Environment Canada)
Retrieved 02 5, 2013, from http://www.windatlas.ca/en/index.php
Jones, D. A. (1996). Principles and Prevention of Corrosion. Upper Saddle River, NJ, USA:
Prentice Hall.
PROP-ID Program and Information. (2011). Retrieved from UIUC Applied Aerodynamics Group:
http://aerospace.illinois.edu/m-selig/propid.html
Prototyping Processes . (2010). Retrieved from Freemans Supply :
http://www.freemansupply.com
WT-PERF Program and Information. (2010). Retrieved from National Renewable Energy
Laboratory: http://wind.nrel.gov/desingcodes/simulators/wtperf/

iii | P a g e
Appendices
iv | P a g e
A1 – Market Analysis

v | P a g e
A2 – PROP-ID Inputs and Outputs
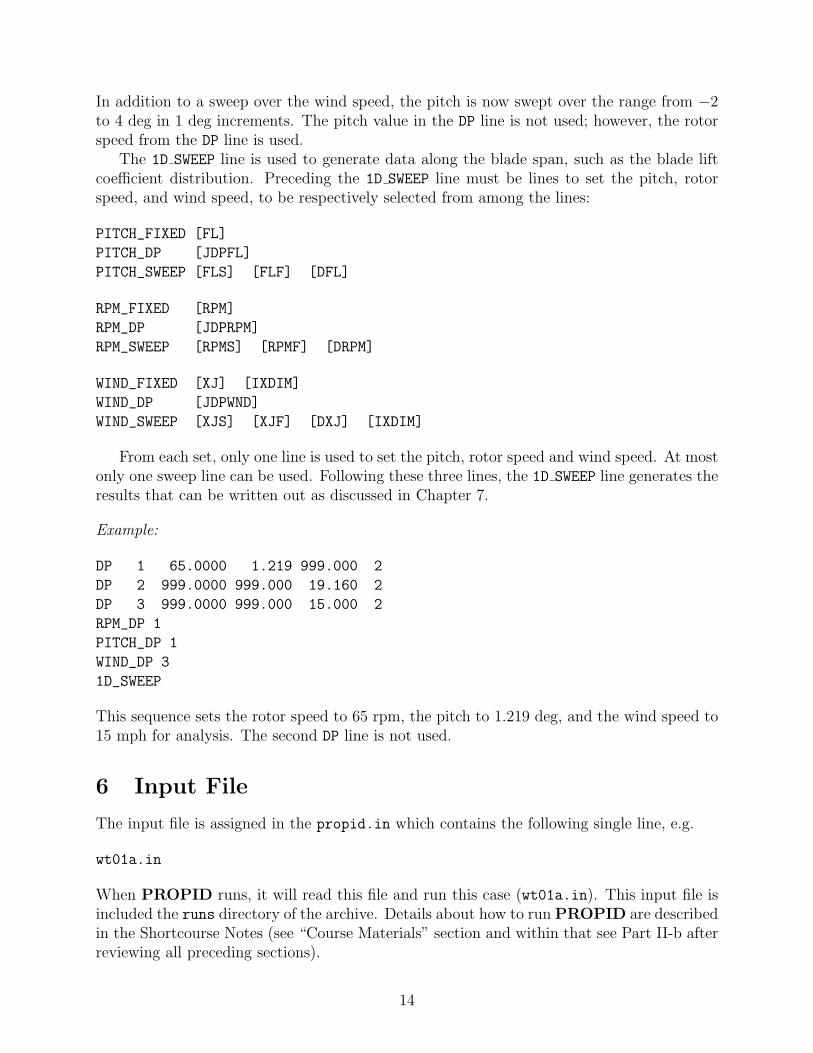
In addition to a sweep over the wind speed, the pitch is now swept over the range from −2to 4 deg in 1 deg increments. The pitch value in the DP line is not used; however, the rotorspeed from the DP line is used.
The 1D SWEEP line is used to generate data along the blade span, such as the blade liftcoefficient distribution. Preceding the 1D SWEEP line must be lines to set the pitch, rotorspeed, and wind speed, to be respectively selected from among the lines:
PITCH_FIXED [FL]
PITCH_DP [JDPFL]
PITCH_SWEEP [FLS] [FLF] [DFL]
RPM_FIXED [RPM]
RPM_DP [JDPRPM]
RPM_SWEEP [RPMS] [RPMF] [DRPM]
WIND_FIXED [XJ] [IXDIM]
WIND_DP [JDPWND]
WIND_SWEEP [XJS] [XJF] [DXJ] [IXDIM]
From each set, only one line is used to set the pitch, rotor speed and wind speed. At mostonly one sweep line can be used. Following these three lines, the 1D SWEEP line generates theresults that can be written out as discussed in Chapter 7.
Example:
DP 1 65.0000 1.219 999.000 2
DP 2 999.0000 999.000 19.160 2
DP 3 999.0000 999.000 15.000 2
RPM_DP 1
PITCH_DP 1
WIND_DP 3
1D_SWEEP
This sequence sets the rotor speed to 65 rpm, the pitch to 1.219 deg, and the wind speed to15 mph for analysis. The second DP line is not used.
6 Input File
The input file is assigned in the propid.in which contains the following single line, e.g.
wt01a.in
When PROPID runs, it will read this file and run this case (wt01a.in). This input file isincluded the runs directory of the archive. Details about how to run PROPID are describedin the Shortcourse Notes (see “Course Materials” section and within that see Part II-b afterreviewing all preceding sections).
14
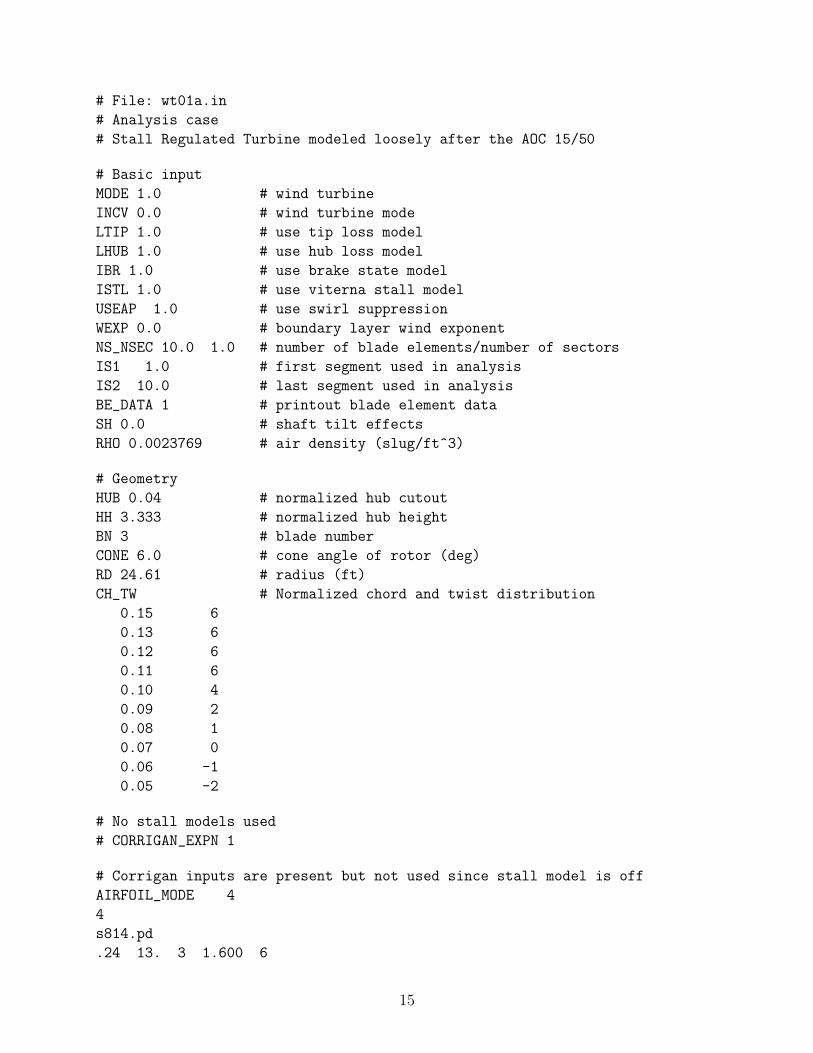
# File: wt01a.in
# Analysis case
# Stall Regulated Turbine modeled loosely after the AOC 15/50
# Basic input
MODE 1.0 # wind turbine
INCV 0.0 # wind turbine mode
LTIP 1.0 # use tip loss model
LHUB 1.0 # use hub loss model
IBR 1.0 # use brake state model
ISTL 1.0 # use viterna stall model
USEAP 1.0 # use swirl suppression
WEXP 0.0 # boundary layer wind exponent
NS_NSEC 10.0 1.0 # number of blade elements/number of sectors
IS1 1.0 # first segment used in analysis
IS2 10.0 # last segment used in analysis
BE_DATA 1 # printout blade element data
SH 0.0 # shaft tilt effects
RHO 0.0023769 # air density (slug/ft^3)
# Geometry
HUB 0.04 # normalized hub cutout
HH 3.333 # normalized hub height
BN 3 # blade number
CONE 6.0 # cone angle of rotor (deg)
RD 24.61 # radius (ft)
CH_TW # Normalized chord and twist distribution
0.15 6
0.13 6
0.12 6
0.11 6
0.10 4
0.09 2
0.08 1
0.07 0
0.06 -1
0.05 -2
# No stall models used
# CORRIGAN_EXPN 1
# Corrigan inputs are present but not used since stall model is off
AIRFOIL_MODE 4
4
s814.pd
.24 13. 3 1.600 6
15
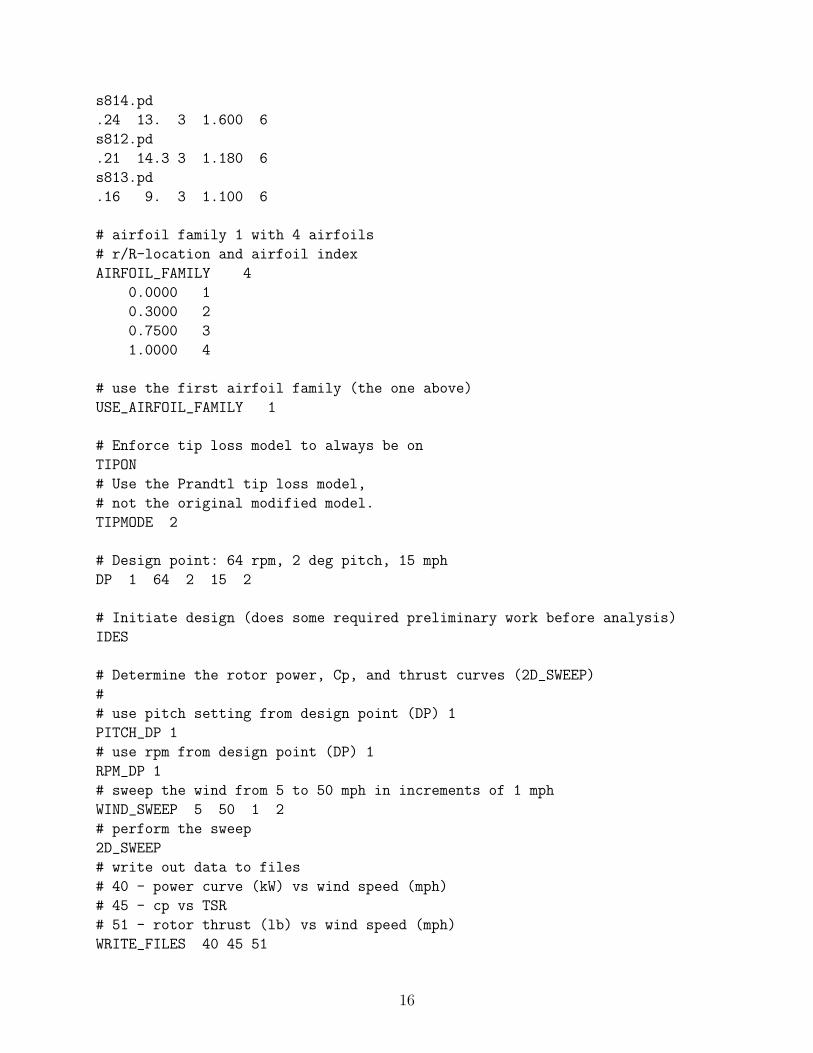
s814.pd
.24 13. 3 1.600 6
s812.pd
.21 14.3 3 1.180 6
s813.pd
.16 9. 3 1.100 6
# airfoil family 1 with 4 airfoils
# r/R-location and airfoil index
AIRFOIL_FAMILY 4
0.0000 1
0.3000 2
0.7500 3
1.0000 4
# use the first airfoil family (the one above)
USE_AIRFOIL_FAMILY 1
# Enforce tip loss model to always be on
TIPON
# Use the Prandtl tip loss model,
# not the original modified model.
TIPMODE 2
# Design point: 64 rpm, 2 deg pitch, 15 mph
DP 1 64 2 15 2
# Initiate design (does some required preliminary work before analysis)
IDES
# Determine the rotor power, Cp, and thrust curves (2D_SWEEP)
#
# use pitch setting from design point (DP) 1
PITCH_DP 1
# use rpm from design point (DP) 1
RPM_DP 1
# sweep the wind from 5 to 50 mph in increments of 1 mph
WIND_SWEEP 5 50 1 2
# perform the sweep
2D_SWEEP
# write out data to files
# 40 - power curve (kW) vs wind speed (mph)
# 45 - cp vs TSR
# 51 - rotor thrust (lb) vs wind speed (mph)
WRITE_FILES 40 45 51
16
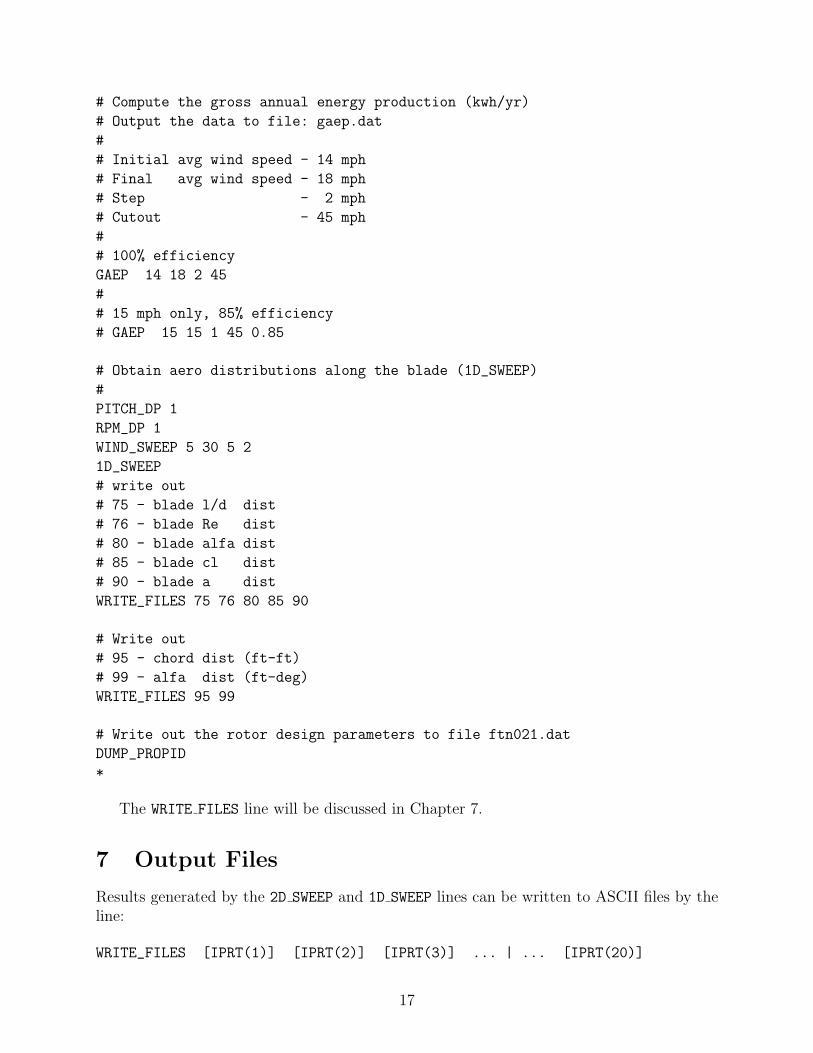
# Compute the gross annual energy production (kwh/yr)
# Output the data to file: gaep.dat
#
# Initial avg wind speed - 14 mph
# Final avg wind speed - 18 mph
# Step - 2 mph
# Cutout - 45 mph
#
# 100% efficiency
GAEP 14 18 2 45
#
# 15 mph only, 85% efficiency
# GAEP 15 15 1 45 0.85
# Obtain aero distributions along the blade (1D_SWEEP)
#
PITCH_DP 1
RPM_DP 1
WIND_SWEEP 5 30 5 2
1D_SWEEP
# write out
# 75 - blade l/d dist
# 76 - blade Re dist
# 80 - blade alfa dist
# 85 - blade cl dist
# 90 - blade a dist
WRITE_FILES 75 76 80 85 90
# Write out
# 95 - chord dist (ft-ft)
# 99 - alfa dist (ft-deg)
WRITE_FILES 95 99
# Write out the rotor design parameters to file ftn021.dat
DUMP_PROPID
*
The WRITE FILES line will be discussed in Chapter 7.
7 Output Files
Results generated by the 2D SWEEP and 1D SWEEP lines can be written to ASCII files by theline:
WRITE_FILES [IPRT(1)] [IPRT(2)] [IPRT(3)] ... | ... [IPRT(20)]
17
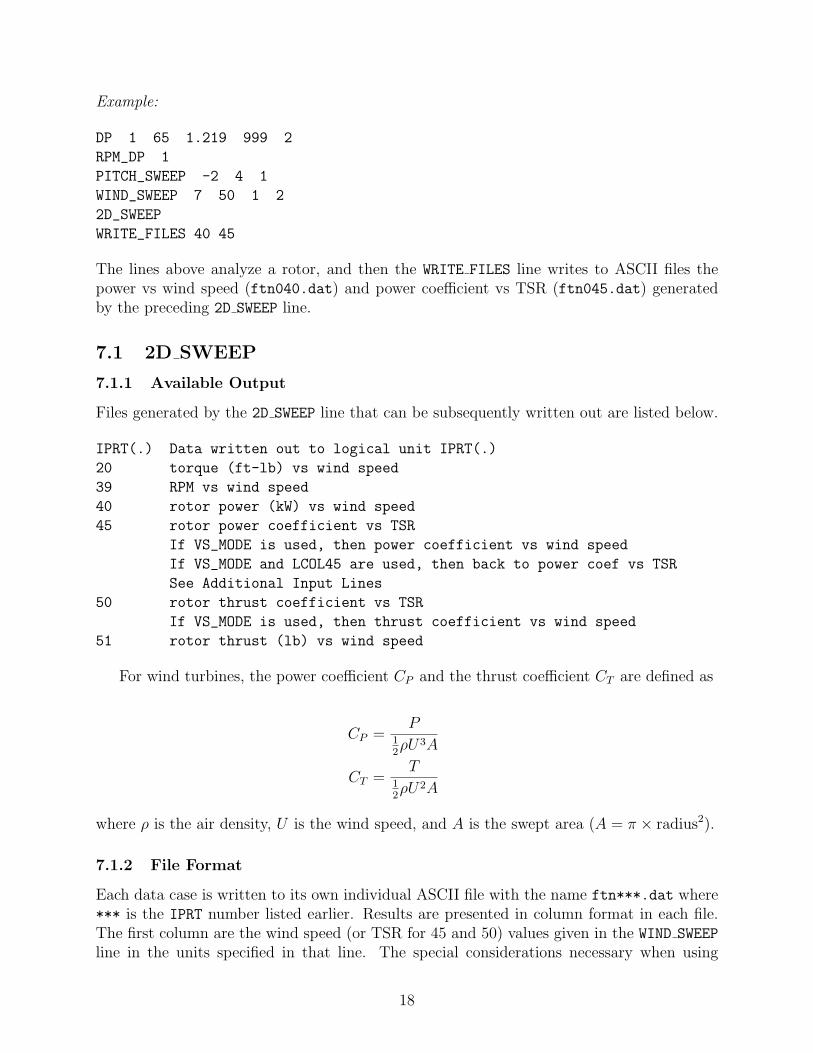
Example:
DP 1 65 1.219 999 2
RPM_DP 1
PITCH_SWEEP -2 4 1
WIND_SWEEP 7 50 1 2
2D_SWEEP
WRITE_FILES 40 45
The lines above analyze a rotor, and then the WRITE FILES line writes to ASCII files thepower vs wind speed (ftn040.dat) and power coefficient vs TSR (ftn045.dat) generatedby the preceding 2D SWEEP line.
7.1 2D SWEEP
7.1.1 Available Output
Files generated by the 2D SWEEP line that can be subsequently written out are listed below.
IPRT(.) Data written out to logical unit IPRT(.)
20 torque (ft-lb) vs wind speed
39 RPM vs wind speed
40 rotor power (kW) vs wind speed
45 rotor power coefficient vs TSR
If VS_MODE is used, then power coefficient vs wind speed
If VS_MODE and LCOL45 are used, then back to power coef vs TSR
See Additional Input Lines
50 rotor thrust coefficient vs TSR
If VS_MODE is used, then thrust coefficient vs wind speed
51 rotor thrust (lb) vs wind speed
For wind turbines, the power coefficient CP and the thrust coefficient CT are defined as
CP =P
1
2ρU3A
CT =T
1
2ρU2A
where ρ is the air density, U is the wind speed, and A is the swept area (A = π × radius2).
7.1.2 File Format
Each data case is written to its own individual ASCII file with the name ftn***.dat where*** is the IPRT number listed earlier. Results are presented in column format in each file.The first column are the wind speed (or TSR for 45 and 50) values given in the WIND SWEEP
line in the units specified in that line. The special considerations necessary when using
18
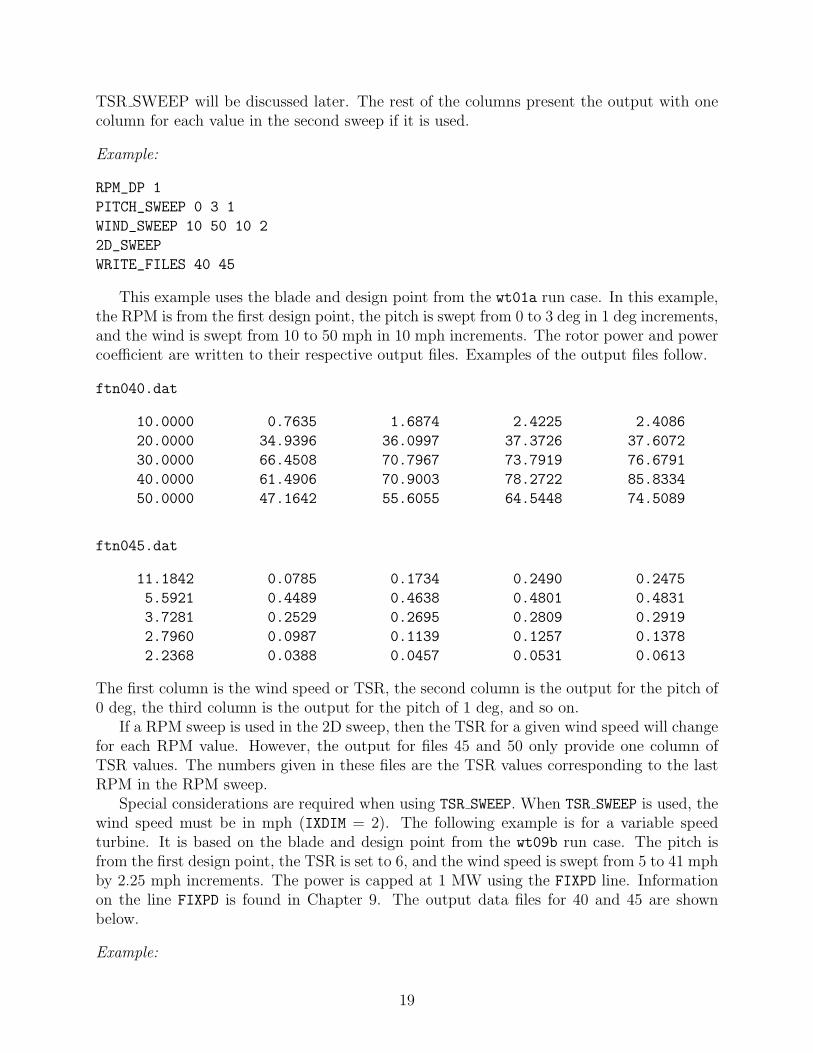
TSR SWEEP will be discussed later. The rest of the columns present the output with onecolumn for each value in the second sweep if it is used.
Example:
RPM_DP 1
PITCH_SWEEP 0 3 1
WIND_SWEEP 10 50 10 2
2D_SWEEP
WRITE_FILES 40 45
This example uses the blade and design point from the wt01a run case. In this example,the RPM is from the first design point, the pitch is swept from 0 to 3 deg in 1 deg increments,and the wind is swept from 10 to 50 mph in 10 mph increments. The rotor power and powercoefficient are written to their respective output files. Examples of the output files follow.
ftn040.dat
10.0000 0.7635 1.6874 2.4225 2.4086
20.0000 34.9396 36.0997 37.3726 37.6072
30.0000 66.4508 70.7967 73.7919 76.6791
40.0000 61.4906 70.9003 78.2722 85.8334
50.0000 47.1642 55.6055 64.5448 74.5089
ftn045.dat
11.1842 0.0785 0.1734 0.2490 0.2475
5.5921 0.4489 0.4638 0.4801 0.4831
3.7281 0.2529 0.2695 0.2809 0.2919
2.7960 0.0987 0.1139 0.1257 0.1378
2.2368 0.0388 0.0457 0.0531 0.0613
The first column is the wind speed or TSR, the second column is the output for the pitch of0 deg, the third column is the output for the pitch of 1 deg, and so on.
If a RPM sweep is used in the 2D sweep, then the TSR for a given wind speed will changefor each RPM value. However, the output for files 45 and 50 only provide one column ofTSR values. The numbers given in these files are the TSR values corresponding to the lastRPM in the RPM sweep.
Special considerations are required when using TSR SWEEP. When TSR SWEEP is used, thewind speed must be in mph (IXDIM = 2). The following example is for a variable speedturbine. It is based on the blade and design point from the wt09b run case. The pitch isfrom the first design point, the TSR is set to 6, and the wind speed is swept from 5 to 41 mphby 2.25 mph increments. The power is capped at 1 MW using the FIXPD line. Informationon the line FIXPD is found in Chapter 9. The output data files for 40 and 45 are shownbelow.
Example:
19
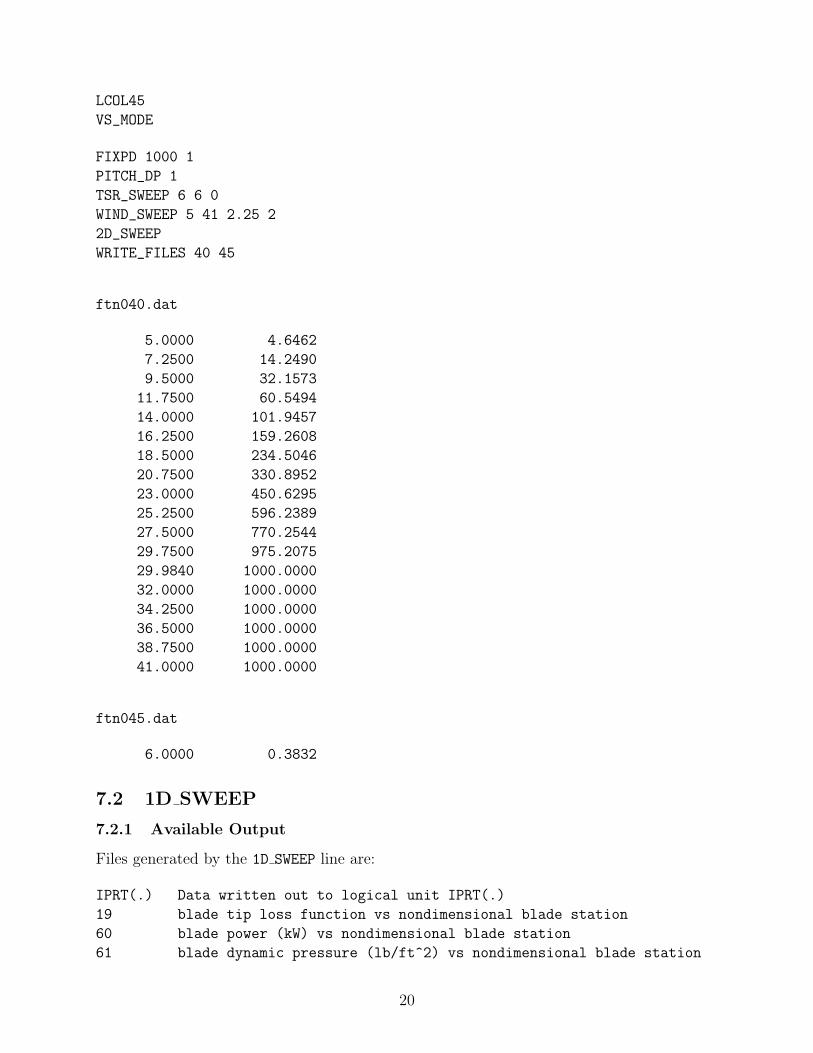
LCOL45
VS_MODE
FIXPD 1000 1
PITCH_DP 1
TSR_SWEEP 6 6 0
WIND_SWEEP 5 41 2.25 2
2D_SWEEP
WRITE_FILES 40 45
ftn040.dat
5.0000 4.6462
7.2500 14.2490
9.5000 32.1573
11.7500 60.5494
14.0000 101.9457
16.2500 159.2608
18.5000 234.5046
20.7500 330.8952
23.0000 450.6295
25.2500 596.2389
27.5000 770.2544
29.7500 975.2075
29.9840 1000.0000
32.0000 1000.0000
34.2500 1000.0000
36.5000 1000.0000
38.7500 1000.0000
41.0000 1000.0000
ftn045.dat
6.0000 0.3832
7.2 1D SWEEP
7.2.1 Available Output
Files generated by the 1D SWEEP line are:
IPRT(.) Data written out to logical unit IPRT(.)
19 blade tip loss function vs nondimensional blade station
60 blade power (kW) vs nondimensional blade station
61 blade dynamic pressure (lb/ft^2) vs nondimensional blade station
20
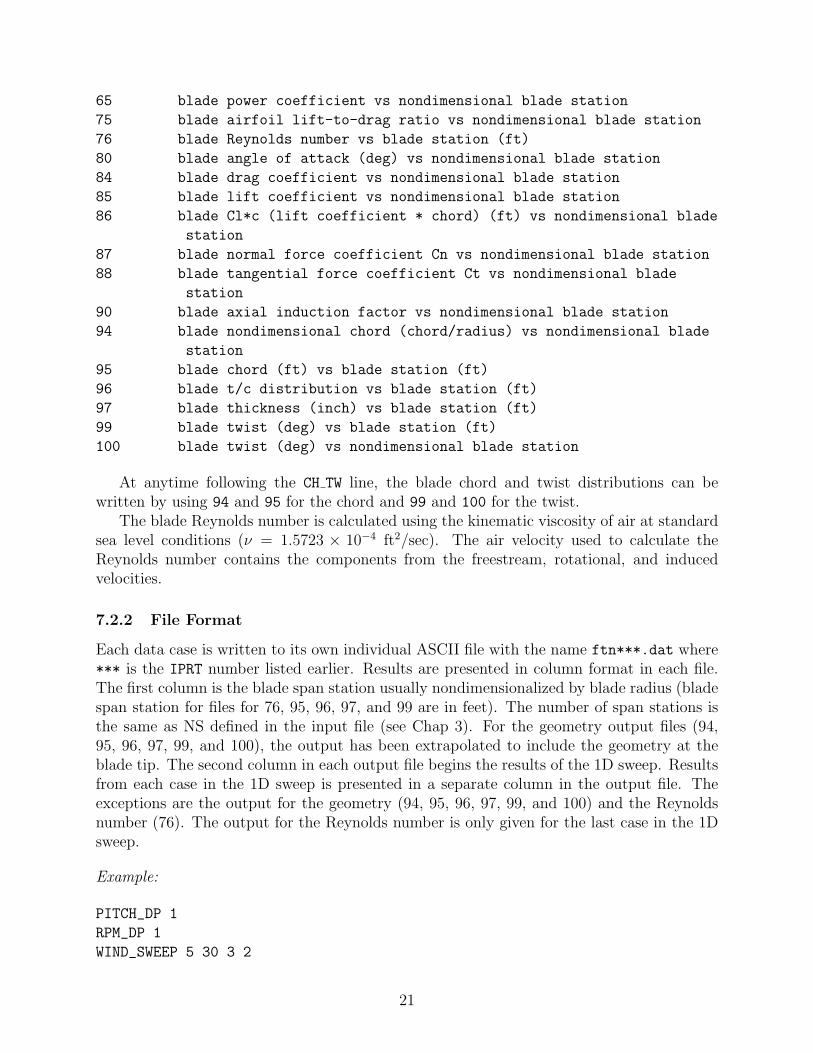
65 blade power coefficient vs nondimensional blade station
75 blade airfoil lift-to-drag ratio vs nondimensional blade station
76 blade Reynolds number vs blade station (ft)
80 blade angle of attack (deg) vs nondimensional blade station
84 blade drag coefficient vs nondimensional blade station
85 blade lift coefficient vs nondimensional blade station
86 blade Cl*c (lift coefficient * chord) (ft) vs nondimensional blade
station
87 blade normal force coefficient Cn vs nondimensional blade station
88 blade tangential force coefficient Ct vs nondimensional blade
station
90 blade axial induction factor vs nondimensional blade station
94 blade nondimensional chord (chord/radius) vs nondimensional blade
station
95 blade chord (ft) vs blade station (ft)
96 blade t/c distribution vs blade station (ft)
97 blade thickness (inch) vs blade station (ft)
99 blade twist (deg) vs blade station (ft)
100 blade twist (deg) vs nondimensional blade station
At anytime following the CH TW line, the blade chord and twist distributions can bewritten by using 94 and 95 for the chord and 99 and 100 for the twist.
The blade Reynolds number is calculated using the kinematic viscosity of air at standardsea level conditions (ν = 1.5723 × 10⁻⁴ ft2/sec). The air velocity used to calculate theReynolds number contains the components from the freestream, rotational, and inducedvelocities.
7.2.2 File Format
Each data case is written to its own individual ASCII file with the name ftn***.dat where*** is the IPRT number listed earlier. Results are presented in column format in each file.The first column is the blade span station usually nondimensionalized by blade radius (bladespan station for files for 76, 95, 96, 97, and 99 are in feet). The number of span stations isthe same as NS defined in the input file (see Chap 3). For the geometry output files (94,95, 96, 97, 99, and 100), the output has been extrapolated to include the geometry at theblade tip. The second column in each output file begins the results of the 1D sweep. Resultsfrom each case in the 1D sweep is presented in a separate column in the output file. Theexceptions are the output for the geometry (94, 95, 96, 97, 99, and 100) and the Reynoldsnumber (76). The output for the Reynolds number is only given for the last case in the 1Dsweep.
Example:
PITCH_DP 1
RPM_DP 1
WIND_SWEEP 5 30 3 2
21

vi | P a g e
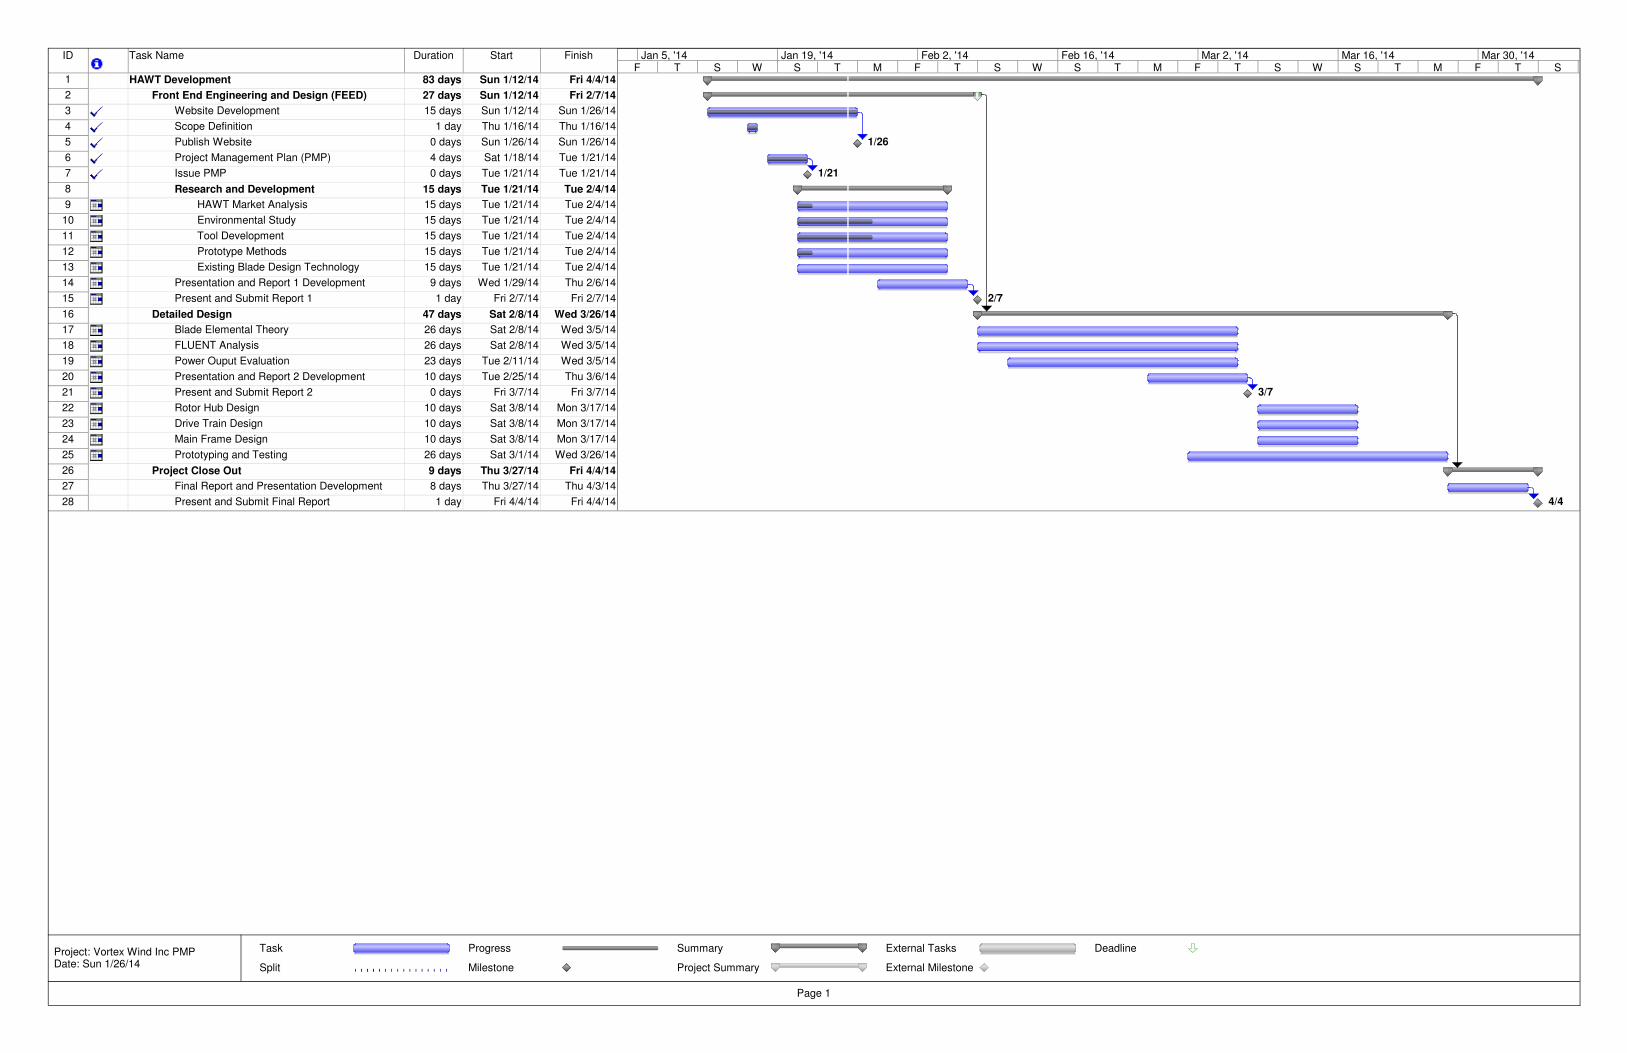
A3 – Project Management Plan
ID Task Name Duration Start Finish
1 HAWT Development 83 days Sun 1/12/14 Fri 4/4/14
2 Front End Engineering and Design (FEED) 27 days Sun 1/12/14 Fri 2/7/14
3 Website Development 15 days Sun 1/12/14 Sun 1/26/14
4 Scope Definition 1 day Thu 1/16/14 Thu 1/16/14
5 Publish Website 0 days Sun 1/26/14 Sun 1/26/14
6 Project Management Plan (PMP) 4 days Sat 1/18/14 Tue 1/21/14
7 Issue PMP 0 days Tue 1/21/14 Tue 1/21/14
8 Research and Development 15 days Tue 1/21/14 Tue 2/4/14
9 HAWT Market Analysis 15 days Tue 1/21/14 Tue 2/4/14
10 Environmental Study 15 days Tue 1/21/14 Tue 2/4/14
11 Tool Development 15 days Tue 1/21/14 Tue 2/4/14
12 Prototype Methods 15 days Tue 1/21/14 Tue 2/4/14
13 Existing Blade Design Technology 15 days Tue 1/21/14 Tue 2/4/14
14 Presentation and Report 1 Development 9 days Wed 1/29/14 Thu 2/6/14
15 Present and Submit Report 1 1 day Fri 2/7/14 Fri 2/7/14
16 Detailed Design 47 days Sat 2/8/14 Wed 3/26/14
17 Blade Elemental Theory 26 days Sat 2/8/14 Wed 3/5/14
18 FLUENT Analysis 26 days Sat 2/8/14 Wed 3/5/14
19 Power Ouput Evaluation 23 days Tue 2/11/14 Wed 3/5/14
20 Presentation and Report 2 Development 10 days Tue 2/25/14 Thu 3/6/14
21 Present and Submit Report 2 0 days Fri 3/7/14 Fri 3/7/14
22 Rotor Hub Design 10 days Sat 3/8/14 Mon 3/17/14
23 Drive Train Design 10 days Sat 3/8/14 Mon 3/17/14
24 Main Frame Design 10 days Sat 3/8/14 Mon 3/17/14
25 Prototyping and Testing 26 days Sat 3/1/14 Wed 3/26/14
26 Project Close Out 9 days Thu 3/27/14 Fri 4/4/14
27 Final Report and Presentation Development 8 days Thu 3/27/14 Thu 4/3/14
28 Present and Submit Final Report 1 day Fri 4/4/14 Fri 4/4/14
1/26
1/21
2/7
3/7
4/4
F T S W S T M F T S W S T M F T S W S T M F T SJan 5, '14 Jan 19, '14 Feb 2, '14 Feb 16, '14 Mar 2, '14 Mar 16, '14 Mar 30, '14
Task
Split
Progress
Milestone
Summary
Project Summary
External Tasks
External Milestone
Deadline
Page 1
Project: Vortex Wind Inc PMPDate: Sun 1/26/14