Export Processing Zones in Madagascar:
The impact of the dismantling of clothing quotas on employment and labour standards
May 2007
Jean-Pierre CLING, Mireille RAZAFINDRAKOTO and François ROUBAUD
Institut de Recherche pour le Développement, DIAL, Paris Abstract: The success of Export Processing Zones (EPZs) or the Zone Franche in
Madagascar is, with the exception of Mauritius, an isolated and unrecognized case in Africa.
The Zone Franche has had a highly significant macroeconomic impact in terms of exports
and jobs. Madagascar became the number two clothing exporter in sub-Saharan Africa. At
its peek in 2004, the Zone Franche employed 100,000 employees. The final phase-out of the
Multi-Fibre Arrangements in 2005 has had a negative impact on the Zone Franche. The
export and employment growth has come to a halt. Our econometric estimates, based on first-
hand data, show that average wages in the Zone Franche have become lower than in the
formal industrial sector, other things being equal; labor standards are higher than average
but are progressively being reduced in a context of increased international competition. As
the example of Madagascar shows, EPZs can no longer be placed at the core of development
and employment policies in Africa since the end of clothing quotas, although no alternative
strategy has emerged yet.
Key words: Export processing zones, employment, wages, labour standards, Madagascar.
1. INTRODUCTION
According to the International Labour Organization, total employment in exporting
processing zones (EPZs) worldwide amounted to 13 million employees in 2002, excluding
China (ILO, 2003). These EPZs are mostly established in developing countries. They are
generally specialised in the production of labour-intensive consumer goods, mainly clothing.
As it is pointed out by Jayanthakumaran (2003), over the last decades until 2005, investment
in these zones has served to circumvent textile quotas imposed to the Asian exports by the
Multi-Fibre Arrangements (MFAs).
Most of the economic debate on EPZs focuses on the question of wages and labour standards.
Indeed, the main motivation for investing in EPZs is to minimise the costs of producing
labour-intensive consumer goods, thanks to tax exemptions associated with low wages.
Because of these characteristics, they have often been accused (especially by labour unions)

of being “sweatshops” overexploiting a low-paid unskilled labour force and eventually
encouraging a “race to the bottom” in terms of wages and labour standards.
Many studies have compared wages paid by the EPZs with the rest of the economy. They all
agree that the situation varies enormously from one country and sector to the next. Limiting
the study to the textile and clothing sector, Romero (1995) and Kusago and Tzannatos (1998)
consider that there are no significant differences between the wages paid in Asian EPZs and
those paid by other companies in the same sector. Economic literature on the subject suggests
that, since most of the labour is female, the low average wages can be explained by low skills
and the wage discrimination generally suffered by women, without EPZs appearing to
practise a systematic policy of specific remuneration for given jobs (Madani, 1999). However,
it should be noted that none of the abovementioned studies is based on individual wage data,
but on average sector wages.1
Since the abovementioned studies agree that EPZs do not practise specific wage
discrimination, their poor image in terms of labour issues stems mainly from the fact that
working conditions are generally deemed harder than in the other economic sectors and that
EPZs are often accused of violating core labour standards (ILO, 2003; ICFTU, 2003): labour
legislation is not applied as strictly as elsewhere, and sometimes not at all; working hours are
longer and the pace of work is faster; trade unions are often forbidden or at least discouraged;
gender discriminations are worse than in the rest of the economy, etc.
Madagascar is the only example, alongside Mauritius (and very recently Kenya but on a
smaller scale), of significant EPZ success in sub-Saharan Africa where all other free zone
initiatives have failed despite numerous attempts. The example of Mauritius is well known,
but not so the Malagasy EPZs otherwise known as the Zone Franche.2 Yet the Zone Franche
has developed quite remarkably in just one decade: it has gained considerable ground in terms
of exports and formal employment, making a significant contribution to the economic upturn
observed since the mid-1990s.
The objective of this article is to determine whether the characteristics of wages and labour
standards generally observed in the rest of the world hold in the case of the Malagasy Zone
Franche. Our study draws on some national statistical sources with no other equivalent in
sub-Saharan Africa: labour force surveys (LFSs) conducted annually at the authors’ initiative
since 1995 in the Malagasy capital, where most Zone Franche companies are established. To
our knowledge, this is the first study to make an assessment of the impact on African labour
markets of the dismantling of international clothing quotas, using econometric estimates
based on individual wage data.3
2

In Section 2, we describe the Zone Franche’s booming growth up to 2005 (temporarily
interrupted by the political crisis in 2002) and its difficulties since the end of the MFAs, and
assess its contribution to export and employment performances. Section 3 looks at the Zone
Franche’s impact on earned income using estimated earnings equations to compare wages
paid in Zone Franche companies with other sectors of the economy. Section 4 compares Zone
Franche working conditions and other labour standards with other companies. Section 5
concludes.
2. THE IMPACT ON EMPLOYMENT AND EXPORT PERFORMANCE
The introduction of a special scheme for free zone companies in Madagascar in 1990
followed the decision to opt for an export-led growth strategy under the structural adjustment
policies adopted in the late 1980s in compliance with Bretton Woods Institution
recommendations. Generous tax breaks, combined with low wages and trade preferences
granted on the US and EU markets, have triggered a strong and continuous growth of the
Malagasy Zone Franche. According to the Zone Franche association, there were 180 firms in
business with over 100,000 employees at the end of 2004. However, this boom has been
interrupted by the final dismantling of the quotas on clothing products since the beginning of
2005.
2.1 A combination of tax breaks, low labour costs and trade preferences
The law passed in 1991 defined the scheme’s scope and the tax incentives granted Zone
Franche companies, which are under no obligation to set up in specific zones. Companies
wishing to be part of the free zone scheme must intend to export at least 95% of their
production. Companies providing services to the Zone Franche can also benefit from the free
zone scheme.
Zone Franche companies are exempt from all duties and taxes on exports and imports alike.
As regards domestic tax, they are exempt from excise taxes, but have been liable for Value
Added Tax (VAT) on imported inputs since 1997, although this can be refunded at a later date
against proof of export. This measure was introduced to curb tax evasion and prevent
companies supplying the local market from setting up as Zone Franche companies. The Zone
Franche scheme grants total exemption from profits tax for a grace period of two years for
labour-intensive farming and fishing companies and four years for industrial and service
companies. These companies are liable for a fixed rate of 10% thereafter, which is far lower
than the general rate of 35%. They are also eligible for profits tax breaks equal to 75% of the
3
cost of new investments. Last but not least, Zone Franche companies are granted special
access to foreign currency and total freedom for capital transfers.
The success of the Zone Franche was initially due to French investors attracted by a French-
speaking environment, where a large number of their compatriots had already set up business
(Madagascar has the largest French community in sub-Saharan Africa). Yet investors
gradually became more diverse. No recent precise breakdown of the country origin of
investors is available. Most of them are French, Mauritian (Madagascar’s next door
neighbours) or Asian.4
Investors sought primarily to take advantage of low labour costs in Madagascar. Cadot and
Nasir (2001) report that the monthly wage for an unskilled textile industry machine operator
is less than one-third of the equivalent wage in Mauritius, around half that in China and only
about 60% of the average wage in India. Although labour productivity is apparently much
lower in Madagascar than in Mauritius or China (and equal to that in India), unit production
costs are among the lowest in the world and lower than in the other three countries.
As many Asian countries had already saturated their quotas, the choice of Madagascar also
helped circumvent the textile quotas imposed by the developed countries under the MFAs.
Hence the Central Bank of Madagascar (2002) reported that clothing accounted for 90% of
the Zone Franche’s production in 2001. Madagascar enjoys duty-free and quota-free access to
the European and American markets:
- Madagascar has been AGOA (African Growth and Opportunity Act) eligible since 2001.
Starting in 1997-1998, investments were made in the Zone Franche in anticipation of AGOA
(Gibbon, 2003). Yet although AGOA authorises duty-free access to the American market for
the products it covers, it imposes restrictive conditions in terms of inputs (“third-party fabric
provision”), which must come either from the United States or other countries benefiting from
the agreement. However, Madagascar was granted a dispensation for its clothing sector to use
inputs from other countries. In 2004, this was extended through to the end of 2007;
- Madagascar also benefits from tax-free access to the European market under the terms of the
Cotonou Agreement signed between the EU and the ACP (Africa-Caribbean-Pacific) States
and, since 1999, under the “Everything But Arms” (EBA) initiative covering all LDCs (Least
Developed Countries). The rules of origin are particularly strict under these agreements too,
especially as regards the EBA.
Clothing exports are concentrated on the American and European markets, which are the top
two markets worldwide for these products. Yet although trade preferences played an
important role in the success of the Zone Franche, they would not have been taken up had it
not been for the tax breaks granted under the EPZ scheme. EPZ managers interviewed by
4

several surveys clearly state that they would not have invested in Madagascar had it not been
for these advantages (Cadot and Nasir, 2001; Razafindrakoto and Roubaud, 2002).5
2.2 A remarkable export growth
Starting from negligible amounts at the beginning of the 1990s, growth in Zone Franche
exports has been remarkable6 (Graph 1). Sales to the American market, which were marginal
until 2000, have driven growth the next few years due to AGOA. In 2006, the EU and the
USA absorbed half of the exports each. The share of the Zone Franche in total exports rose
steadily to reach nearly 50% in 2005-2006, a proportion unequalled in any other Least
Developed Country (LDC).
The Zone Franche accounted for most of the boom in Madagascar's goods exports from 1995
to 2006. The Zone Franche made Madagascar the only successful African new exporter of
manufactured goods, excepting Lesotho, in the last decade. The breakdown of exports
consequently changed considerably (Cling, Razafindrakoto and Roubaud, 2005). At the
beginning of the 1990s, Madagascar exported almost exclusively agricultural products
(mainly coffee, vanilla, cloves and shrimps). Yet the share of these products subsequently fell
to less than half of total exports. The share of manufactured products, on the other hand, was
negligible, but grew steadily to half of total exports. This growth concerned mainly exports of
clothing products, i.e. exports from the Zone Franche. Although the total amount (500 million
dollars in 2006) might seem relatively modest by world standards, Madagascar became in
2001 the number two African clothing exporter in sub-Saharan Africa behind Mauritius.
The Malagasy economy was hard hit by the 2002 political crisis, which took a heavy toll on
Zone Franche companies. Missed contract deadlines due to the crisis prompted international
buyers to cancel their orders and, given the political instability, turn to more reliable
suppliers. The foreign trade figures show the Zone Franche’s extreme vulnerability to the
crisis and its remarkable responsiveness once the crisis was over. Total clothing exports were
practically halved in 2002. Yet exports shot back up in 2003 and had already topped their pre-
crisis level in 2004. But some companies that had shifted their textile production facilities to
Madagascar for export to the US or the EU did not return after the crisis.
GRAPH 1 HERE
As shown in graph 1, the Zone Franche export growth has come to a halt in 2005, since the
end of the quotas imposed to Asian exports of clothing products. This evolution is far from
being unique: although the USA and the EU have almost immediately imposed some new
5

temporary quotas on China’s exports of textile & clothing products until the end of 2008, the
latter have kept booming, while exports from most other developing countries have stagnated
or decreased. This is especially the case for all major African exporters such as Mauritius,
Madagascar, Lesotho and Kenya (Table 1).
TABLE 1 HERE
2.3 A major contribution to job creations
The LFSs used in this study correspond to the first phase of the 1-2-3 survey of the labour
market, the informal sector and consumption conducted in a number of developing countries
in Africa and Latin America (Razafindrakoto and Roubaud, 2003). This system of household
surveys was introduced in Madagascar for the first time in 1995 (Rakotomanana, Ramilison
and Roubaud, 2003). The National Statistical Office has repeated the operation every year
since then. The sample, drawn from a stratified two-stage area-based survey plan, is
representative of all ordinary households in the Malagasy capital. In each household, all
individuals aged ten and over, i.e. all individuals of working age as defined by the official
nomenclature, were asked about their labour market participation. The definitions used
(employment, unemployment, etc.) respected the international standards recommended by the
ILO. Furthermore, in addition to the general LFS purpose of analyzing the labour market
dynamic, one of the strong points of the Malagasy survey is that the questionnaire included a
specific question to single out employment in the Zone Franche (Razafindrakoto and
Roubaud, 1997).
The LFSs confirm the Zone Franche’s exceptional buoyancy in recent years. From 1995 to
2004 (that is until the end of the international quotas on textile & clothing), the rate of job
creation in the Zone Franche was almost four times higher than in Antananarivo’s labour
market as a whole. The average annual employment growth rate stood at 15% compared with
nearly 4% for the market as a whole (Table 2). This is by far the best performance, all sectors
considered. Even though the informal sector is the main job provider, it is way behind in this
respect. Over the period 1995-2001 (before the political crisis), the Zone Franche’s
contribution to job creation was as strong as that of the informal sector. The contribution is
still significant on the period 1995-2004: of a total 195,000 new jobs, 65% could be attributed
to the informal sector whereas the Zone Franche generated 62% of the new jobs in the formal
sector, tripling its share of total employment from an initial 3% to 9% in 2005. In the formal
private sector, nearly one-third of all employees worked in the Zone Franche in 2004
6

compared with barely one in ten in 1995. In the same year, there were more women employed
in the Zone Franche than in the rest of the formal private sector.
TABLE 2 HERE
As with the foreign trade statistics, the employment data highlight that the Zone Franche was
extremely vulnerable to the political crisis in 2002. Employment fell by 60% wiping out in
one fell swoop the huge progress made in previous years. The informal sector acted as a
safety net for employees who had been made redundant and for new arrivals. The number of
jobs in this sector grew by 12%. As it is the case for exports, employment in the Zone
Franche quickly recovered and in 2004 almost reached its pre-crisis level. Between 2004 and
2006, employment decreased by 6%.
3. REMUNERATION IN THE ZONE FRANCHE
The comparison of wages paid across all sectors of activity made in this section shows that
wages in the Zone Franche are lower than in the rest of the economy, especially compared
with the formal industrial sector. In order to go further and to check structural effects due to
the composition of the labour force, we estimate some econometric wage equations.
3.1. Wages in the Zone Franche are lower on average
The LFS data clearly show the structural weakness of wages in the Zone Franche. Not only
was the average monthly wage 34% lower than that paid by other types of industrial
companies in 2006, but it was also one of the lowest on the market: compared with the
average earnings for gainfully employed workers in all sectors of the economy, the gap
amounted to 9% in 2006. Only the informal sector paid its workers less. These findings are
somewhat tempered if we compare median monthly wages (which have the advantage of
being less sensitive to extreme values): the median monthly wage in the Zone Franche was
equivalent to that for all gainfully employed workers together, but was still lower than that
found in other industrial firms.7
Zone Franche companies appear to have granted more generous wage raises than others from
1995 to 2006. Whereas the purchasing power of monthly earnings grew an average 4.0% per
year for all gainfully employed workers, the rate was 5.3% in the Zone Franche. Yet this
positive finding is partly due to increasingly long working hours, which tended to raise
monthly earnings compared with other sectors: in 2006, Zone Franche employees worked
eight hours longer on average per week than their counterparts in the non-Zone Franche
7

private industrial companies (54 hours and 46 hours per week respectively). Hence, the
diagnosis is reversed when comparing hourly earnings. Although growth in real median
hourly earnings per Zone Franche worker is appreciable (2.4% per year), it is among the
lowest when compared with the labour market as a whole, where it comes to 3.2% per year.
Futhermore, real wages (hourly wages as well as monthly earnings) in the Zone Franche have
decreased in 2006 after the dismantling of quotas.
However, these differences in average and median earnings are misleading for two reasons.
Firstly, the remuneration taken into account does not include benefits, in money or in kind
(bonuses, paid holidays and miscellaneous benefits). These benefits are added to basic
earnings to form total earnings. Secondly, as shown in Table 3, job characteristics and wages
are not identical across sectors. Some characteristics weigh negatively on Zone Franche
earnings, such as the low percentages of managerial staff, the lack of seniority and
professional experience, and the preponderance of female staff. All of these characteristics are
common to most EPZs worldwide (Madani, 1999). In 2006, women represented nearly 70%
of the labour employed by the Zone Franche as opposed to 47% in formal industrial jobs
outside the Zone Franche.8 Yet other characteristics work in favour of earnings in the Zone
Franche. For example, there is the rate of trade union presence, which is almost as high as in
the public sector and double the rate observed for the rest of the industrial sector (this
characteristic can be linked, in particular, to the large average size of Zone Franche
companies compared with other industrial companies).
TABLE 3 HERE
3.2. All other things being equal, wages are lower than in the rest of the industrial sector
Fine-tuning our calculations entails checking all these “structural effects” to measure earnings
levels, all other things being equal, i.e. for comparable jobs and human capital assets. These
estimates are made first for basic earnings and then for total job earnings. In both cases, we
compare the positive or negative premium earned by Zone Franche employees with the
labour force as a whole and with employees in the non-Zone Franche formal private industrial
sector. We estimate extended Mincerian earnings functions for each year from 1995 to 2006
to explain the level of hourly earnings (both basic earnings and total earnings).9
Log Wit = at + btGENi + ctSCOit + dtEXPit + etSit + ftSit2 + gtSECit + DUMMY EPZ + εit
(1)
8

Dependent variables are the usual explanatory factors: gender (GEN), number of years of
schooling (SCO) and potential professional experience (EXP). We also include seniority (S)
and seniority squared (S2) in the explanatory variables.10 Socio-economic group (SEC) broken
down into nine groups (including six categories of wage earners) is alternatively included and
excluded from the regressions to take account of its potential endogeneity. Lastly, we
introduce a dummy Zone Franche variable (DUMMY EPZ) to estimate the earnings premium
associated with this sector. Each of these estimations is made first for all gainfully employed
workers and then for wage earners (excluding non-wage earners such as the self-employed) in
the formal industrial sector with apparently comparable working conditions. We carry out
both OLS estimates and Heckman estimates selection-corrected for participation and sector
choice (Zone Franche vs. non-Zone Franche). Yet as the results are very similar and the
database does not provide any credible instruments for correcting potential selection biases,
we only present the OLS estimates here.
At the same time, we estimate a global model using stacked data from 1995 to 2006. The
dependent variable is real hourly earnings at 1995 prices11 and dummies are introduced for
each year (DATE):
Log Writ = a + bGENi + cSCOit + dEXPit + eSit + fSit2 + g∑SECit + ht∑DATEt + DUMMY
EPZ + εit (2)
Table 4 presents the results of estimates of the real hourly wage in the formal industrial sector
using stacked data, excluding bonuses (models 1 and 2) and including bonuses (models 3 and
4), and excluding socio-economic group (models 1 and 3) and including socio-economic
group (models 2 and 4). The quality of the regressions is good and in keeping with
international literature on the subject (R2 from 0.35 to 0.43), and the coefficients for the four
chosen models are close to and comply with the theory. Remuneration, regardless of whether
the different types of bonuses are taken into account, is a growing function of the level of
education, seniority and professional experience. For example, each additional year of
schooling is equivalent to a net wage increase of approximately 10% when the socio-
economic group is not taken into account, whereas benefits from seniority and professional
experience are less marked (around 2% and 1% respectively).
TABLE 4 HERE
Growth in average hourly wages is not due solely to improved skills over the period, as is
9

shown by the significant positive trend of the year dummies.12 Madagascar also experienced
unprecedented dynamic endogenous urban growth (Razafindrakoto and Roubaud, 2000). The
hourly wage is also closely correlated with position in the company, in keeping with a strict
wage scale ranging from senior management to unskilled workers. When the socio-economic
group is taken into account, it partially absorbs the return to human capital, highlighting the
two-stage mechanism whereby the latter is beneficial to employees: firstly, by giving them
access to more highly skilled jobs and secondly, by giving them additional income in a given
job. Hence the return on education is reduced by approximately one-third (from 10% to 7%)
when the socio-economic group is included in the equation. Finally, women appear to be
subject to a form of wage discrimination, earning between 10% to 15% less in the industry.
Nicita, Razzaz (2003) observed an even higher level of discrimination in the Malagasy textile
industry (whose coverage is similar to, but not exactly the same as the Zone Franche) using
the same kind of wage equations.
As regards our variable of interest, the Zone Franche dummy is significant in the models
estimated with wages excluding bonuses (1 and 2). But the wage premium is very small on
average for the whole period (3%) and becomes even negative in recent years, as we will see
below (3.3).
. Whereas Zone Franche employees were paid nearly 30% lower hourly wages on average
than their counterparts in the non-Zone Franche private formal industrial sector over the
1995-2006 period, most of this gap can be attributed to labour force composition differences
between the two sectors. Table 5 presents the results of the same estimates for all gainfully
employed (wage and non-wage) workers. In this case, we refer to earnings rather than wages
since some workers are non-wage workers. The quality of the adjustments is slightly better
than for the estimates commented on above, for relatively similar results. Gender
discrimination is the most notable exception: it is approximately twice as high in the economy
as a whole as those estimated for formal industry. This result can be attributed mainly to the
presence of the informal sector, where highly significant differences between men and women
are found. The return on human capital is higher than that observed in the model limited to the
industrial sector, whereas the time trend is flatter. In the models including socio-economic
group, we find the same wage scale as observed earlier, with non-wage groups being inserted
into the scale.13 Hence, employers’ earnings appear to be lower than senior managers’
earnings, but higher than middle managers’ earnings, whereas self-employed workers earn the
same as unskilled employees, with apprentices and family workers coming last.
However, contrary to the estimates for the formal industrial sector alone, employees in the
Zone Franche always have a significant premium varying from 3% to 16% depending on the
10

model. Introducing the socio-economic group into the regression sharply reduces the earnings
premium secured by Zone Franche employees, by nearly two-thirds in the model excluding
bonuses and by nearly three-quarters in the model including all remuneration elements. For an
equivalent level of human capital, Zone Franche employees have lower level jobs. This
phenomenon can be partly explained by the specific labour organization (low percentage of
managerial staff and little job differentiation). It could also be due to a deliberate policy by
employers to hire over-qualified workers. Estimates broken down by the different institutional
sectors14 show that the premium for Zone Franche workers is always significantly lower than
for workers in the public sector (administration and public enterprises) and higher than in the
informal sector, and is not significantly different from that secured by other employees in the
formal private sector.
TABLE 5 HERE
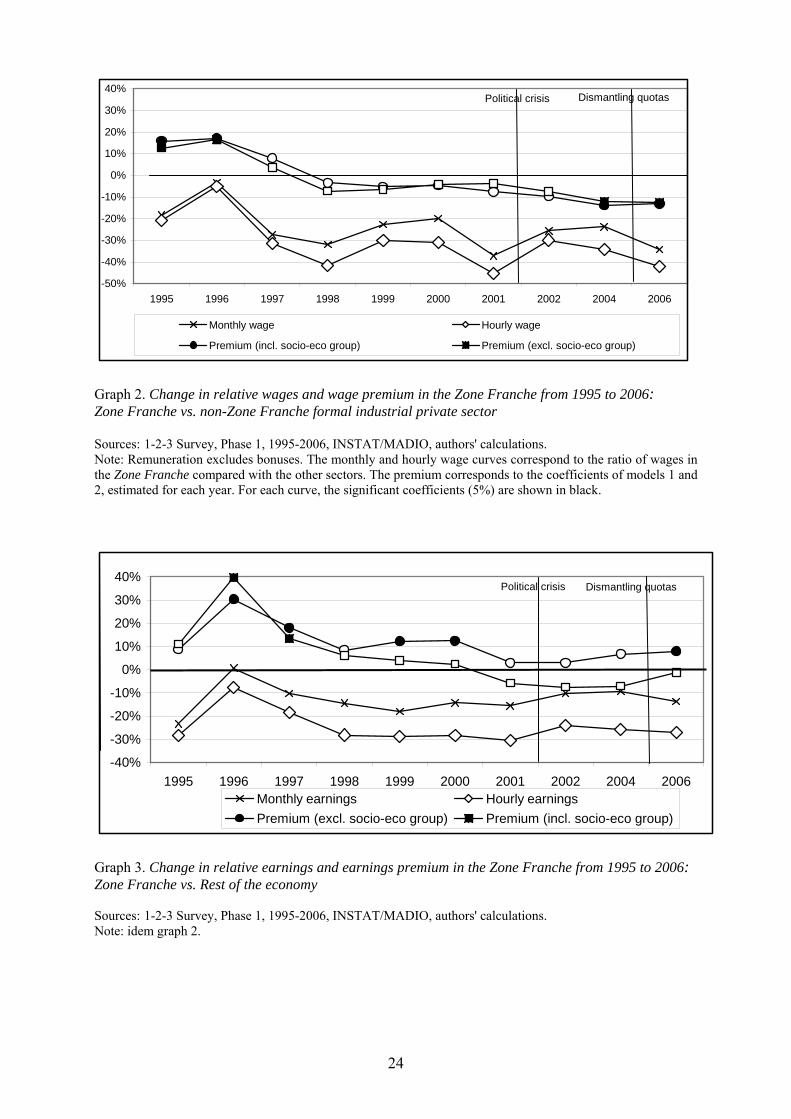
3.3 The wage gap is increasing
By studying the time curve for the premium for Zone Franche workers, we can go beyond the
average effects for the period as a whole (Graphs 2 and 3). The comparison of wages in the
formal industrial sector shows that the average income gap widens, particularly as regards
hourly wages, to the detriment of Zone Franche employees. Hourly wages (excluding
bonuses) posted a 40% difference in 2006, that is twice as much as in 1995 (21%; they were
even similar in both sectors in 1996). The premium curve also fell from significant and
positive in the first two years (1995 and 1996) to significant and negative as of 2004. Starting
from a positive premium of around 15% at the beginning of the period (depending on whether
we take into account the socio-economic group or not), we obtain a negative premium of
approximately the same value at the end of the period.
Compared with all gainfully employed workers on the labour market, we also note a drop in
relative earnings for Zone Franche workers, with an even greater loss of ground for hourly
earnings, as the increase in hours worked concerned essentially the Zone Franche. Although it
decreased considerably compared with the beginning of the period, the premium was still
positive in 2006 for the model excluding socio-economic group. As regards the model
including socio-economic group, the premium was no longer significant after 1998 and even
became negative since 2001.
GRAPHS 2 and 3 NEAR HERE
11

This negative trend can doubtless be explained to a large extent by the fact that the
exceptional activity seen on the domestic market did not benefit Zone Franche companies,
which export to highly competitive international markets. Moreover, the rise in the exchange
rate from the second half of 2000 followed by the final dismantling of textile & clothing
quotas at the beginning of 2005 reduced the Zone Franche companies’ room for manoeuvre.
The premium’s downward trend highlights a gradual aligning of wages in the Zone Franche
with conditions on the labour market. Despite the upsurge in Zone Franche employment,
there was no shortage of salaried labour, which could have put upward pressure on wages.
4. OTHER LABOUR STANDARDS
Job quality is gauged by more than just money. It is also measured by the non-monetary
elements attached to the job such as the social security cover it provides, job security,
promotion possibilities, etc. Across all these benefits, Zone Franche companies perform better
than all the other formal industrial companies in the private sector. Yet, these advantages are
progressively being reduced.
4.1. Better labour standards in the Zone Franche
Table 6 shows that three main types of benefits are systematically more common in the Zone
Franche: registration with an official social security body (83.5%), paid holidays (64.6%) and
the possibility of consulting a company medical service (60.8%).
Yet Zone Franche employees are at the greatest advantage when it comes to job security. A
higher percentage of them have permanent jobs (98.8%) and receive pay slips (97.0%). They
are also more often covered by a written employment contract (96.3%) and are paid on a fixed
basis (93.5%). All of these elements contribute to secure, formal working relations. Although
there is less in-house promotion of Zone Franche employees, this can be explained by the fact
that they have less seniority. Once the differences in jobs and skills have been taken into
account, the disparities are no longer significant.
The logit models we have tested - where the dependent variable corresponds to a form of
cover or protection and the independent variables are the same as for the earnings equations -
show that Zone Franche employees enjoy significantly better coverage across all these
benefits.15 In many respects, Zone Franche employees are in as favourable a situation as
public sector employees, who are the most highly protected on the labour market.
Overall, Zone Franche companies treat their employees somewhat better than their
counterparts in the private formal sector and much better than workers in the informal sector,
12

although, as we have seen, the wage premium has become negative. Furthermore, as
mentioned before, core labour standards are better respected: the percentage of trade union
presence is higher; wage gender discriminations are lower (which is also confirmed by Glick
and Roubaud, 2006).
Doubtless, this favourable treatment of Zone Franche employees, albeit relative, should not
be attributed to the company heads’ philanthropic tendencies, given that their main reason for
setting up in Madagascar was the low cost of labour. Some characteristics of the EPZs (larger
size, foreign-owned firms’ “best practices”, etc.) could explain the more favourable
conditions. For example, as these companies are sometimes working in a hostile local
environment, they are more mindful of the legislation, especially labour standards, and this
observance is further stimulated by active trade unions. It is important to belie the common
assumption that EPZs undermine working conditions on the national labour market. In
Madagascar’s case, it is not the Zone Franche companies that reduce the quality of wage
employment, but the poor conditions provided employees on the local labour market that
attract them to the country in the first place. In fact, their presence is likely to benefit the
workers by acting as an incentive to other companies to align their labour policies with the
usually more advantageous conditions found in the Zone Franche.
TABLE 6 HERE
In addition to this relative advantage for Zone Franche employees, the zone’s companies
stepped up their formalization of work relations over the past decade. The proportion of
employees benefiting from all work-related benefits (paid holidays, bonuses, medical cover,
etc.) has also increased, to the extent that the contractualization of wage relations is now
widespread in the Zone Franche, which was far from the case just a few years ago. This
fundamental change, which has occurred in record time, is all the more exceptional in that it
took several decades for the industrialised countries to achieve the same result. The 1980s and
1990s even saw an inverse trend towards increased insecurity in wage relations in most of the
emerging countries (see Saavedra, 2003, for a study of Latin America). This positive trend for
the Malagasy labour force has gradually spread to the formal sector as a whole. The model
introduced by the Zone Franche was probably a driving force behind this.
4.2. But social progress is being reversed
The abovementioned advantages of working in the Zone Franche are actually offset by a
series of negative factors. Apart from the low wages, these include the workload and work
13

pace, both far higher than elsewhere. Integration into the world market and its demands in
terms of competitiveness (costs, delivery times and quality) force the companies to tighten
their labour management, with stricter controls as regards rates, output and productivity. The
problems caused by steadily increasing working hours, standing at 54 hours in 2006, are all
the more acute since the Zone Franche employs large numbers of women who suffer, as
elsewhere, from the “double day” phenomenon since they also have to cope with domestic
tasks and bringing up their children (Rambeloma, Rabeson and Andrianarison, 2002).
Moreover, the relative advantages benefiting Zone Franche employees are progressively
being reduced for the same reasons explaining the declining tend of relative wages, i.e.
increased international competition for clothing products. All the main advantages (company
medical service, paid holidays, company-paid training) peaked at the beginning of the 2000s
and have been progressively reduced since then. Simulateously, the percentage of trade union
presence has declined. This degradation has also been observed in the rest of the economy, as
if after playing a leading role for social progress, the Zone Franche was now contributing to
social regression and to the process of informalization of labour under international
competitive pressure.
These elements help us to understand why the employee satisfaction rates in the Zone
Franche, albeit high, are no higher than the average (Table 6).16 Further proof of this is the
high staff turnover, calculated by the ratio of the number of employees who left their
companies in the year preceding the survey to this same total plus those still employed in the
Zone Franche at the time of the survey. Every year, about one in five Zone Franche
employees leave their job, compared with a little over one in ten in the formal private sector.
This rate is far higher than in Mauritius, where it is around only one in twenty (Cadot and
Nasir, 2001).
5. CONCLUSION
The Zone Franche has been the main driving force behind employment and export growth in
Madagascar over the last decade and has made a major contribution to the economic upturn
observed since 1995 after a long recession period. Contrary to academic wisdom, the Zone
Franche has also been up to the beginning of the 2000’s the driving force behind the observed
improvement in wages and working conditions in the other sectors of the economy. This
surprising result was explained by the fact that Madagascar is an LDC (where labour
standards are very low on average), unlike Middle Income Countries where most of the EPZs
are established.
14

As expected by many economic studies (see especially Nordas, 2004; Cling, Razafindrakoto
and Roubaud, 2005), the final dismantling of MFAs customs quotas on 1 January 2005 has
benefited mainly the Asian countries and especially China, and has had a negative impact on
most other developing countries, including Madagascar. Since 2005, the Zone Franche
exports have stagnated and employment has slightly decreased.
Due to increased international competition, real wages have decreased in the Zone Franche
and labour standards have deteriorated. Our econometric estimates on individual data show
that the remuneration paid by the Zone Franche companies has become significantly lower,
other things being equal, than that paid by the industrial firms in the formal private sector.
Nonetheless, the Zone Franche companies still pay their employees more on average than the
informal sector, which is the main alternative for the low-skilled female labour force.
The same negative trend is observed for labour standards and non wage benefits, which used
to be much higher (except for working hours) than in the formal private sector: not only are
the working hours increasingly longer but most relative advantages (company medical
service, paid holidays, etc.) are being reduced in the Zone Franche as well as in the rest of the
economy.
The success of the Zone Franche is therefore under threat. Beyond the case of Madagascar,
the Zone Franche’s success had added fuel to the idea that using EPZs to develop a
productive manufacturing base and promote employment was a possible path for African
countries. This paper shows that this strategy is not sustainable anymore since the end of the
MFAs. Yet an alternative growth model has still to be designed.
15

REFERENCES
Banque centrale de Madagascar (2002), Rapport annuel 2001. Antananarivo, Madagascar :
Banque centrale de Madagascar.
Cadot, O., Nasir, J. (2001). Incentives and Obstacles to Growth: Lessons from Manufacturing
Case Studies in Madagascar. Regional Program on Enterprise Development, Discussion
Paper No. 117, Washington, DC: The World Bank.
Cling, J.-P., Razafindrakoto, M., Roubaud F. (2005). Export Processing Zones in Madagascar:
a Success Story under Threat? World Development, 33(5), 785-803.
Gibbon, P. (2003). The African Growth and Opportunity Act and the Global Commodity
Chain for Clothing. World Development, 31(11), 1809-1827.
Glick, P.J., Roubaud, F. (2006). Export Processing Zone Expansion in an African Country.
What Are the Labour Market and Gender Impacts? Journal of African Economies, 15(4),
722-756.
HM Treasury, Department of Trade and Industry (2004). Trade and the Global Economy: The
role of international trade in productivity, economic reform and growth. Joint Report.
London: HM Treasury.
ICFTU (2003). Export Processing Zones – Symbols of Exploitation and a Development Dead-
End. Brussels: International Confederation of Free Trade Unions (ICFTU).
ILO (2003). Employment and social policy in respect of export processing zones (EPZs).
International Labour Office, Governing Body, Committee on Employment and Social
Policy. Geneva: ILO.
International Monetary Fund (2003). Madagascar: Selected Issues and Statistical Appendix.
IMF Country Report No. 03/7. Washington, DC: IMF.
Integrated Framework (2003). Madagascar. Diagnostic Trade Integration Study, Volume 1,
draft, August 15. Available: http://www.integratedframework.org.
Jayanthakumaran, K. (2003). Benefit-Cost Appraisals of Export Processing Zones: A Survey
of the Literature. Development Policy Review, 21(1), 51-65.
Jenkins M., Esquivel G., Larrain F. (1998). Export Processing Zones in Central America.
Development Discussion Paper No. 646. Cambridge, MA: Harvard Institute for
International Development.
Kusago, T., Tzannatos Z. (1998). Export Processing Zones: A Review in Need of Update.
Social Protection Group, Human Development Network. The World Bank, SP Discussion
Paper No. 9802. Washington, DC: The World Bank.
Lipsey, R. E., Sjöholm F. (2003). Foreign direct investment, education and wages in
Indonesian manufacturing. Journal of Development Economics, 73(1), 415-422.
16

Madani, D. (1999). A review of the role and impact of Export Processing Zones, World Bank
Working Paper No. 2238. Washington, DC: The World Bank.
MADIO (1999). Le secteur industriel formel à Madagascar ; Caractéristiques,
Performances, Perspectives, enquête annuelle dans l’industrie, Exercice 1997, Premiers
résultats. Publications INSTAT / MADIO. Antananarivo, Madagascar : Institut National
de la Statistique.
Martins, P. S. (2004). Do Foreign Firms Really Pay Higher Wages? Evidence from Different
Estimators. University of London, Department of Economics - Institute for the Study of
Labour. IZA Discussion Paper No. 1388. Bonn: Institute for the Study of Labor (IZA).
Mattoo, A., Roy, D., Subramanian A. (2003). The Africa Growth and Opportunity Act and Its
Rules of Origin: Generosity Undermined? World Economy, 26, 829-851.
Nicita, A., Razzaz, S. (2003). Who benefits and how much? How gender affects welfare
impacts of a booming textile industry. World Bank Policy Research Working Paper No.
3029. Washington, DC: The World Bank.
Nordas H. K. (2004), The Global Textile and Clothing Industry post the Agreement on
Textiles and Clothing, Discussion Paper No 5, Geneva : World Trade Organization.
Raison-Jourde, F., Raison, J.-P. (2002). Madagascar, les urnes et la rue. Politique africaine,
86 (juin), numéro spécial.
Rakotomanana, F., Ramilison, E., Roubaud, F. (2003). The creation of an annual employment
survey in Madagascar. An example for sub-Saharan Africa. Inter-Stat, 27, September,
EUROSTAT, DFID, INSEE, 35-58.
Rambeloma, T., Rabeson, V., Andrianarison, F., (2002). Impact de la libéralisation sur
l’emploi à Madagascar. Analyse genre : cas des zones franches, miméo, Third World
Network – Africa, Réformes Economique et Analyse Genre en Afrique (REAGA),
Antananarivo, Madagascar.
Ramilison, E. (2003). Impact de la crise politico-économique de 2002 sur l’emploi et les
conditions d’activité des ménages de l’agglomération d’Antananarivo. Institut National de
la Statistique (INSTAT) / Projet MADIO. Antananarivo, Madagascar : INSTAT.
Razafindrakoto, M., Roubaud, F. (1997). Les entreprises franches à Madagascar : économie
d’enclave ou promesse d’une nouvelle prospérité ? Economie de Madagascar, 2,
BCM/INSTAT, Madagascar, 217-248.
Razafindrakoto, M., Roubaud, F. (2000). La dynamique du marché du travail dans
l’agglomération d’Antananarivo entre 1995 et 1999 : la croissance économique profite-t-
elle aux ménages ? Economie de Madagascar, 4, BCM/INSTAT, Madagascar, 103-137.
17

Razafindrakoto, M., Roubaud, F. (2002). Les entreprises franches à Madagascar : Atouts et
contraintes d’une insertion mondiale réussie. Afrique contemporaine, 202-203 (avril-
septembre), 147-163.
Razafindrakoto, M., Roubaud, F. (2003). Two original poverty monitoring tools: the 1-2-3
surveys and the Rural Observatories. In J.-P. Cling, M. Razafindrakoto, & F. Roubaud
(Eds.), New International Poverty Reduction Strategies (pp. 313-339). London, New York:
Routledge.
Romero, A. (1995). Labour standards and EPZ; Situation and pressures for change.
Development Policy review, 13, 247-276.
Roubaud, F. (Ed.) (2002). Madagascar après la tourmente : regards sur dix ans de transitions
politique et économique, Afrique contemporaine, 202-203, avril-septembre, numéro
spécial,.
Saavedra, J. (2003). Labour markets during 1990s. In P. P. Kuczynski & J. Williamson (Eds.),
After the Washington Consensus: Restarting Growth and Reform in Latin America.
Washington, DC: Institute of International Economics.
UNCTAD (2002). The Least Developed Countries Report 2002; Escaping the Poverty Trap.
Geneva: United Nations Commission for Trade And Development (UNCTAD).
Watson, P. (2001). Export Processing Zones: Has Africa Missed the Boat? Not yet! World
Bank Africa Region Working Paper No. 17. Washington, DC: The World Bank.
18
Table 1. Clothing exports of mqjor African exports compared to selected Asian countries (2003-2006)
Unit : million dollars 2003 2004 2005 2006 2006/2004
(%) Mauritius Total 896 865 712 721 -16,6 - EU 627 638 555 602 - USA 269 227 167 119 Madagascar Total 347 520 506 526 1,2 EU 151 197 229 288 USA 196 323 277 238 Lesotho Total 394 457 392 388 -15,1 - EU 1 1 1 1 - USA 393 456 391 387 Kenya Total 192 280 278 265 -5,4 - EU 4 3 7 1 - USA 188 277 271 264 China Total 13,970 18,288 45,365 49,981 173,3 - EU 12,361 13,730 22,960 22,974 - USA 11,609 14,558 22,405 27,067 Vietnam Total 3,115 3,478 3,793 4,611 32,6 - EU 631 758 912 1,215 - USA 2,484 2,720 2,881 3,396 Cambodia Total 1,726 2,085 2,319 2,841 36,3 - EU 475 643 592 690 - USA 1,251 1,442 1,727 2,151 Source: Otexa (US) and Eurostat (EU). Total means the sum of total exports to the EU and the US.
19

Table 2. Change in the employment breakdown by institutional sector in Antananarivo (1995-2006) (%) Growth period: 1995-2001 Crisis period:
2001-2002 Recovery period:
2002-2004 Average
annual growth
rate
Contri-bution
Structure Growth rate
Structure Growth rate
Structure
INSTITUTIONAL SECTOR 1995/ 2001
1995/2001
1995 2001 2001/ 2002
2002 2002/ 2004
2004
Public administrations -1.4 -3 11.6 8.1 2.3 8.3 11.0 8.3 Public companies 4.1 2 2.7 2.6 7.1 2.8 -12.4 2.2 Formal private companies 9.1 61 26.7 34.61 -20.0 33.0 25.9 30.0 - of which Zone Franche 27.2 34 3.1 10.2 -60.0 4.1 146.5 9.0Informal private companies 3.1 38 57.6 53.1 12.2 59.9 9.7 58.4 Total 4.5 100 100 100 -0.4 100 12.3 100
Growth period: 1995-2004 End of quotas:
2004-2006 Average
annual growth
rate
Contri-bution
Structure Growth rate
Structure
INSTITUTIONAL SECTOR 1995/ 2004
1995/2004
1995 2004 2004/ 2006
2006
Public administrations 0.4 1 11.6 8.3 -3.9 7.5 Public companies 1.8 1 2.7 2.2 -39.1 1.3 Formal private companies 5.0 37 28.1 30.0 10.3 31.4 - of which Zone Franche 15.4 22 3.1 9.0 -6.0 8.0 Informal private companies 4.0 65 57.6 58.4 4.5 58.0 Total 3.8 100 100 100 2.6 100
Source: 1-2-3 Surveys, phase 1 (employment) 1995-2006, INSTAT/MADIO, authors' calculations.
Table 3. Labour force characteristics in the Zone Franche compared with the other sectors (Antananarivo), 2006
Public
sector Formal private sector
Of which: Industrial (excl. EPZ)
Of which: EPZ
Informal sector
Total
Monthly income (USD) 95 57 61 40 33 46 Hours worked per week 44.0 48.0 47.5 53.9 44.0 45.6 % women 35.5 43.9 31.8 70.5 50.6 47.0 % managerial staff 34.5 11.4 10.8 6.8 0.2 7.0 % trade union presence 44.4 25.0 26.4 54.6 0.2 12.4 Years of schooling 11.8 9.2 9.0 7.6 6.2 7.8 Potential experience 26.2 19.1 20.0 16.1 22.6 21.8 Seniority 11.9 5.7 6.3 3.8 7.7 7.4 Size of company (% >=100 employees)
100 36.8 30.8 87.5 0 20.9
Source: 1-2-3 Survey, Phase 1, 2006, DIAL/INSTAT, authors’ calculations.

Table 4. Equation of Zone Franche hourly wages/rest of the formal industrial sector (1995-2006)
Wages (excluding bonuses) Wages (including bonuses) Model 1 Model 2 Model 3 Model 4
Intercept -1.560 (44.77) -1.470 (41.68) -1.551 (42.38) -1.468 (39.64) Sex (Male=1) 0.123 (8.74) 0.109 (8.26) 0.129 (8.75) 0.114 (8.26) Years of schooling 0.095 (47.16) 0.066 (31.26) 0.097 (46.04) 0.067 (30.13) Seniority 0.018 (6.58) 0.017 (6.61) 0.026 (8.89) 0.025 (8.97) Seniority squared -0.0003 (3.15) -0.0003 (3.38) -0.0004 (4.68) -0.0005 (4.96) Experience 0.011 (13.00) 0.008 (10.43) 0.011 (12.66) 0.008 (10.08)
Year: 1995 -0.452 (15.06) -0.398 (13.98) -0.422 (13.39) -0.360 (12.04) 1996 -0.264 (8.99) -0.195 (7.01) -0.216 (7.02) -0.138 (4.73) 1997 -0.161 (5.56) -0.122 (4.47) -0.077 (2.54) -0.034 (1.18) 1998 -0.102 (3.56) -0.050 (1.83) -0.047 (1.58) 0.013 (0.47) 1999 -0.040 (1.43) -0.003 (0.10) 0.028 (0.94) 0.070 (2.52) 2000 0.016 (0.60) 0.021 (0.83) 0.062 (2.16) 0.068 (2.53) 2001 0.037 (1.36) 0.023 (0.90) 0.085 (2.97) 0.070 (2.63) 2002 0.003 (0.10) 0.003 (0.09) 0.020 (0.58) 0.014 (0.43) 2004 0.009 (0.33) 0.002 (0.09) 0.025 (0.83) 0.016 (0.59) 2006 - - - - Socio-economic group:
Senior managers 1.352 (26.33) 1.391 (25.79) Middle manager 0.566 (18.95) 0.614 (19.58) Empl., skilled workers 0.195 (10.14) 0.227 (11.23) Empl., unskilled workers 0.0879 (4.33) 0.100 (4.58) Laborers - - Dummy EPZ (=1) -0.028 (-1.84) -0.029 (2.06) -0.010 (0.65) 0.022 (1.24) Number of observations 6 352 6 352 6 352 6 352 R-squared 0.35 0.43 0.35 0.43
Source: 1-2-3 Surveys, Phase 1, 1995-2006, INSTAT/MADIO, authors’ calculations. In brackets, the absolute value of the t-statistics Reading: In model 1, a man’s average hourly wage exceeds that of a woman by 13.1% (coefficient 0.123) all other things being equal.
21
Table 5. Equation of hourly earnings in Zone Franche/rest of labor market (1995-2006)
Earnings (excluding bonuses) Earnings (including bonuses) Model 1 Model 2 Model 3 Model 4
Intercept -2.149 (129.54) -1.093 (35.49) -2.116 (127.21) -0.944 (30.51) Sex (Man=1) 0.257 (35.21) 0.225 (31.81) 0.256 (34.95) 0.216 (30.38) Years of schooling 0.136 (153.52) 0.103 (99.81) 0.137 (155.19) 0.102 (98.31) Seniority 0.028 (27.69) 0.022 (21.89) 0.030 (29.54) 0.024 (23.76) Seniority squared -0.0006 (19.86) -0.0004 (16.70) -0.0006 (20.71) -0.0005 (17.59) Experience 0.013 (37.89) 0.010 (27.92) 0.013 (35.19) -0.009 (26.13)
Year: 1995 -0.300 (18.31) -0.270 (17.12) -0.236 (14.36) -0.212 (13.37) 1996 -0.284 (17.57) -0.267 (17.24) -0.252 (15.58) -0.236 (15.20) 1997 -0.185 (11.59) -0.190 (12.38) -0.134 (8.38) -0.141 (9.14) 1998 -0.093 (5.82) -0.084 (5.47) -0.054 (3.40) -0.049 (3.15) 1999 -0.024 (1.46) -0.010 (0.66) -0.009 (0.58) -0.019 (1.23) 2000 -0.038 (2.38) -0.026 (1.71) -0.077 (4.80) -0.065 (4.23) 2001 0.092 (5.68) 0.071 (4.55) 0.121 (7.45) 0.099 (6.37) 2002 0.032 (1.97) 0.034 (2.18) 0.039 (2.36) 0.044 (2.77) 2004 0.017 (1.04) 0.012 (0.74) 0.034 (2.08) 0.031 (1.96) 2006 - - - - Socio-economic group:
Senior managers - - Middle managers -0.258 (10.33) -0.264 (10.49) Empl., skilled workers -0.539 (23.83) -0.590 (25.99) Empl., unskilled workers -0.746 (30.43) -0.820 (33.30) Laborers -1.111 (44.60) -1.145 (45.76) Employers -0.140 (5.39) -0.294 (11.26) Self-employed -0.668 (28.80) -0.828 (35.57) Fam. help & Apprent. -1.005 (27.06) -1.132 (30.34) Dummy EPZ (=1) 0.106 (7.26) 0.034 (2.29) 0.146 (9.98) 0.033 (2.24) Number of observations 50 010 50 010 50 010 50 010 R-square 0.40 0.45 0.40 0.45
Source: 1-2-3 Survey, Phase 1, 1995-2006, INSTAT/MADIO, authors’ calculations. Note: idem Table 4.
22

Table 6. Share of employees with job benefits in the Zone Franche compared with the other sectors (Antananarivo), 2006 Public
sector Formal private sector
Of which: Industrial (non-Zone Franche)
Of which: Zone Franche
Informal sector
Total
Social security registration 80.7 56.6 57.4 83.5*** 2.4 45.9 Company medical service 58.1 42.5 44.7 64.6*** 4.7 34.8 Paid holidays 68.1 40.0 40.6 60.8*** 2.2 34.5 Pay slip 92.9 76.7 79.1 97.0*** 8.4 60.7 Written contract 95.9 76.5 78.1 96.3*** 15.3 63.1 Company-paid training 31.4 14.6 15.2 14.7* 2.8 14.3 Do not want to change job 79.4 69.3 69.6 72.6 60.0 68.5
Source: 1-2-3 Survey, Phase 1, 2006, DIAL/INSTAT, authors' calculations. Note: ***: significant positive coefficient at 1% threshold (logit models in private formal industrial sector).
621761 795
9451050
880
1170
1360
1080 1100
695683526507520
304233
430365295239207169
115
0
200
400
600
800
1000
1200
1400
1600
1995 1996 1997 1998 1999 2000 2001 2002 2003 2004 2005 2006
Total Zone Franche
In millions of dollars Graph 1. Malagasy exports (1995-2006)
Souce: International Trade Centre PC-TAS database for total exports; Otexa and Eurostat for Zone franche exports (clothing products).
23
-50%
-40%
-30%
-20%
-10%
0%
10%
20%
30%
40%
1995 1996 1997 1998 1999 2000 2001 2002 2004 2006
Monthly wage Hourly wage
Premium (incl. socio-eco group) Premium (excl. socio-eco group)
Political crisis Dismantling quotas
Graph 2. Change in relative wages and wage premium in the Zone Franche from 1995 to 2006: Zone Franche vs. non-Zone Franche formal industrial private sector Sources: 1-2-3 Survey, Phase 1, 1995-2006, INSTAT/MADIO, authors' calculations. Note: Remuneration excludes bonuses. The monthly and hourly wage curves correspond to the ratio of wages in the Zone Franche compared with the other sectors. The premium corresponds to the coefficients of models 1 and 2, estimated for each year. For each curve, the significant coefficients (5%) are shown in black.
-40%
-30%
-20%
-10%
0%
10%
20%
30%
40%
1995 1996 1997 1998 1999 2000 2001 2002 2004 2006Monthly earnings Hourly earningsPremium (excl. socio-eco group) Premium (incl. socio-eco group)
Dismantling quotasPolitical crisis
Graph 3. Change in relative earnings and earnings premium in the Zone Franche from 1995 to 2006: Zone Franche vs. Rest of the economy Sources: 1-2-3 Survey, Phase 1, 1995-2006, INSTAT/MADIO, authors' calculations. Note: idem graph 2.
24

Notes 1 The only econometric studies based on individual establishment data (Lipsey & Sjöholm, 2003) and
matched data (Martins, 2004) concern remuneration paid by all foreign firms (rather than just EPZs)
compared with that paid by domestic firms. These studies posit that foreign firms pay more, other
things being equal, but that this premium falls substantially when the manpower’s heterogeneity and
the firms’ individual characteristics are taken into account. 2 For example, the World Bank working paper on EPZs in Africa published by Watson (2001) does
not even mention them. A British government white paper published in 2004 even states that
“[excepting Mauritius] other African countries such as Zimbabwe, Senegal, Madagascar and
Cameroon have failed to benefit substantially from EPZs” (HM Treasury & DTI, 2004). 3 Our paper draws on Cling, Razafindrakoto, Roubaud (2005), which covers the period 1995-2001.
The analyses made in this previous paper have been completely updated. They take into account recent
developments such as the end of apparel quotas and the results of some econometric estimates, based
on more recent data (4 more years). The latter are largely different and bring substantially new
conclusions. 4 Gibbon (2003) holds that ownership in the EPZs was mainly Mauritian. However, his observation is
not backed up by quantitative data. 5 The answers given by Zone Franche company heads interviewed for the 1998 industrial survey
show that 66% of Zone Franche companies, accounting for 87% of exports, would not have been
created had it not been for the special scheme (Razafindrakoto & Roubaud, 2002). 6 National customs data are very erratic and not reliable to measure the value of Malagasy exports
(Cling, Razafindrakoto, Roubaud, 2005). Therefore, we use instead an indirect estimate based on
imports from Madagascar (the “mirror-data” method), as most studies on African foreign trade do.
Malagasy total goods exports are measured through total world imports from Madagascar. As the
United States and the European Union are its main markets, we use US and EU apparel import data as
mirror-data for Zone Franche exports. The mirror-data do not explicitly identify exports from the
Zone Franche. Given that nearly all apparel exports come from the Zone Franche and that most of its
firms are specialised in clothing, it can be assumed that total apparel exports are roughly equivalent to
total Zone Franche exports. 7 Enterprise surveys confirm this finding. Average gross remuneration for employees in the Zone
Franche is about one-third lower than that for employees working in the formal industrial sector as a
whole (MADIO, 1999). Even if we only take into account permanent workers, the vast majority of the
Zone Franche companies are less generous, with differences of 15% to 20% depending on the year. 8 The proportion of women fell significantly compared with 1995, when they accounted for nearly
84% of labour. This trend has been observed in many countries. Nonetheless, Glick & Roubaud (2004)
consider that this is not due to a shift towards male-oriented skills as in export processing
manufacturing in other countries. Zone Franche workers’ mean years of schooling actually fell from
1995 to 2001.
25

9 The basic wage is just one element of remuneration, albeit the largest. The growing competition
faced by Zone Franche companies has prompted them to favour more individualised wage policies
and productivity incentives, by offering productivity bonuses and profit-sharing schemes. The
different variable components of remuneration are far from negligible since they represent 11% to
22% of basic wages depending on the year. Yet these variable components are not found exclusively
in the Zone Franche. All types of companies offer them, with the notable exception of the informal
sector. The public sector (administration and public companies) is extremely generous in this respect.
Ultimately, the estimates (not presented here) regarding the basic wage alone are very similar to those
based on total earnings. 10 We also tested for non-linearities on the return on education and professional experience by
including years of schooling and professional experience squared in the independent variables.
However, the coefficients were found not significant. 11 Using the consumer price index for the capital as deflator (base 100 in 1995). 12 An improvement in skills, that is a significant increase in the average number of years of schooling,
is observed from 1995 to 2001. But the significant coefficient of the year dummies shows that other
factors (especially the improvement in macroeconomic conditions) also contributed to the sharp
increase in real wages. The level of the t-statistics suggests a significant positive trend over time. This
can be formally tested for all models by introducing a time trend in place of the time dummies. The
results confirm the existence of a systematic and significant positive time trend (at the 1% level in all
cases), varying from 6% to 7.5% depending on the different specifications. 13 Note that, contrary to wages, earned income for non-wage groups includes returns on both human
and physical capital. Although not directly estimated in the equation, the return on physical capital is
partly captured by the socio-economic group (employer versus self-employed worker). 14 The estimated models are similar to those presented here, but have not been included. They cover
the entire labour market, broken down into five institutional sectors (public administration, public
enterprises, formal private sector excluding the Zone Franche, Zone Franche and informal sector).
The results are available from the authors on request. 15 The results of these models are not included here, but are available from the authors on request. 16 This relatively high satisfaction rate may seem to contradict the low average job seniority levels
presented in Table 2. But the satisfaction index as defined here only concerns employees who have
kept their jobs. It is overestimated in that it does not take into account employees who have left their
jobs. Conversely, the low average levels of job seniority are not just the result of higher turnover in the
Zone Franche, but also of the fact that this special scheme for these companies was created fairly
recently and their very strong recruitment campaigns automatically reduce average employee
seniority.
26
Recommended