EXPERIMENTAL AND NUMERICAL INVESTIGATION OF STEEL
SECTIONS OF STORAGE SYSTEMS TESTED TO FAILURE
G.C. Manos1, A. Nalmpantidou2, V. Kourtides3
1 Professor and ex-Director of the Lab. of Strength of Materials and Structures, Aristotle University
e-mail: [email protected]
2 Postgraduate student, Lab. of Strength of Materials and Structures, Aristotle University
e-mail: [email protected]
3 Dr. Civil Engineer, Research Ass., Lab. of Strength of Materials and Structures, Aristotle University
Abstract
This paper presents the experimental and numerical investigation of steel sections of storage
systems under compressive loading according to EN15512 Standards. This investigation was
carried out at the Laboratory of Strength of Materials of Aristotle University of Thessaloniki
The experimental part included a number of full-scale specimens of single columns and typi-
cal frames which are used in storage systems. This typical frame unit consist two columns
joined together by diagonal bracing. These specimens were tested to failure being subjected
to a vertically compressive point load. It can be concluded that in these cases the numerical
simulation is quite successful in predicting the axial compressive capacity of the named Ome-
ga sections for single columns.The beneficial presence of the bolts and spacers is recognized
by the numerical simulation, as can be seen by comparing the predicted axial compressive
load capacity without and with bolts and spacers. When the column is provided with bolts and
spacers in closer distances it results in an increase of the numerically predicted axial com-
pressive load bearing capacity. .The corresponding buckling modes, which are predicted by
the numerical simulations bear a certain degree of resemblance with the observed during
testing buckling modes.
Keywords: Steel storage systems, Failure Tests, Bearing capacity, Buckling modes, Numeri-
cal Simulation.
212
COMPDYN 2019 7th ECCOMAS Thematic Conference on
Computational Methods in Structural Dynamics and Earthquake Engineering M. Papadrakakis, M. Fragiadakis (eds.)
Crete, Greece, 24–26 June 2019
Available online at www.eccomasproceedia.org Eccomas Proceedia COMPDYN (2019) 212-224
ISSN:2623-3347 © 2019 The Authors. Published by Eccomas Proceedia.Peer-review under responsibility of the organizing committee of COMPDYN 2019. doi: 10.7712/120119.6914.19163

G. C.Manos, A. Nalmpantidou, V.Kourtides
1 INTRODUCTION
Racking systems are load bearing structures for the storage and retrieval of goods in ware-
houses for goods that are to be stored generally on pallets or in box-containers. In addition to
the Eurocodes there are requirements included in EN Standards for racking and shelving, be-
cause of the differences in shape of structural components, detailing and connection type's in
order to have reliable state of the art guidance for the practicing designer involved in design-
ing racking [1].
This paper presents the experimental and numerical investigation of steel sections of stor-
age systems under compressive loading according to EN15512 Standards [1]. This investiga-
tion was carried out at the Laboratory of Strength of Materials of Aristotle University of
Thessaloniki. A numerical study is also performed in an effort to simulate the observed be-
haviour of the single columns and the typical storage systems frames. The loading arrange-
ment as well as the observed behaviour in terms of load bearing capacity and failure modes is
presented and discussed.
2 EXPERIMENTAL SETUP OF OMEGA COLUMNS
An experimental investigation of steel sections of storage systems under compressive load-
ing according to EN15512 Standards was carried out at the Laboratory of Strength of Materi-
als of Aristotle University of Thessaloniki. The experimental part included a number of full-
scale specimens of single columns and typical frames which are used in storage steel sections
of storage systems. Seven different thin walled Omega shaped sections in five different
heights were tested. Below in table 1 there is a summary of all cross sections and their heights
that were studied.
Table 1: Omega cross sections and their heights
Type of Omega sections
Height of tested
specimens (mm)
Omega 60 Omega
60x Omega 90
Omega
90x Omega 120
Omega
120x Omega 150
270 270 270 270
360 360 360
720 720 720 720 720 720 720
1440 1440 1440 1440 1440 1440 1440
2160 2160 2160 2160 2160 2160 2160
Figure 1: Omega cross sections
213
G. C.Manos, A. Nalmpantidou, V.Kourtides
All Omega samples were cut in size before testing. A special steel base was prepared in
order to support the specimens exactly at vertical orientation according to the testing require-
ments described for this purpose in EN15512. Figure 1 and figure 2 show the cross sections
of the Omega test specimens. The center of gravity for each section is also indicated in these
figures. The axial load was imposed for each specimen during testing at the center of gravity,
as provided by the relevant standard EN 15512. For each cross section and each height three
tests were tested in accordance with EN 15512 (three samples per section).
Figure 2: Omega x cross sections
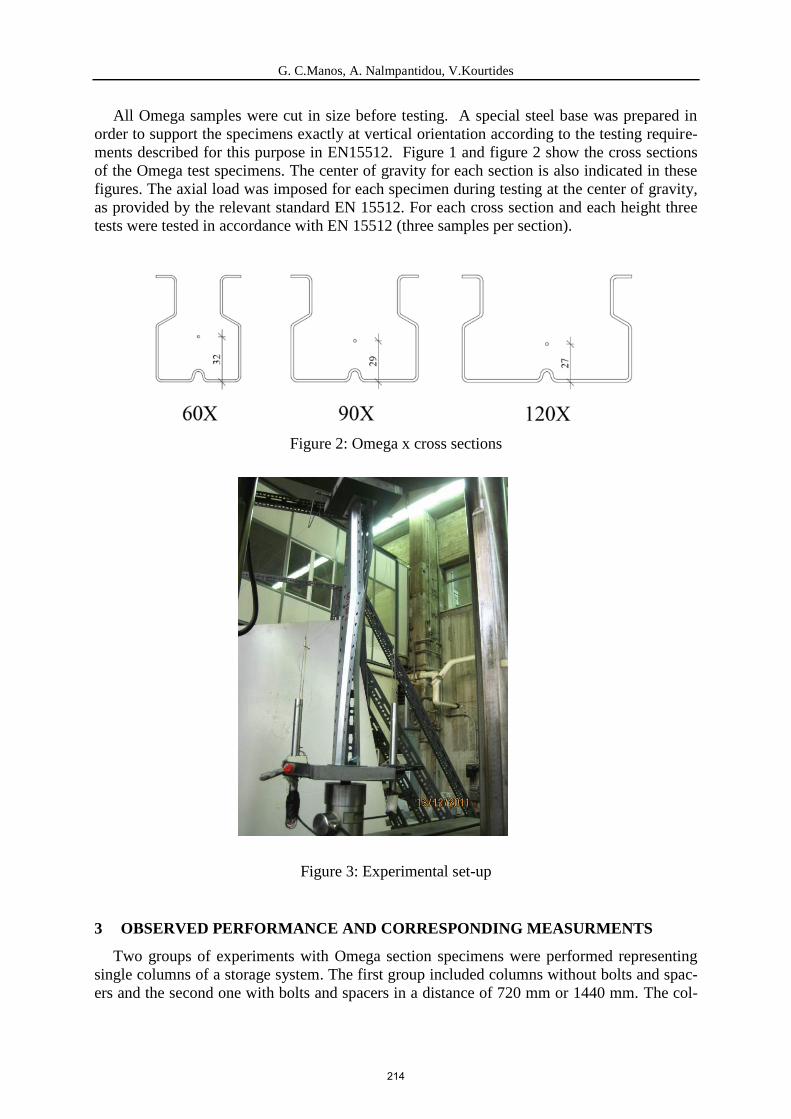
Figure 3: Experimental set-up
3 OBSERVED PERFORMANCE AND CORRESPONDING MEASURMENTS
Two groups of experiments with Omega section specimens were performed representing
single columns of a storage system. The first group included columns without bolts and spac-
ers and the second one with bolts and spacers in a distance of 720 mm or 1440 mm. The col-
214

G. C.Manos, A. Nalmpantidou, V.Kourtides
umns were named after the relevant cross section and the height of the specimen. The speci-
mens that included bolts and spacers include in their code name a relevant indication of the
spacing. Selective results of the bearing capacity and the mode of failure of the tested speci-
mens are presented and discussed. These experimental results provide the basis for a compari-
son with the corresponding numerical predictions of the performance of the tested specimens
as obtained by a subsequent numerical simulation (section 4).
Figure 3 depicts the experimental set-up. After placing each specimen in the testing ma-
chine, with its longitudinal axis having an exact vertical orientation, the axial load was ap-
plied at exactly the center of gravity of each cross-section employing a special fixture
ensuring that the axis of the applied load coincided with the longitudinal axis of each speci-
men through its center of gravity. During each test the applied axial load was continually rec-
orded, utilizing a load-cell at the bottom of the specimen, together with the deformation of the
specimen in the vertical direction, utilizing two displacement transducers in the longitudinal
direction, as it is shown in figure 3. The failure mode was also recorded by photographic
means (see figure 3).
Table 2 lists the bearing capacity in terms of average maximum axial load, recorded during
testing prior to failure. The experimental setup and the failure modes for the five different
column specimens listed in table 2 can also be seen in figures 3, 4, 5, 6, 14 and 15.
Table 2: Results of the tests of Omega sections tested according to EN15512
Code name of section Number of tested spec-
imens
Average max Load (ΚΝ)
60X.270 Three (3) 101.37
120.720 Three (3) 96.45
90.1440 Three (3) 57.20
90.1440.S/720 Three (3) 68.28
90.2160.S/720 Three (3) 53.43
Figure 4: Experimental setup and failure mode of Omega 60x.270
215

G. C.Manos, A. Nalmpantidou, V.Kourtides
Figure 5: Experimental setup and response of Omega 120.720
Figure 6: Experimental setup and response of Omega 90.1440
4 NUMERICAL SIMULATION
In order to simulate numerically the behavior of the tested Omega section specimens a nu-
merical study was performed utilizing the commercial software package ABAQUS [2].
The Omega steel sections of the experimental sequence (figures 3, 4, 5 and 6) were numer-
ically simulated in the 3-D space employing shell elements as shown in figures 7, 8 and 9.
The points of the very bottom section of each specimen were assumed to be fully constrained
representing absolute fixity conditions. On the contrary, the points of the very top side, where
the monotonic compressive load was applied, were constrained only along the two horizontal
out-of-plane directions.
The numerical analysis was carried out using the static riks method of the Abaqus software.
Each numerical model was a very close representation of the tested specimens in terms of ge-
ometric details. The numerical analysis included the inelastic behavior of the material of the
specimens through the ABAQUS isotropic hardening constitutive law by means of a table of
true stress - true strains ([3], [4], [5]). The relevant values of this constitutive material load
were introduced based on relevant axial tension experiments of coupons performed in the la-
boratory of Experimental Strength of Materials and Structures of Aristotle University of
Thessaloniki [5].
216
G. C.Manos, A. Nalmpantidou, V.Kourtides
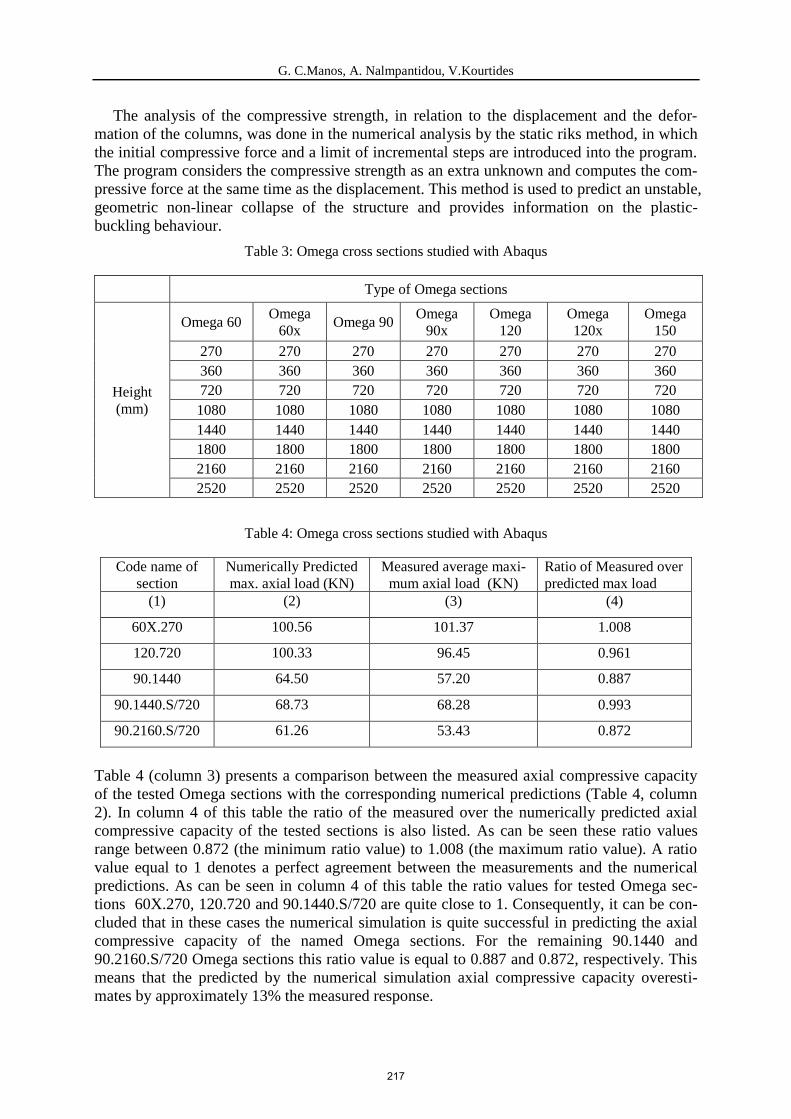
The analysis of the compressive strength, in relation to the displacement and the defor-
mation of the columns, was done in the numerical analysis by the static riks method, in which
the initial compressive force and a limit of incremental steps are introduced into the program.
The program considers the compressive strength as an extra unknown and computes the com-
pressive force at the same time as the displacement. This method is used to predict an unstable,
geometric non-linear collapse of the structure and provides information on the plastic-
buckling behaviour.
Table 3: Omega cross sections studied with Abaqus
Type of Omega sections
Height
(mm)
Omega 60 Omega
60x Omega 90
Omega
90x
Omega
120
Omega
120x
Omega
150
270 270 270 270 270 270 270
360 360 360 360 360 360 360
720 720 720 720 720 720 720
1080 1080 1080 1080 1080 1080 1080
1440 1440 1440 1440 1440 1440 1440
1800 1800 1800 1800 1800 1800 1800
2160 2160 2160 2160 2160 2160 2160
2520 2520 2520 2520 2520 2520 2520
Table 4: Omega cross sections studied with Abaqus
Code name of
section
Numerically Predicted
max. axial load (KN)
Measured average maxi-
mum axial load (ΚΝ)
Ratio of Measured over
predicted max load
(1) (2) (3) (4)
60X.270 100.56 101.37 1.008
120.720 100.33 96.45 0.961
90.1440 64.50 57.20 0.887
90.1440.S/720 68.73 68.28 0.993
90.2160.S/720 61.26 53.43 0.872
Table 4 (column 3) presents a comparison between the measured axial compressive capacity
of the tested Omega sections with the corresponding numerical predictions (Table 4, column
2). In column 4 of this table the ratio of the measured over the numerically predicted axial
compressive capacity of the tested sections is also listed. As can be seen these ratio values
range between 0.872 (the minimum ratio value) to 1.008 (the maximum ratio value). A ratio
value equal to 1 denotes a perfect agreement between the measurements and the numerical
predictions. As can be seen in column 4 of this table the ratio values for tested Omega sec-
tions 60X.270, 120.720 and 90.1440.S/720 are quite close to 1. Consequently, it can be con-
cluded that in these cases the numerical simulation is quite successful in predicting the axial
compressive capacity of the named Omega sections. For the remaining 90.1440 and
90.2160.S/720 Omega sections this ratio value is equal to 0.887 and 0.872, respectively. This
means that the predicted by the numerical simulation axial compressive capacity overesti-
mates by approximately 13% the measured response.
217

G. C.Manos, A. Nalmpantidou, V.Kourtides
Figure 7: Observed and numerically predicted buckling mode for Omega 60.270 section
Figure 8: Observed and numerically predicted buckling mode for Omega 120.720 section
Figure 10: Observed buckling mode for Omega 90.1440 section
218

G. C.Manos, A. Nalmpantidou, V.Kourtides
In figures 7, 8, 9 and 10 the numerically predicted buckling modes are depicted together with
the observed performance of the tested 60.270, 120.720 and 90.1440 Omega sections. As can
be seen in these figures the numerically predicted buckling modes resemble up to a point the
observed performance during the laboratory tests. Therefore, based on these comparisons of
the predicted axial compressive capacity and the buckling mode with the corresponding ob-
served performance it can be concluded that a reasonable approximation of the observed re-
sponse can be reached with the described numerical simulation.
Figure 9: Numerical simulation of the buckling mode for Omega 90.1440 section
5 EXPERIMENTAL SET-UP SUBJECTING A STORAGE FRAME UNIT TO
AXIAL COMPRESSION
An experimental investigation of a typical storage frame was carried out at the Laboratory
of Strength of Materials of Aristotle University of Thessaloniki. This unit consist two col-
umns joined together by diagonal bracing. The two columns of Omega cross sections with a
height of 2.155m are joined with four diagonals. Each diagonal is of c-cross sections having a
length of 1.22m (figures 11, 12 and 13). Near the top of this frame the two columns are with
an additional horizontal brace also of a c-cross section and a length 0.98m. The braces are
connected to the columns with M8 bolts and spacers. Furthermore every 360mm along the
height of each column bolts and spacers have been placed at the columns (figures 11). The
frame is subjected to axial vertical compression and was tested to failure. The compressive
load was applied through a hydraulic jack, which was placed below the bottom support of the
specimen which was formed by a stiff steel beam, together with a load cell. The top of the
two columns were also supported by a steel beam, which is part of a reaction frame (see fig-
ures 11). Displacement transducers were attached to the specimen in order to measure the to-
tal vertical shortening (denoted as positive vertical displacement) as well as the horizontal
out-of-plane displacements.
219

G. C.Manos, A. Nalmpantidou, V.Kourtides
Load
Figure 11. Tested storage frame specimen 90-3
Figure 12. Buckling mode of tested storage frame specimen 90-3
The horizontal transducers were attached in a way to record the horizontal out-of-plane
displacement of the North and South column (see figure 11) of the tested frame at two hori-
zontal planes; one horizontal plane, denoted as upper level in figure 11, was going through a
horizontal cross-section of the specimen located approximately 582mm from the top of the
specimen whereas the second horizontal plane, denoted as lower level in figure 11, was going
Upper
Level
Lower Level
Upper
Level
Lower
Level
Compressive
Load
North South
220
G. C.Manos, A. Nalmpantidou, V.Kourtides
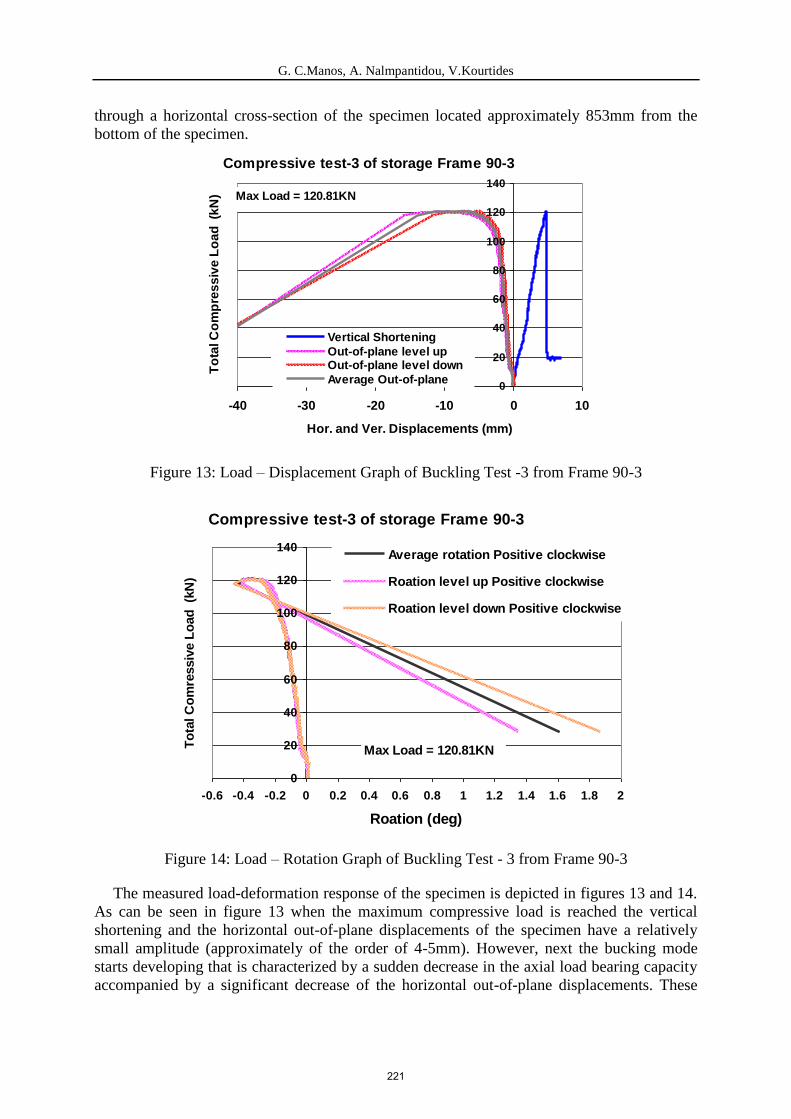
through a horizontal cross-section of the specimen located approximately 853mm from the
bottom of the specimen.
Compressive test-3 of storage Frame 90-3
0
20
40
60
80
100
120
140
-40 -30 -20 -10 0 10
Hor. and Ver. Displacements (mm)
To
tal C
om
pre
ss
ive
Lo
ad
(k
N)
Vertical Shortening
Out-of-plane level upOut-of-plane level down
Average Out-of-plane
Max Load = 120.81KN
Figure 13: Load – Displacement Graph of Buckling Test -3 from Frame 90-3
Compressive test-3 of storage Frame 90-3
0
20
40
60
80
100
120
140
-0.6 -0.4 -0.2 0 0.2 0.4 0.6 0.8 1 1.2 1.4 1.6 1.8 2
Roation (deg)
To
tal C
om
ressiv
e L
oad
(k
N)
Average rotation Positive clockwise
Roation level up Positive clockwise
Roation level down Positive clockwise
Max Load = 120.81KN
Figure 14: Load – Rotation Graph of Buckling Test - 3 from Frame 90-3
The measured load-deformation response of the specimen is depicted in figures 13 and 14.
As can be seen in figure 13 when the maximum compressive load is reached the vertical
shortening and the horizontal out-of-plane displacements of the specimen have a relatively
small amplitude (approximately of the order of 4-5mm). However, next the bucking mode
starts developing that is characterized by a sudden decrease in the axial load bearing capacity
accompanied by a significant decrease of the horizontal out-of-plane displacements. These
221

G. C.Manos, A. Nalmpantidou, V.Kourtides
displacements were approximately the same during the loading of the specimen up to the
maximum load with small differences between the North and South column or the upper and
lower level. However, during the development of the buckling mode and the dramatic de-
crease of the axial compressive load bearing capacity the out-of-plane response is not any
more uniform between the North and South columns of the storage frame. This is depicted in
figure 14 in terms of rotational response of a horizontal cross-section that goes through either
the upper or the lower horizontal levels. The bucking mode is depicted in figures 11 and 12.
6 NUMERICAL SIMULATION OF A STORAGE FRAME UNIT BEING
SUBJECTED TO AXIAL COMPRESSION
Next, a numerical study is performed in an effort to simulate the observed behaviour of the
typical storage frame specimens. As mentioned in section 5 a typical frame consisting of two
Omega columns and diagonal bracings. In order to simulate numerically the behavior of this
typical storage frame a numerical study was performed utilizing the commercial software
package ABAQUS [2].
Initially, the numerical simulation of the behaviour of single columns to axial compressive
load, according to EN15512 Standards, was performed. These columns are of the same cross
section (Omega 90) and height (2160mm) as the columns of the tested frame, shown in sec-
tion 5. Three different numerical simulations are studied; in the first the column is simulated
without any bolts or spacers, whereas in the second two bolts and spacers are also included
with a distance between the equal to 720mm. In the third numerical simulation the bolts and
spacers are located every 360mm intervals along the height, as was in the storage frame spec-
imen, which was also provided with the diagonal bracing. The same loading and support con-
ditions used in the experimental setup, as mentioned in sections 2, 3 and 4 were applied here.
Table 5: Numerically predicted axial load capacity of a single column of height 2160mm with Omega
90 cross-section.
Details of numeri-
cally simulated
columns
Numerically Predict-
ed max. axial load
(KN)
50% of the Measured
maximum axial load of
the tested frame (ΚΝ)
Ratio of Measured over
predicted max load
(1) (2) (3) (4)
Column without
bolts and spacers
56.82 60.40 1.063
Column with bolts
and spacers at
720mm interval
59.81
60.40
1.01
Column with bolts
and spacers at
360mm interval
61.26
60.40
0.986
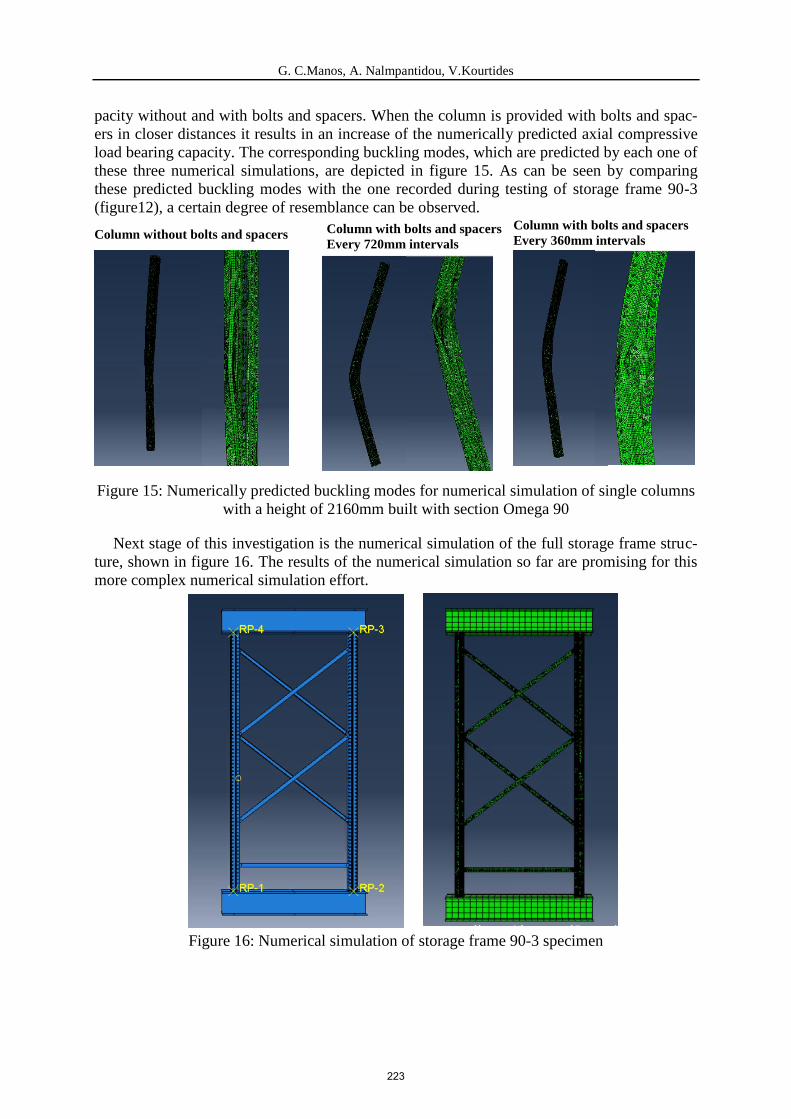
The axial compressive load capacity predicted by these three numerical models is listed in
table 5. The numerical predictions are compared in this table with ½ of the corresponding
maximum load value measured during testing of the storage frame having two such columns,
as explained in section 5. As can be seen by this comparison (ratio values in column 4 of table
5) reasonably good agreement can be reached between numerical predictions and experi-
mental capacity value. The beneficial presence of the bolts and spacers is recognized by the
numerical simulation, as can be seen by comparing the predicted axial compressive load ca-
222
G. C.Manos, A. Nalmpantidou, V.Kourtides
pacity without and with bolts and spacers. When the column is provided with bolts and spac-
ers in closer distances it results in an increase of the numerically predicted axial compressive
load bearing capacity. The corresponding buckling modes, which are predicted by each one of
these three numerical simulations, are depicted in figure 15. As can be seen by comparing
these predicted buckling modes with the one recorded during testing of storage frame 90-3
(figure12), a certain degree of resemblance can be observed.
Figure 15: Numerically predicted buckling modes for numerical simulation of single columns
with a height of 2160mm built with section Omega 90
Next stage of this investigation is the numerical simulation of the full storage frame struc-
ture, shown in figure 16. The results of the numerical simulation so far are promising for this
more complex numerical simulation effort.
Figure 16: Numerical simulation of storage frame 90-3 specimen
Column without bolts and spacers Column with bolts and spacers
Every 720mm intervals
Column with bolts and spacers
Every 360mm intervals
223

G. C.Manos, A. Nalmpantidou, V.Kourtides
7 CONCLUSIONS
1. The behaviour of steel sections used in forming frame structures used for storage of
various products is being investigated with prototype specimens of such sections being
subjected to axial compression according to the provisions of EN-15512.
2. A number of such specimens of various heights has been tested to failure measuring
the axial load capacity and recording the buckling mode of failure. Apart from the
height as a parameter the presence or absence of bolts and spacers was part of the par-
ametric study. A subsequent numerical investigation with numerical models replicat-
ing all the geometric and structural details as well as the loading and support
conditions of the experimental sequence was also carried out.
3. It can be concluded that in these cases the numerical simulation is quite successful in
predicting the axial compressive capacity of the named Omega sections for single col-
umns.
4. The beneficial presence of the bolts and spacers is recognized by the numerical simu-
lation, as can be seen by comparing the predicted axial compressive load capacity
without and with bolts and spacers. When the column is provided with bolts and spac-
ers in closer distances it results in an increase of the numerically predicted axial com-
pressive load bearing capacity.
5. The corresponding buckling modes, which are predicted by the numerical simulations
bear a certain degree of resemblance with the observed during testing buckling modes.
8 REFERENCES
[1] European Standards EN 15512, Steel static storage systems, European Committee for
standardization: Brussels, 2009.
[2] Hibbitt, Karlsson, Sorensen. Inc. ABAQUS user’s manual volumes I–V and ABAQUS
CAE manual. Version 6.10.1. Pawtucket, USA; 2010.
[3] Manos G.C., A. Nalmpantidou A., Kourtides V., Anastasiadis A., (2015), “Cyclic re-
sponse of a steel beam to column connection – an experimental and numerical study”,
Proceedings CompDyn 2015, M. Papadrakakis, V. Papadopoulos, V. Plevris (eds.),
Crete Island, Greece, 25–27 May 2015.
[4] Manos G.C., V. Soulis, A. Nalmpantidou A., Kourtides V., (2017), “Numerical Study of
the Bearing Capacity and Modes of Failure of Metal Scaffolding Unit Subjected to Ver-
tical Compression”, Proceedings CompDyn 2017, M. Papadrakakis and M. Fragiadakis
(eds.), Rhodes Island, Greece, 15–17 June 2017.
[5] Manos G.C., A. Nalmpantidou A., Kourtides V., (2017), “Experimental Tests and Nu-
merical Simulation of the Plastic Behaviour of Simple Steel Coupons”, Proceedings
CompDyn 2017, M. Papadrakakis and M. Fragiadakis (eds.), Rhodes Island, Greece,
15–17 June 2017.
224
Recommended


![EXPERIMENTAL AND NUM ERICAL INVESTIGATION … · the thermal performance of the heat exchanger unit ... [6] energy systems , water desalination [7 ... pipes and are the ones used](https://img.pdfslide.us/doc/110x75/5b82fc8f7f8b9a934f8c39eb/experimental-and-num-erical-investigation-the-thermal-performance-of-the-heat.jpg)