Experimental and CFD investigations into slamming of small, high speed craft
Dominic Hudson, Simon Lewis, Stephen Turnock
ONR Hull slamming workshop, Caltech
17-18th February 2009

Background• Work in support of
Design of High Performance Craft from a Human Factors Perspective
• This involves:
• Model and full scale testing• Measurements of muscle fatigue and
heart rate on passengers on board
• Prediction of motions of high speed craft
• Suspension seat design
Heart rate and Oxygen consumption
0%
10%
20%
30%
40%
50%
60%
70%
1 11 21 31 41 51 61 71 81 91 101 111
Time (minutes)
Pe
rce
nta
ge
ma
xim
al
He
art
ra
te
0%
5%
10%
15%
20%
25%
30%
35%
40%
45%
Pe
rce
nta
ge
VO 2m
ax
heart rate VO2
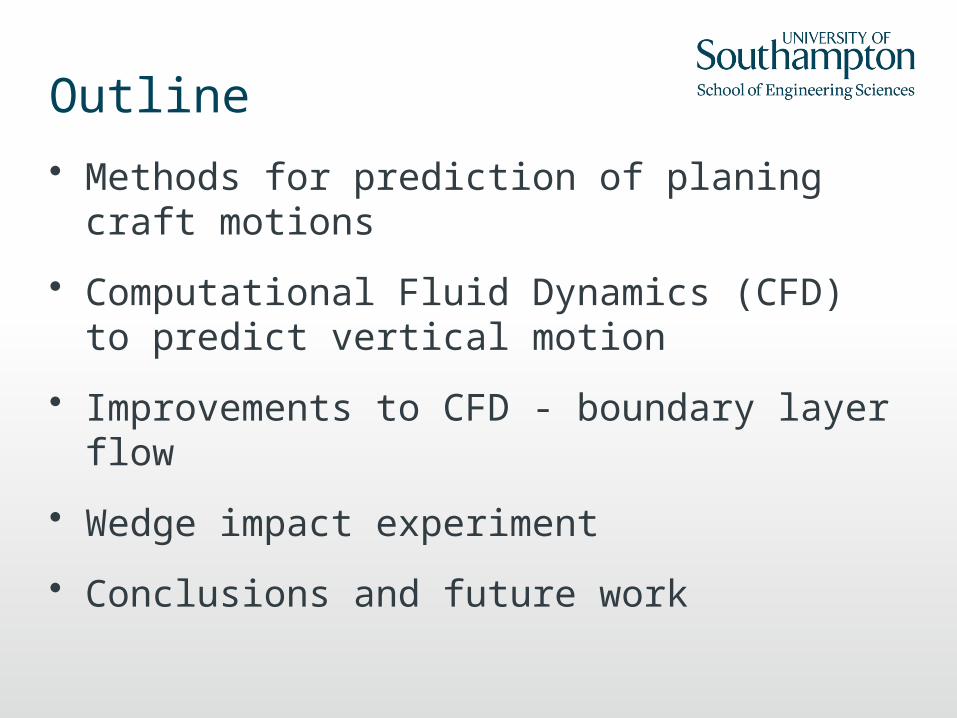
Outline
• Methods for prediction of planing craft motions
• Computational Fluid Dynamics (CFD) to predict vertical motion
• Improvements to CFD - boundary layer flow
• Wedge impact experiment
• Conclusions and future work
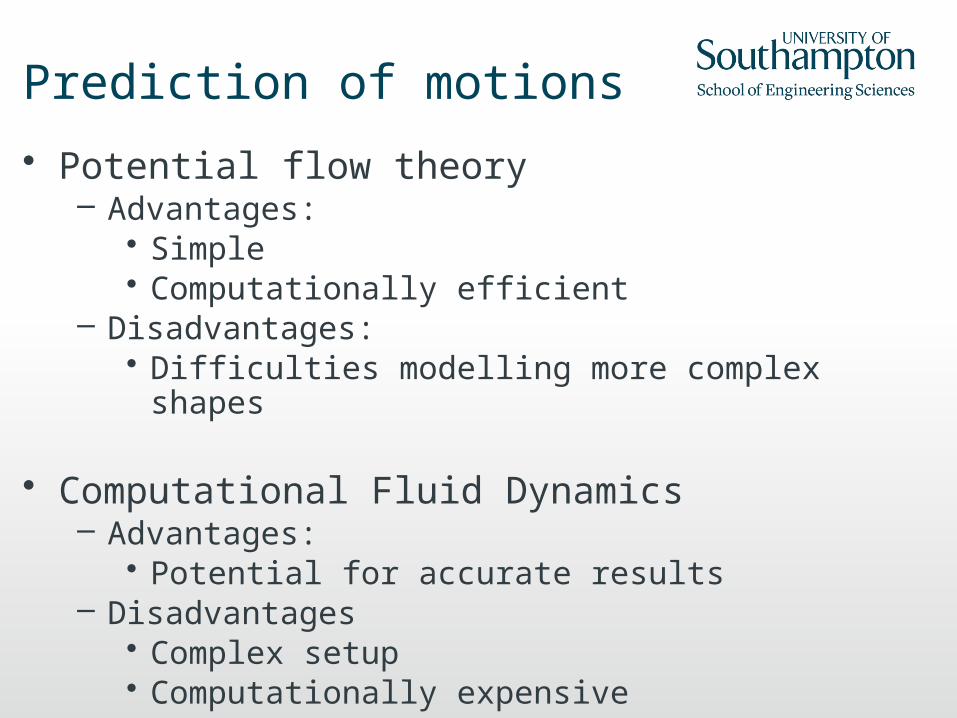
Prediction of motions
• Potential flow theory– Advantages:
• Simple• Computationally efficient
– Disadvantages:• Difficulties modelling more complex shapes
• Computational Fluid Dynamics– Advantages:
• Potential for accurate results– Disadvantages
• Complex setup • Computationally expensive
2D CFD - wedge impact• Computational fluid dynamics method using
– RANS equations (ANSYS CFX 11)
• Transient simulation
• Equations of motion solved at each timestep
• Initial investigations used published experimental data for validation
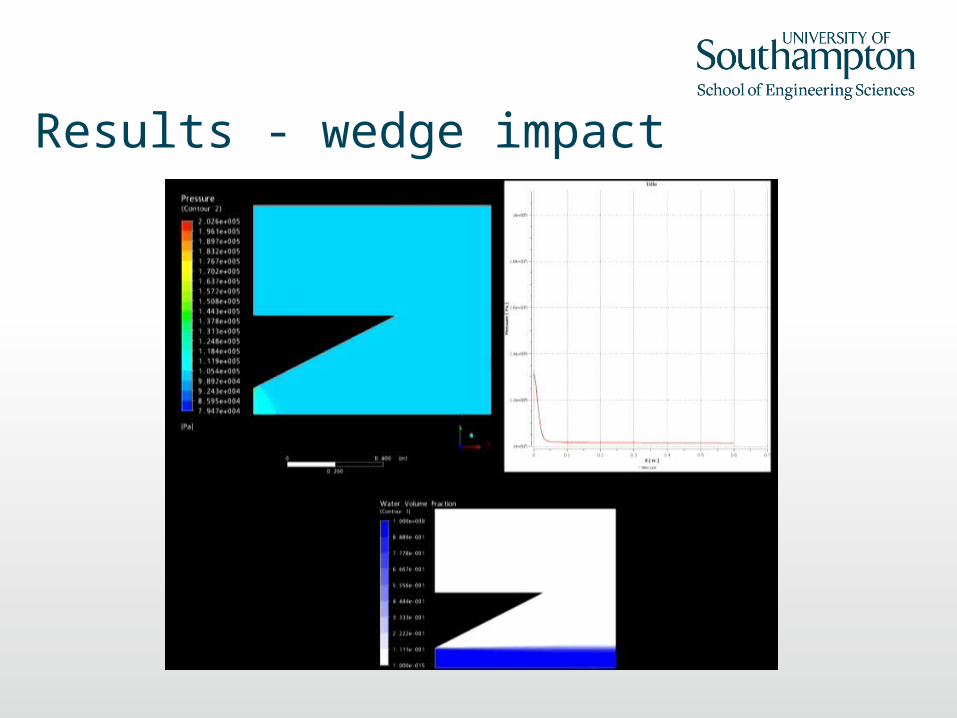
Results - wedge impact
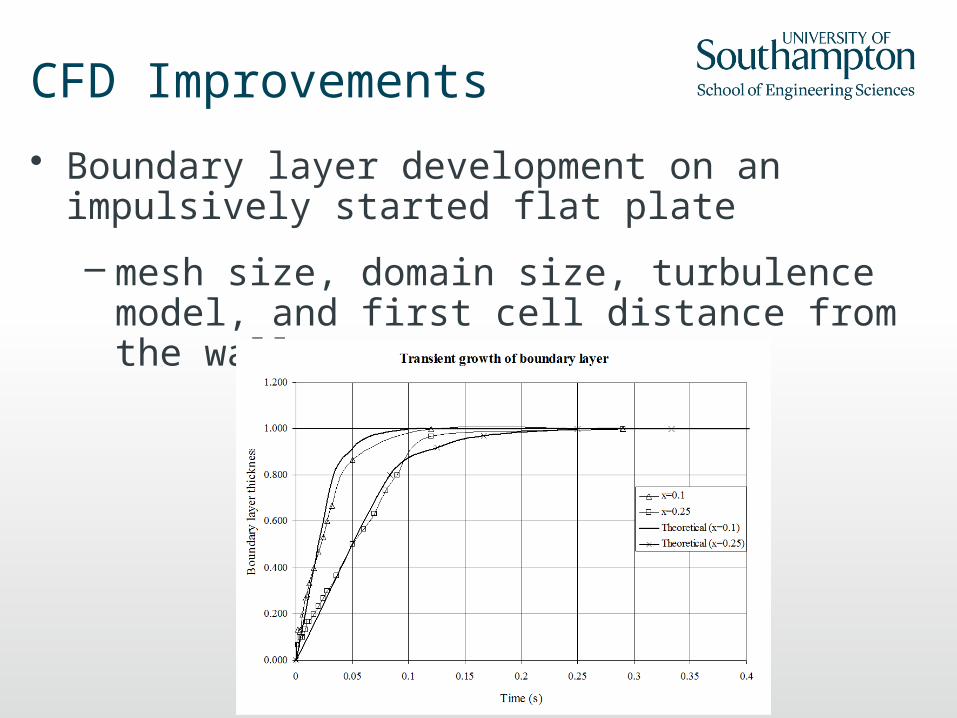
CFD Improvements
• Boundary layer development on an impulsively started flat plate
– mesh size, domain size, turbulence model, and first cell distance from the wall
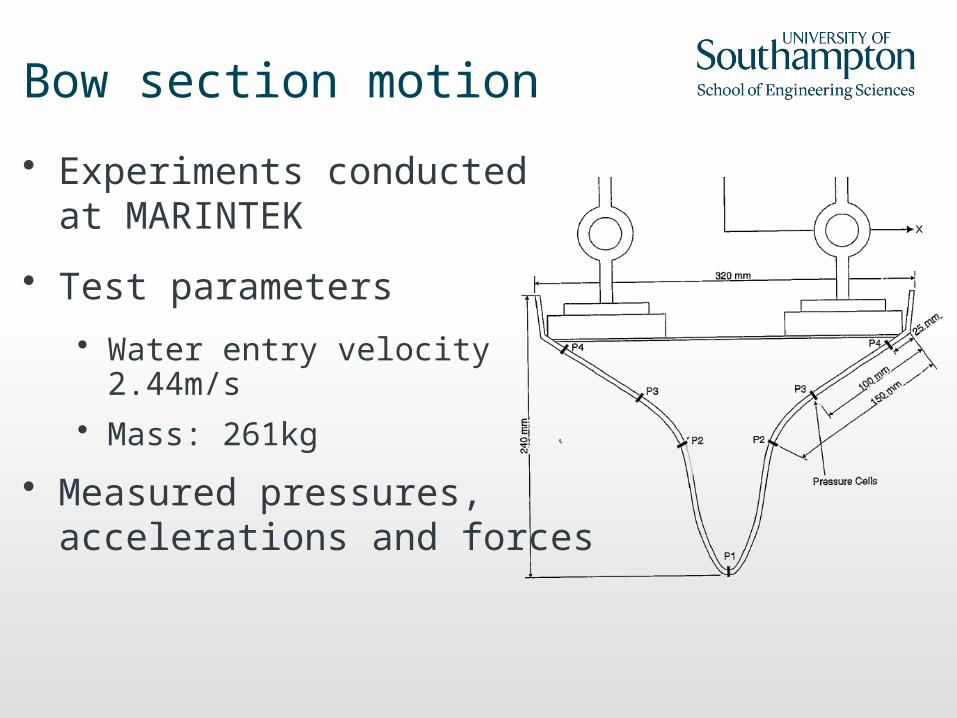
Bow section motion
• Experiments conducted at MARINTEK
• Test parameters
• Water entry velocity 2.44m/s• Mass: 261kg
• Measured pressures, accelerations and forces

CFD simulation
Inflow boundary
Symmetry planeOutflow boundary condition
Smooth wall, no slip condition
0.8m
0.4m

CFD Parameters
• Using Ansys CFX v11.0
• Finest mesh: 30000 cells
• First element situated 2*10-5m from the wall
• Turbulence model used is k-omega
• Y+ value at the wall is 0.6
• Inhomogeneous multiphase model
• Motions are calculated through user defined functions in Matlab for each timestep
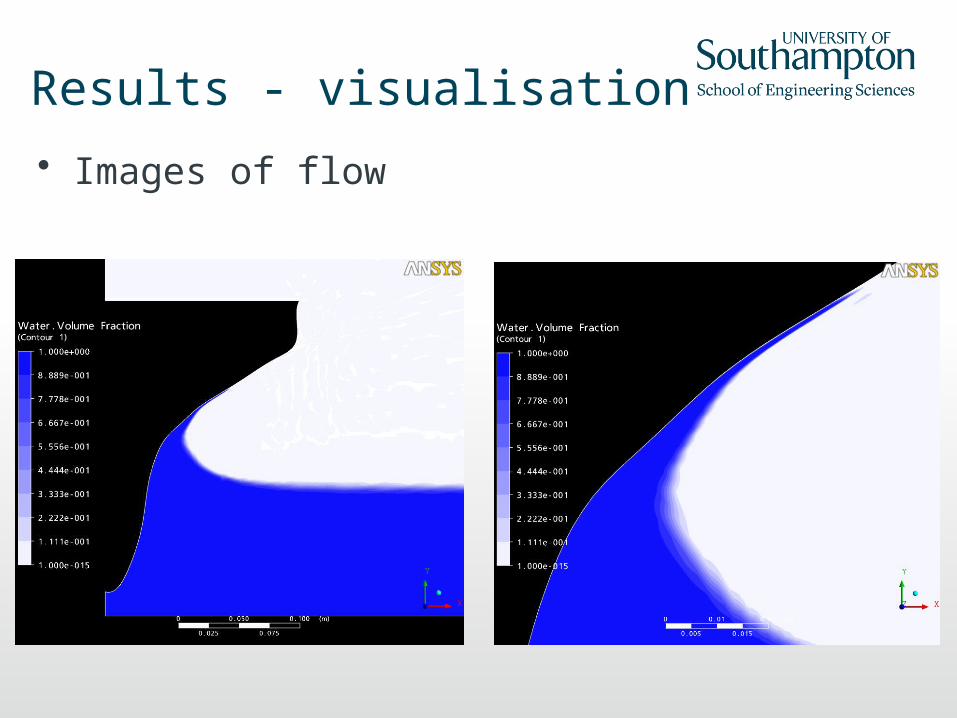
Results - visualisation
• Images of flow
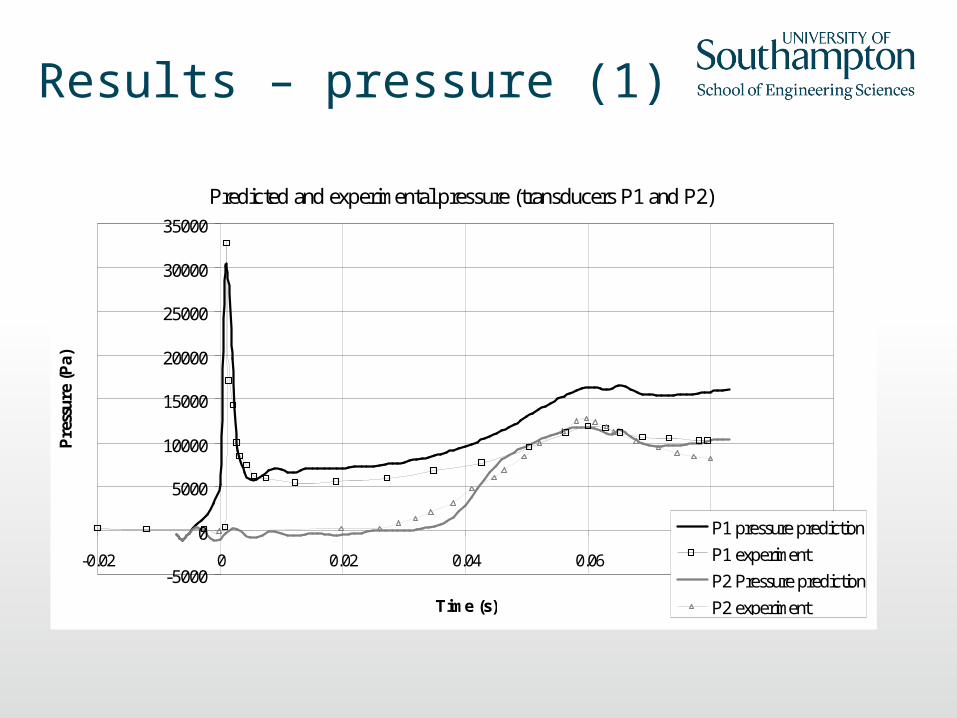
Results – pressure (1)
Predicted and experimental pressure (transducers P1 and P2)
-5000
0
5000
10000
15000
20000
25000
30000
35000
-0.02 0 0.02 0.04 0.06 0.08 0.1
Time (s)
Pre
ssur
e (P
a)
P1 pressure prediction
P1 experiment
P2 Pressure prediction
P2 experiment
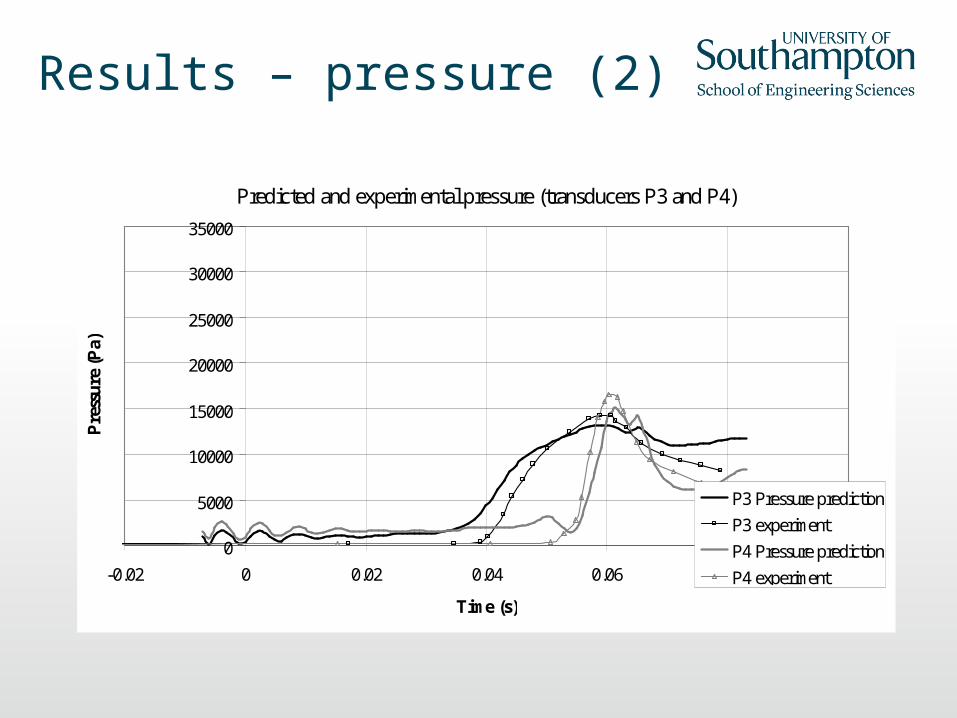
Results – pressure (2)
Predicted and experimental pressure (transducers P3 and P4)
0
5000
10000
15000
20000
25000
30000
35000
-0.02 0 0.02 0.04 0.06 0.08 0.1
Time (s)
Pre
ssu
re (
Pa)
P3 Pressure prediction
P3 experiment
P4 Pressure prediction
P4 experiment
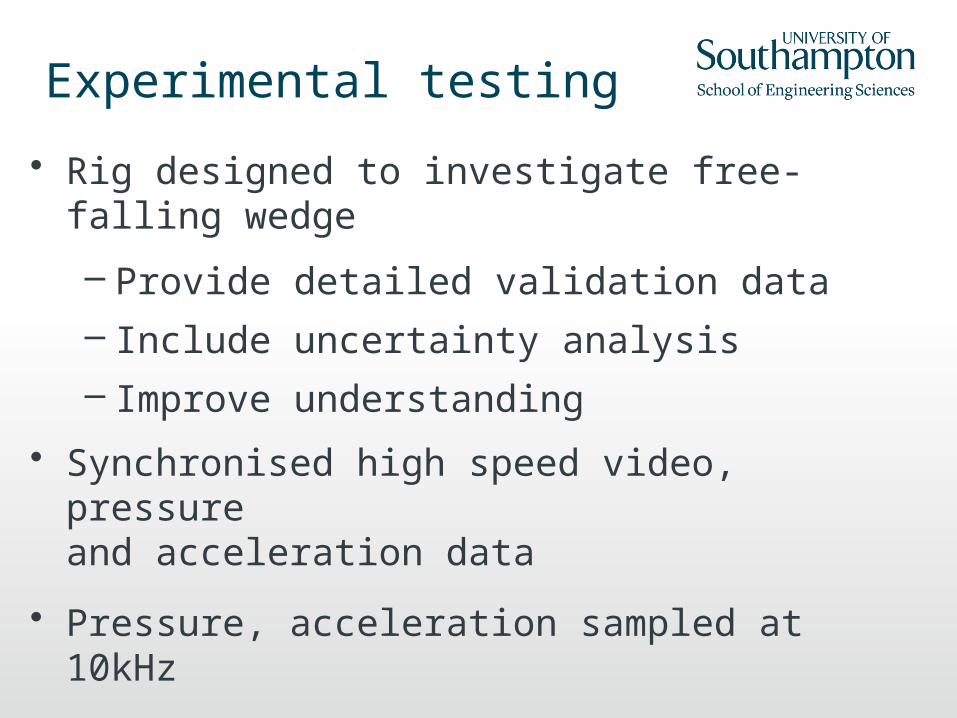
Experimental testing
• Rig designed to investigate free-falling wedge
– Provide detailed validation data – Include uncertainty analysis– Improve understanding
• Synchronised high speed video, pressure and acceleration data
• Pressure, acceleration sampled at 10kHz
• Mass and drop height varied

Comparison of sample rates

Drop test rig
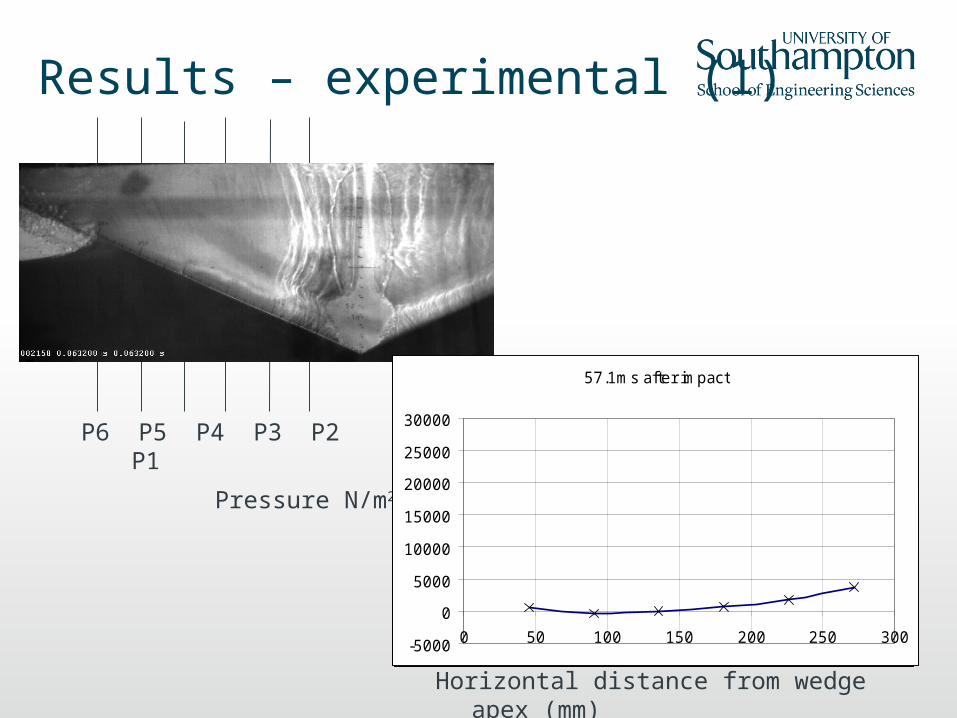
Results – experimental (1)
Pressure N/m2
8.8ms after impact
-5000
0
5000
10000
15000
20000
25000
30000
0 50 100 150 200 250 300
15ms after impact
-5000
0
5000
10000
15000
20000
25000
30000
0 50 100 150 200 250 300
21.6ms after impact
-5000
0
5000
10000
15000
20000
25000
30000
0 50 100 150 200 250 300
30.9ms after impact
-5000
0
5000
10000
15000
20000
25000
30000
0 50 100 150 200 250 300
42.8ms after impact
-5000
0
5000
10000
15000
20000
25000
30000
0 50 100 150 200 250 300
57.1ms after impact
-5000
0
5000
10000
15000
20000
25000
30000
0 50 100 150 200 250 300
Horizontal distance from wedge apex (mm)
P6 P5 P4 P3 P2 P1
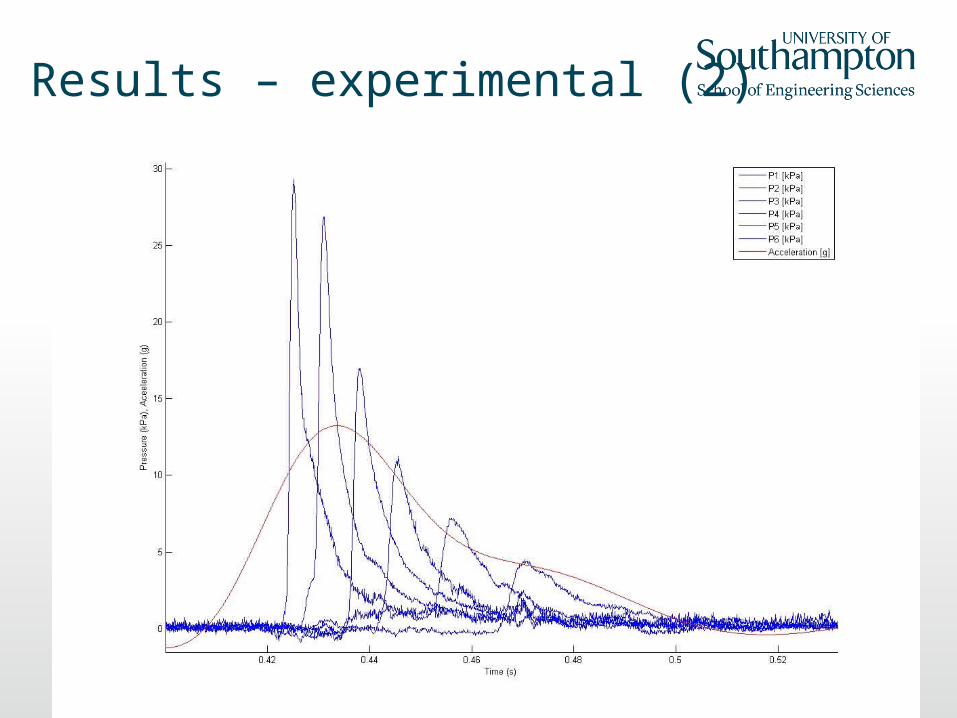
Results – experimental (2)
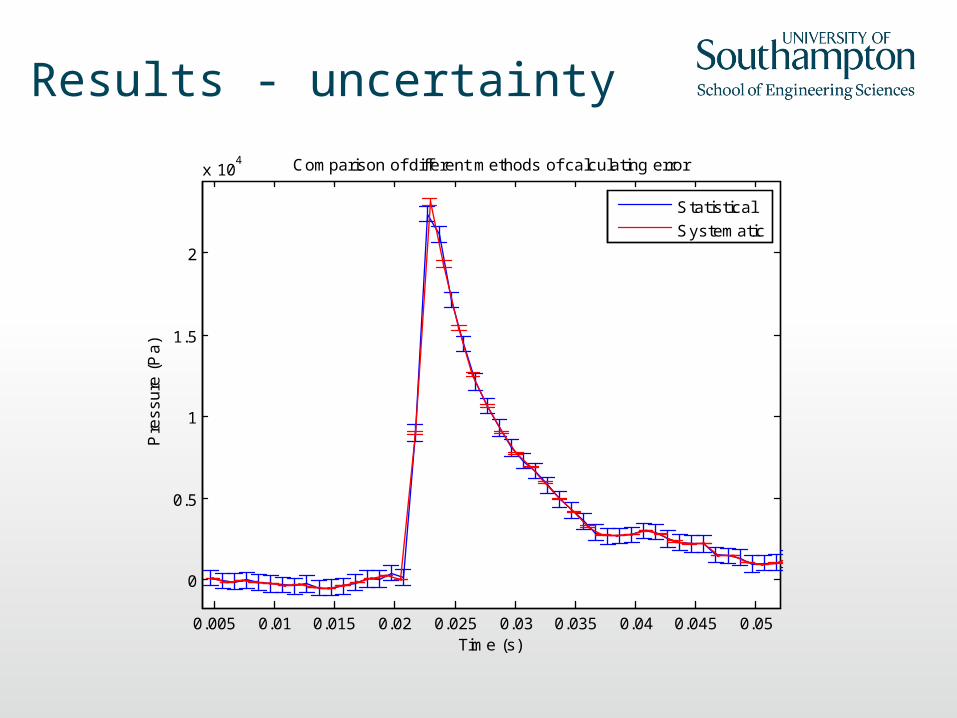
Results - uncertainty
0.005 0.01 0.015 0.02 0.025 0.03 0.035 0.04 0.045 0.05
0
0.5
1
1.5
2
x 104
Time (s)
Pre
ss
ure
(P
a)
Comparison of different methods of calculating error
Statistical
Systematic
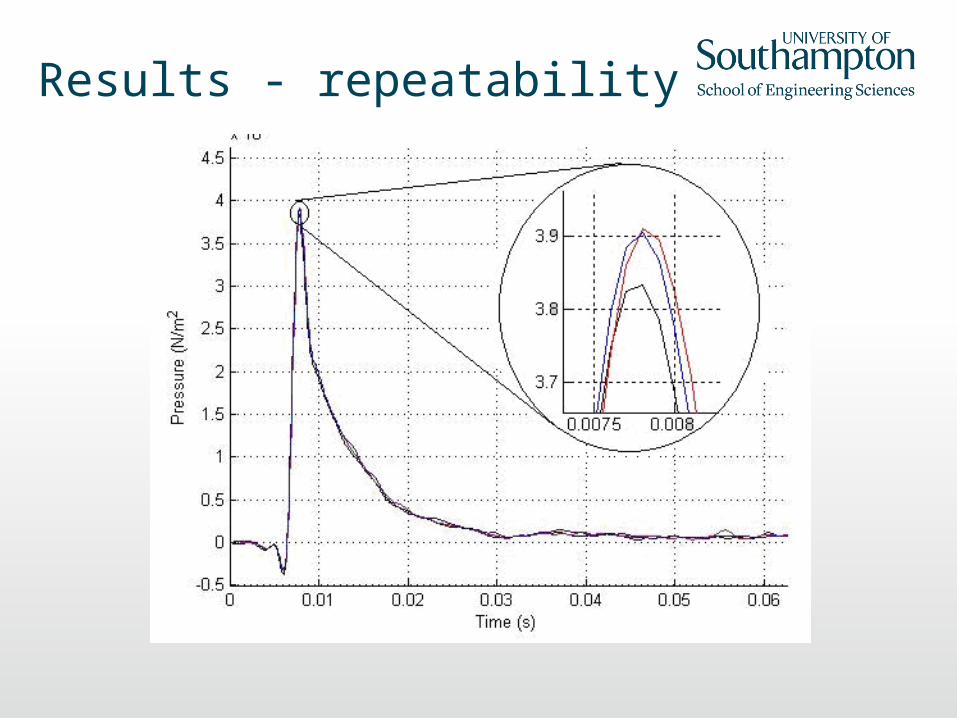
Results - repeatability
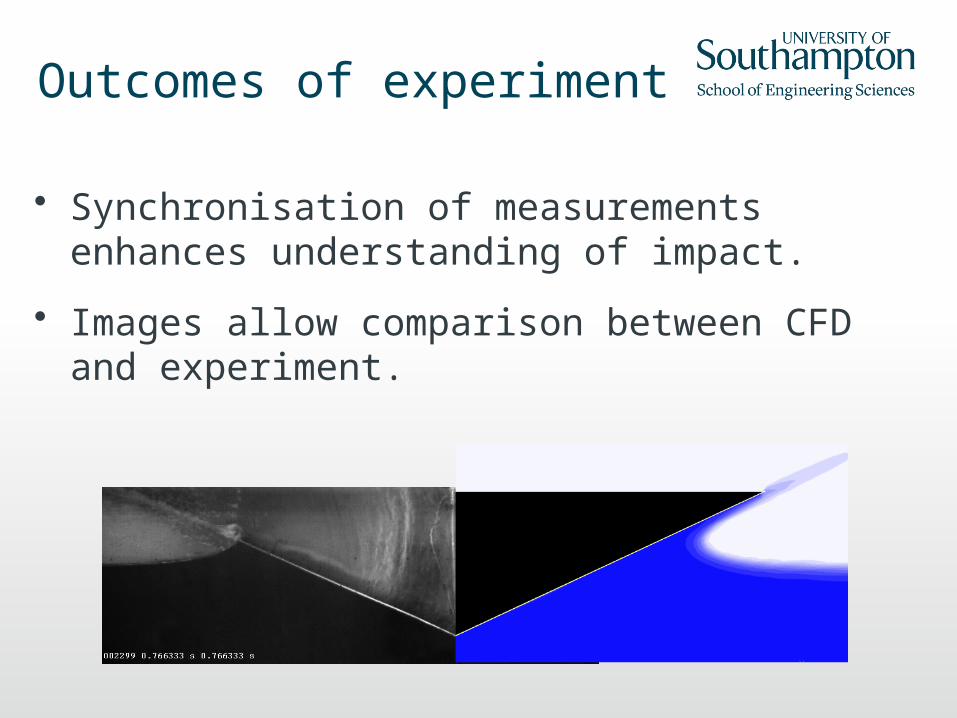
Outcomes of experiment
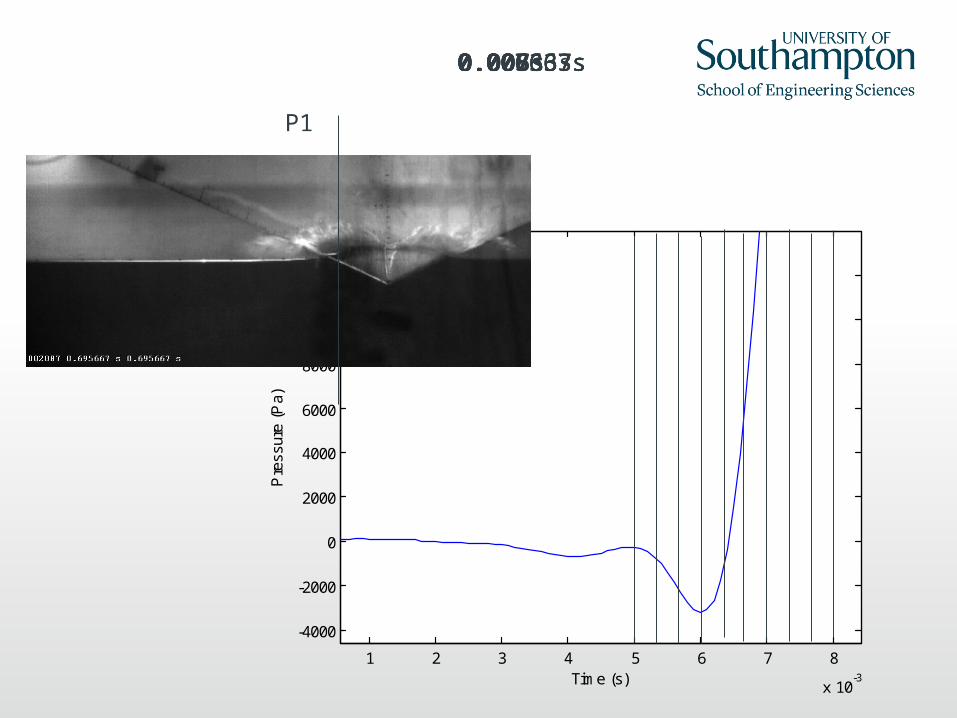
• Synchronisation of measurements enhances understanding of impact.
• Images allow comparison between CFD and experiment.
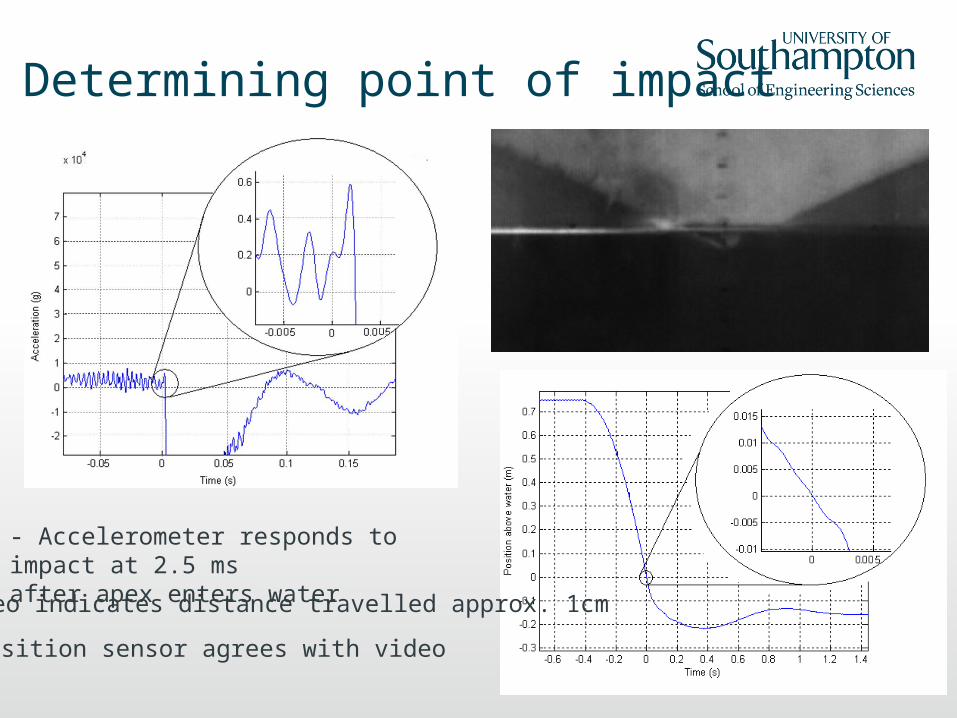
Determining point of impact
- Accelerometer responds to impact at 2.5 msafter apex enters water- Video indicates distance travelled approx. 1cm
- Position sensor agrees with video

Future work - motions
Potential Flow solver
using strip theory
Computational Fluid Dynamics
Hybrid model
3D CFD mesh (Azcueta,2002)
• The hybrid approach is used to improve the accuracy of the numerical predictions.
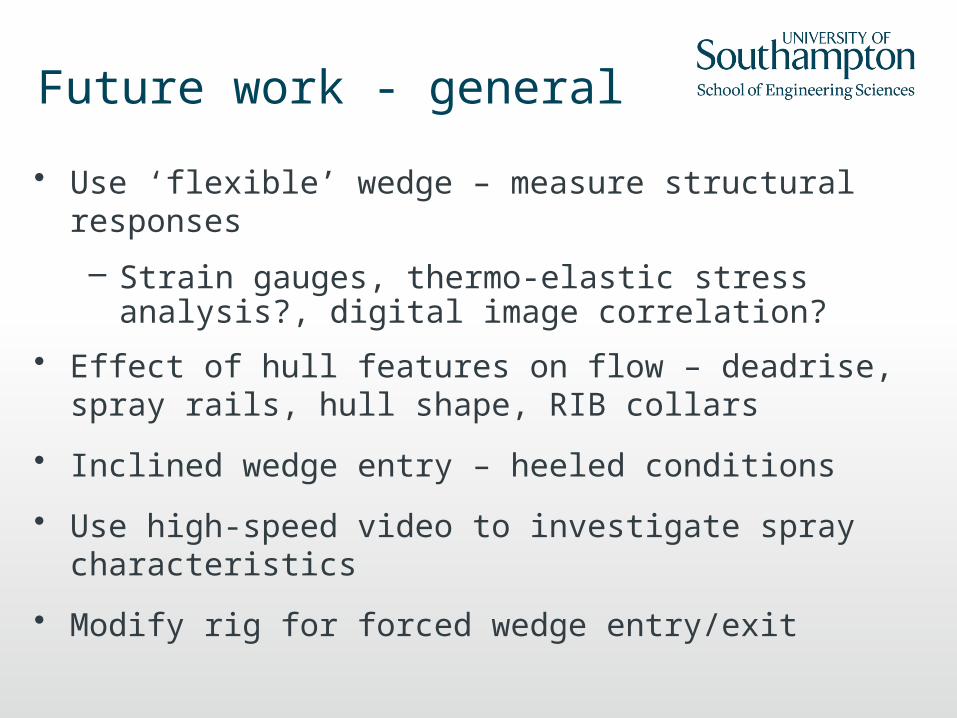
Future work - general
• Use ‘flexible’ wedge – measure structural responses
– Strain gauges, thermo-elastic stress analysis?, digital image correlation?
• Effect of hull features on flow – deadrise, spray rails, hull shape, RIB collars
• Inclined wedge entry – heeled conditions
• Use high-speed video to investigate spray characteristics
• Modify rig for forced wedge entry/exit
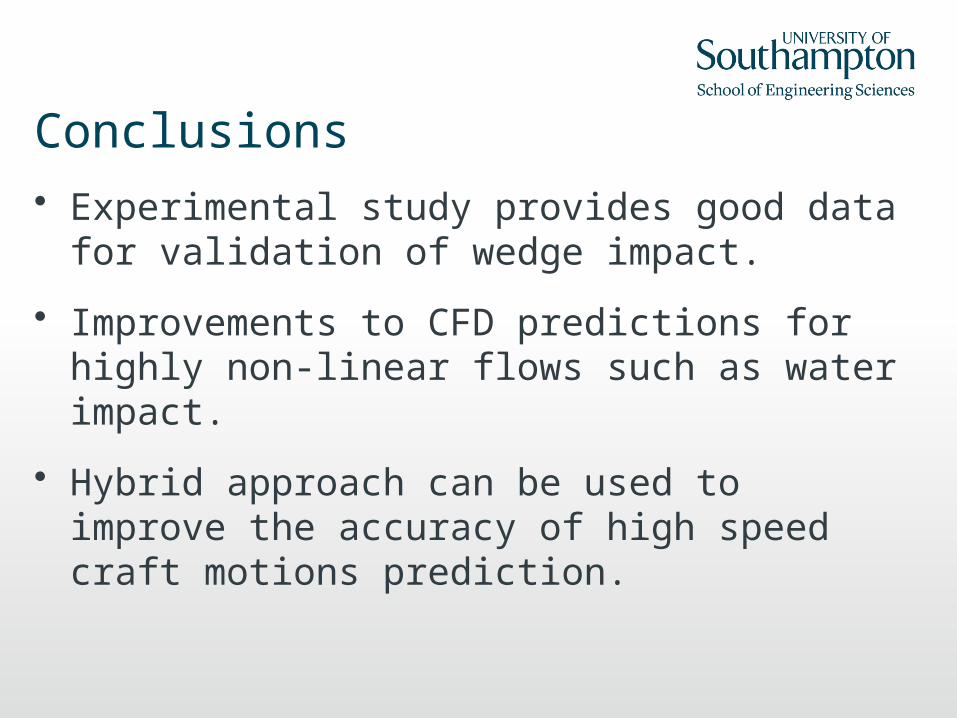
Conclusions• Experimental study provides good data for
validation of wedge impact.
• Improvements to CFD predictions for highly non-linear flows such as water impact.
• Hybrid approach can be used to improve the accuracy of high speed craft motions prediction.
1 2 3 4 5 6 7 8
x 10-3
-4000
-2000
0
2000
4000
6000
8000
10000
12000
Time (s)
Pre
ssur
e (P
a)
0.005s
P1
0.005667s0.00533s0.006s0.006333s0.006667s0.007s0.007333s0.007667s0.008s

Questions
?
Thank you for your attention.
Recommended