Examining the Impact of Drifted Polytomous Anchor Items on Test Characteristic Curve (TCC) Linking and IRT True Score Equating
Yanmei Li
May 2012
Research Report ETS RR–12-09

Examining the Impact of Drifted Polytomous Anchor Items
on Test Characteristic Curve (TCC) Linking and IRT True Score Equating
Yanmei Li
ETS, Princeton, New Jersey
May 2012

Technical Review Editor: Rebecca Zwick
Technical Reviewers: John Donoghue and Neil Dorans
Copyright © 2012 by Educational Testing Service. All rights reserved.
ETS, the ETS logo, and LISTENING. LEARNING.
LEADING, are registered trademarks of Educational Testing
Service (ETS).
As part of its nonprofit mission, ETS conducts and disseminates the results of research to advance
quality and equity in education and assessment for the benefit of ETS’s constituents and the field.
To obtain a PDF or a print copy of a report, please visit:
http://www.ets.org/research/contact.html

i
Abstract
In a common-item (anchor) equating design, the common items should be evaluated for item
parameter drift. Drifted items are often removed. For a test that contains mostly dichotomous
items and only a small number of polytomous items, removing some drifted polytomous anchor
items may result in anchor sets that no longer resemble mini-versions of the new and old test
forms. In this study, the impact of drifted polytomous anchor items on the test characteristic
curve (TCC) linking and item response theory (IRT) true score equating for a test containing
only a small number of polytomous items was investigated. Simulated tests were constructed to
mimic a real large-scale test. The magnitude of the item parameter drift, anchor length, number
of drifted polytomous items in the anchor set, and the ability distributions of the groups taking
the old form and new form were manipulated. Results suggest that anchor length and number of
drifted polytomous items had a relatively large impact on the linking and equating results. The
accuracy of linking and equating results were affected by the magnitude of item parameter drift.
The ability distributions of the groups had little effect on the linking and equating results. In
general, excluding drifted polytomous anchor items resulted in an improvement in equating
results.
Key words: IRT, item response theory, item parameter drift, polytomously scored items,
TCC linking, test characteristic curve, IRT true score equating

ii
Acknowledgments
The author would like to thank Rebecca Zwick, John Donoghue, Neil Dorans, Terran Brown, and
Dan Eignor for the helpful comments they provided on earlier versions of this paper.

1
In a common item equating design, the best practice when performing equating is to equate
the new form to the old form through a set of common items (anchor items) that are both statistical
and content representative of the new and old forms (Kolen & Brennan, 2004). For tests that are
composed of both dichotomous and polytomous items, the anchor often contains both types of
items. In the context of item response theory (IRT), the anchor items on the new and old forms
should have the same item parameter estimates after IRT linking has been conducted. However,
item parameter drift (Goldstein, 1983) may occur for a variety of reasons, such as estimation error,
context effects, item exposure, or differential curriculum emphasis. Kolen and Brennan (2004)
suggested that common items should be screened for differences in functioning across groups
taking the old and new forms, and an item may be dropped from the common-item set if it
functions differently across examinee groups. However, in practice, for a test that contains mostly
dichotomous items and only a small number of polytomous items, removing drifted polytomous
anchor items may result in an anchor set that is no longer a mini-version of the new and old forms.
Therefore, it is important to evaluate whether the drifted polytomous anchor items have an impact
on linking results and IRT equating results and when such drifted items should be removed from
the anchor set.
The evaluation of item parameter drift is part of a holistic approach that also takes content
representation into consideration. Because an anchor set should be a minitest of the total test, the
proportion of anchor items in each content area should be approximately the same as the
proportion of all operational items in each content area. As such, dropping some anchor items may
result in content imbalance. For some testing programs, removing anchor items may also require
approval from content experts. However, when the content representation criteria for the anchor
item sets is met (i.e., dropping certain number of anchor items is acceptable in terms of content
representativeness), good statistical practice is needed to determine whether and when drifted
anchor items should be removed from the anchor set. The remainder of this paper will focus on
this latter issue.
Although previous research studied the effectiveness of various procedures for identifying
item parameter drift (e.g., DeMars, 2004; Donoghue & Isham, 1998), relatively few studies have
focused on the impact of drifted items on test equating. Hu, Rogers, and Vukmirovic (2008)
investigated the comparability of four IRT-based equating methods when drifted items were either
excluded or included in a common item nonequivalent group design. They found that in general,

2
methods excluding drifted items resulted in improved equating results compared to methods that
included them. However, their study did not specifically focus on polytomous items and only
considered the influence of inconsistent b-parameter estimates on the linking results. In the current
study, we investigated the impact of drifted polytomous anchor items on the test characteristic
curve (TCC) linking method (Stocking & Lord, 1983) as well as on IRT true score equating results
when a small number of polytomous items are present in a test. A brief description of the TCC
linking method and IRT true score equating is provided in the next section. The impact of drifted
polytomous items was evaluated under various conditions through a simulation study.
TCC Linking and IRT True Score Equating
In IRT, the estimated parameters for two tests that are measures of the same ability,
administered to two groups of examinees calibrated separately, are often on different ability scales.
A linear transformation is needed to put IRT parameters on the same scale. In the common item
nonequivalent group design, the common items across two test forms can be used to transform the
parameter estimates from a new calibration (Group 2) to the scale of a base calibration (Group 1).
For a standard two-parameter IRT model, the item discrimination parameters and the item
difficulty parameters on the two scales are related as follows:
∗ , (1)
∗ , (2)
where * indicates the transformed value, and are the slope and intercept coefficients for
the linear transformation, , are the item discrimination and item difficulty parameters
estimated for item and Group 2, and ∗ , ∗ are the transformed item parameters (on the base
scale) for item and Group 2. The ability levels of examinee on the two scales are related as
follows:
∗ , (3)
where and ∗ are ability estimate for examinee in Group 2 from the new calibration and its
transformed values (on the base scale), respectively. A number of methods can be used to
determine the linking coefficients and . In this study, the TCC linking method (Stocking &

3
Lord, 1983) will be used. The TCC method minimizes the differences between the estimated true
score on the common items using the parameter estimates from both calibrations. The quadratic
loss function to be minimized is
∑ ∗ , (4)
where 1,2, … , indexes arbitrary points over the latent ability scale, and and ∗ are the
true scores for the base test and the transformed new test, respectively, computed by summing the
item characteristic curves (ICCs) across the common items on the test.
Once the item parameters are on the same scale, the IRT true score equating method (Kolen &
Brennan, 2004; Lord, 1980) can be used to determine relationship between number-correct scores on
the new form and reference form. In this method, the true scores for the two test forms yielded by the
same IRT ability score ( are assumed to be equivalent. An examinee's equated score, then, is the
score on the reference form corresponding to the examinee's score on the current new form.
Method
Data and Test Form
Simulated data were generated to study the impact of drifted polytomous items on TCC
linking results using a common item nonequivalent groups design. Two simulated test forms (one
new form and one reference or old form) were constructed, consisting of six sets of items, with 10
items per set, for a total of 60 items. The first item in each set was polytomously scored, while the
remaining items were dichotomously scored. Therefore, the total number of polytomous items in
the test was six. Three of the polytomous items had three score categories (0, 1, 2), and the other
three had four score categories (0, 1, 2, 3). For the odd number sets (sets 1, 3, 5), the polytomous
item in each set had three score categories, and for the even number sets (sets 2, 4, 6), the
polytomous items each had four score categories. The reference form (old form) contained
operational items and linking items. Note that the linking items in the reference form are not part
of the operational test form and they are included for linking purposes. The new form contained
internal anchor items. These anchor items were the exact same linking items appearing in the
reference form. The sample sizes for all the items on the new form and the operational items on the
reference form were 3,000, while the sample size for the linking items on the operational form was

4
1,500 (a smaller sample size was used here to mimic that used in a large-scale operational test in
order to control item exposure).
A two-parameter logistic model (2PL) and a generalized partial credit model (GPCM;
Muraki, 1992) were used to simulate the dichotomous and polytomous item data, respectively. The
GPCM can be expressed as:
0
0
1.7 ( )
1 1.7 ( )
0
( ) ,
( 0,1,..., 1)
( 1,2,..., )
k
j i jvv
w
j j i jvv
a b
jikm a b
w
j
eP
e
k m
j n
(5)
where ( )jikP is the probability of scoring in category k of the jm score categories of item j ,
ja is a slope parameter, jvb are a set of location parameters that locate points at which the
probability of item response curves for the categories in the item intersect, and i is the examinee
ability parameter. For parameter estimation purposes, 001.7 0v j i jva b .
Simulation Design
Item parameter drift was simulated in this study. There are different ways to define (or
identify) item parameter drift for polytomous items. Drifted items can be identified by differential
item functioning (DIF) statistics, and various DIF detection methods can be found in the literature
(e.g., Camilli & Congdon, 1999; Chang, Mazzeo, & Roussos, 1996; Cohen, Kim, & Baker, 1993;
Flowers, Oshima, & Raju, 1999). Different testing programs have also implemented some
numerically based procedures to identify the drifted items. For example, the weighted root mean
squared difference (WRMSD) between the old and transformed new ICCs is often used as a
criterion for removing drifted items. The WRMSD for a polytomous item j can be expressed as:

5
21 1
1 0 0
( ) ( )j jm mn
Tj Njk i Rjk i i
i k k
WRMSD P k P k w
, (6)
where 1
0
( )jm
TNjk i
k
P k
is the expected score for item j with transformed parameters on the new
form, 1
0
( )jm
Rjk ik
P k
is the expected score for item j on the reference form, k indicates scores on
jm score categories of item j and 0,1,..., 1jk m , n is the number of ability groups, and iw is
the weight for ability interval i and 1
1n
ii
w
. In this study, the WRMSD between the ICCs was
used to define drifted polytomous items, as it is commonly used in many operational testing
programs. For example, if a polytomous item has a WRMSD higher than 0.15, it may be
considered for removal.
The following factors were manipulated in this study:
The magnitude of the item parameter drift. The dichotomous anchor item
parameters were kept the same between the old form and new form, whereas the ja
parameters and jvb parameters of the polytomous anchors on the new form were
simulated to drift away from their original values on the old form such that the
WRMSDs (weighted by a standard normal distribution of ability ranging from -4 to 4
with a 0.10 interval) between the ICCs were 0.10, 0.15, or 0.20. These values were
chosen because they are commonly seen in practice. To obtain such WRMSDs between
the ICCs, the simulated item parameter differences (between the old parameters and
new parameters) for ja and jvb ranged from 0 to 0.255, and from -0.251 to 0.746,
respectively. Note that relatively small amounts of drift for item discrimination
parameters were generated, similar to those that are commonly encountered in practice.
Anchor length (two sets/20 items, or four sets/40 items). The simulated new tests
contained 60 operational items in six sets with 10 items per set (all six sets of items
were operational items). Under the two-anchor-set condition, the first two sets in the
new form served as internal anchor sets. Under the four-anchor-set condition, the first

6
four sets in the new form served as internal anchor sets. The corresponding reference
form contained 60 operational items plus two anchor sets (under the two-anchor-set
condition, for a total of 80 items) or four anchor sets (under the four-anchor-set
condition, for a total of 100 items). The four-anchor-set condition mimics the equating
design used in a real large-scale set-based test in which two thirds of the operational
sets are used as anchor sets. The main purpose of such a long anchor is to increase the
stability of linking.
The number of drifted polytomous items in the anchor set (1, 2, or 4). As noted
previously, each anchor set contained only one polytomous item. Therefore, under the
two-anchor-set condition, the number of drifted polytomous items could be 1 (in only
the first anchor set) or 2 (one drifted item in each of the two anchor sets), while under
the four-drifted-polytomous-items condition, the number of drifted items could be 1 (in
only the first anchor set), 2 (in the first two of the four anchor sets), or 4 (one drifted
item in each of the four anchor sets). When the number of drifted polytomous items
was 1, two conditions were simulated: (a) the drifted item was a three-category item,
and (b) the drifted item was a four-category item.
Ability distributions of the groups taking the old form and new form. The ability
distribution of the group taking the old form was (0,1)N , while the ability distributions
of the group taking the new form were (a) (0,1)N , (b) (0.25,1)N , or (c) (0.5,1)N .
These factors yielded a total of 63 conditions. Table 1 presents a summary of the
simulation conditions described above. Under each condition, 50 data sets were
simulated. In general, 50 replications are deemed sufficient for IRT simulation studies
in the literature (Hanson & Beguin, 2002; Harwell, Stone, Hsu, & Kirisci, 1996). To
make the simulated test data similar to real test data, the item parameters used to
generate the data came from a large-scale operational test.

7
Table 1
A Summary of Simulation Conditions
Factors manipulated
Anchor length
Ability distributions of groups taking old form and new form
Magnitude of item parameter drift
(WRMSD) Number of drifted polytomous items
Number of conditions
Two sets/ 20 items
N(0, 1), N(0, 1) WRMSD = 0.10 1(c3)
3 x 3 x 3 = 27 N(0, 1), N(0.25, 1) WRMSD = 0.15 1(c4)
N(0, 1), N(0.5, 1) WRMSD = 0.20 2
Four sets/ 40 items
N(0, 1), N(0, 1) WRMSD = 0.10 1(c3)
3 x 3 x 4 = 36 N(0, 1), N(0.25, 1) WRMSD = 0.15 1(c4)
N(0, 1), N(0.5, 1) WRMSD = 0.20 2
4
Total: 63
Note. c3 denotes that the drifted item is a three-score-category item, and c4 denotes that the drifted
item is a four-score category item; WRMSD = weighted root mean squared difference.
In this study, for each simulated data set a combination of 2PL/GPCM was fitted, and the
IRT models were calibrated using ETS PARSCALE. After the item parameters were estimated for
the new and reference forms, the new form was linked back to the reference form using the
common items through TCC linking. The TCC linking was conducted twice—once with all anchor
items included and once with the drifted polytomous anchor items removed under each condition.
The estimated linking coefficients A and B were compared with the true linking constants (A = 1,
B = 0, A = 1, B = 0.25 and A = 1, B = 0.5 for the three groups taking the new form), and the root
mean squared errors (RMSEs) for the estimated A and B were computed. For comparison
purposes, a null condition (in which there were no polytomous drifted items in the anchor sets) was
also simulated. The only factor manipulated under the null condition was the ability distributions
of the groups taking the old form and new form. Again, the ability distribution of the group taking
the old form was (0,1)N , while the ability distributions of the group taking the new form were
(0,1)N , (0.25,1)N , or (0.5,1)N . Therefore, the RMSEs under the null condition reflect sampling
errors and can be used as a baseline for evaluating the RMSEs obtained from other conditions. To

8
examine the practical impact on equating, IRT true score equating was conducted for the two test
forms, and the weighted (by a normal distribution) root mean squared error (WRMSE) for the
number-correct true scores was computed. Similarly, a null condition was also included. The TCC
linking and IRT true score equating were implemented using computer software R, and the R code
for TCC linking and IRT true score equating was written by the author. To verify the accuracy of
the R code, the results of five data sets were compared with those produced by PLINK (Weeks,
2010), a publicly available R program for conducting TCC linking and IRT true score equating,
and the results were essentially the same (agreed to within 0.00001).
Results
Linking Coefficients
Table 2 displays the RMSEs between the true and estimated linking coefficients under the
two-anchor-set condition. The first column of the table indicates the number of drifted items in the
anchor and the score category of the item for the one-drifted-item conditions, for example, 1(c3)
denotes that the drifted item is a three-score-category item. The second row of the table lists the
magnitude of item parameter drift (WRMSD = 0.10 or 0.15 or 0.20), and the third row of the table
indicates the means of the ability distributions of the group taking the new form (m = 0 or
m = 0.25 or m = 0.5). In the last column of the table, the mean RMSEs for the different number of
drifted items conditions are also shown. The RMSE for the linking coefficient A for all conditions
ranged from 0.023 to 0.034. In general, the differences in RMSE for the linking coefficient A
between conditions when the drifted items were removed and conditions when the drifted items
were included are small. Comparing the RMSEs obtained under the two study conditions (drifted
items included or drifted items excluded) to the RMSEs obtained under the null condition, the
differences were also small. This is mainly because the simulated parameter drift in item
discrimination (a) was generally small. When only one item drifted, removing the item or
including it in the anchor set did not have much of an impact on A. When two items drifted, the
mean RMSE across conditions (0.030) obtained after removing the items was slightly larger than
the mean RMSE (0.028) obtained when including the drifted items.

9
Table 2
RMSE Between True and Estimated Linking Coefficients Under Two-Anchor-Set Condition
Number of
drifted items
WRMSD
0.10 0.15 0.20
m = 0 m = 0.25 m = 0.5 m = 0 m = 0.25 m = 0.5 m = 0 m = 0.25 m = 0.5 Mean
Linking coefficient A
Drifted item included
1 (c3) 0.030 0.023 0.032 0.027 0.032 0.030 0.029 0.023 0.032 0.029
1 (c4) 0.032 0.028 0.028 0.026 0.031 0.032 0.034 0.025 0.033 0.030
2 0.032 0.025 0.028 0.028 0.025 0.027 0.033 0.027 0.028 0.028
Drifted item removed
1 (c3) 0.031 0.023 0.034 0.024 0.030 0.030 0.031 0.023 0.034 0.029
1 (c4) 0.032 0.025 0.031 0.032 0.032 0.032 0.032 0.025 0.031 0.030
2 0.034 0.027 0.030 0.027 0.029 0.029 0.034 0.027 0.030 0.030
Null condition (no drifted items)
m = 0 0.029
m = 0.25 0.027
m = 0.5 0.023
Linking coefficient B Drifted item included
1 (c3) 0.045 0.036 0.040 0.060 0.054 0.055 0.066 0.059 0.061 0.053
1 (c4) 0.044 0.055 0.050 0.048 0.051 0.049 0.048 0.056 0.048 0.050
2 0.069 0.067 0.072 0.085 0.081 0.090 0.100 0.094 0.095 0.084
Drifted item removed
1 (c3) 0.033 0.027 0.034 0.034 0.029 0.033 0.033 0.027 0.034 0.032
1 (c4) 0.033 0.036 0.040 0.032 0.035 0.034 0.033 0.036 0.040 0.036
2 0.037 0.032 0.036 0.032 0.029 0.032 0.037 0.032 0.036 0.034
Null condition (no drifted items)
m = 0 0.032
m = 0.25 0.029
m = 0.5 0.036
Note. c3 denotes that the drifted item is a three-score-category item, and c4 denotes that the drifted
item is a four-score-category item; m = mean; WRMSD = weighted root mean squared difference.

10
For linking coefficient B, the RMSEs for all conditions ranged from 0.036 to 0.100 when
the drifted items were included, from 0.027 to 0.040 when the drifted items were removed, and
from 0.029 to 0.036 under the null condition. Under all conditions, the RMSEs obtained when the
drifted item(s) were removed were smaller than those obtained when the drifted items were
included. In general, after the drifted item(s) were removed, the RMSEs were similar to those
under the null condition. The overall differences between the RMSEs (drifted items included vs.
removed) were moderate for the one-drifted-item condition (0.021 for the three-category item,
0.014 for the four-category item), and relatively large for the two-drifted-item condition (0.050).
Variations in the ability distributions of the group taking the new form had little effect on the
accuracy of the B linking coefficient. Table 3 presents the RMSE between true and estimated
linking coefficient B when the three ability distributions are considered together (i.e., the RMSEs
were averaged for the three ability distribution conditions) under the two-anchor-set condition. As
can be seen, when the WRMSD between the new and reference forms ICCs increased from 0.10 to
0.15 to 0.20, the RMSE between estimated B and true B also increased when drifted items were
included.
Table 3
RMSE Between True and Estimated Linking Coefficient B for Combined Ability Distributions
Under Two-Anchor-Set Condition
Number of drifted items
WRMSD
0.10 0.15 0.20
Drifted item included
1 (c3) 0.040 0.057 0.062
1 (c4) 0.050 0.050 0.051
2 0.069 0.085 0.096
Mean 0.053 0.064 0.070
Drifted item excluded
1 (c3) 0.031 0.032 0.032
1 (c4) 0.037 0.034 0.037
2 0.035 0.031 0.035
Mean 0.034 0.032 0.034

11
Note. c3 denotes that the drifted item is a three-score-category item, and c4 denotes that the drifted
item is a four-score-category item; m = mean; WRMSD = weighted root mean squared difference.
Table 4
RMSE Between True and Estimated Linking Coefficients Under Four-Anchor-Set Condition
Number
of drifted
items
WRMSD
0.10 0.15 0.20
m = 0 m = 0.25 m = 0.5 m = 0 m = 0.25 m = 0.5 m = 0 m = 0.25 m = 0.5 Mean
Drifted item included Linking coefficient A 1 (c3) 0.022 0.022 0.025 0.024 0.026 0.026 0.029 0.022 0.023 0.024 1 (c4) 0.026 0.021 0.022 0.021 0.026 0.024 0.023 0.021 0.025 0.023 2 0.025 0.022 0.028 0.022 0.023 0.026 0.025 0.024 0.027 0.025 4 0.029 0.031 0.030 0.022 0.029 0.024 0.021 0.022 0.023 0.026Drifted item excluded 1 (c3) 0.023 0.022 0.025 0.025 0.026 0.026 0.029 0.022 0.022 0.024 1 (c4) 0.025 0.022 0.023 0.021 0.026 0.024 0.023 0.021 0.025 0.023 2 0.023 0.021 0.030 0.022 0.021 0.025 0.026 0.025 0.028 0.025
4 0.026 0.030 0.027 0.024 0.029 0.025 0.021 0.021 0.025 0.025Null condition (no drifted items)
m = 0 0.021 m = 0.25 0.018 m = 0.5 0.026
Linking coefficient B Drifted item included 1 (c3) 0.033 0.032 0.030 0.040 0.041 0.038 0.039 0.037 0.043 0.037 1 (c4) 0.026 0.028 0.037 0.036 0.037 0.035 0.032 0.033 0.034 0.033 2 0.043 0.049 0.042 0.048 0.055 0.062 0.054 0.052 0.061 0.052 4 0.050 0.046 0.045 0.083 0.087 0.085 0.104 0.108 0.104 0.079Drifted item excluded 1 (c3) 0.028 0.029 0.027 0.033 0.035 0.030 0.025 0.027 0.030 0.029 1 (c4) 0.027 0.026 0.032 0.030 0.033 0.025 0.025 0.031 0.031 0.029 2 0.028 0.029 0.027 0.027 0.027 0.041 0.027 0.028 0.035 0.030 4 0.026 0.028 0.032 0.032 0.030 0.027 0.026 0.025 0.026 0.028Null condition (no drifted items) m = 0 0.023
m = 0.25 0.033 m = 0.5 0.031
Note. c3 denotes that the drifted item is a three-score-category item, and c4 denotes that the drifted
item is a four-score-category item; m = mean; WRMSD = weighted root mean squared difference.

12
The largest differences between RMSEs (including vs. removing drifted items) were found
for the two-drifted-item condition. The RMSEs were 0.085 for the WRMSD = 0.15 condition and
0.096 for the WRMSD = 0.20 condition when the drifted items were included. However, the
RMSEs went down to 0.031 and 0.035 when the drifted items were removed.
Table 5
RMSE Between True and Estimated Linking Coefficients for Combined Ability Distributions
Under Four-Anchor-Set Condition
Number of drifted items WRMSD
0.10 0.15 0.20
Drifted item included
1 (c3) 0.032 0.039 0.040
1 (c4) 0.031 0.036 0.033
2 0.045 0.055 0.056
4 0.047 0.085 0.105
Mean 0.039 0.054 0.058
Drifted item excluded
1 (c3) 0.028 0.033 0.028
1 (c4) 0.028 0.029 0.029
2 0.028 0.031 0.030
4 0.029 0.030 0.026
Mean 0.028 0.031 0.028
Note. c3 denotes that the drifted item is a three-score-category item, and c4 denotes that the drifted
item is a four-score-category item; WRMSD = weighted root mean squared difference.
Table 4 shows the RMSE between the true and estimated linking coefficients under the
four-anchor-set condition. The RMSE for the linking coefficient A under all conditions ranged
from 0.021 to 0.031. Similar to the two-anchor-set condition, the differences between removing
and not removing the drifted items are generally small. The differences in RMSEs between null
conditions and all other conditions were also small. The linking coefficient A was not much
affected, and removing the drifted item(s) or including them in the anchor set did not make much
of a difference. Again, this may be due to small amount of drift in the simulated item
discrimination parameters.

13
For the linking coefficient B, similar to the two-anchor-set condition, the RMSEs obtained when
the drifted item(s) were removed were smaller than those obtained when the drifted items were
included under all conditions, and close to those obtained under the null condition. Overall,
removing the drifted item(s) resulted in a small improvement in the RMSEs for the one-drift item
condition (0.037 vs. 0.029 for the three-category item, 0.033 vs. 0.029 for the four-category item),
a moderate improvement for the two-drifted-item condition (0.052 vs. 0.030), and a relatively large
improvement for the four-drifted-item condition (0.079 vs. 0.028). Table 5 presents RMSE
between true and estimated linking coefficient B for the combined ability distributions (i.e., the
RMSEs are averaged for the three ability distribution conditions) under the four-anchor-set
condition. In general, similar to the two-anchor-set condition, in which the WRMSD between
ICCs increased, the RMSE between estimated B and true B also increased when drifted items were
included. Large differences between RMSEs (including vs. removing drifted items) were observed
for the four-drifted-item condition. The RMSEs were 0.085 for the WRMSD = 0.15 condition and
0.105 for the WRMSD = 0.20 condition when the drifted items were included. However, the
RMSEs went down to 0.030 and 0.026, respectively, when the drifted items were removed.
True Score Equating
To evaluate the practical impact of including or excluding drifted items on equating, IRT
true score equating was conducted for the simulated test forms, and the weighted root mean
squared error (WRMSE; weighted by a normal distribution) for the number-correct true scores was
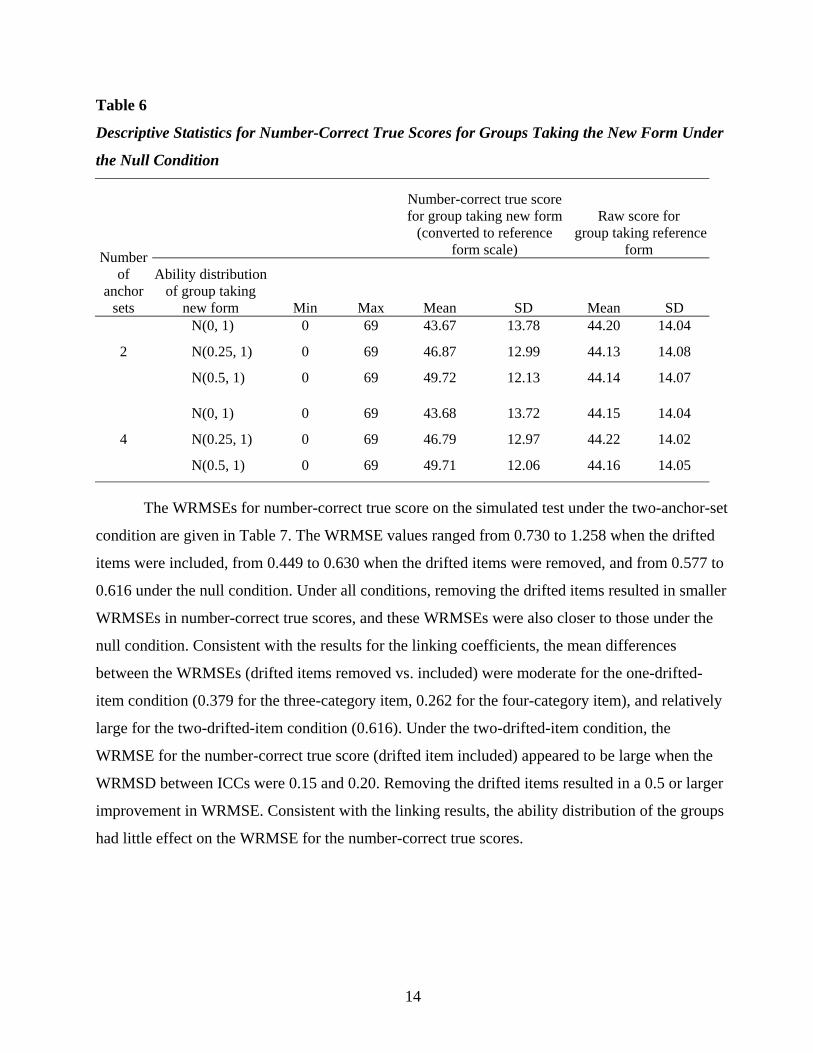
computed. Table 6 provides descriptive statistics for the number-correct true scores (converted to
the reference form scale) for the group taking the new forms under the null condition. These
statistics (mean and SD) were the averages across 50 replications under each condition (i.e.,
(0,1)N , (0.25,1)N , or (0.5,1)N for the group taking the new form). The minimum and maximum
number-correct scores were 0 and 69, respectively. The mean scores of the group taking the new
form were either similar to or higher than the mean scores of the group taking the reference form,
depending on their ability distributions.
14
Table 6
Descriptive Statistics for Number-Correct True Scores for Groups Taking the New Form Under
the Null Condition
Number of
anchor sets
Number-correct true score for group taking new form
(converted to reference form scale)
Raw score for group taking reference
form
Ability distribution of group taking
new form Min Max Mean SD Mean SD
2
N(0, 1) 0 69 43.67 13.78 44.20 14.04
N(0.25, 1) 0 69 46.87 12.99 44.13 14.08
N(0.5, 1) 0 69 49.72 12.13 44.14 14.07
4
N(0, 1) 0 69 43.68 13.72 44.15 14.04
N(0.25, 1) 0 69 46.79 12.97 44.22 14.02
N(0.5, 1) 0 69 49.71 12.06 44.16 14.05
The WRMSEs for number-correct true score on the simulated test under the two-anchor-set
condition are given in Table 7. The WRMSE values ranged from 0.730 to 1.258 when the drifted
items were included, from 0.449 to 0.630 when the drifted items were removed, and from 0.577 to
0.616 under the null condition. Under all conditions, removing the drifted items resulted in smaller
WRMSEs in number-correct true scores, and these WRMSEs were also closer to those under the
null condition. Consistent with the results for the linking coefficients, the mean differences
between the WRMSEs (drifted items removed vs. included) were moderate for the one-drifted-
item condition (0.379 for the three-category item, 0.262 for the four-category item), and relatively
large for the two-drifted-item condition (0.616). Under the two-drifted-item condition, the
WRMSE for the number-correct true score (drifted item included) appeared to be large when the
WRMSD between ICCs were 0.15 and 0.20. Removing the drifted items resulted in a 0.5 or larger
improvement in WRMSE. Consistent with the linking results, the ability distribution of the groups
had little effect on the WRMSE for the number-correct true scores.

15
Table 7
WRMSE for Number-Correct True Score on Simulated Test Under Two-Anchor-Set Condition
Number of drifted
items
WRMSD
0.10 0.15 0.20
m = 0 m = 0.25 m = 0.5 m = 0 m = 0.25 m = 0.5 m = 0 m = 0.25 m = 0.5 Mean
Drifted item included
1 (c3) 0.730 0.775 0.798 0.914 0.880 0.921 0.937 0.996 1.023 0.886
1 (c4) 0.774 0.803 0.735 0.866 0.786 0.865 0.817 0.846 0.784 0.808
2 0.944 1.006 0.963 1.179 1.144 1.216 1.258 1.309 1.249 1.141
Drifted item removed
1 (c3) 0.508 0.534 0.566 0.514 0.479 0.497 0.470 0.479 0.512 0.507
1 (c4) 0.520 0.534 0.498 0.595 0.497 0.567 0.572 0.580 0.551 0.546
2 0.509 0.485 0.515 0.483 0.449 0.489 0.592 0.573 0.630 0.525
Null condition (no drifted items)
m = 0 0.577
m = 0.25 0.594
m = 0.5 0.616
Note. c3 denotes that the drifted item is a three-score-category item, and c4 denotes that the drifted
item is a four-score-category item; m = mean; WRMSD = weighted root mean squared difference.
Table 8 shows the WRMSEs for the number-correct true scores for the combined ability
distributions. When the WRMSD between ICCs increased, the WRMSE for number-correct true
score also showed small increases when drifted items were included, with one exception for the
one-drifted-item (four-score-category) condition. Large differences between WRMSEs (including
vs. removing drifted items) were found for the two-drifted-item condition. The WRMSEs were 1.180
for the WRMSD = 0.15 condition and 1.272 for the WRMSD = 0.20 condition when the drifted
items were included. However, the WRMSEs deceased to 0.474 and 0.598, respectively, when the
drifted items were removed, suggesting that under these conditions, it is necessary to remove the
drifted items.
Table 9 displays the true score equating results obtained under the four-anchor-set
condition. When compared with the two-anchor-set condition, the WRMSE values became
smaller, ranging from 0.579 to 0.918 when the drifted items were included. Similar to the

16
two-anchor-set condition, removing the drifted items always resulted in smaller WRMSE in
number-correct true scores, and these WRMSEs were close to those obtained under the null
condition. The mean differences between the WRMSEs (drifted items removed vs. included) for
all conditions were relatively small (all less than 0.2). These results are expected, because as the
overall anchor length increased from two anchors to four anchors, the proportion of the
polytomous items in the whole anchor (dichotomous and polytomous items) decreased. Therefore,
drifted polytomous items under this condition should have a smaller effect on the linking and
equating results.
Table 8
WRMSE for Number-Correct True Scores on Simulated Test Under Two-Anchor-Set Condition -
Combined Ability Distributions
WRMSD
Number of drifted items 0.10 0.15 0.20
Drifted item included
1 (c3) 0.768 0.905 0.985
1 (c4) 0.771 0.839 0.816
2 0.971 1.180 1.272
Mean 0.836 0.975 1.024
Drifted item removed
1 (c3) 0.536 0.497 0.487
1 (c4) 0.517 0.553 0.568
2 0.503 0.474 0.598
Mean 0.519 0.508 0.551
Note. c3 denotes that the drifted item is a three-score-category item, and c4 denotes that the drifted
item is a four-score-category item; WRMSD = weighted root mean squared difference.

17
Table 9
WRMSE for Number-Correct True Score on Simulated Test Under Four-Anchor-Set Condition
Number of drifted items
WRMSD
0.10 0.15 0.20
m = 0 m = 0.25 m = 0.5 m = 0 m = 0.25 m = 0.5 m = 0 m = 0.25 m = 0.5 Mean
Drifted item included
1 (c3) 0.611 0.579 0.599 0.669 0.629 0.636 0.630 0.648 0.665 0.630
1 (c4) 0.595 0.629 0.607 0.594 0.595 0.606 0.640 0.579 0.608 0.606
2 0.650 0.701 0.659 0.655 0.683 0.734 0.672 0.667 0.703 0.680
4 0.659 0.652 0.691 0.783 0.786 0.813 0.894 0.897 0.918 0.788
Drifted item excluded
1 (c3) 0.507 0.483 0.498 0.478 0.466 0.462 0.492 0.433 0.465 0.476
1 (c4) 0.469 0.515 0.474 0.487 0.480 0.483 0.527 0.531 0.519 0.498
2 0.470 0.468 0.440 0.444 0.446 0.469 0.575 0.555 0.553 0.491
4 0.596 0.562 0.598 0.636 0.677 0.656 0.876 0.867 0.841 0.701
Null condition (no drifted items)
m = 0 0.574
m = 0.25 0.575
m = 0.5 0.589
Note. c3 denotes that the drifted item is a three-score-category item, and c4 denotes that the drifted
item is a four-score-category item; m = mean; WRMSD = weighted root mean squared difference.
Table 10 (see following page) shows the WRMSEs for the number-correct true score for
the combined ability distributions.

18
Table 10
WRMSE for Number-Correct True Score on Simulated Test Under Four-Anchor-Set Condition -
Combined Ability Distributions
Number of drifted items
WRMSD
0.10 0.15 0.20
Drifted item included
1 (c3) 0.596 0.645 0.648
1 (c4) 0.610 0.598 0.609
2 0.670 0.691 0.681
4 0.667 0.794 0.903
Mean 0.636 0.682 0.710
Drifted item excluded
1 (c3) 0.496 0.469 0.463
1 (c4) 0.486 0.483 0.526
2 0.459 0.453 0.561
4 0.585 0.656 0.861
Mean 0.507 0.515 0.603
Note. c3 denotes that the drifted item is a three-score-category item, and c4 denotes that the drifted
item is a four-score-category item; WRMSD = weighted root mean squared difference.
When the WRMSD between ICCs increased, the WRMSE for number-correct true scores
showed a similar increasing pattern as that under the two-anchor-set conditions. Again, differences
in equating results between the three conditions (WRMSD = 0.10, 0.15, 0.20) were small.
Summary and Discussion
This study examined the impact of drifted polytomous anchor items on linking and
equating for a test containing only a small number of polytomous items using simulated data sets.
The magnitude of the item parameter drift, anchor length, number of drifted polytomous items in
the anchor set, and the ability distributions of the groups taking the old form and new form were
manipulated. Of the four factors, the ability distributions of the groups had little effect on the
linking and equating results. However, the RMSE for the linking coefficients or the WRMSE for
the number-correct true scores increased as the magnitude of item parameter drift increased. Most

19
importantly, the anchor length and number of drifted polytomous items had a relatively large
impact on the linking and equating results. Under the two-anchor-set condition, when only one
polytomous item drifted, the effect on the linking and equating results appeared to be relatively
small. When two polytomous items drifted, the results indicate that the RMSE for the linking
coefficients and WRMSE for number-correct true scores were large. In particular, the difference in
WRMSE between removing and including the drifted items is 0.5 score point or larger (when the
magnitudes of item drift are WRMSD = 0.15 or 0.20), which would affect score conversions in
practice. Therefore, these results suggest that drifted items should be removed under these
conditions. Under the four-anchor-set condition, because the total number of anchor items is large,
the impact of drifted polytomous items became smaller. In general, the results of the current study
are consistent with previous research findings (e.g., Hu et al., 2008). That is, excluding the drifted
items resulted in an improvement in equating results. In practice, it is important to have a suitable
criterion for determining when the drifted items should be removed from the anchor sets. As noted
above, for the two-anchor-set condition, the impact of drifted polytomous items on equating could
be large when the WRMSD was 0.15 or 0.20, and for the four anchor set, the impact became
smaller but removing drifted items also resulted in an improvement in equating results. Based on
these findings, the author recommends that practitioners should remove drifted polytomous items
if the WRMSD is equal or greater than 0.15 for tests that have similar structures to the ones used in
this study. As also demonstrated in this study, longer anchor length resulted in smaller linking and
equating errors even when drifted items were included in the anchor sets. Thus, another
recommendation for the practitioners is to use long anchors when possible. Additionally, the
author recommends that practitioners review ICC plots (based on transformed item parameter
estimates) vs. ICC plots (based on item parameter estimates on the reference form) for polytomous
anchor items in conjunction with the WRMSD statistics to check where the differences in item
response function lie on the ability scale and which score category has large WRMSDs. In general,
ICC differences at the extremes of the ability scale is less important than those at the middle of the
ability scale, because there are only a small number of examinees at the very high or low end of
the ability scale. This information can also help the practitioners decide whether a drifted
polytomous item should be removed from the anchor sets.
As with any simulation study, only a limited number of conditions could be studied. The
findings of this study will be most applicable to tests that contain only a small number of

20
polytomous items. Future research is needed to investigate linking and equating results under
different conditions than the ones considered in this study. For example, if the tests contain a
relatively large number of polytomous items and a few polytomous items have drifted, the drifted
items may not have a large impact on the equating results. In addition, the test length, anchor
length, sample size, and the nature of parameter drift considered in this study may limit the
generalization of the results. Other conditions may be further explored in future research.
As noted previously, the simulated tests mimics a real large-scale operation test that contain mostly
dichotomous items and a small number of polytomous items and both types of items measure the
same ability. Therefore, one assumption made in the current study is that the dichotomous and
polytomous items measure a common dimension. However, this assumption will limit its
application to settings where polytomous items are added to the test to measure a secondary
dimension. For such conditions, a multidimensional IRT model can be used to simulate
polytomous item parameter drift, and this approach may be explored in future studies. Finally, this
study used a 2PL model and item parameters estimated from real data to simulate the item
response data, and it assumed that the 2PL model produced realistic data. Thus, the conclusions of
this study may be most applicable to real settings where the 2PL model fits the data well. Although
simulated data allow one to evaluate the impact of item parameter drift on equating results under
certain conditions, simulating the data according to an IRT model does not assure that the data are
realistic. Future studies should be done to investigate the impact of drifted polytomous anchor
items on TCC linking and IRT true score equating using real data.

21
References
Camilli, G., & Congdon, P. (1999). Application of a method of estimating DIF for polytomous test
items. Journal of Educational and Behavioral Statistics, 24, 323–341.
Chang, H., Mazzeo, J., & Roussos, L. (1996). Detecting DIF for polytomously scored items: An
adaptation of the SIBTEST procedure. Journal of Educational Measurement, 33, 333–353.
Cohen, A. S., Kim, S.-H., & Baker, F. B. (1993). Detection of differential item functioning in the
graded response model. Applied Psychological Measurement, 17, 335–350.
DeMars, C. E. (2004). Detection of item parameter drift over multiple test administrations. Applied
Measurement in Education, 17, 265–300.
Donoghue, J. R., & Isham, S. P. (1998). A comparison of procedures to detect item parameter drift.
Applied Psychological Measurement, 22, 33–51.
Flowers, C. P., Oshima, T. C., & Raju, N. S. (1999). A description and demonstration of
the polytomous-DFIT framework. Applied Psychological Measurement, 23, 309–326.
Goldstein, H. (1983). Measuring changes in educational attainment over time: Problems and
possibilities. Journal of Educational Measurement, 20, 369–377.
Hanson, B. A., & Beguin, A. A. (2002). Obtaining a common scale for item response theory item
parameters using separate versus concurrent estimation in the common-item equating
design. Applied Psychological Measurement, 26(1), 3–24.
Harwell, M., Stone, C. A., Hsu, T.-C., & Kirisci, L. (1996). Monte Carlo studies in item response
theory. Applied Psychological Measurement, 20, 101–125.
Hu, H., Rogers, W. T., & Vukmirovic, Z. (2008). Investigation of IRT-based equating methods in
the presence of outlier common items. Applied Psychological Measurement, 32, 311–333.
Kolen, M. J., & Brennan, R. L. (2004). Test equating, scaling, and linking: Methods and practice
(2nd ed.). New York, NY: Springer-Verlag.
Lord, F. M. (1980). Applications of item response theory to practical testing problems. Mahwah,
NJ: Lawrence Erlbaum Associates.
Muraki, E. (1992). A generalized partial credit model: Application of an EM algorithm. Applied
Psychological Measurement, 16, 159–176.
Stocking, M. L., & Lord, F. M. (1983). Developing a common metric in item response theory.
Applied Psychological Measurement, 7, 201–210.

22
Weeks, J. P. (2010). PLINK: An R package for linking mixed-format tests using IRT-
based methods. Journal of Statistical Software, 35(12), 1–33. Retrieved from
http://www.jstatsoft.org/v35/i12/
Recommended