EVOLVING STRUCTURE OF AGRICULTURE AND
COLLECTIVE ACTION
Steve Sonka
Assistant Dean for Research Strategy
Emeritus Chair for Soybean Industry Strategy
University of Illinois at Urbana-Champaign
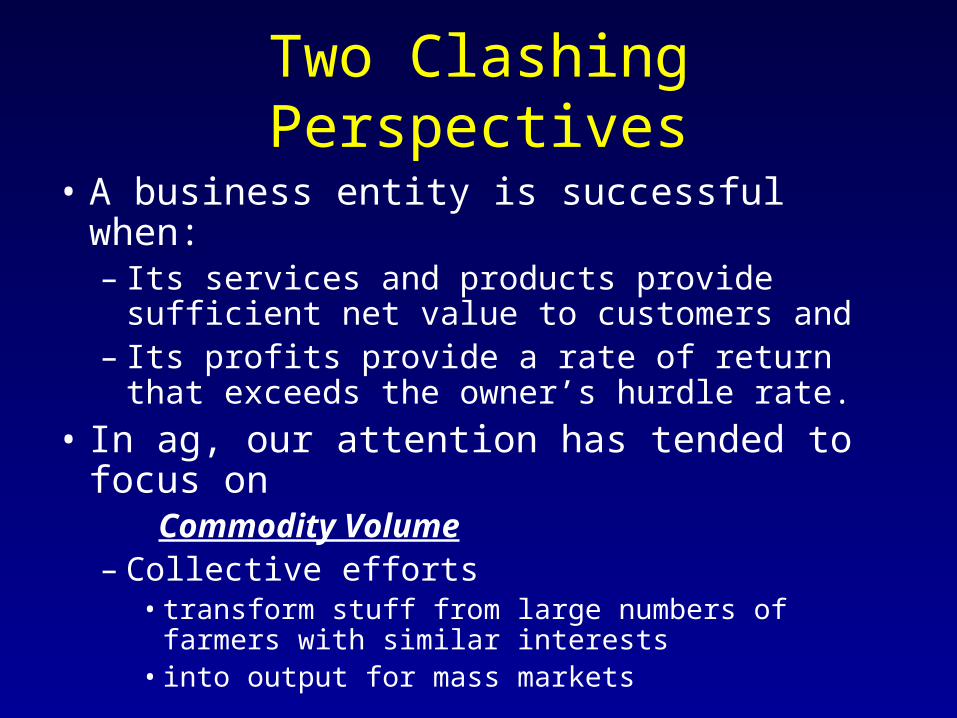
• A business entity is successful when:– Its services and products provide sufficient
net value to customers and – Its profits provide a rate of return that exceeds
the owner’s hurdle rate.
• In ag, our attention has tended to focus on Commodity Volume– Collective efforts
• transform stuff from large numbers of farmers with similar interests
• into output for mass markets
Two Clashing Perspectives

Agenda
Emphasize opportunity in segmentation
• Ag structure – Heterogeneity– Perspective
• An example of segmentation’s benefits– Ownership– Customer
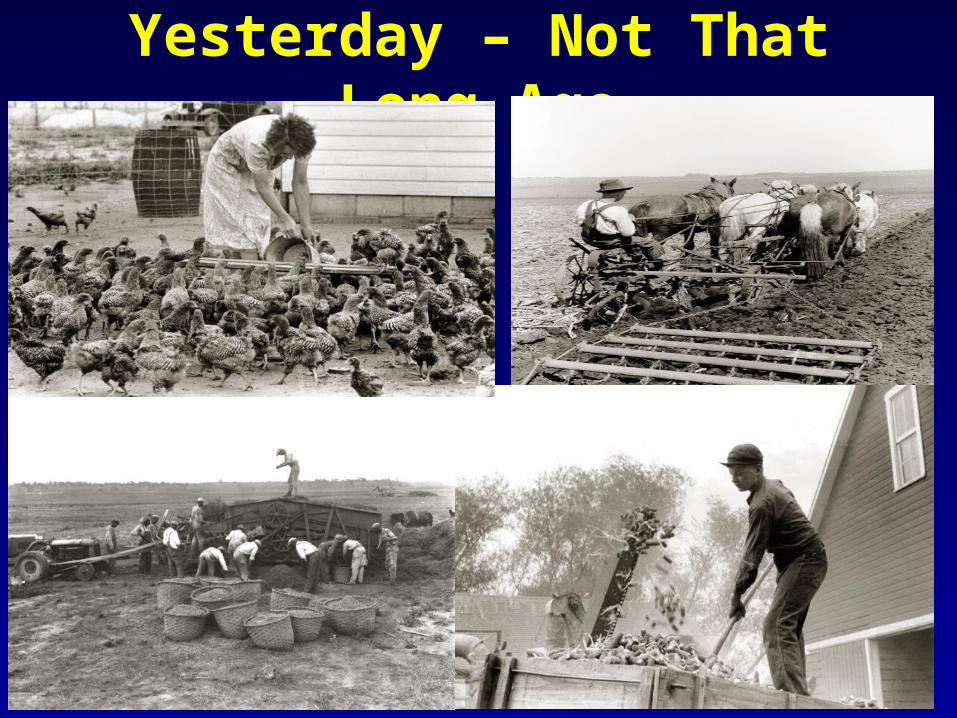
Yesterday – Not That Long Ago
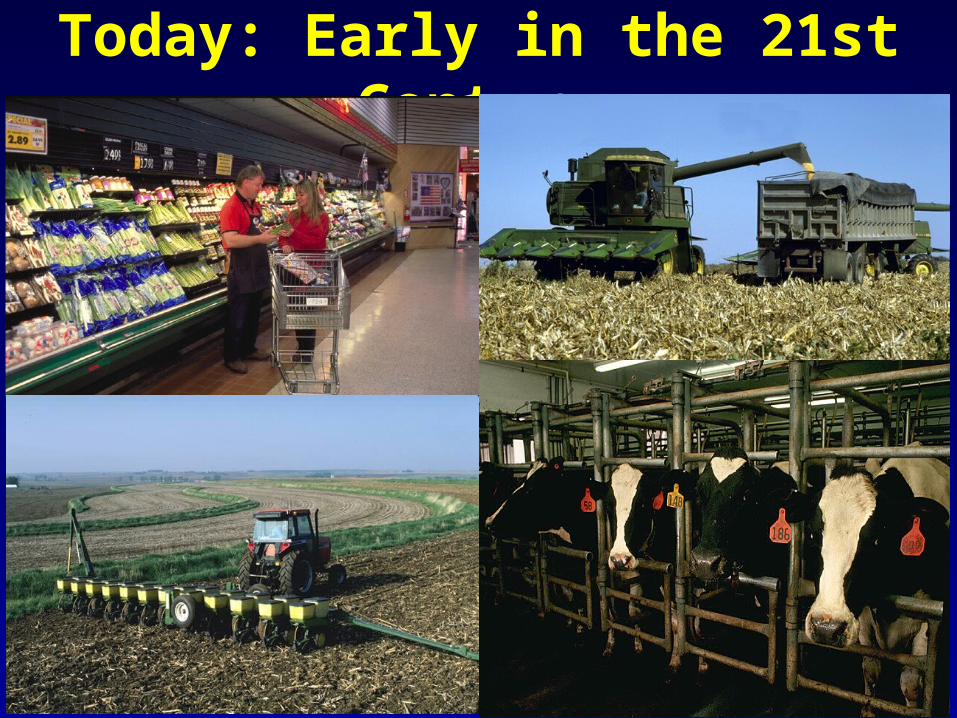
Today: Early in the 21st Century

Yesterday – Not That Long Ago
• Similar interests to neighbors• Competitor sell inputs or buys output• Non-farmers much better off• Small economic units• Unconnected to non-farm economy• Success comes from working hard
Some Dimensions of Being a Farmer
Farmers:Aren’t They All the Same?

0
200000
400000
600000
800000
1000000
1200000
1400000
U.S. Farms by ARMS Typology; 1998
Limited Resource,Retirement, &
Residential
FarmingOccupation
Large &Very Large
Family Farms
Non-Family Farms
61.8%
28.8%
7.5%
2.0%

0
50,000,000
100,000,000
150,000,000
200,000,000
250,000,000
300,000,000
350,000,000
400,000,000
Acreage Operated; 1998
Limited Resource,Retirement, &
Residential
FarmingOccupation
Large &Very Large
Family Farms
Non-Family Farms
20.6%
41.8%
30.1%
7.5%

Rented
Owned
Acreage Owned Versus Rented
Limited Resource,Retirement, &
Residential
FarmingOccupation
Large &Very Large
Family Farms
Non-Family Farms
76.2%
57.0%
40.7%
80.0%
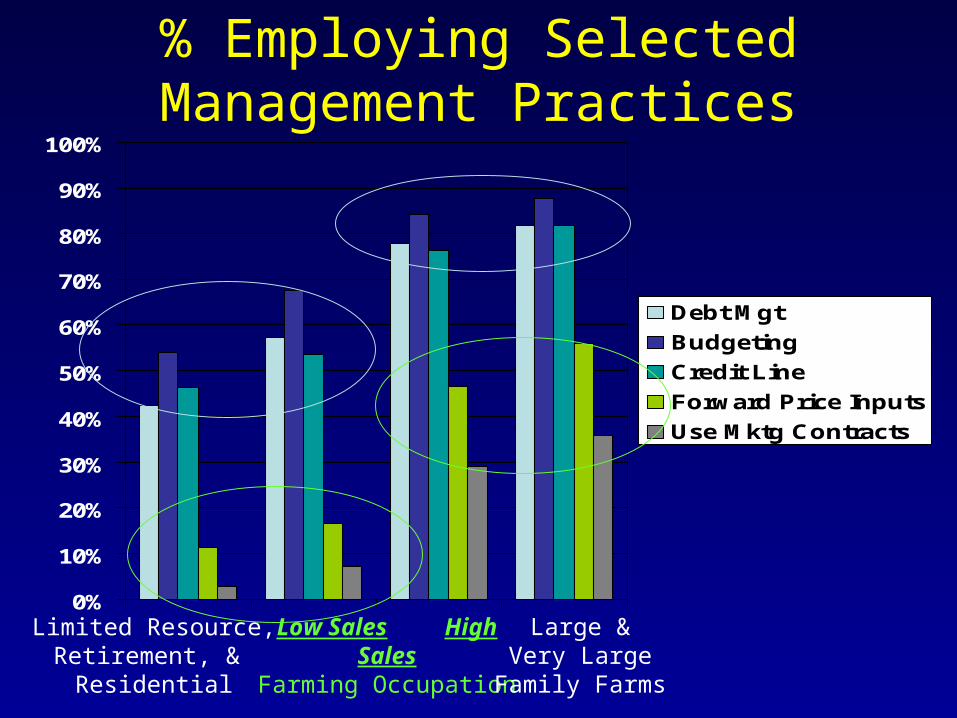
0%
10%
20%
30%
40%
50%
60%
70%
80%
90%
100%
Debt Mgt
Budgeting
Credit Line
Forward Price Inputs
Use Mktg Contracts
Limited Resource,Retirement, &
Residential
Low Sales High SalesFarming Occupation
Large &Very Large
Family Farms
% Employing SelectedManagement Practices
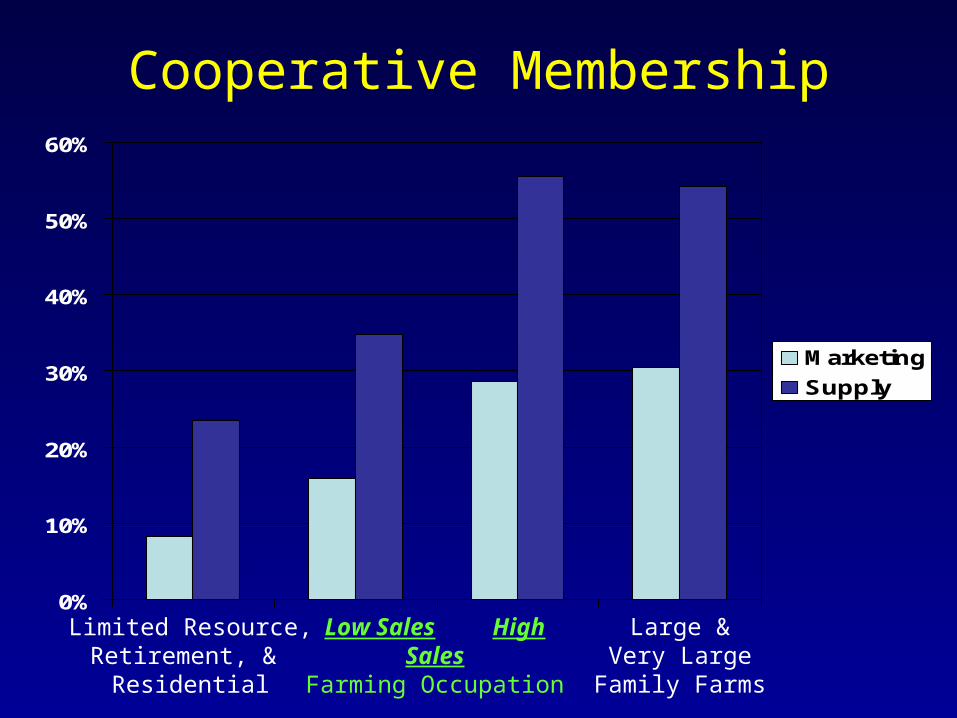
0%
10%
20%
30%
40%
50%
60%
Marketing
Supply
Cooperative Membership
Limited Resource,Retirement, &
Residential
Low Sales High SalesFarming Occupation
Large &Very Large
Family Farms
Linkages
• Interests of majority of farmers differ from interests of farmers who produce majority of farm output

Where Does the Farm Household’s Income
Come From?

-10,000
0
10,000
20,000
30,000
40,000
50,000
60,000
70,000
80,000
90,000
Off-Farm
Farm
Total Household Income: Where Farming Subtracts
Limited Resource
Low SalesFarming Occupation
Retirement ResidentialLifestyle

0
50,000
100,000
150,000
200,000
250,000
Off-Farm
Farm
Total Household Income:Where Farming Adds
High SalesFarming Occupation
Large Family Farms
Very LargeFamily Farms

0
1,000
2,000
3,000
4,000
5,000
6,000
On-Farm
Off-Farm
Hours Worked On & Off the Farm:Family Farm Households
Low Sales High SalesFarming Occupation
Large Family Farms
Very LargeFamily Farms
29.8% 24.1%18.3% 18.9%
Linkages
• Interests of majority of farmers differ from interests of farmers who produce majority of farm output
• Off-farm work consumes time/attention & is important economically across all farm categories

Who’s Well Off?
JoeAverage
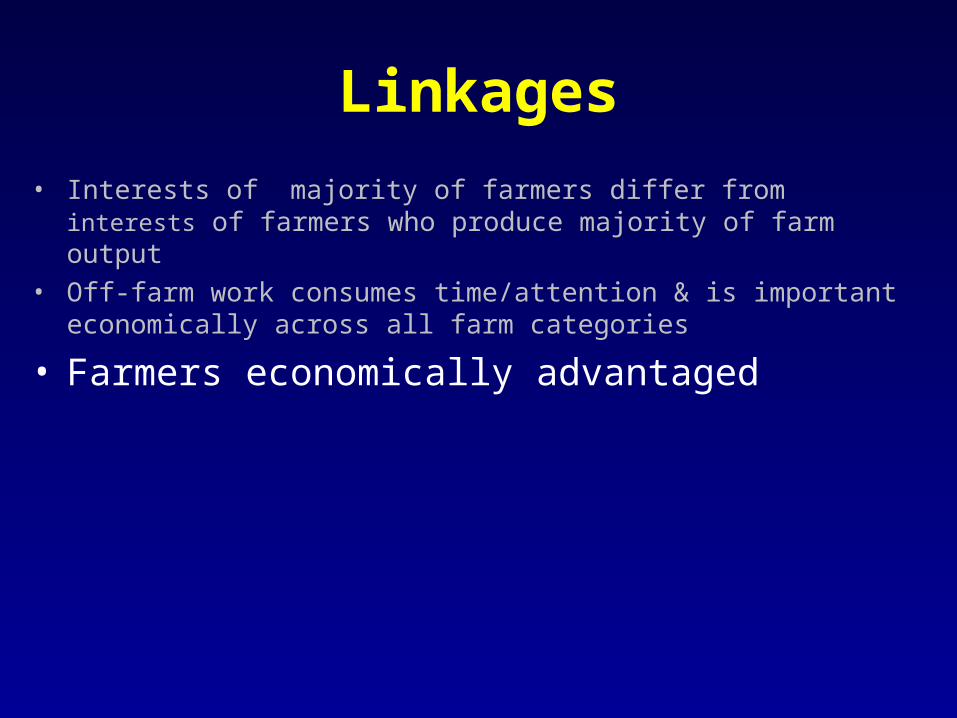
Linkages
• Interests of majority of farmers differ from interests of farmers who produce majority of farm output
• Off-farm work consumes time/attention & is important economically across all farm categories
• Farmers economically advantaged

Farm Income Support Policies
-20,000
0
20,000
40,000
60,000
80,000
100,000
120,000
140,000
160,000
180,000
200,000
$'s
per
farm
*
Farm Earnings Govt Payt
Low Sales High SalesFarming Occupation
Large Family Farms
Very LargeFamily Farms
* Government payments only for those farms receiving payments
Remember the independentfamily farmer
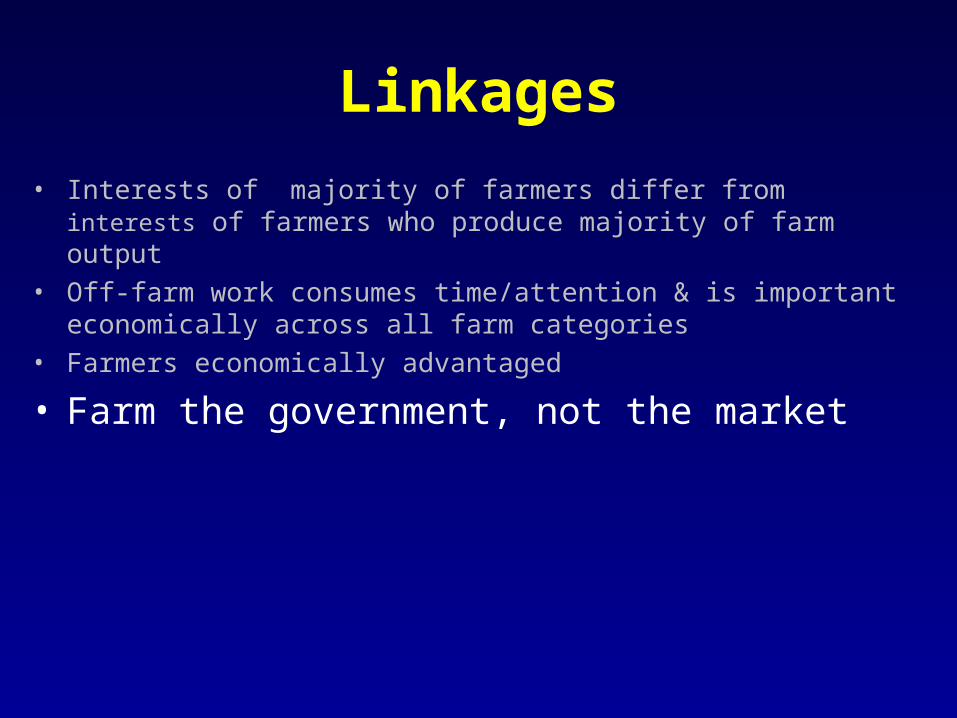
Linkages
• Interests of majority of farmers differ from interests of farmers who produce majority of farm output
• Off-farm work consumes time/attention & is important economically across all farm categories
• Farmers economically advantaged
• Farm the government, not the market
The Farmer’s Neighbor:Friend or Foe?

Tenure Dynamics in the Midwest
Full ownerPart ownerFull tenant

Linkages
• Interests of majority of farmers differ from interests of farmers who produce majority of farm output
• Off-farm work consumes time/attention & is important economically across all farm categories
• Farmers economically advantaged• Farm the government, not the market
• Competition for access to land changes relationship dynamics
Assume a Commodity Market

Share of Hog Production-By Type of Vertical Coordination
1970-1999
0% 20% 40% 60% 80% 100%
1970
1980
1993
1999
contracting vertical integration open market
NowAbove 80%
Linkages
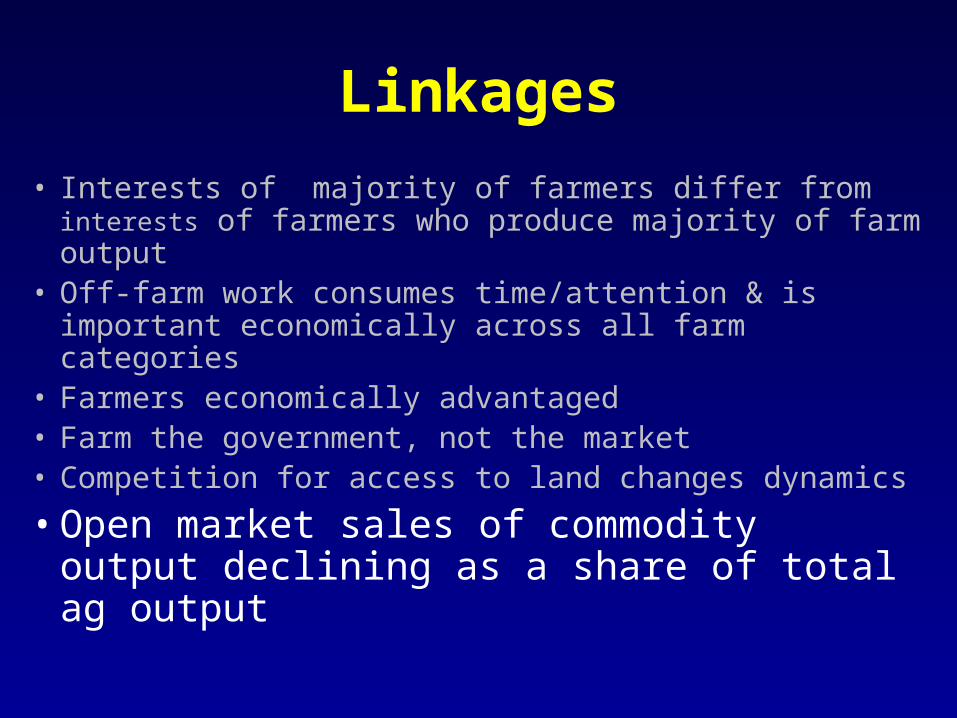
• Interests of majority of farmers differ from interests of farmers who produce majority of farm output
• Off-farm work consumes time/attention & is important economically across all farm categories
• Farmers economically advantaged• Farm the government, not the market• Competition for access to land changes dynamics
• Open market sales of commodity output declining as a share of total ag output

Segmentation

New Zealand MerinoCreating a Silk Purse
From a Sow’s Ear
0
500
1000
1500
2000
2500
69/70
71/72
73/74
75/76
77/78
79/80
81/82
83/84
85/86
87/88
89/90
91/92
93/94
95/96
97/98
99/00
Season
(100
0 M
T)
0
100
200
300
400
500
600
700
800
Cen
ts/K
g
World Production Average Price
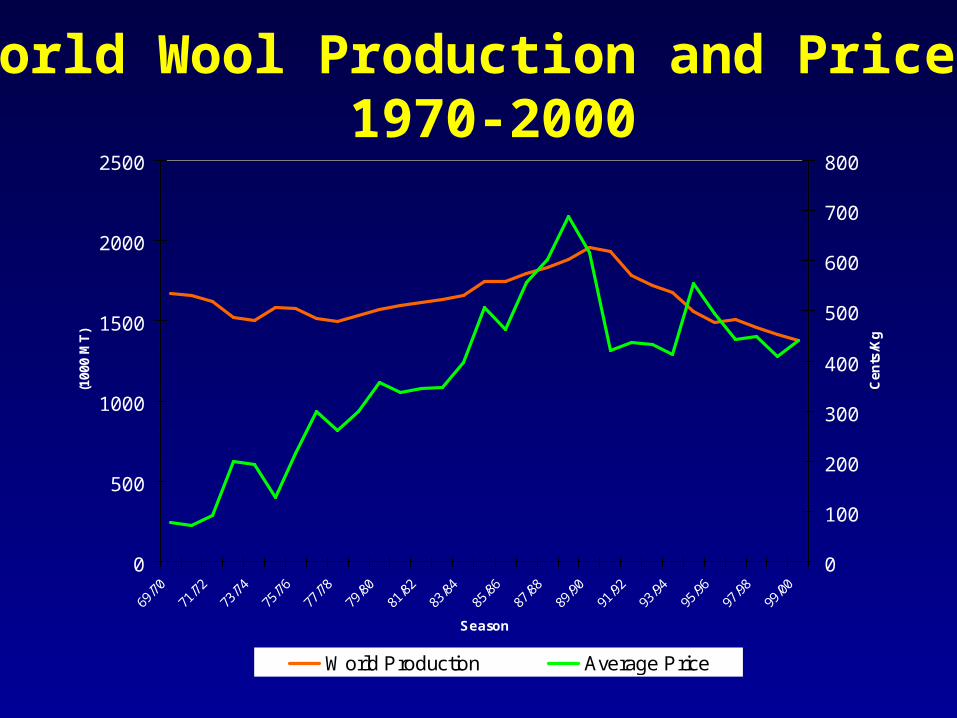
World Wool Production and Price: 1970-2000
0
5000
10000
15000
20000
25000
30000
3500010
00 M
T
1900
1910
1920
1930
1940
1950
1960
1970
1980
1990
2000
Year
Wool Natural fibers Synthetic fibers
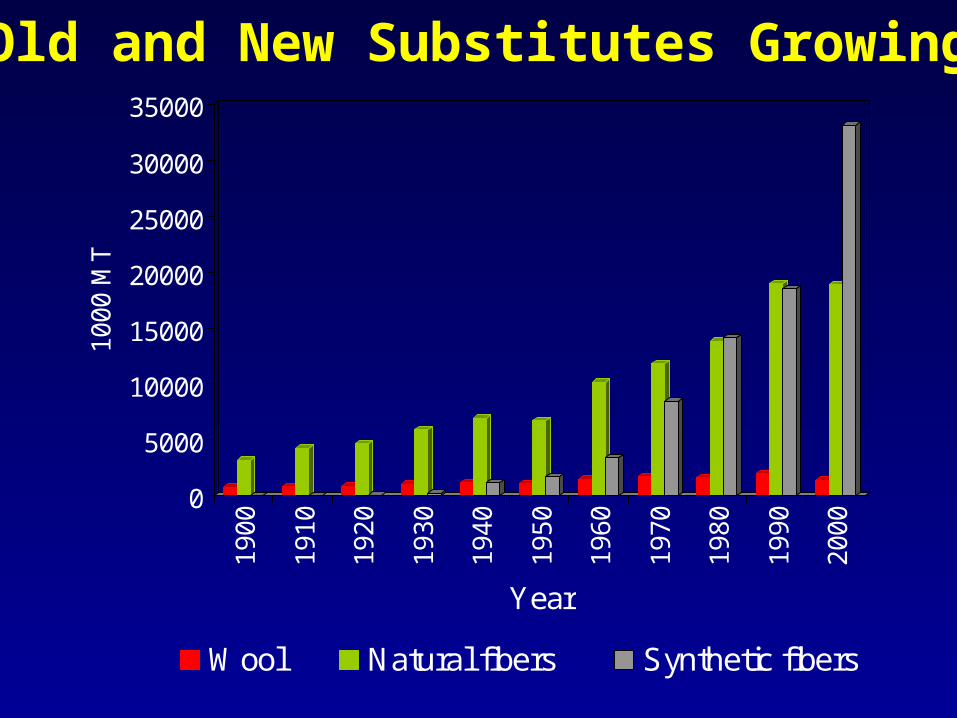
Old and New Substitutes Growing
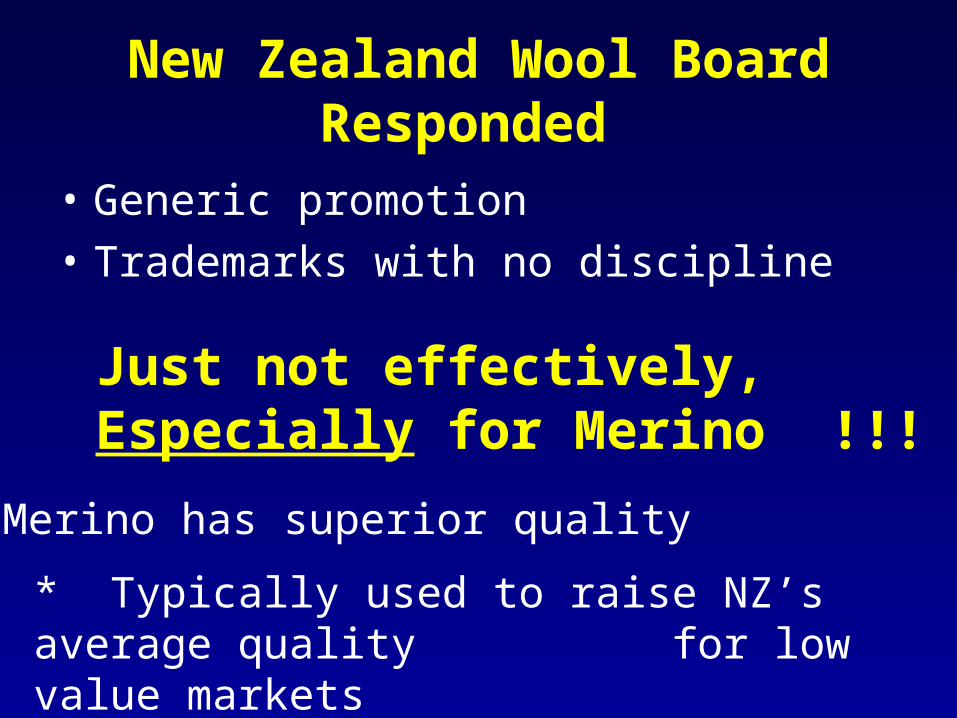
New Zealand Wool Board Responded
• Generic promotion
• Trademarks with no discipline
Just not effectively,Especially for Merino !!!
* Merino has superior quality
* Typically used to raise NZ’s average quality for low value markets
A Silk Purse From a Sow’s Ear
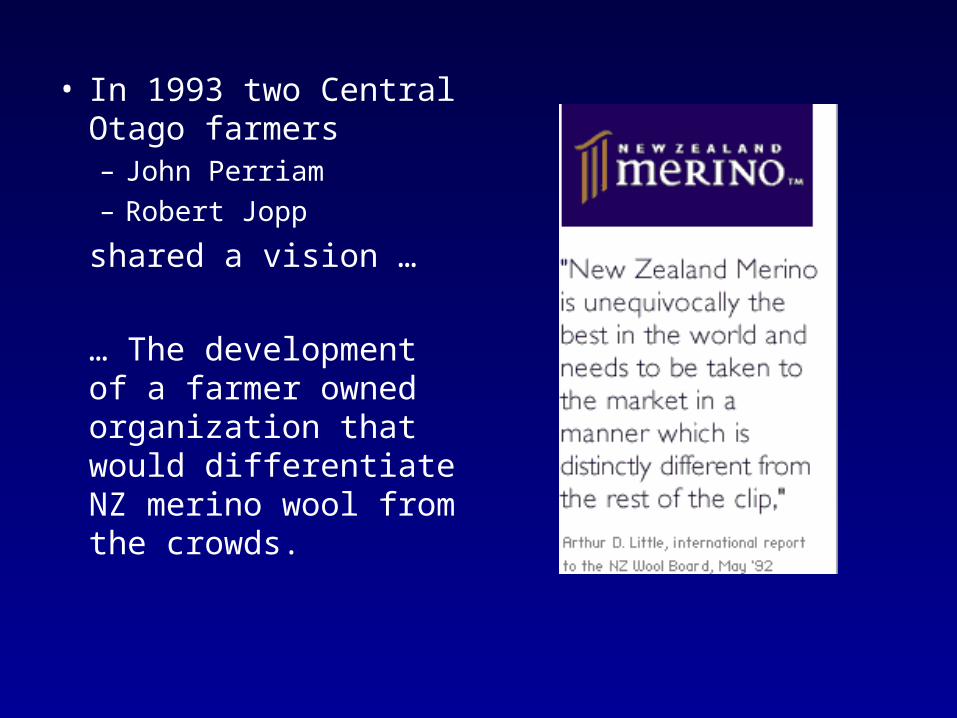
• In 1993 two Central Otago farmers – John Perriam– Robert Jopp
shared a vision …
… The development of a farmer owned organization that would differentiate NZ merino wool from the crowds.

From Vision …to Reality.

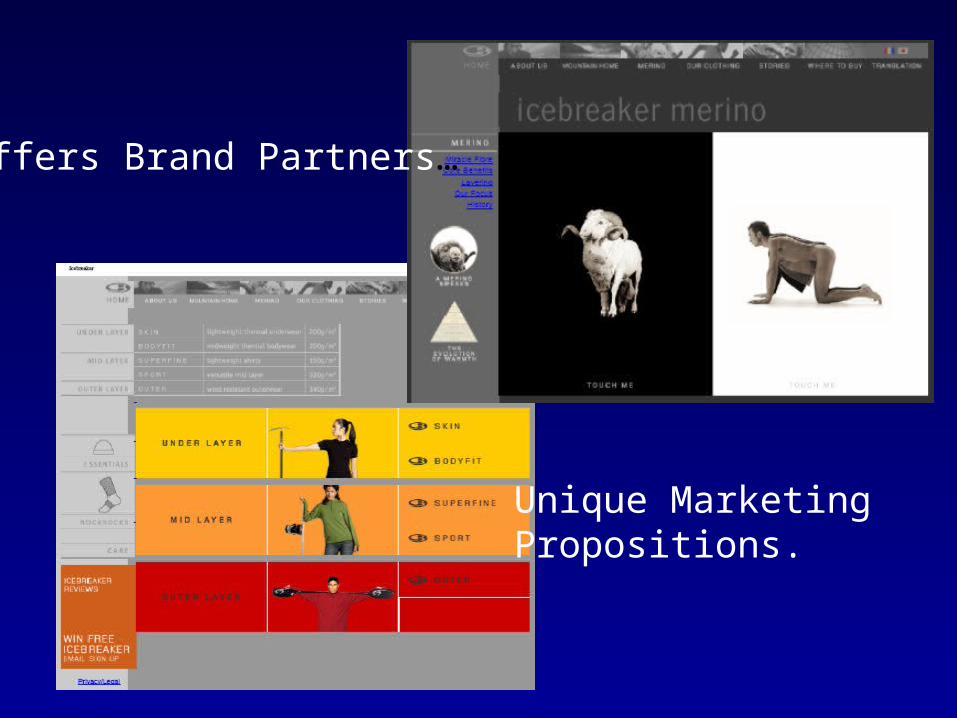
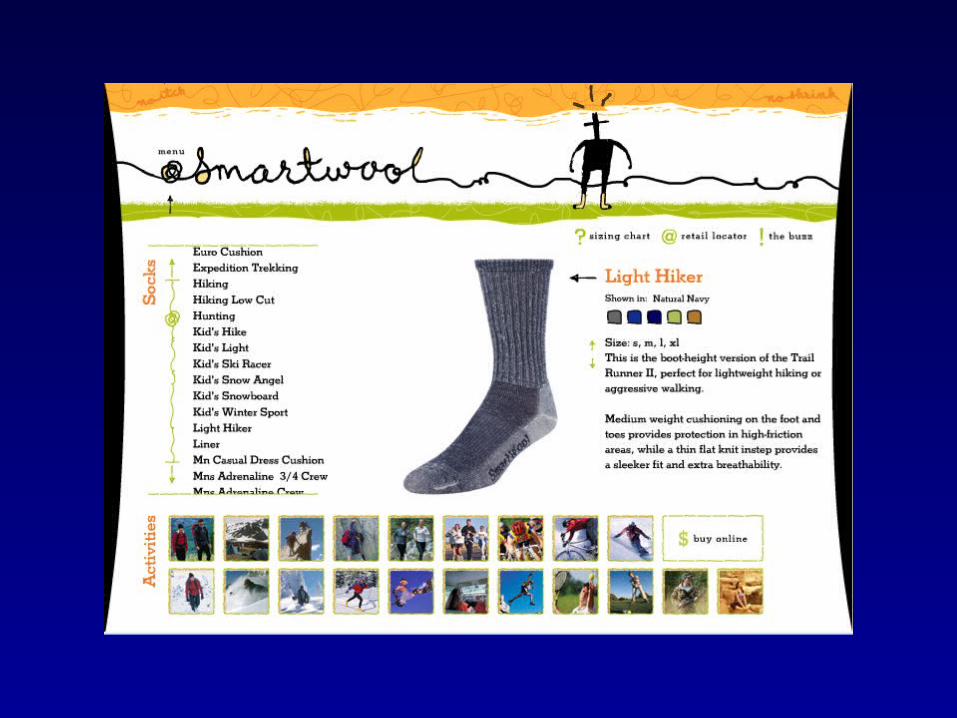
Unique Marketing Propositions.
Offers Brand Partners…

These may include Intel inside co-Branding Relationship with some Partners
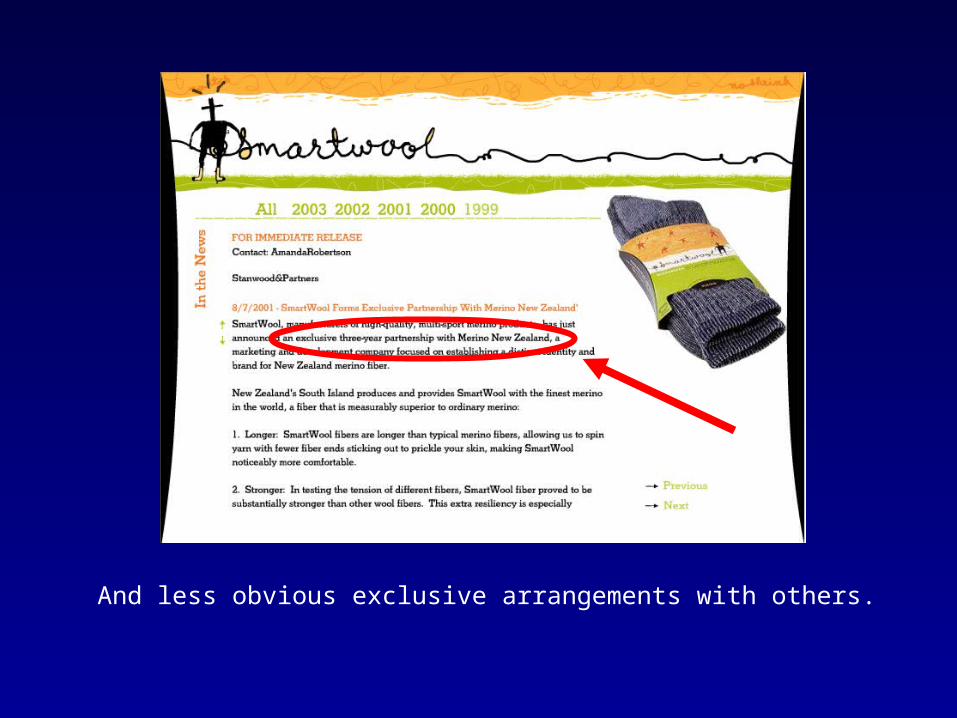
And less obvious exclusive arrangements with others.

Financial Performance 2002 FY
• Turnover: NZD $85 mil• NZM auctioned wool:
– 12% price premium compared to competition
• 82% return on Investment
Summary Points
• Collective action efforts – strive to enhance farm income but underlying context has
changed and is changing– Key structural changes have eroded the commonality of the
“farm identity”
• Future success of collective action efforts requires:– Mentality shift from commodity volume to value and required
rates of return– Creative use of segmentation:
• To link needs of customer groups and interests of producer groups
• That employs innovative organizational arrangements
Recommended