Embed Size (px)
Citation preview

Soybean Meal Outlook
Ron PlainD. Howard Doane ProfessorUniversity of Missouri

The darker the color, the more severe the drought

September Corn Futures Daily Close, 2012
Source: CMEGroup
September Soy Meal Futures Daily Close, 2012
Source: CMEGroup
SOYBEANS
●U.S.
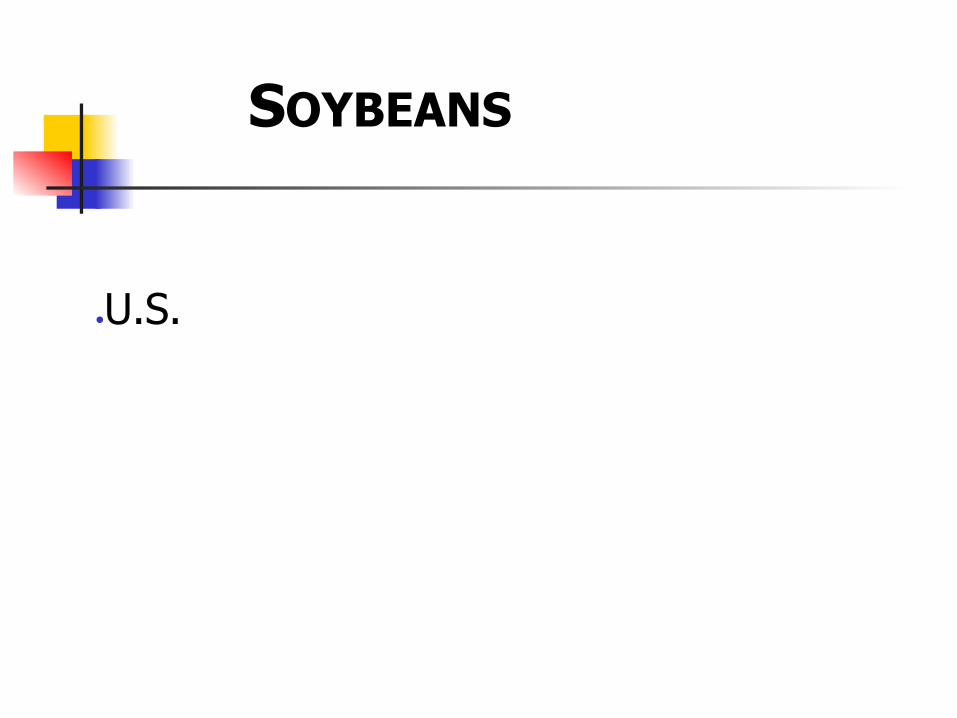
U.S. Soybean Acres Planted, 1970-12
Source: USDA/NASS
78.6 million acres expected in 2013

U.S. Average Soybean Yield, 1970-12
42.7 bu/acre expected in 2013
Source: USDA/NASS

U.S. Soybean Production, 1970-12
3.302 billion bushels expected in 2013
Source: USDA/NASS
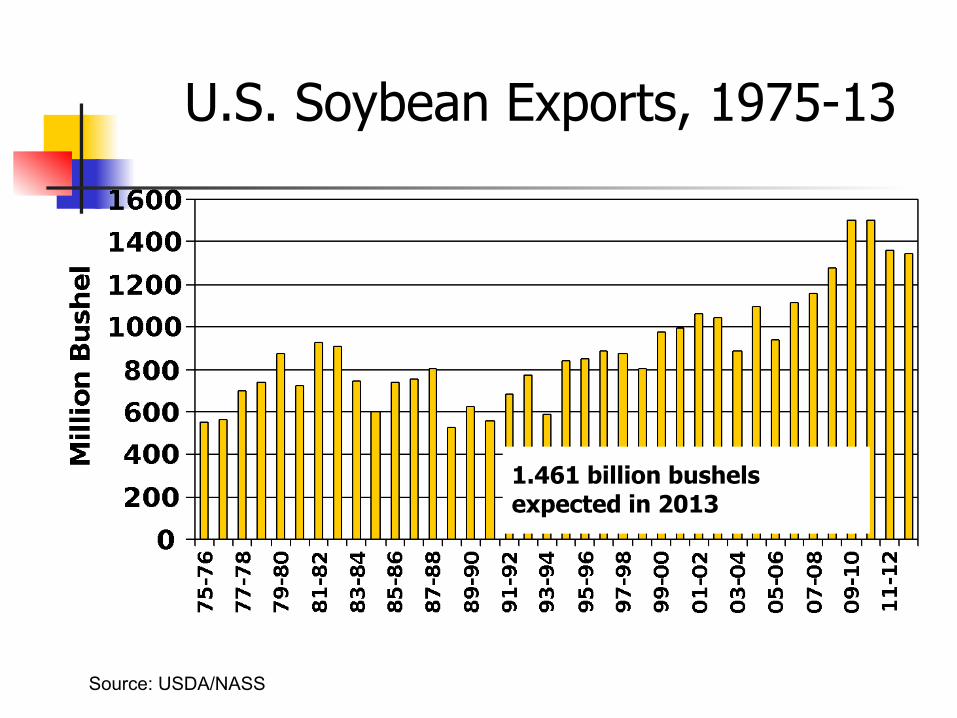
U.S. Soybean Exports, 1975-13
Source: USDA/NASS
1.461 billion bushels expected in 2013
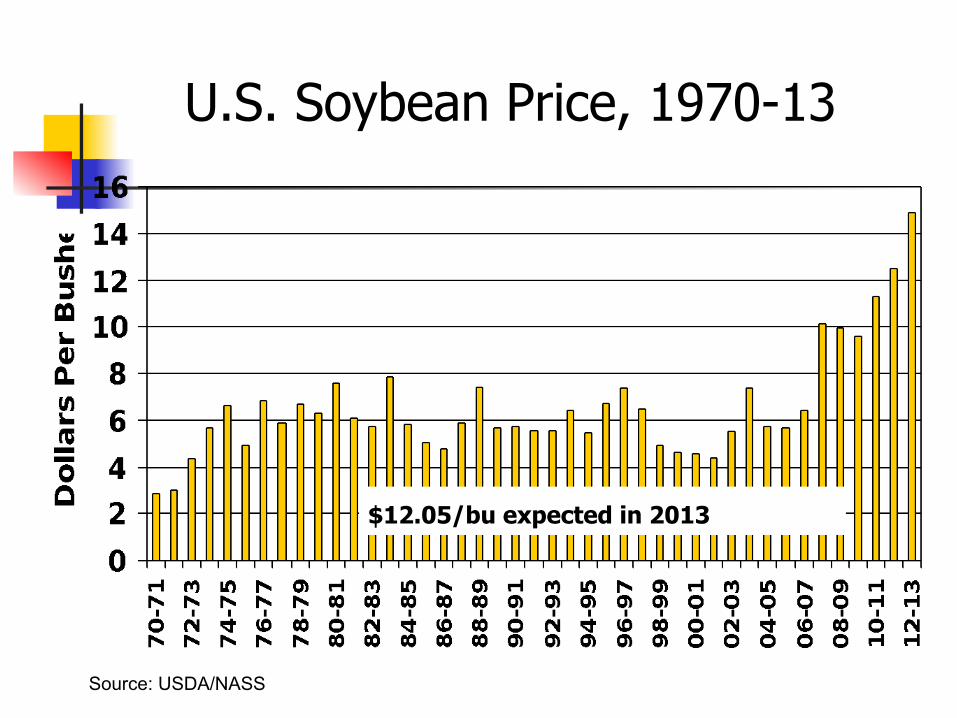
U.S. Soybean Price, 1970-13
Source: USDA/NASS
$12.05/bu expected in 2013


U.S. Monthly Average Soybean Price
Source: USDA/AMS
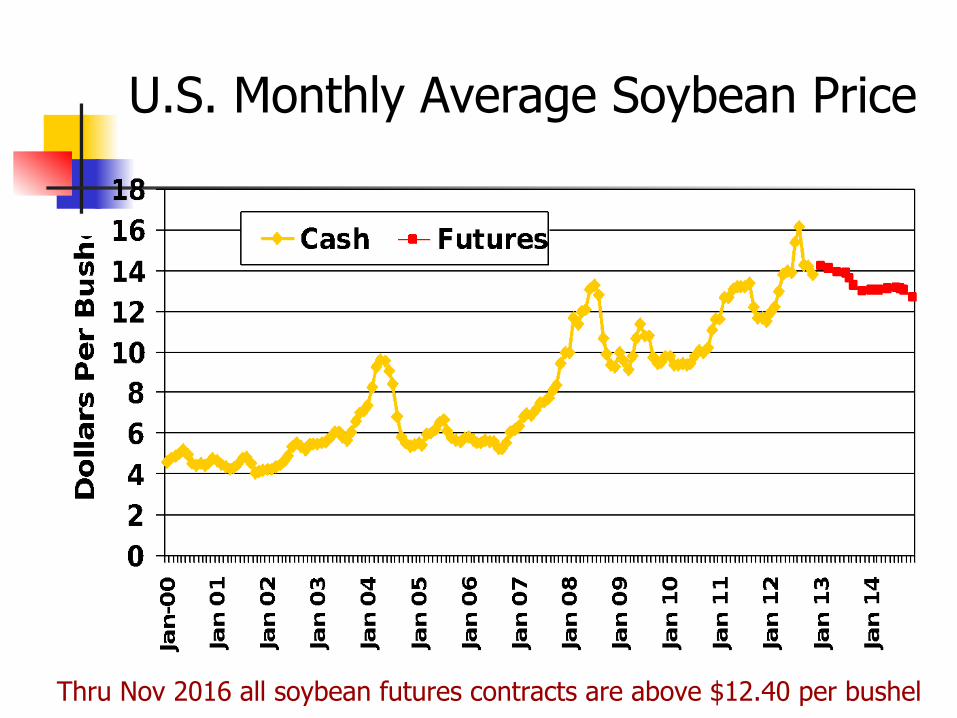
U.S. Monthly Average Soybean Price
Thru Nov 2016 all soybean futures contracts are above $12.40 per bushel
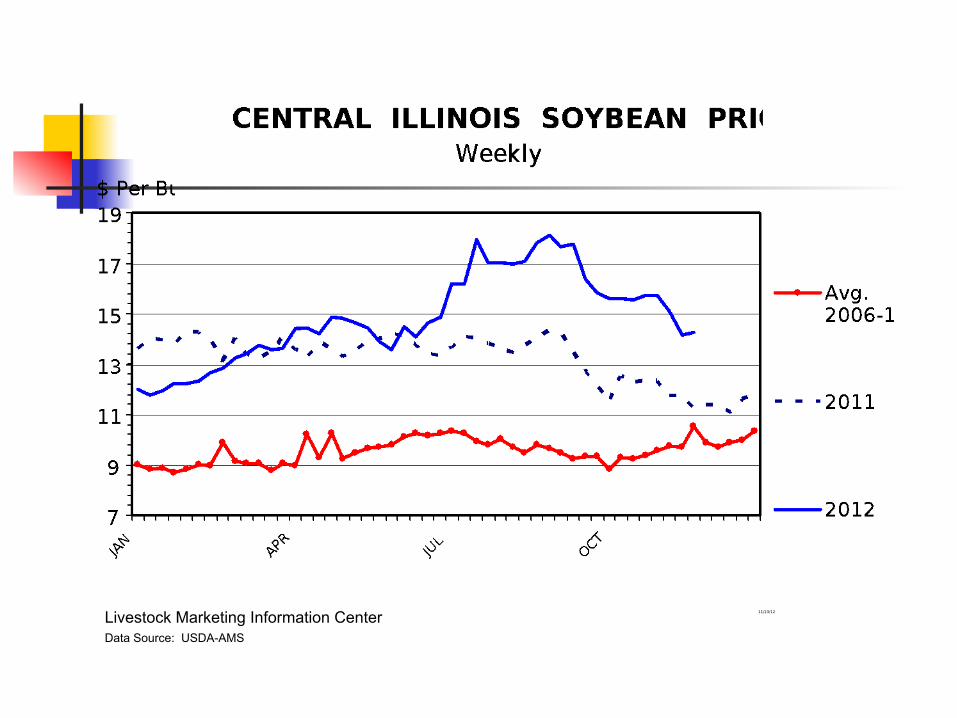
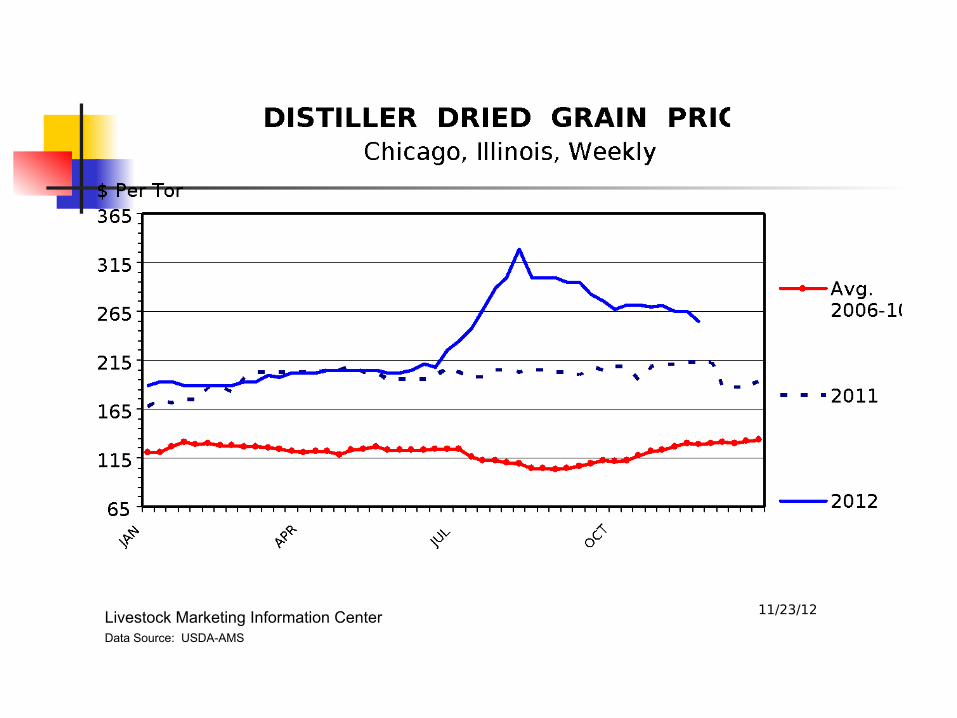
Livestock Marketing Information CenterData Source: USDA-AMS

Livestock Marketing Information CenterData Source: USDA-AMS
Livestock Marketing Information CenterData Source: USDA-AMS

Gross Revenue by Crop, 1981-12*
*Excluding government’s fixed, countercyclical, deficiency and crop insurance payments

Non-land Cost by Crop, 1981-12

Breakeven Land Rent by Crop, 1981-12*
*Excluding government’s fixed, countercyclical, deficiency and crop insurance indemnities

Iowa Farm Real Estate Values, 1940-2012*USDA/NASS
*Includes all land, buildings, and dwellings on farms.

U.S. Average Farm Price

U.S. Soybean/Corn Price Ratio, 1975-13

U.S. Corn Acres Planted, 1970-12
2012: most since 1937
Source: USDA/NASS
97.3 million acres expected in 2013
SOYBEANS
●U.S.●World

U.S. & Foreign Soybean Production
U.S. share of world production: 1990-91 50.3% 2012-13 30.2%

Soybean Production (mmt)
2011-12 2012-13 changeU.S.A 84.19 80.86 - 4.0%Brazil 66.50 81.00 + 21.8%Argentina 41.00 55.00 + 34.1%China 14.48 12.60 - 13.0%EU-27 1.29 1.10 Japan 0.22 0.22 World 239.22 267.60 + 11.9%

SOYBEAN MEAL
●U.S.

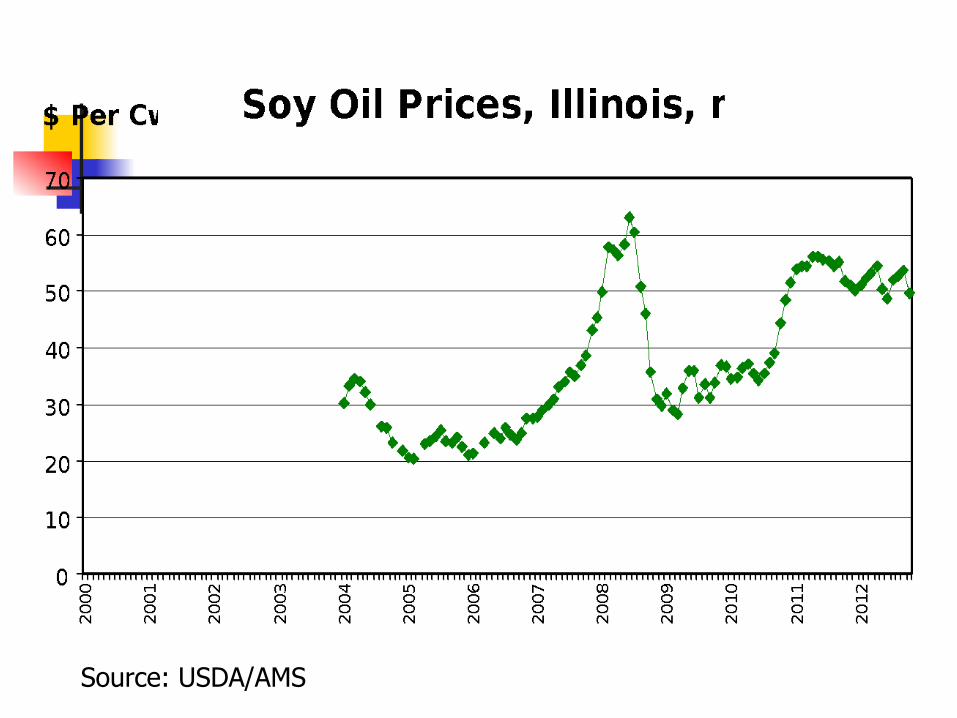
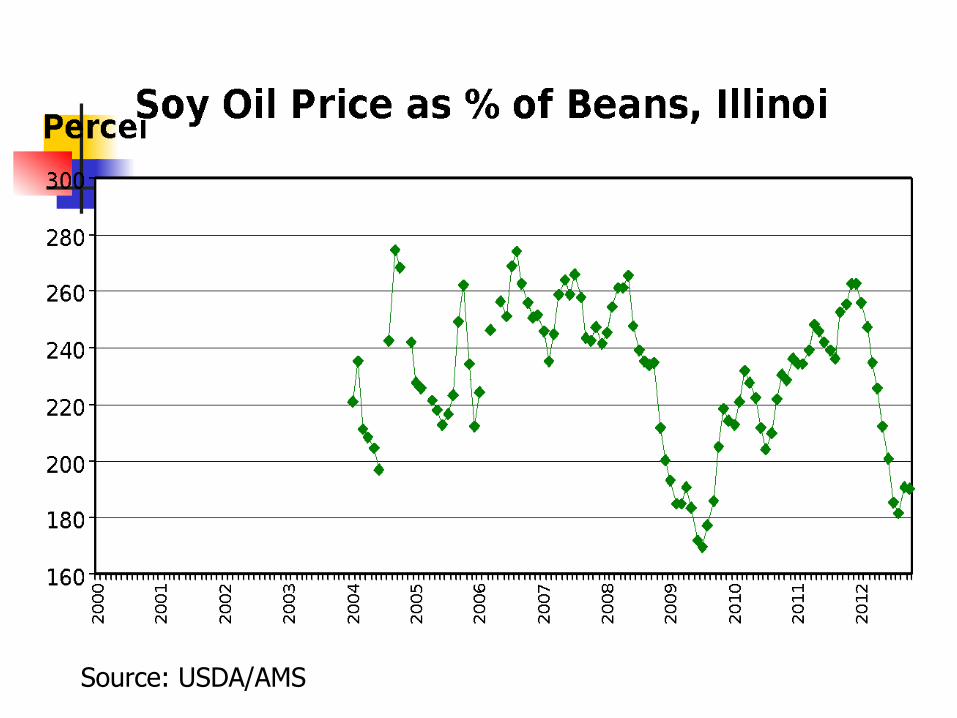
Source: USDA/AMS

Source: USDA/AMS

Source: USDA/AMS
Source: USDA/AMS
Source: USDA/AMS

U.S. Soy Component Value
Source: USDA/ERS Oil Crops Yearbook
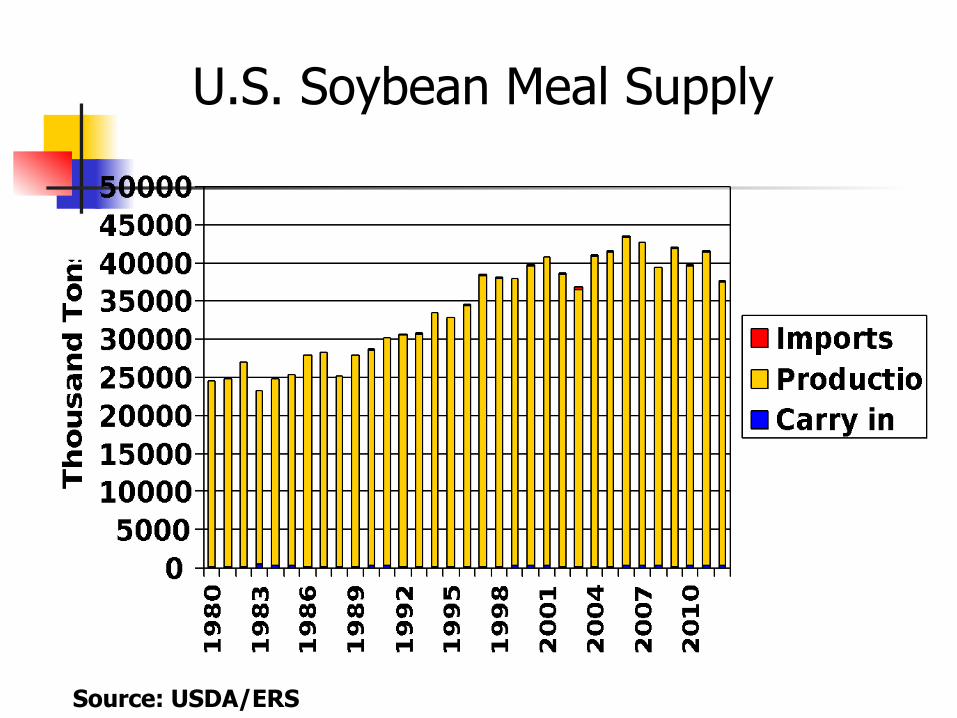
U.S. Soybean Meal Supply
Source: USDA/ERS
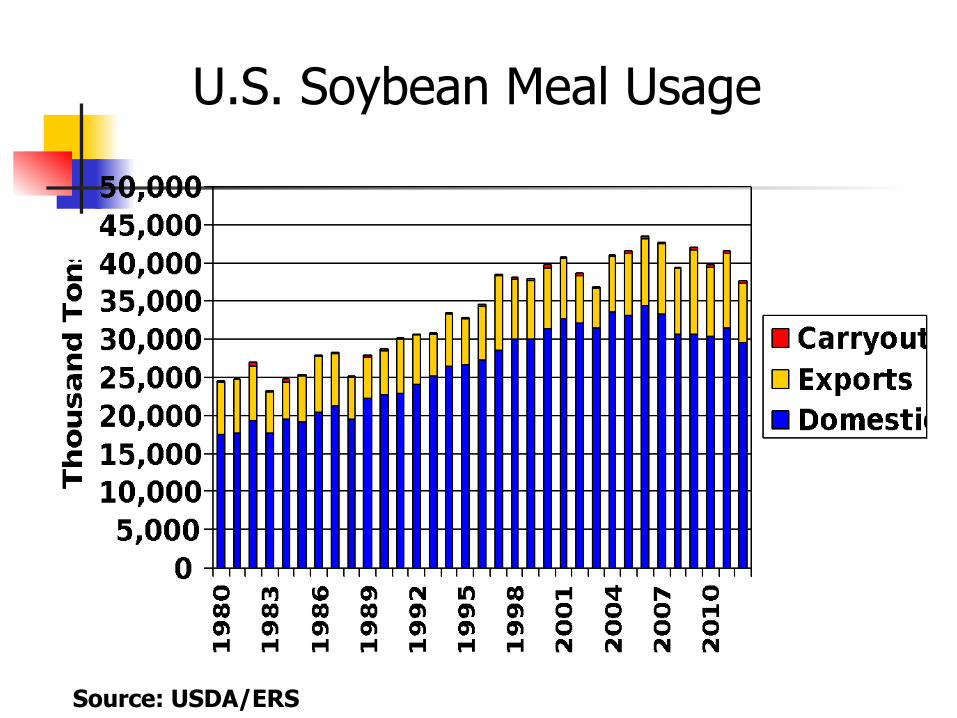
U.S. Soybean Meal Usage
Source: USDA/ERS

U.S. Protein Meal Prices
Source: USDA/FAS, Oilseeds: World Markets and Trade
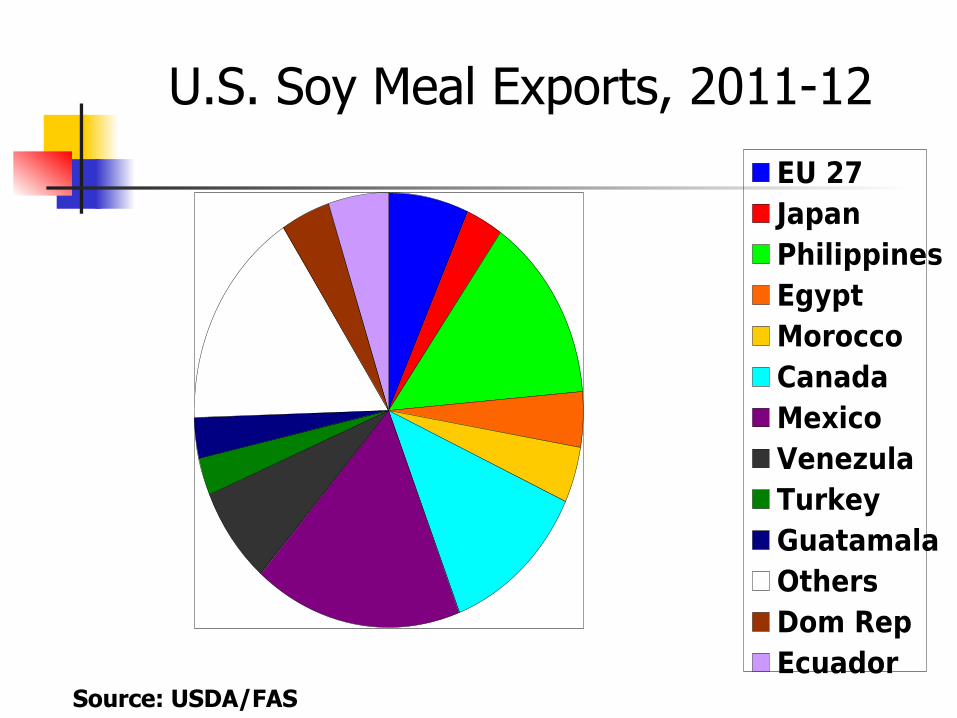
U.S. Soy Meal Exports, 2011-12
Source: USDA/FAS
SOYBEAN MEAL
●U.S.●World
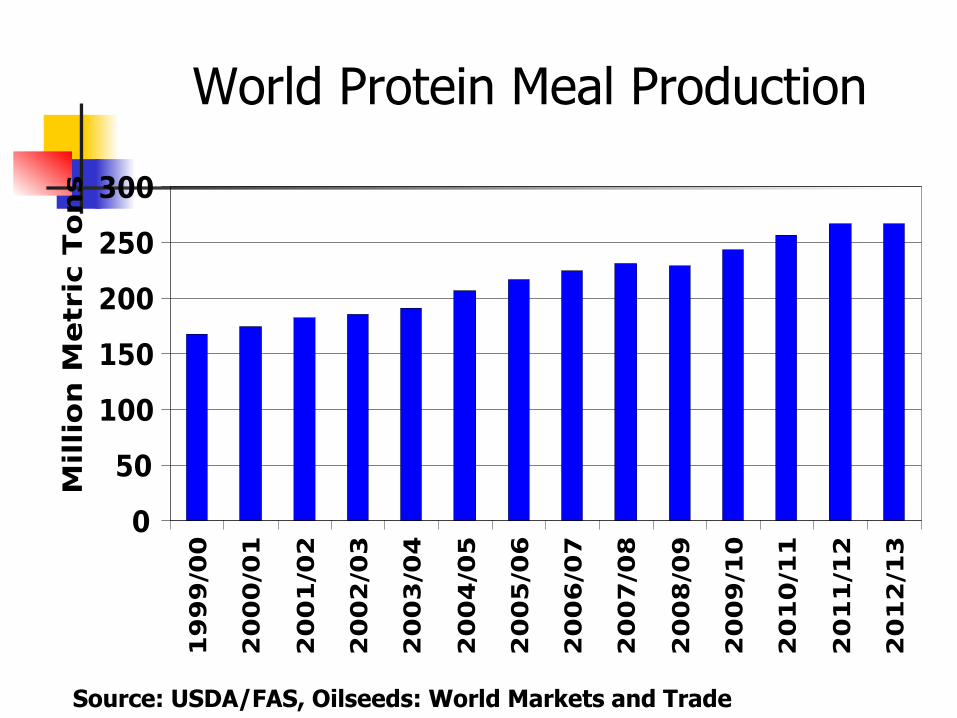
World Protein Meal Production
Source: USDA/FAS, Oilseeds: World Markets and Trade

World Soy Meal Production
Source: USDA/FAS, Oilseeds: World Markets and Trade

Soybean Meal Share of World Protein Meal Production
Source: USDA/FAS, Oilseeds: World Markets and Trade
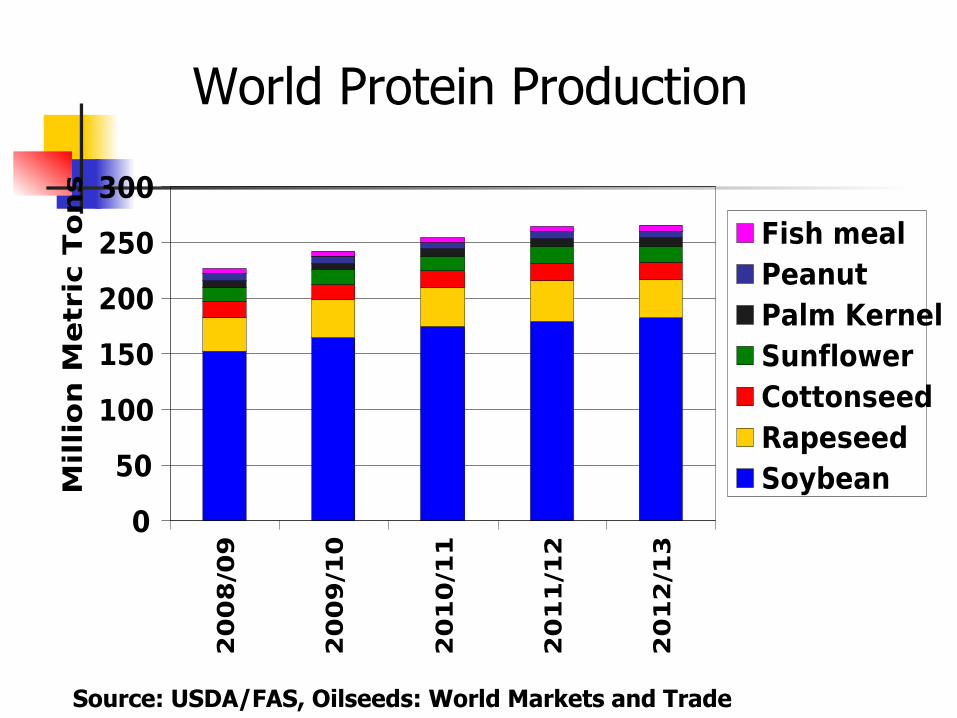
World Protein Production
Source: USDA/FAS, Oilseeds: World Markets and Trade

World Soybean Production
Source: USDA/FAS, Oilseeds: World Markets and Trade
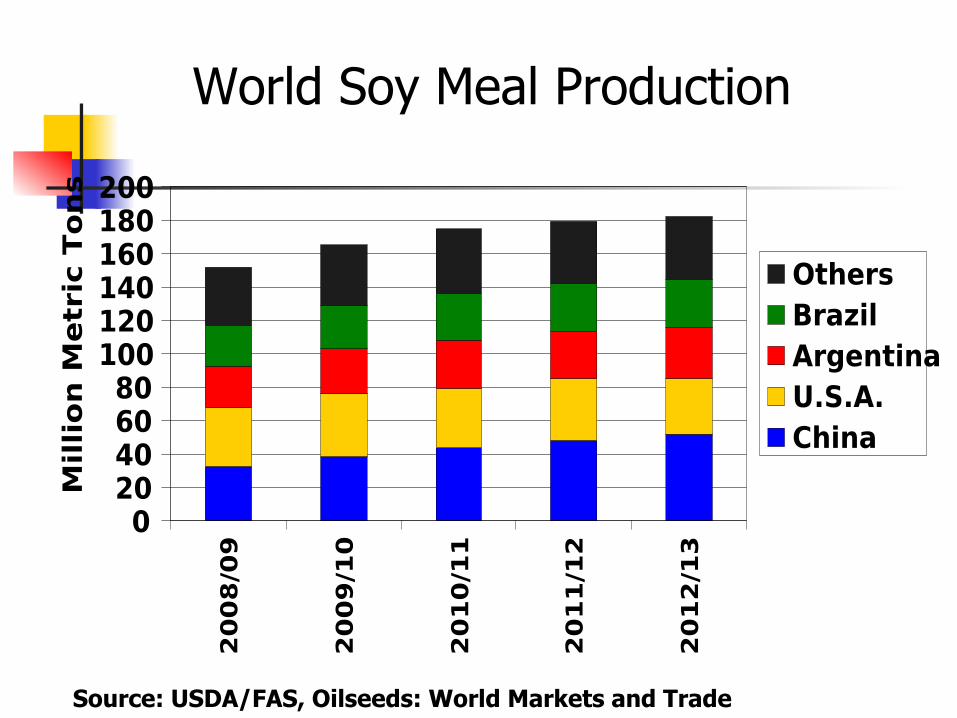
World Soy Meal Production
Source: USDA/FAS, Oilseeds: World Markets and Trade
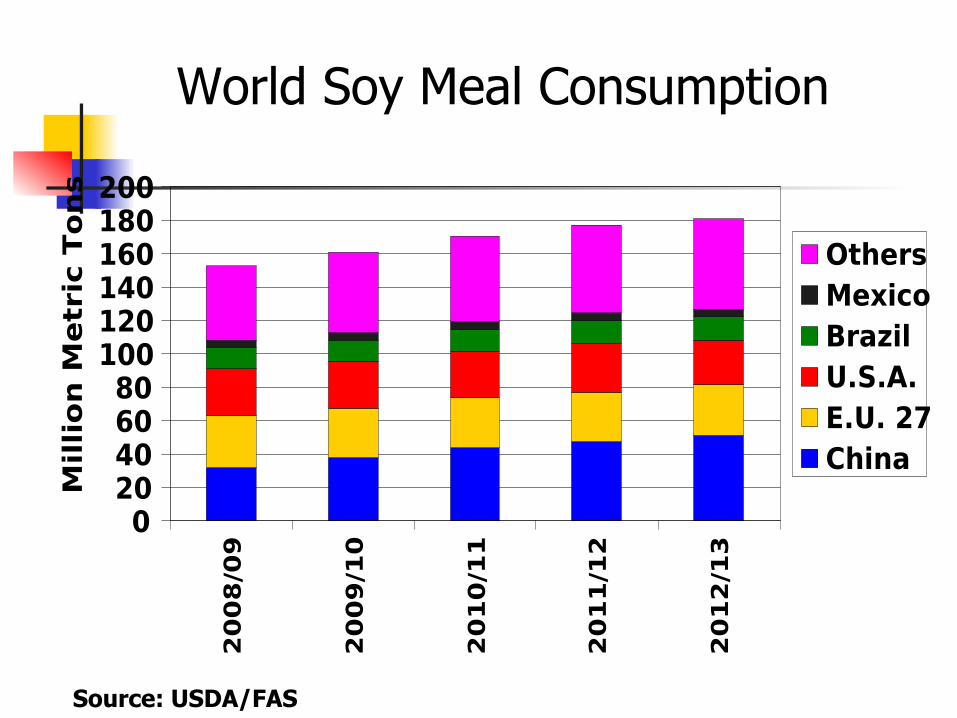
World Soy Meal Consumption
Source: USDA/FAS
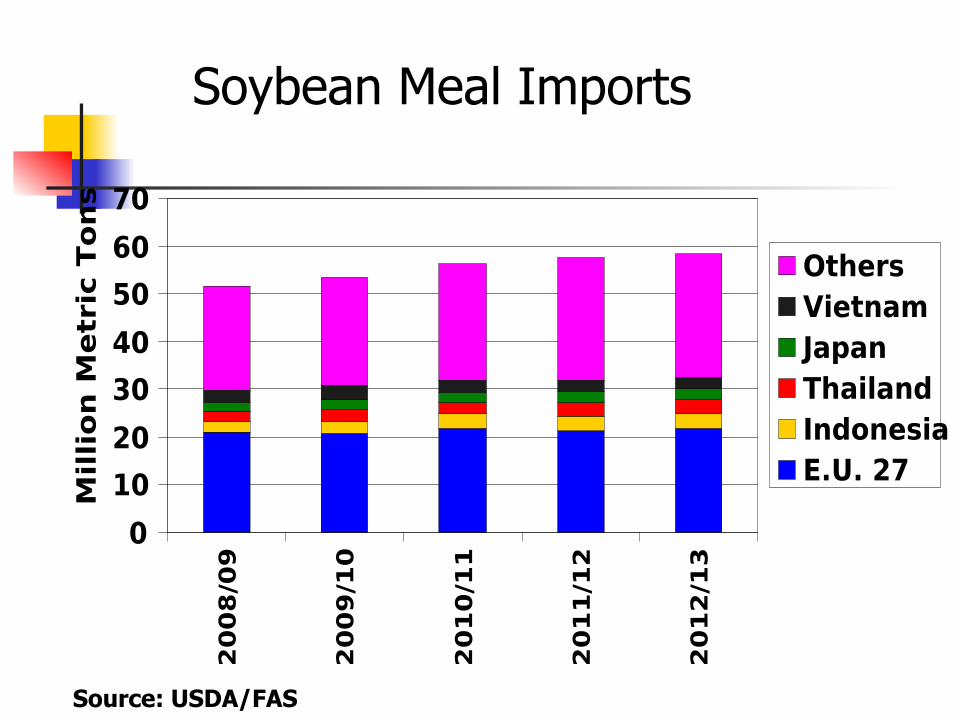
Soybean Meal Imports
Source: USDA/FAS

Soybean Meal Exports
Source: USDA/FAS

SOYBEAN MEAL DEMAND
●Domestic

Source: LMIC
2013 meat production lowest since 2006

Source: USDA/ERS
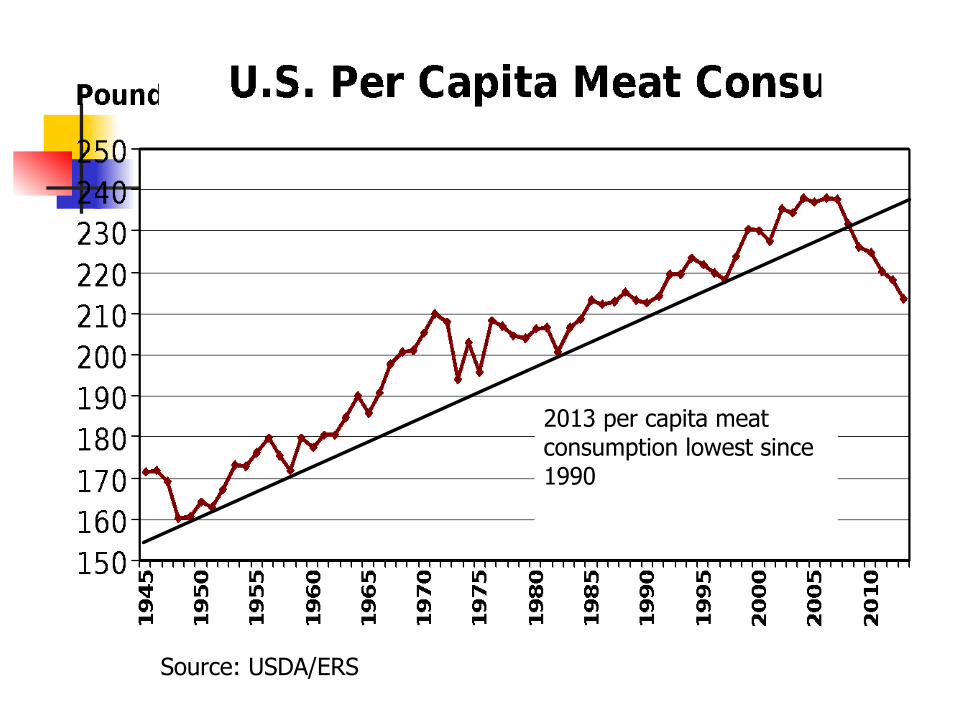
Source: USDA/ERS
2013 per capita meat consumption lowest since 1990

Forecast Change in Meat Production
---Percent Change--- Type 2011-12 2012-13
Beef - 2.3% - 4.2%Pork +2.2% - 1.4%Chicken - 0.8% - 1.2%Turkey +3.3% - 3.2%All Meats - 0.3% - 2.2%
Source: USDA-OCE WASDE, November 2012

U.S. Average Corn Price, 1908-2011
Source: USDA/NASS

U.S. Average Corn Price, 1908-2011
Source: USDA/NASS
1908-194235 years Avg $0.78
1942-1972 30 years Avg $1.26
1973-200634 years Avg $2.37
Source: USDA/NASS

Corn Milled for EthanolForecast
% corn for ethanol:
2000-01: 6%
2005-06: 14%
2007-08: 23%
2009-10: 35%
2012-13: 42%
Source: USDA/NASS
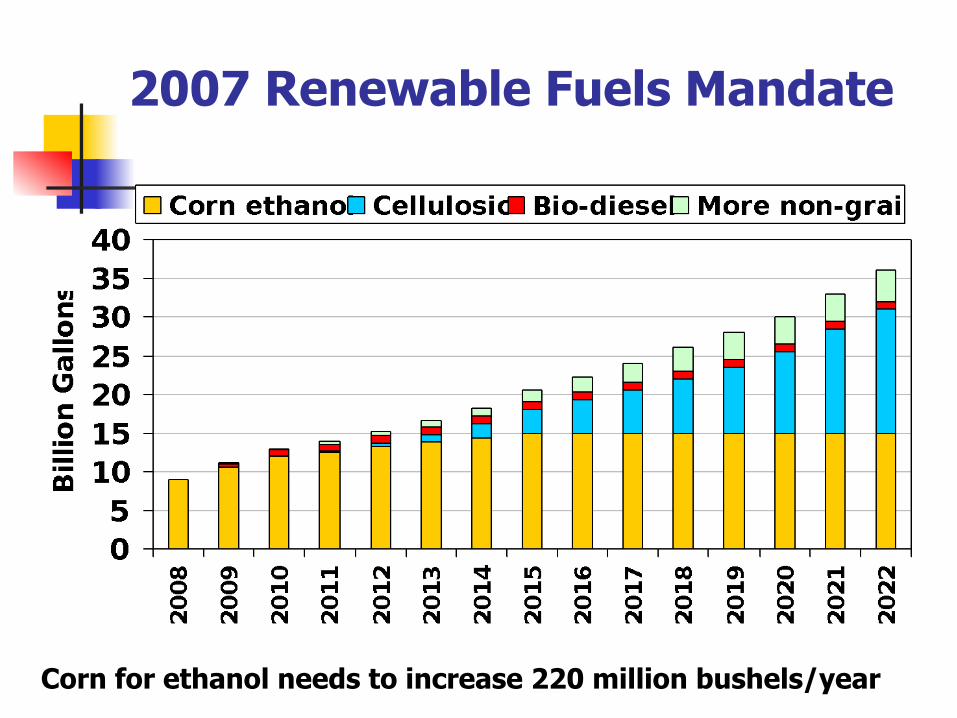
2007 Renewable Fuels Mandate
Corn for ethanol needs to increase 220 million bushels/year

U.S. Corn Price, 1970-12
Source: USDA/NASS
$5.07/bushel expected in 2013

Value of U.S. Corn Crop, 1970-12
Source: USDA/NASS
$72.7 billion expected in 2013

U.S. Monthly Average Corn Price
Thru Dec 2015 all corn futures contracts are above $5.80 per bushel

Source: USDA/NASS
Source: USDA/NASS
Meat Demand
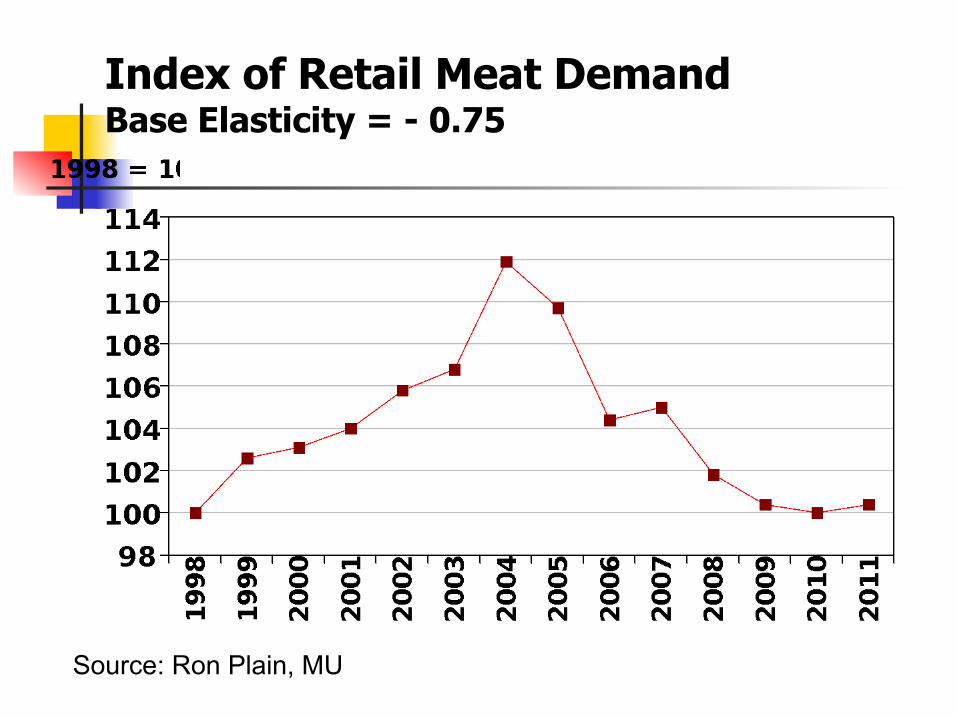
Index of Retail Meat DemandBase Elasticity = - 0.75
Source: Ron Plain, MU
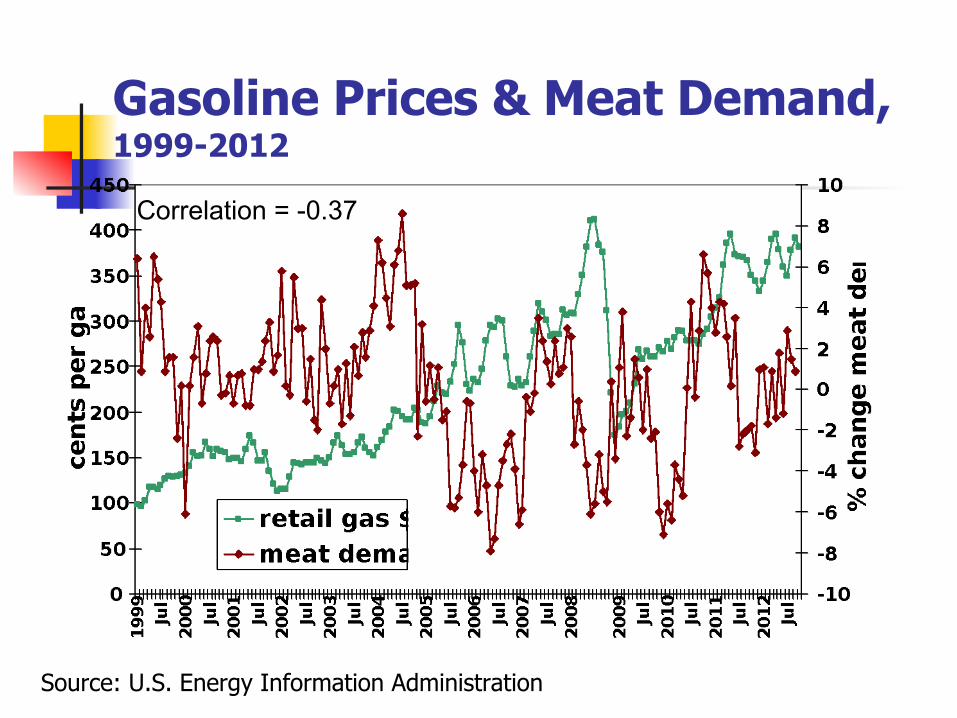
Gasoline Prices & Meat Demand, 1999-2012
Source: U.S. Energy Information Administration
Correlation = -0.37

U.S. Civilian Employment, 1948-2012
Source: Bureau of Labor Statistics, household survey, seasonally adjusted & MU, 1.00143/month
In October 2012, U.S. 17.5 million jobs under trend
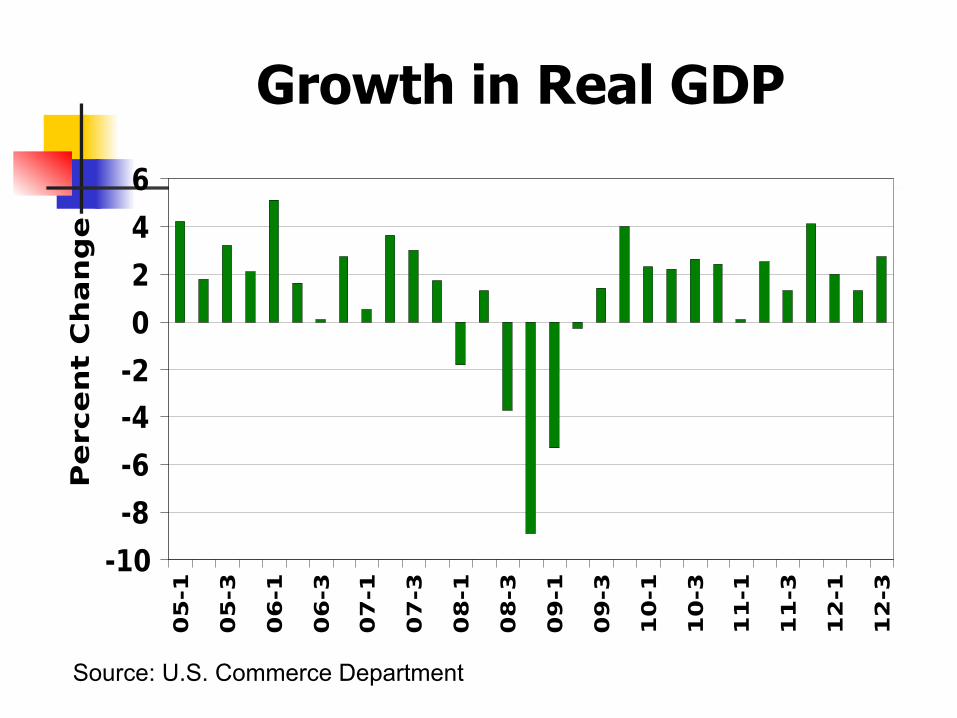
Growth in Real GDP
Source: U.S. Commerce Department

Change in Real GDP from Previous Year Seasonally Adjusted, Annual Rate, 1950-2011
Source: U.S. Department of Commerce, Bureau of Economic Analysis

Change in Real GDP from Previous Year Seasonally Adjusted, Annual Rate, 1950-2011
Source: U.S. Department of Commerce, Bureau of Economic Analysis
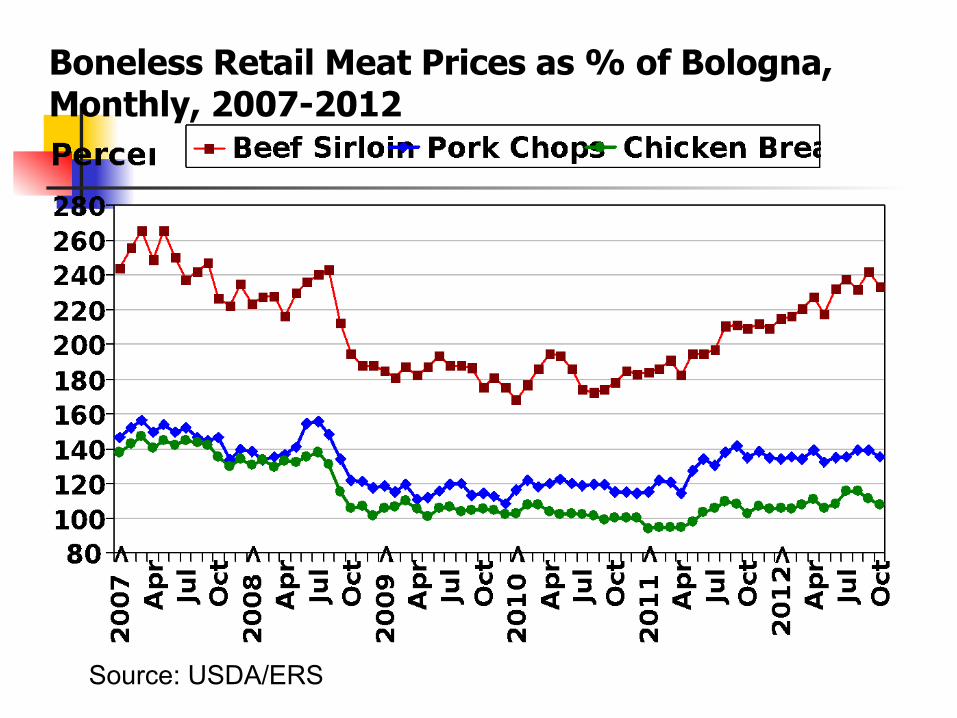
Boneless Retail Meat Prices as % of Bologna, Monthly, 2007-2012
Source: USDA/ERS
SOYBEAN MEAL DEMAND
●Domestic●Foreign
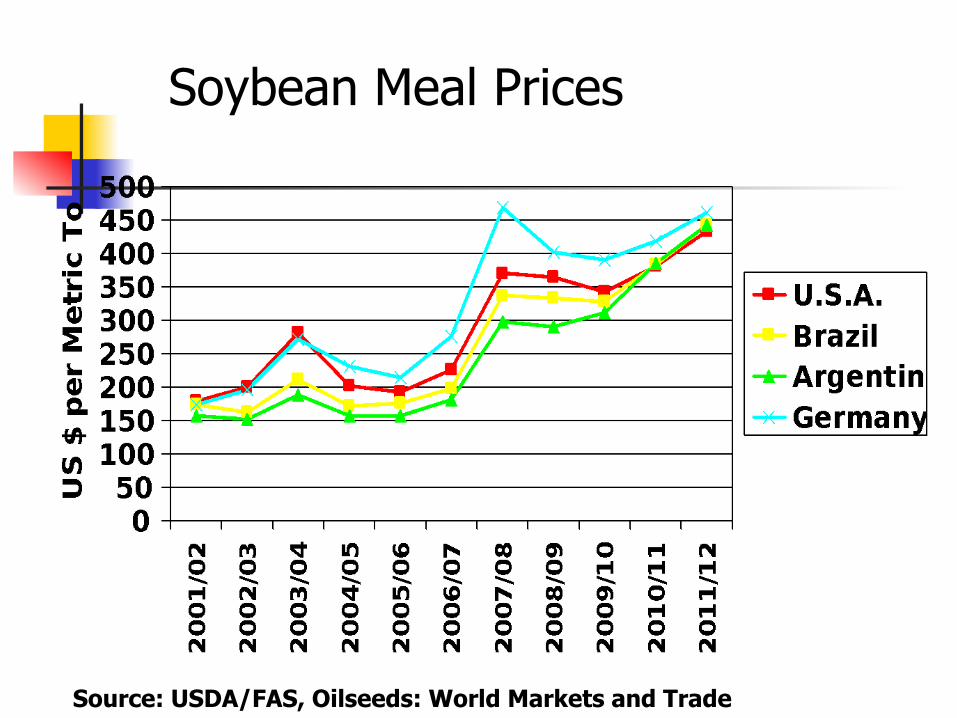
Soybean Meal Prices
Source: USDA/FAS, Oilseeds: World Markets and Trade


KEY SOY MEAL ISSUES
●Short run●South American crop●China’s purchases●2013 acreage and weather
●Longer term●South American acreage●U.S. livestock & poultry inventory●Next farm bill●Renewable fuels policy

Questions?