EVALUATION OF PERVIOUS CONCRETE MIXES IN
AREAS SUBJECT TO SNOW PLOW OPERATIONS AND
ABRASIVE AND SALT APPLICATION
Draft Final Report
July 2014
i
EVALUATION OF PERVIOUS CONCRETE MIXES IN
AREAS SUBJECT TO SNOW PLOW OPERATIONS AND
ABRASIVE AND SALT APPLICATION
Draft Final Report
by
Ning Xie, Ph.D.
Stephen Mery
Yudong Dang, Ph.D.
Michelle Akin, P.E.
Xianming Shi, Ph.D., P.E.
Western Transportation Institute
College of Engineering
Montana State University
PO Box 174250
Bozeman, MT 59717
for
Nevada Department of Transportation
Research Section
Attn: Manju Kumar
1263 S. Stewart Street
Carson City, NV 89712
and
Federal Highway Administration
400 Seventh Street, SW
Washington, DC 20590-0003
July 2014
ii
Technical Report Documentation Page
1. 1. Report No.
2. Government Accession No.
3. Recipient’s Catalog No.
4. Title and Subtitle
EVALUATION OF PERVIOUS CONCRETE MIXES IN AREAS SUBJECT TO SNOW PLOW
OPERATIONS AND ABRASIVE AND SALT APPLICATION
5. Report Date
July 2014
6. Performing Organization Code
7. Author(s) Ning Xie, Stephen Mery, Yudong Dang, Michelle Akin, Xianming Shi
8. Performing Organization Report No.
9. Performing Organization Name and Address
Corrosion and Sustainable Infrastructure Lab
Western Transportation Institute
P. O. Box 174250, Montana State University
Bozeman, MT 59717-4250
10. Work Unit No. (TRAIS)
11. Contract or Grant No.
12. Sponsoring Agency Name and Address
Nevada Department of Transportation
Research Section and Federal Highway Administration
1263 S. Stewart Street 400 Seventh Street, SW
Carson City, NV 89712 Washington, DC 20590-0003
13. Type of Report and Period Covered
14. Sponsoring Agency Code
15. Supplementary Notes
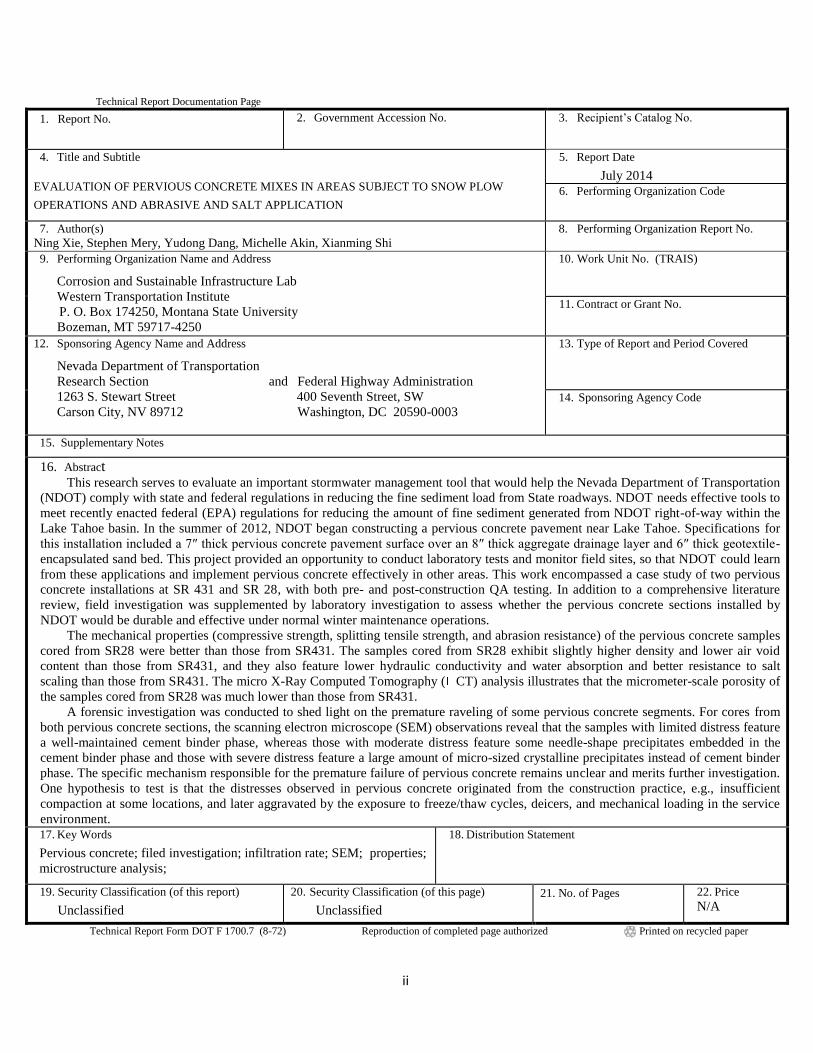
16. Abstract This research serves to evaluate an important stormwater management tool that would help the Nevada Department of Transportation
(NDOT) comply with state and federal regulations in reducing the fine sediment load from State roadways. NDOT needs effective tools to
meet recently enacted federal (EPA) regulations for reducing the amount of fine sediment generated from NDOT right-of-way within the
Lake Tahoe basin. In the summer of 2012, NDOT began constructing a pervious concrete pavement near Lake Tahoe. Specifications for
this installation included a 7″ thick pervious concrete pavement surface over an 8″ thick aggregate drainage layer and 6″ thick geotextile-
encapsulated sand bed. This project provided an opportunity to conduct laboratory tests and monitor field sites, so that NDOT could learn
from these applications and implement pervious concrete effectively in other areas. This work encompassed a case study of two pervious
concrete installations at SR 431 and SR 28, with both pre- and post-construction QA testing. In addition to a comprehensive literature
review, field investigation was supplemented by laboratory investigation to assess whether the pervious concrete sections installed by
NDOT would be durable and effective under normal winter maintenance operations.
The mechanical properties (compressive strength, splitting tensile strength, and abrasion resistance) of the pervious concrete samples
cored from SR28 were better than those from SR431. The samples cored from SR28 exhibit slightly higher density and lower air void
content than those from SR431, and they also feature lower hydraulic conductivity and water absorption and better resistance to salt
scaling than those from SR431. The micro X-Ray Computed Tomography ( CT) analysis illustrates that the micrometer-scale porosity of
the samples cored from SR28 was much lower than those from SR431.
A forensic investigation was conducted to shed light on the premature raveling of some pervious concrete segments. For cores from
both pervious concrete sections, the scanning electron microscope (SEM) observations reveal that the samples with limited distress feature
a well-maintained cement binder phase, whereas those with moderate distress feature some needle-shape precipitates embedded in the
cement binder phase and those with severe distress feature a large amount of micro-sized crystalline precipitates instead of cement binder
phase. The specific mechanism responsible for the premature failure of pervious concrete remains unclear and merits further investigation.
One hypothesis to test is that the distresses observed in pervious concrete originated from the construction practice, e.g., insufficient
compaction at some locations, and later aggravated by the exposure to freeze/thaw cycles, deicers, and mechanical loading in the service
environment.
17. Key Words
Pervious concrete; filed investigation; infiltration rate; SEM; properties;
microstructure analysis;
18. Distribution Statement
19. Security Classification (of this report)
Unclassified
20. Security Classification (of this page)
Unclassified
20. 21. No. of Pages
22. Price
N/A
Technical Report Form DOT F 1700.7 (8-72) Reproduction of completed page authorized Printed on recycled paper
ii
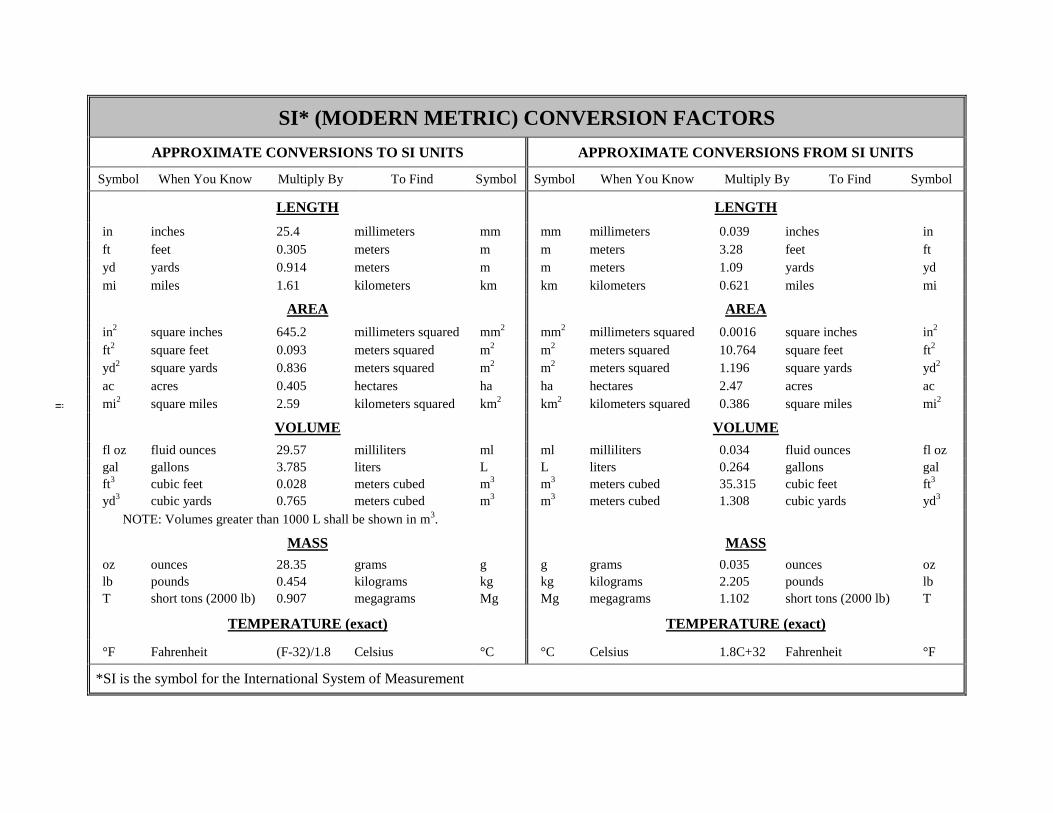
SI* (MODERN METRIC) CONVERSION FACTORS
APPROXIMATE CONVERSIONS TO SI UNITS APPROXIMATE CONVERSIONS FROM SI UNITS
Symbol When You Know Multiply By To Find Symbol Symbol When You Know Multiply By To Find Symbol
LENGTH LENGTH
in inches 25.4 millimeters mm mm millimeters 0.039 inches in
ft feet 0.305 meters m m meters 3.28 feet ft
yd yards 0.914 meters m m meters 1.09 yards yd
mi miles 1.61 kilometers km km kilometers 0.621 miles mi
AREA AREA
in2
square inches 645.2 millimeters squared mm2
mm2
millimeters squared 0.0016 square inches in2
ft2
square feet 0.093 meters squared m2
m2 meters squared 10.764 square feet ft
2
yd2
square yards 0.836 meters squared m2
m2 meters squared 1.196 square yards yd
2
ac acres 0.405 hectares ha ha hectares 2.47 acres ac
mi2
square miles 2.59 kilometers squared km2
km2 kilometers squared 0.386 square miles mi
2
VOLUME VOLUME
fl oz fluid ounces 29.57 milliliters ml ml milliliters 0.034 fluid ounces fl oz
gal gallons 3.785 liters L L liters 0.264 gallons gal
ft3
cubic feet 0.028 meters cubed m3
m3 meters cubed 35.315 cubic feet ft
3
yd3
cubic yards 0.765 meters cubed m3
m3 meters cubed 1.308 cubic yards yd
3
NOTE: Volumes greater than 1000 L shall be shown in m3.
MASS MASS
oz ounces 28.35 grams g g grams 0.035 ounces oz
lb pounds 0.454 kilograms kg kg kilograms 2.205 pounds lb
T short tons (2000 lb) 0.907 megagrams Mg Mg megagrams 1.102 short tons (2000 lb) T
TEMPERATURE (exact) TEMPERATURE (exact)
°F Fahrenheit (F-32)/1.8 Celsius °C °C Celsius 1.8C+32 Fahrenheit °F
*SI is the symbol for the International System of Measurement
3
ACKNOWLEDGMENTS
The authors acknowledge the financial support for this project provided by the Nevada Department
of Transportation (NDOT). They appreciate the guidance provided to this project by the NDOT project
manager Manjunathan Kumar and panel members Tyler J. Thew, Matthew L. Nussbaumer, Darin P.
Tedford, Kelly H. Yokotake, and Andrew E. Knust. They also acknowledge Kevin Senn and Dick Minto
of Nichols Consulting Engineers (NCE) for providing the infiltration rates and pavement distresses data
mentioned in Chapter 4 and Marie Venner of Venner Consulting and Carla Little of Western
Transportation Institute for editorial review.
DISCLAIMER
This document is disseminated under the sponsorship of the Nevada Department of Transportation and
the United States Department of Transportation in the interest of information exchange. The State of
Nevada and the United States Government assume no liability of its contents or use thereof.
The contents of this report reflect the view of the authors who are solely responsible for the facts and
accuracy of the material presented. The contents do not necessarily reflect the official views of the
Nevada Department of Transportation or the United States Department of Transportation.
The State of Nevada and the United States Government do not endorse products of manufacturers.
Trademarks or manufacturers’ names appear herein only because they are considered essential to the
object of this document.
This report does not constitute a standard, specification, or regulation.
4
Table of Contents
Chapter 1 Introduction ................................................................................................................................ 9
1.1 Problem Statement ............................................................................................................................ 9
1.2 Research objectives ......................................................................................................................... 10
1.3 Anticipated Benefits ........................................................................................................................ 10
1.4 Scope of Work and Report Organization ........................................................................................ 11
1.5 References ....................................................................................................................................... 12
Chapter 2 Methodology ............................................................................................................................ 13
2.1 Review of Previous Research .......................................................................................................... 13
2.2 Methodologies ................................................................................................................................. 14
2.2.1 Compressive Strength ............................................................................................................... 15
2.2.2 Tensile Strength ........................................................................................................................ 16
2.2.3 Density, Voids and Absorption ................................................................................................ 17
2.2.4 Abrasion Resistance ................................................................................................................. 18
2.2.5 Water Permeability ................................................................................................................... 19
2.2.6 Salt Scaling ............................................................................................................................... 21
2.2.7 Microstructure analysis............................................................................................................. 22
2.3 References ....................................................................................................................................... 22
Chapter 3 Pervious Concrete: State of the Knowledge ............................................................................. 24
3.1 Environmental Perspective .............................................................................................................. 25
3.1.1 Stormwater runoff and water quality control ........................................................................... 25
3.1.2 Waste materials applications .................................................................................................... 27
3.1.3 Heat island effects mitigation ................................................................................................... 29
3.1.4 Noise reduction ......................................................................................................................... 29
3.2 Designing and Preparation .............................................................................................................. 30
3.2.1 Mix design and preparation ...................................................................................................... 30
3.2.2 Modeling and simulation .......................................................................................................... 30
3.3 Properties Evaluation ...................................................................................................................... 31
3.3.1 Hydraulic and infiltration properties ........................................................................................ 31
5
3.3.2 Mechanical properties ............................................................................................................... 32
3.3.3 Abrasion resistance and skid resistance .................................................................................... 34
3.4 Durability and Maintenance ............................................................................................................ 34
3.4.1 Freeze-thaw in cold weather ..................................................................................................... 34
3.4.2 Clogging ................................................................................................................................... 36
3.5 Characterization .............................................................................................................................. 37
3.6 Concluding remarks and future study trends................................................................................... 41
3.7 References ....................................................................................................................................... 41
Chapter 4 Field Performance of Pervious Concrete Sections ................................................................... 52
4.1 Maintenance Activities .................................................................................................................... 55
Chapter 5 Laboratory Investigation .......................................................................................................... 56
5.1 Introduction ..................................................................................................................................... 56
5.2 Engineering Properties .................................................................................................................... 58
5.2.1 Overview of results ................................................................................................................... 58
5.2.2 Compressive strength ............................................................................................................... 58
5.2.3 Splitting tensile strength ........................................................................................................... 59
5.2.4 Abrasion resistance ................................................................................................................... 60
5.2.5 Density and air voids ................................................................................................................ 60
5.2.6 Water Permeability ................................................................................................................... 62
5.2.7 Water absorption ....................................................................................................................... 62
5.2.8 Salt scaling ................................................................................................................................ 63
5.3 Microstructure investigation ........................................................................................................... 65
5.3.1 SEM .......................................................................................................................................... 65
5.3.2 µCT ........................................................................................................................................... 75
5.5 Key findings .................................................................................................................................... 77
5.6 References ....................................................................................................................................... 78
Chapter 6 Conclusions .............................................................................................................................. 80

6
List of Figures
Fig. 2. 1 Samples for compressive strength test........................................................................................ 16
Fig. 2. 2 Samples for splitting tensile strength test ................................................................................... 17
Fig. 2. 3 Water permeability testing preparation ...................................................................................... 20
Fig. 2. 4 Water permeability testing apparatus ......................................................................................... 20
Fig. 2. 5 Images of the salt scaling testing process ................................................................................... 21
Fig. 3. 1 Schematic demonstration of the main advantages of pervious concrete pavements .................. 24
Fig. 3. 2 Pervious concrete considerations................................................................................................ 25
Fig. 3. 3 X-ray 2D and 3D flash CT images of pervious concrete materials (Kayhanian 2012) .............. 38
Fig. 3. 4 Images of typical pervious concrete samples. (a) Limestone with no air entraining agent, (b)
Limestone with double synthetic air entraining agent, (c) Area A in (a). (d) Area B in (b). (Kevern,
2008d) ............................................................................................................................................... 38
Fig. 3. 5 Two-dimensional images of planar sections from pervious concrete mixture proportions with
(a) 2.36 mm, (b) 4.75 mm, and (c) 9.5mm maximum size aggregates (Neithalath 2010a and
2010b) ............................................................................................................................................... 39
Fig. 3. 6 Steps involved in 3D reconstruction and permeability prediction ............................................. 40
Fig. 3. 7 The morphologies of pervious concrete demonstrating the cracks propagation and the ITZ
areas (Vancura 2011a). ..................................................................................................................... 40
Fig. 5. 1 Average compressive strength (ASTM C39) of the samples cored from SR28 and SR431 with
error bars showing ± one standard deviation .................................................................................... 59
Fig. 5. 2 Splitting tensile strength of the samples cored from SR28 and SR431 ...................................... 59
Fig. 5. 3 Abrasion resistance of the samples cored from SR28 and SR431 ............................................. 60
Fig. 5. 4 Density of the samples cored from SR28 and SR431 ................................................................ 61
Fig. 5. 5 Void content of the samples cored from SR28 and SR431 ........................................................ 61
7
Fig. 5. 6 Hydraulic conductivity of the samples cored from SR28 and SR431 ........................................ 62
Fig. 5. 7 Water absorption of the samples cored from SR28 and SR431 ................................................. 63
Fig. 5. 8 External dimension of the samples from SR28 and SR431, after experiencing 7 freeze/thaw
cycles in 3% sodium solution. .......................................................................................................... 64
Fig. 5. 9 Mass loss of the samples harvested from site SR28 and site SR431 as a function of
freeze/thaw cycles in a 3% sodium chloride solution ....................................................................... 65
Fig. 5. 10 Low magnification fracture surface SEM morphologies of the samples cored from SR431
site a) limited, b) moderate, and c) severe. ....................................................................................... 67
Fig. 5. 11 High magnification fracture surface SEM morphologies of the samples cored from SR431
site a) limited, b) moderate, and c) severe. ....................................................................................... 69
Fig. 5. 12 High magnification fracture surface SEM morphologies of the samples cored from SR431
site, a) moderate, and b) severe. ........................................................................................................ 70
Fig. 5. 13 Low magnification fracture surface SEM morphologies of the samples cored from SR28 site,
a) limited, b) moderate, and c) severe ............................................................................................... 72
Fig. 5. 14 High magnification fracture surface SEM morphologies of the samples cored from site
SR28, a) limited, b) moderate, and c) severe .................................................................................... 74
Fig. 5. 15 High magnification fracture surface SEM morphologies of the samples cored from site
SR28, a) moderate, and b) severe ..................................................................................................... 75
Fig. 5. 16 Typical µCT images of the sample cored from SR28 .............................................................. 76
Fig. 5. 17 Typical µCT images of the sample cored from SR431 ............................................................ 76

8
List of Tables
Table 2. 1 Mixture proportions of the pervious concrete in this work 14
Table 2. 2 The testing results and the NDOT specifications of the aggregates 15
Table 4. 1 The properties of the freshly mixed pervious concrete .................................................... 53
Table 4. 2 Infiltration field testing results ......................................................................................... 54
Table 5. 1 Location of cores within each test site ............................................................................. 57
Table 5. 2 Summary of Durability, Strength and Hydraulic Performance ........................................ 58
Table 5. 3 Porosity tested from 3D µCT of the samples cored from SR28 and SR431 .................... 77
9
Chapter 1 Introduction
1.1 Problem Statement
Pervious concrete has been increasingly used as a powerful tool to mitigate watershed impacts due
to stormwater runoff. It also has positive effects on urban heat island mitigation and ground water
purification. Pervious concrete pavements have an open network of pores to allow infiltration through
the pavement with a subsequent reduction in the quantity of stormwater runoff and an improvement in
water quality (total suspended solids, total phosphorous, total nitrogen, and metals (McCain, 2010)).
This is achieved via mechanical and biological mechanisms. A typical pervious concrete mix design
used in the U.S. consists of cement, single-sized coarse aggregate (between 1″ and the No. 4 sieve), and
a water/cement ratio between 0.27 and 0.43. The various mixes can feature a wide range of properties,
e.g., effective air voids of 14 to 31%, permeability of 35–800 in/hr, and compressive strength of 800-
3,000 psi (Schaefer, 2006).
However, there are some issues of concern which must be addressed when using pervious concrete.
Proper mixing and installation is necessary to ensure appropriate in-place material characteristics. Large
void spaces in pervious concrete significantly affect the mechanical properties of the material; as a
result, it is important to maintain a proper balance between infiltration capacity and the mechanical
properties of the materials. Furthermore, winter road maintenance can have a large influence on the
longevity and effectiveness of a pervious concrete installation. Heavy metal mobilization by deicers and
sedimentation of abrasives can lead to expensive maintenance or stormwater management issues.
Seasonal freeze-thaw cycling due to deicer use can also pose a significant risk to pervious concrete
durability. In addition, clogging can reduce the effectiveness of pervious concrete and special
maintenance techniques are generally needed to restore performance, such as sweeping and/or
vacuuming. Clogging can occur due to a variety of actions, including traction sand applied during winter
storms, sediments in stormwater from adjacent land that intersects the roadway configuration, and
collapsed pores from vehicle traffic (McCain, 2010).
The Nevada Department of Transportation (NDOT) needs effective tools to meet recently enacted
federal (EPA) regulations for reducing the amount of fine sediment generated from NDOT right-of-way
within the Lake Tahoe basin. Infiltration is the most effective method of reducing fine sediment. In place
of impervious surfaces, pervious concrete pavement reduces runoff and distributes infiltration. In the
summer of 2012, NDOT began constructing a pervious concrete pavement near Lake Tahoe.
Specifications for this installation included a 7″ thick pervious concrete pavement surface over an 8″
thick aggregate drainage layer and 6″ thick geotextile-encapsulated sand bed. This project provided an
opportunity to conduct laboratory tests and monitor field sites, so that NDOT could learn from these
applications and implement pervious concrete effectively in other areas. This project encompassed a

10
case study of two pervious concrete installations at SR 431 and SR 28. The studies included pre- and
post-construction QA testing.
The research was part of an effort to identify tools that would help NDOT comply with state and
federal regulations to reduce the fine sediment load from State roadways. In addition, research was
needed to ensure pervious concrete installed by NDOT will be durable and effective under their normal
winter maintenance operations.
1.2 Research objectives
The research objectives of this study were to assess the efficacy of pervious concrete in areas
subject to snow plow operations and abrasive and salt application, in terms of managing quantity and
quality of stormwater runoff. It investigated the durability and performance of pervious concrete (e.g.,
in void content, strength and hydraulic conductivity). To this end, the research team documented the
laboratory and field performance of two pervious concrete pavement sections near Lake Tahoe in an
effort to better understand the functionality and durability of such assets.
Performance and durability aspects of pervious concrete pavement are unique for different mixes.
This project provided an opportunity to analyze NDOT installations of pervious concrete pavement to
ensure acceptable performance. The laboratory testing simulated many years of field service and
provided indications of performance and durability without waiting for the results from the field
installations. It leveraged existing research to address a key knowledge gap for deploying pervious
concrete pavements in cold regions where unique challenges exist.
1.3 Anticipated Benefits
This work is expected to produce substantial benefits for NDOT, county and city stakeholders, as well
as agencies with similar climate, by understanding the efficacy and appropriateness of pervious concrete
pavement, a Low Impact Development (LID) technology. Upon successful achievement of the project
objective, a number of benefits can be expected:
1) Pervious concrete enables the use of space that is already part of the highway system for stormwater
runoff control, thus reducing the need for additional land. Reducing the amount of impervious surfaces
may reduce or prevent the need for other stormwater management infrastructure (e.g., ponds, wetlands,
and vegetated swales and filter strips), by decreasing the volume, flow rate and contaminant loading in
stormwater runoff. Other potential benefits include: reducing heat-island effect and pavement noise;
reducing road salt application; reducing hydroplaning, glaring or other safety hazards due to water on
pavements; and minimizing impact to the local ecosystem.
2) This research will likely facilitate the shift from impermeable pavement surfaces to permeable
surfaces and promote the integration of eco-friendly pervious concrete design and construction into
highways, parking lots, sidewalks, local roads, etc.

11
3) At this stage, the cost of implementation and ongoing operations and maintenance of pervious
concrete pavement in Nevada is yet to be determined. However, relative to impervious concrete,
pervious concrete pavement is anticipated to have similar cost, but larger savings in terms of increased
pavement safety and mobility, improved level of service, and improved environmental stewardship.
These benefits will be realized once pervious concrete pavement makes the transition from the First
Application (Contract) Field Pilot Stage to the Specification & Standards with Full Corporate
Deployment Stage and becomes widely adapted by NDOT for highway areas where stormwater runoff is
a significant concern.
1.4 Scope of Work and Report Organization
To accomplish the proposed objectives, this work was designed to include multiple tasks as
follows: (1) a comprehensive literature review to summarize the research of the current pervious
concrete constructions, including the construction and maintenance methods, property testing and
evaluation approaches, and unsolved problems; (2) a systematic laboratory investigation of the
performance, including the compressive and splitting tensile strengths, abrasion resistance, air voids
and water permeability, and freeze/thaw resistance in sodium chloride solution of the field pervious
concrete samples; (3) microstructure analysis of these cored samples to elucidate the potential
deterioration mechanisms. The following chapters present the NDOT case study on the pervious
concrete pavement.
Chapter 2 will outline the methodology of the research conducted, specific to both laboratory
testing and field investigations. It will describe the mechanic and forensic testing procedures and the
standard methods by which they were conducted. It will also describe the in-situ evaluation performed
on site. Chapter 3 will consist of a comprehensive assessment of the available literature pertaining to
pervious concrete construction and its implementation, as well as an assessment of what research
remains to be conducted in order to make accurate and informed decisions when choosing whether and
how to integrate pervious concrete into a construction project. In chapter 4, a summary of the field
investigations conducted by the Nevada Department of Transportation and Nichols Consulting
Engineers will be presented. This will include a location report detailing the characteristics of the site
and the results from the onsite performance evaluation. Chapter 5 will present the results of the
laboratory investigation with respect to the mechanical properties and forensic assessment of pervious
concrete samples from the two sites. An interpretation of those results will also be provided in order to
create a more comprehensive view of what is happening in the field. Finally, a concluding summary
will highlight the research findings in Chapter 6. Recommendations for the future implementation of
pervious concrete under these conditions will be provided based on a comprehensive assessment of all
the preceding information.
12
1.5 References
McCain, G.N., M.J. Suozzo, M.M. Dewoolkar. 2010. A Laboratory Study on the Effects of Winter
Surface Applications on the Hydraulic Conductivity of Porous Concrete Pavements. Transportation
Research Board 2010 Annual Meeting CD-ROM.
Schaefer, V.R., K. Wang, M.T. Suleiman, and J.T. Kavern. 2006. Mix Design Development for Pervious
Concrete in Cold Weather Climates. Iowa DOT Final Report No. 2006–01.

13
Chapter 2 Methodology
2.1 Review of Previous Research
Prior to conducting testing, the research team reviewed and summarized existing knowledge related
to laboratory testing of pervious concrete.
Permeability tests are frequently conducted in the laboratory on pervious concrete samples. While
not yet standardized by ASTM or AASHTO, the most common type of laboratory test is a falling head
permeability test (McCain, 2010; Huang, 2010; Rizvi, 2010; Schaefer, 2006). In this type of test, a
sample is sealed on the sides; the researcher then records the amount of time for water applied to the
surface of the sample to drop in height. The time and beginning and ending pressure head are used to
compute hydraulic conductivity. Two options for testing the infiltration rate in the field include ASTM
C1701, or a method developed and refined over several years by Minnesota DOT personnel (personal
communication with Bernard Izevbekhai, MnDOT).
A demonstration project in Yakima, WA (Yakima County website) compared water samples
collected from sample vaults in pervious concrete pavement and impervious (traditional) asphalt
pavement. The pervious concrete water samples had significantly lower biochemical oxygen demand
(2.5 vs. 11 mg/l), total suspended solids (25 vs. 320 mg/l), copper (8 vs. 20 μg/l), lead (0 vs. 20 μg/l),
zinc (0 vs. 160 μg/l), #2 Diesel (0.4 vs. 1.4 mg/l), and motor oil (0.5 vs. 2.3 mg/l). Other examples of
improvements to water quality are documented (McCain, 2010; and Brown-presentation online).
Pervious concrete pavements are reported to have improved skid resistance (McCain, 2010; and
Izevbekhei, 2008), although little supporting data was found in a cursory search of literature. Tests in a
Pennsylvania parking lot with pervious concrete using a British pendulum tester (ASTM E303) showed
pervious concrete had similar skid resistance to traditional asphalt and porous asphalt (Houle, 2008).
The abrasion resistance of pervious concrete can be easily measured following ASTM C1747 using
a Los Angeles abrasion machine with parameters specifically developed for pervious concrete. Wu et al.
found adding styrene butadiene rubber (SBR) latex polymer to pervious concrete mixes significantly
improved abrasion resistance, and although it decreased, had adequate permeability (Wu, 2010).
Schaefer et al. (Schaefer, 2006) found saturated freeze-thaw performance (using ASTM C666)
could be improved by several different changes to the mix design: using a small amount of fine
aggregate (sand), adding polypropylene fibers, using a slightly higher water/cement ratio, increasing
compaction (lower porosity), including entrained air and increasing paste volume, replacing some
Portland cement with fly ash or silica fume, or using a latex admixture (Kevern, 2008). Yang (2011) also
found silica fume, polypropylene fibers, and/or increased cement content improved saturated freeze–
thaw durability, particularly for water-cured specimens. Unclogged, unsaturated pervious concrete
specimens tested for freeze–thaw resistance with ASTM C666 had significantly greater durability than
14
either clogged and/or saturated specimens, with no significant differences in structural properties
(Guthrie, 2010).
McCain et al. in Vermont found during a laboratory study that a large application of a sand-salt 2:1
(by weight) mixture at 0.24 lb/ft2 (equivalent to 15,200 lb/lane-mile) reduced the hydraulic conductivity
of laboratory-mixed pervious concrete specimens by about 15 percent. Adding sand to the surface and
shaking the samples simulated maximum clogging and reduced the hydraulic conductivity by about 35
percent. Vacuuming the samples restored the hydraulic conductivity to about 90 percent of their initial
values (McCain, 2010).
2.2 Methodologies
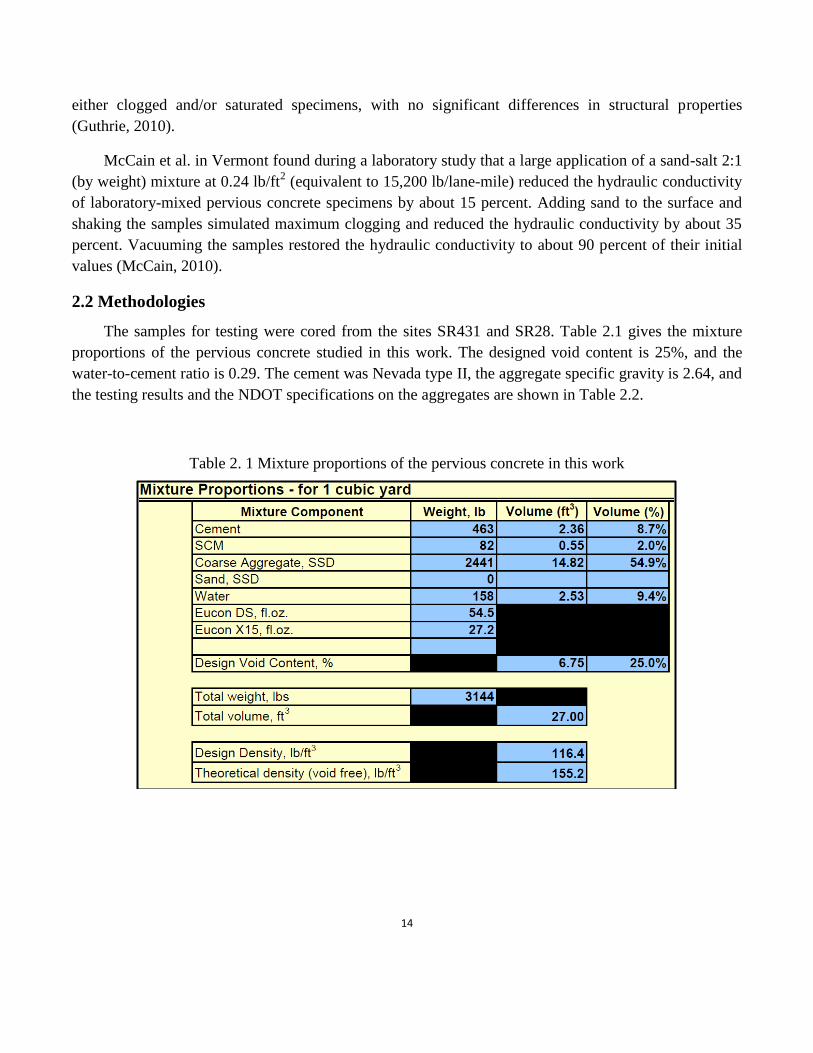
The samples for testing were cored from the sites SR431 and SR28. Table 2.1 gives the mixture
proportions of the pervious concrete studied in this work. The designed void content is 25%, and the
water-to-cement ratio is 0.29. The cement was Nevada type II, the aggregate specific gravity is 2.64, and
the testing results and the NDOT specifications on the aggregates are shown in Table 2.2.
Table 2. 1 Mixture proportions of the pervious concrete in this work

15
Table 2. 2 The testing results and the NDOT specifications of the aggregates
2.2.1 Compressive Strength
Compressive strength performance was assessed based on the testing standard ASTM C39, adapted
as follows given that an official standard has not been established for pervious concrete. Cores were cut
to a height of eight inches for a diameter to height ratio of 0.5 and left to dry for 24 hours.
In order to ensure flat, parallel surfaces on the top and bottom of the sample, the cores were capped
with cement in accordance with the recommended standard ASTM C617. The water to cement ratio of
the neat cement paste was 0.3. A small quantity of water reducer was added such that the mixture was
1% reducer by mass. Using this cement mixture, a flat end of the core sample was pushed into the
cement such that the full sample surface was covered by approximately 4 mm of cement. Excess cement
paste was removed to avoid the cement capping extending beyond the circumference of the core. A set
of levels was used to ensure that the cap surface was perpendicular to the axis of the cylindrical sample.
The cement was left to harden for 6 hours before repeating the process for the opposite end of the
sample.
Once the cement caps had dried completely, six measurements were recorded for the height of each
sample. The cores were then compressed vertically at a rate of 440 lbs/s until failure. The maximum
force applied to reach failure was recorded for each sample. Fig. 2.1 shows the images of the samples
for compressive strength testing.
16
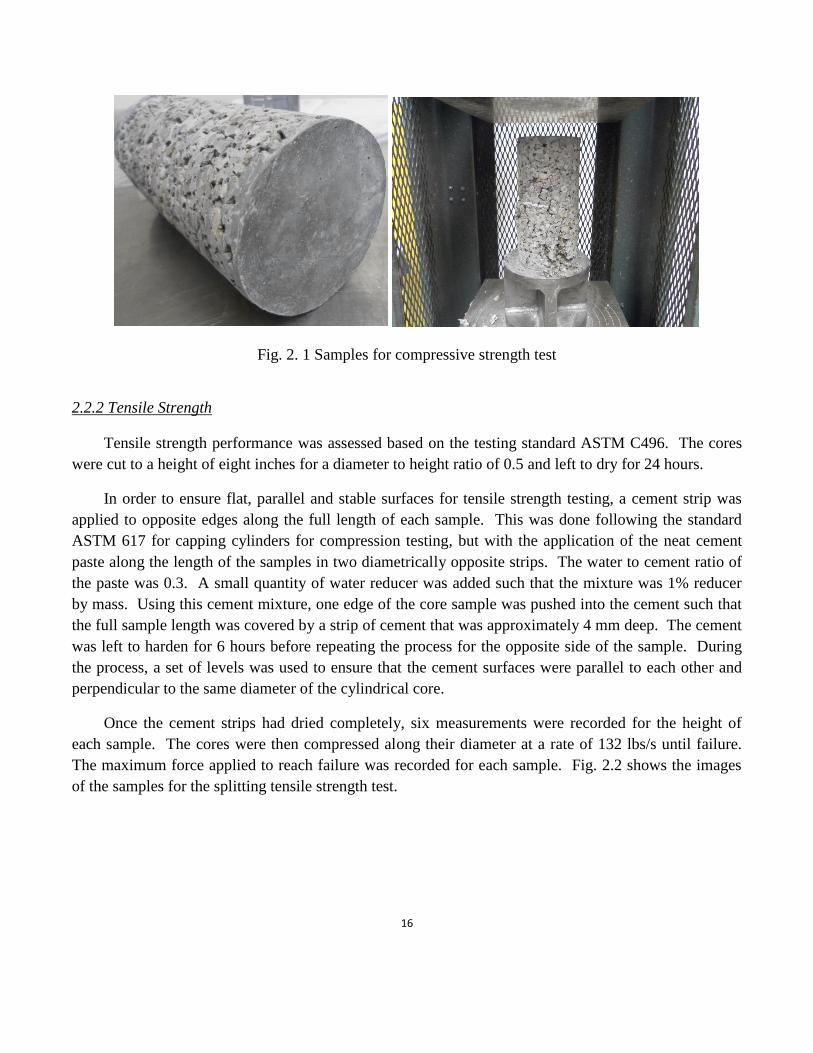
Fig. 2. 1 Samples for compressive strength test
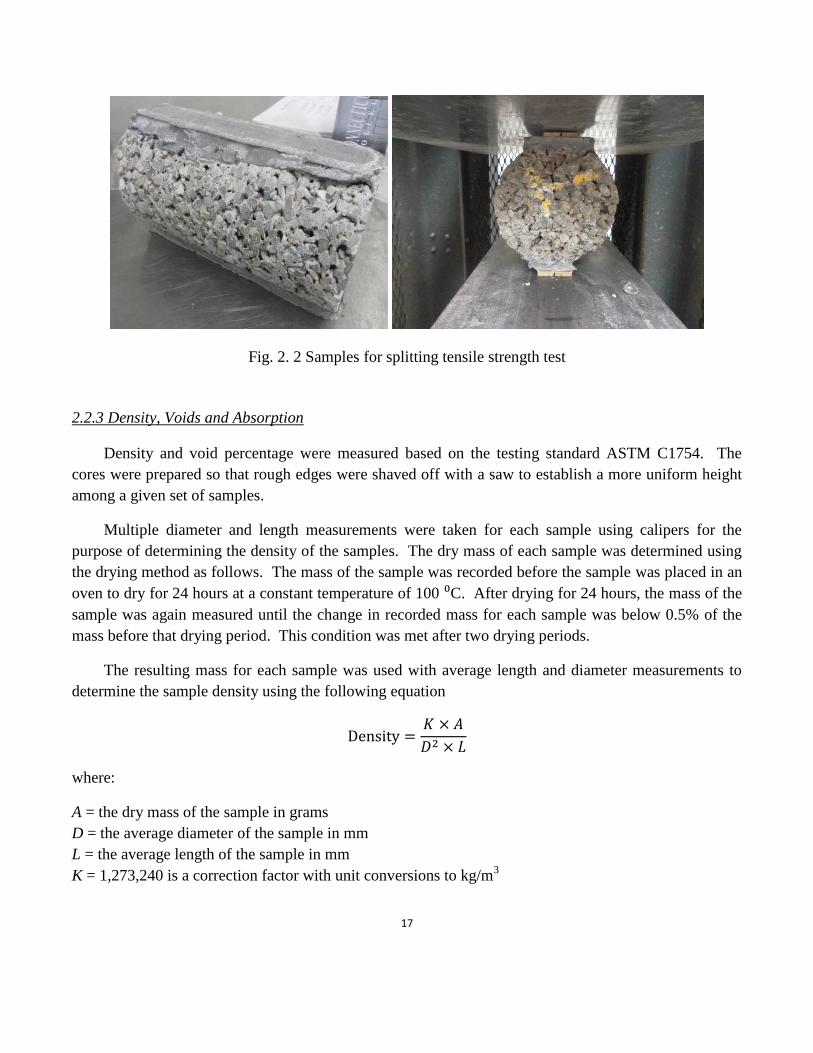
2.2.2 Tensile Strength
Tensile strength performance was assessed based on the testing standard ASTM C496. The cores
were cut to a height of eight inches for a diameter to height ratio of 0.5 and left to dry for 24 hours.
In order to ensure flat, parallel and stable surfaces for tensile strength testing, a cement strip was
applied to opposite edges along the full length of each sample. This was done following the standard
ASTM 617 for capping cylinders for compression testing, but with the application of the neat cement
paste along the length of the samples in two diametrically opposite strips. The water to cement ratio of
the paste was 0.3. A small quantity of water reducer was added such that the mixture was 1% reducer
by mass. Using this cement mixture, one edge of the core sample was pushed into the cement such that
the full sample length was covered by a strip of cement that was approximately 4 mm deep. The cement
was left to harden for 6 hours before repeating the process for the opposite side of the sample. During
the process, a set of levels was used to ensure that the cement surfaces were parallel to each other and
perpendicular to the same diameter of the cylindrical core.
Once the cement strips had dried completely, six measurements were recorded for the height of
each sample. The cores were then compressed along their diameter at a rate of 132 lbs/s until failure.
The maximum force applied to reach failure was recorded for each sample. Fig. 2.2 shows the images
of the samples for the splitting tensile strength test.
17
Fig. 2. 2 Samples for splitting tensile strength test
2.2.3 Density, Voids and Absorption
Density and void percentage were measured based on the testing standard ASTM C1754. The
cores were prepared so that rough edges were shaved off with a saw to establish a more uniform height
among a given set of samples.
Multiple diameter and length measurements were taken for each sample using calipers for the
purpose of determining the density of the samples. The dry mass of each sample was determined using
the drying method as follows. The mass of the sample was recorded before the sample was placed in an
oven to dry for 24 hours at a constant temperature of 100 ⁰C. After drying for 24 hours, the mass of the
sample was again measured until the change in recorded mass for each sample was below 0.5% of the
mass before that drying period. This condition was met after two drying periods.
The resulting mass for each sample was used with average length and diameter measurements to
determine the sample density using the following equation
where:
A = the dry mass of the sample in grams
D = the average diameter of the sample in mm
L = the average length of the sample in mm
K = 1,273,240 is a correction factor with unit conversions to kg/m3
18
The submerged mass of each sample was then determined by placing a water bath on a scale with a
sample suspended in the bath. The sample was suspended by resting a wooden dowel across the rim of
the bath and tying a string from the dowel to the center of the core. After leaving each sample in the
water bath for 30 minutes, the sample was struck with a rubber mallet to dislodge any air bubbles
remaining within the sample. Then the submerged mass and temperature of the water bath were
recorded. The void content, as a percentage, was calculated using the following equation
[ ( ( )
)]
where:
B = the submerged mass of the sample in grams
ρw = the density of water at the measured temperature of the water bath.
Water absorption was measured based on the testing standard ASTM C642. The dry mass of each
sample was recorded and the sample was submerged in water for 24 hours. The sample was then
removed from the water, allowed to drain, and patted dry on the exposed surfaces. The mass of the
sample was measured again before it was placed in the water for another 24 hour period. This was
repeated until the change in mass of the sample was less than 0.5% of the previous period. The water
absorption was then calculated using the following formula
( ) ( )
where:
A = the initial, dry mass of the sample
B = the final mass of the sample after immersion.
2.2.4 Abrasion Resistance
Resistance to abrasion was evaluated based on the testing standard ASTM C1747. Each sample
was cut to 4 inches in height and air dried for 36 hours. After drying, the sample masses were each
measured and recorded.
Three samples corresponding to the same location group SR28 were placed in a Los Angeles
Abrasion Testing Machine set to 500 revolutions at 30 revolutions per minute. All the resulting material
was sifted through a 1 inch sieve and the material retained was recorded. The same process was then
repeated for three samples from location SR431.

19
2.2.5 Water Permeability
An established standard does not currently exist in order to best determine the permeability of
water in pervious concrete. However, previous research has had success adapting a falling head
permeameter to measure the infiltration rate of water through pervious concrete samples. The testing
method used here follows that used during previous research (McCain, 2010; Rizvi, 2010; and Schaefer,
2006).
A falling head test was performed on each of three samples from each sample location. Test
samples were cut to 4 inches in height. The samples were sealed with silicone along the full height of
the cylinder so that only the top and bottom faces of the sample were free to pass water though them.
A standpipe apparatus was fashioned from 4 inch nominal diameter PVC pipe. The standpipe
design was modeled after that used by Schaefer (2006). Three pieces of pipe were cut for each
standpipe: one piece 20 inches in length as the top standpipe tube and two pieces 4 inches in length.
One of the 4 inch pieces was used as the bottom drainage reservoir. The other 4 inch piece housed the
sample.
A 1.25 inch diameter hole was drilled in the bottom PVC piece as an outlet for the water. A thin
plastic plate was attached to the bottom of the pipe with watertight silicone sealer. A second square
plastic plate was fashioned with a 4 inch diameter hole in the center. Four holes were also drilled in the
second plate, one in each of the outer quadrants of the plate. The second plate was then attached to the
top of the bottom PVC piece so that the 4 inch hole matched that of the pipe.
The top PVC piece had a small hole drilled in it near the bottom. A small, clear plastic tube used to
measure the water level inside the standpipe was inserted into this hole and attached, straight and
vertical, to the outside of the standpipe. Intervals of one inch were then marked along the clear tube by
measuring upwards from the bottom of the PVC piece to a height of 15 inches. A plastic plate identical
to the plate fashioned for the top of the first 4 inch pipe was crafted and attached to the bottom of the top
PVC piece.
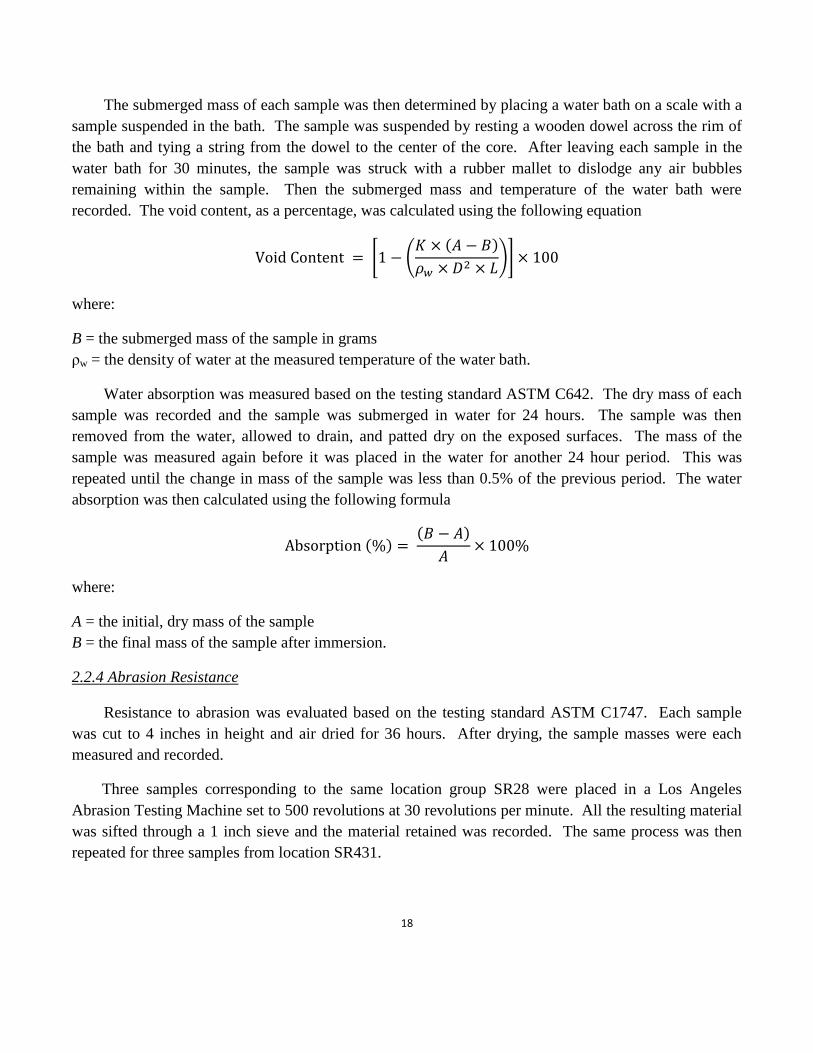
The second 4 inch pipe was cut from top to bottom along a single length of the pipe to allow
enough flexibility to insert the pervious concrete sample. After inserting the sample, the vertical
opening of the pipe and the pipe-sample boundaries at the top and bottom were sealed with silicone. Fig.
2.3 shows the images of the water permeability testing preparation before testing.
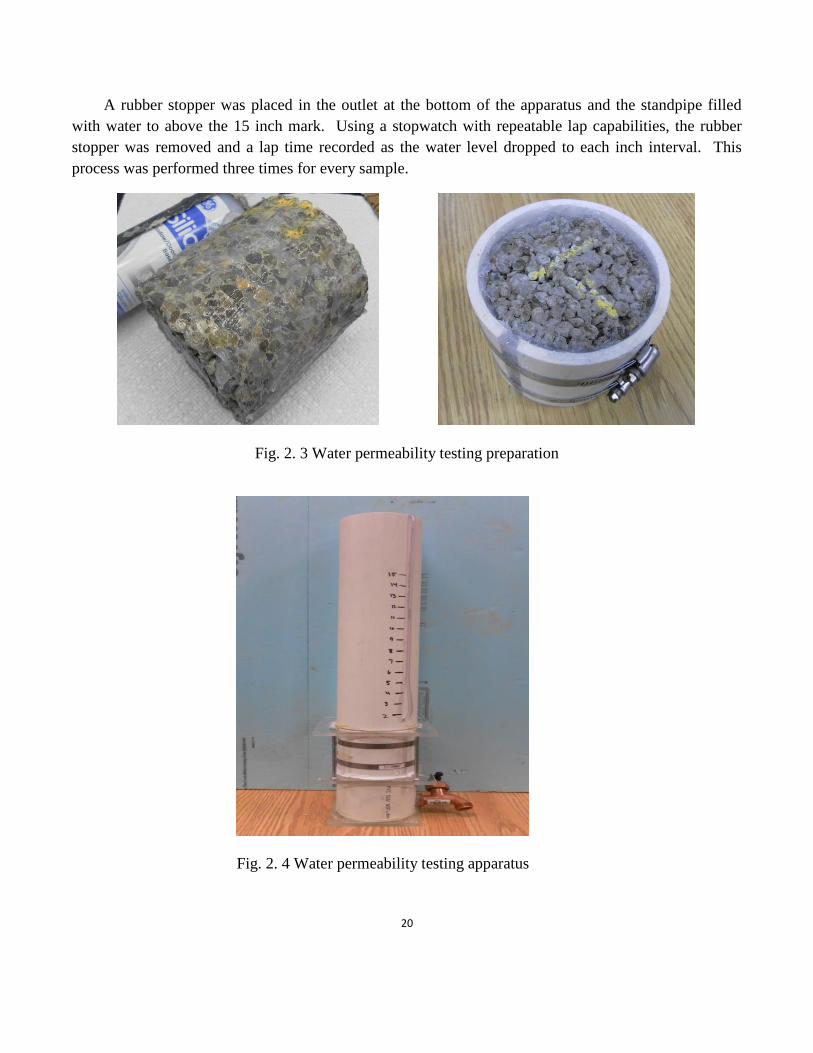
The sample was then placed between the top and bottom portions of the standpipe apparatus with
circular rubber spacers between. A nut and bolt was used for each of the four holes in the plastic plates.
The boundaries between the top and bottom of the sample and its respective portion of the apparatus
were sealed with silicone. Fig. 2.4 shows the water permeability testing apparatus.
20
A rubber stopper was placed in the outlet at the bottom of the apparatus and the standpipe filled
with water to above the 15 inch mark. Using a stopwatch with repeatable lap capabilities, the rubber
stopper was removed and a lap time recorded as the water level dropped to each inch interval. This
process was performed three times for every sample.
Fig. 2. 3 Water permeability testing preparation
Fig. 2. 4 Water permeability testing apparatus
21
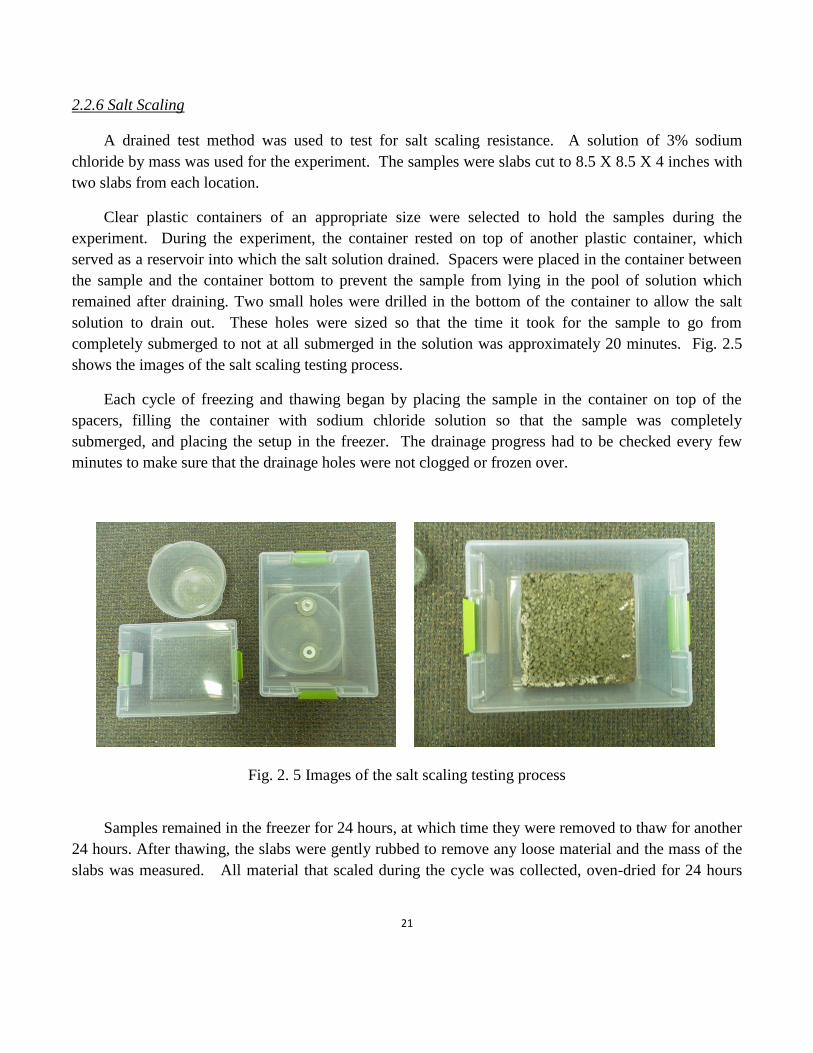
2.2.6 Salt Scaling
A drained test method was used to test for salt scaling resistance. A solution of 3% sodium
chloride by mass was used for the experiment. The samples were slabs cut to 8.5 X 8.5 X 4 inches with
two slabs from each location.
Clear plastic containers of an appropriate size were selected to hold the samples during the
experiment. During the experiment, the container rested on top of another plastic container, which
served as a reservoir into which the salt solution drained. Spacers were placed in the container between
the sample and the container bottom to prevent the sample from lying in the pool of solution which
remained after draining. Two small holes were drilled in the bottom of the container to allow the salt
solution to drain out. These holes were sized so that the time it took for the sample to go from
completely submerged to not at all submerged in the solution was approximately 20 minutes. Fig. 2.5
shows the images of the salt scaling testing process.
Each cycle of freezing and thawing began by placing the sample in the container on top of the
spacers, filling the container with sodium chloride solution so that the sample was completely
submerged, and placing the setup in the freezer. The drainage progress had to be checked every few
minutes to make sure that the drainage holes were not clogged or frozen over.
Fig. 2. 5 Images of the salt scaling testing process
Samples remained in the freezer for 24 hours, at which time they were removed to thaw for another
24 hours. After thawing, the slabs were gently rubbed to remove any loose material and the mass of the
slabs was measured. All material that scaled during the cycle was collected, oven-dried for 24 hours
22
and measured for mass. The process was repeated for seven cycles, at which time severe scaling
dictated the originally planned length of ten cycles be cut short.
2.2.7 Microstructure analysis
The low and high magnification fracture surfaces of the samples cored from sites SR431 and SR28,
which were both divided as limited, moderate, and severe, respectively, were observed by scanning
electron microscope (SEM) and X-ray tomography (CT). SEM was conducted under an accelerating
voltage of typically 20 kV. The resolution of the CT analysis is 10 m.
2.3 References
ASTM. 2012. Standard Test Method for Compressive Strength of Cylindrical Concrete Specimens.
ASTM standard C39/C39M. American Society for Testing Materials, West Conshohocken, PA.
ASTM. 2011. Standard Test Method for Splitting Tensile Strength of Cylindrical Concrete Specimens.
ASTM standard C496/C496M. American Society for Testing Materials, West Conshohocken, PA.
ASTM. 2012. Standard Practice for Capping Cylindrical Concrete Specimens. ASTM standard
C617/C617M. American Society for Testing Materials, West Conshohocken, PA.
ASTM. 2006. Standard Test Method for Density, Absorption and Voids in Hardened Concrete. ASTM
standard C642. American Society for Testing Materials, West Conshohocken, PA.
ASTM. 2012. Standard Test Method for Scaling Resistance of Concrete Surfaces Exposed to Deicing
Chemicals. ASTM standard C672/C672M. American Society for Testing Materials, West
Conshohocken, PA.
ASTM. 2011. Standard Test Method for Determining Potential Resistance to Degradation of Pervious
Concrete by Impact and Abrasion. ASTM standard C1747/C1747M. American Society for Testing
Materials, West Conshohocken, PA.
ASTM. 2012. Standard Test Method for Density and Void Content of Hardened Pervious Concrete.
ASTM standard C1754/C1754M. American Society for Testing Materials, West Conshohocken, PA.
Brown, H.J. “Monitoring Pervious Concrete for Water Quality in a Laboratory and Field Environment”
Presentation, online, http://www.rmc-
foundation.org/images/PCRC%20Files/Hydrological%20&%20Environmental%20Design/Monitoring%
20Pervious%20Concrete%20for%20Water%20Quality%20in%20a%20Laboratory%20and%20Field%2
0Environment.pdf

23
Guthrie, W.S., C.B. DeMille, D.L. Eggett. 2010. “Effects of Soil Clogging and Water Saturation on
Freeze–Thaw Durability of Pervious Concrete” Transportation Research Board 2010 Annual Meeting
CD-ROM.
Houle, K.M. 2008. Winter Performance Assessment of Permeable Pavements: A comparative study of
porous asphalt, pervious concrete, and conventional asphalt in a northern climate. M.S. Thesis,
University of New Hampshire.
Huang, B., H. Wu, X. Shu, and E.G. Burdette. 2010. “Laboratory Evaluation of Permeability and
Strength of Polymer-Modified Pervious Concrete” Constr. and Build. Mat., 24(5), 818–823.
Izevbekhei, B. 2008. “Pervious Concrete” TERRA Fact Sheet, November 2008.
Kevern J.T., Wang K., and Schaefer V.R. 2008. “Pervious Concrete in Severe Exposures” Concrete
International, 30(7), July, 43–49.
McCain, G.N., M.J. Suozzo, M.M. Dewoolkar. 2010. “A Laboratory Study on the Effects of Winter
Surface Applications on the Hydraulic Conductivity of Porous Concrete Pavements” Transportation
Research Board 2010 Annual Meeting CD-ROM.
Rizvi, R., S. Tighe, V. Henderson, J. Norris. 2010 “Evaluating the Use of Recycled Concrete Aggregate
in Pervious Concrete Pavement” Transportation Research Record No. 2164, 132-140.
Schaefer, V.R., K. Wang, M.T. Suleiman, and J.T. Kavern. 2006. Mix Design Development for Pervious
Concrete in Cold Weather Climates. Iowa DOT Final Report No. 2006–01.
Wu, H., B. Huang, X. Shu, Q. Dong, E. Shrum, D. Jared, and P. Wu. 2010. “Laboratory Evaluation of
Latex-Modified Pervious Concrete” Transportation Research Board 2010 Annual Meeting CD-ROM.
Yakima County website, Regional Stormwater Management Program, Project: Low Impact
Development Demonstration Project, http://www.yakimacounty.us/stormwater/LID/project.htm.
Yang, Z. 2011. “Freezing-and-Thawing Durability of Pervious Concrete under Simulated Field
Conditions” ACI Materials Journal, 108(2), March-April, 187–195.
24
Chapter 3 Pervious Concrete: State of the Knowledge
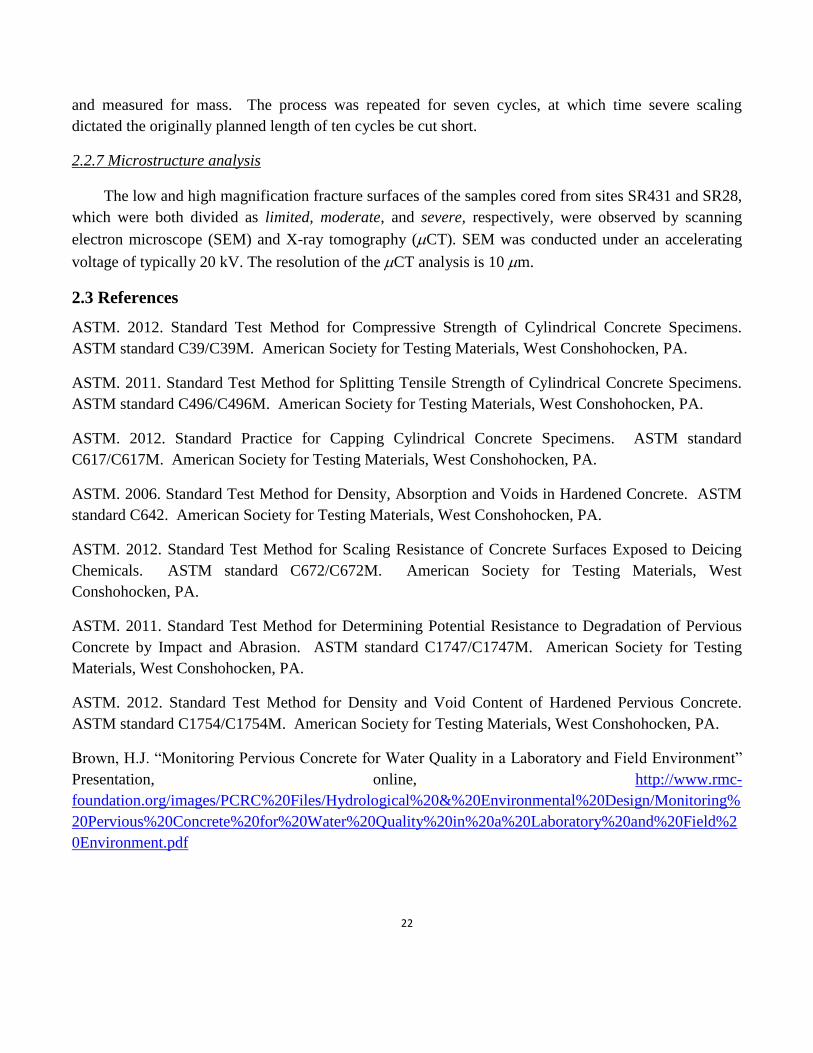
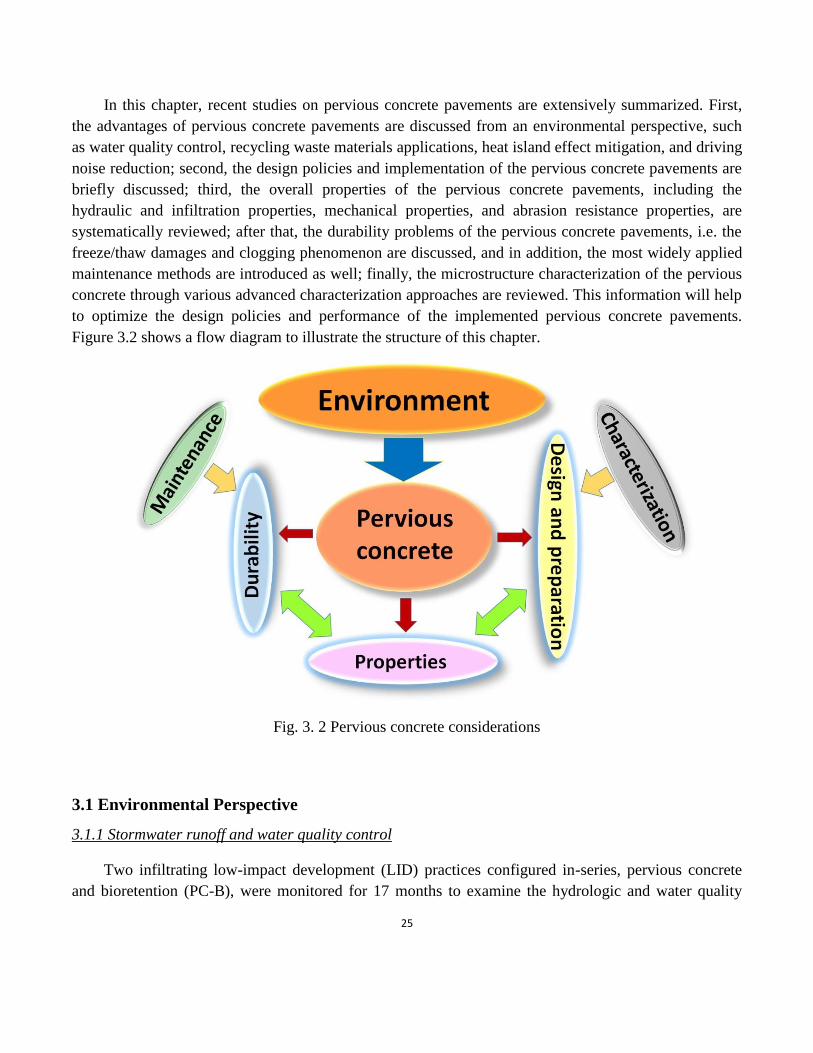
Pervious concrete has been increasingly used as a powerful tool to mitigate negative impact on the
environment (Tennis, 2004; Offenberg 2005; Scholz, 2007; Joung 2008; Volder, 2009; Schaefer, 2011).
It has many advantages to urban cities, including stormwater runoff management, traffic noise control,
groundwater recharge, and mitigation of the urban heat island (Cackler, 2006; Wanielista, 2007; Lee,
2009; Schwartz, 2010; Garber, 2011; Haselbach, 2011; Ullate, 2011, Li, 2014). Figure 3.1 illustrates
some of the main advantages of a pervious concrete pavement.
Pervious concrete pavements have an open network of pores to allow infiltration through the
pavement with a subsequent reduction in the quantity of stormwater runoff and an improvement in water
quality with respect to total suspended solids, phosphorous, nitrogen, and metals (McCain, 2010). This
is achieved via mechanical and biological mechanisms. Specifications for a pervious concrete pavement
constructed near Lake Tahoe in the summer of 2012 included a 7″ thick pervious concrete pavement
surface over an 8″ thick aggregate drainage layer and 6″ thick geotextile-encapsulated sand bed. A
typical pervious concrete mix design used in the U.S. consists of cement, single-sized coarse aggregate
(between 1″ and the No. 4 sieve), and a water to cement ratio (W/C) between 0.27 and 0.43. The various
mixes can feature a wide range of properties, e.g., effective air voids of 14 to 31%, permeability of 35-
800 in/hr, and compressive strength of 800-3,000 psi (Schaefer, 2006). Clogging can reduce the
effectiveness of pervious concrete, and special maintenance techniques are generally needed to restore
performance, such as sweeping and/or vacuuming. Clogging can occur due to a variety of actions,
including traction sand applied during winter storms, sediments in stormwater from adjacent land that
intersects the roadway configuration, and collapsed pores from vehicle traffic (McCain, 2010).
Fig. 3. 1 Schematic demonstration of the main advantages of pervious concrete pavements
25
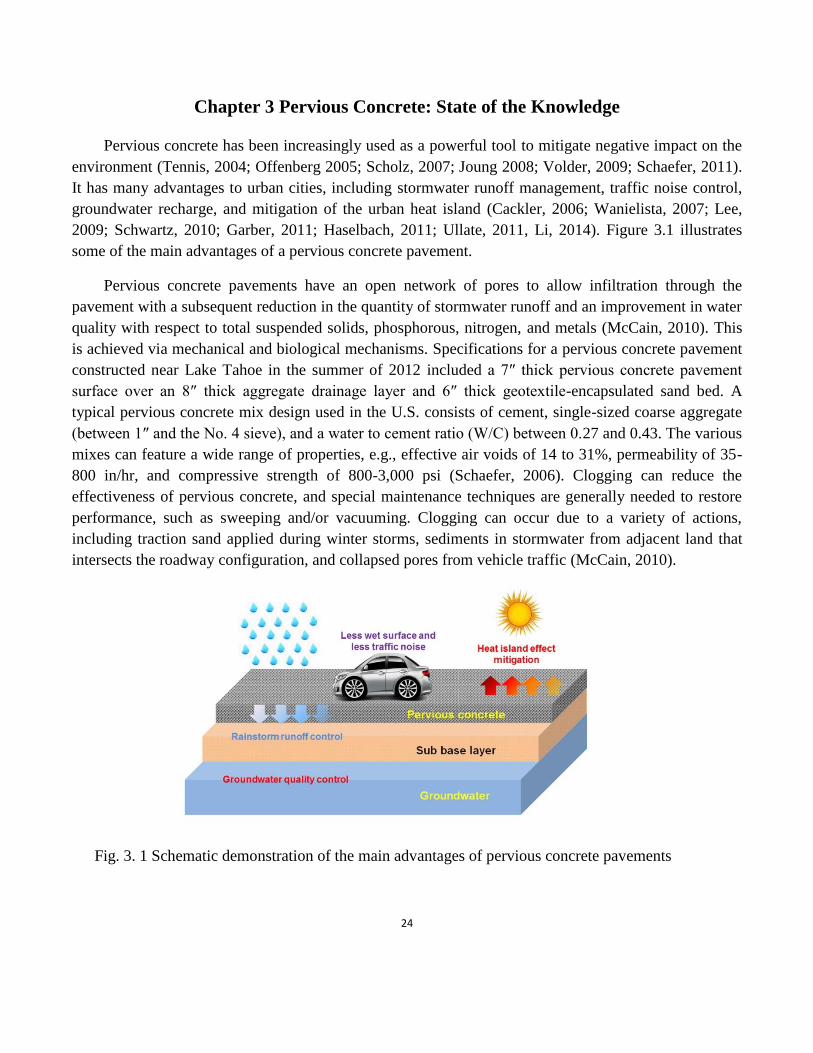
In this chapter, recent studies on pervious concrete pavements are extensively summarized. First,
the advantages of pervious concrete pavements are discussed from an environmental perspective, such
as water quality control, recycling waste materials applications, heat island effect mitigation, and driving
noise reduction; second, the design policies and implementation of the pervious concrete pavements are
briefly discussed; third, the overall properties of the pervious concrete pavements, including the
hydraulic and infiltration properties, mechanical properties, and abrasion resistance properties, are
systematically reviewed; after that, the durability problems of the pervious concrete pavements, i.e. the
freeze/thaw damages and clogging phenomenon are discussed, and in addition, the most widely applied
maintenance methods are introduced as well; finally, the microstructure characterization of the pervious
concrete through various advanced characterization approaches are reviewed. This information will help
to optimize the design policies and performance of the implemented pervious concrete pavements.
Figure 3.2 shows a flow diagram to illustrate the structure of this chapter.
Fig. 3. 2 Pervious concrete considerations
3.1 Environmental Perspective
3.1.1 Stormwater runoff and water quality control
Two infiltrating low-impact development (LID) practices configured in-series, pervious concrete
and bioretention (PC-B), were monitored for 17 months to examine the hydrologic and water quality

26
response of this LID treatment train design (Brown RA, 2012). When compared with a single treatment
practice (bioretention) that was monitored at the same site, the two LID practices in-series treated an
additional 10% of annual runoff volume, discharged approximately one-half as much outflow volume,
and discharged significantly lower peak outflow rates. However, the water quality results were not as
promising because of the influx of groundwater in the bioretention cell and the lack of denitrifying
conditions in either the bioretention cell or pervious concrete system.
A demonstration project in Yakima, WA (Yakima County website) compared water samples
collected from sample vaults in pervious concrete pavement and impervious (traditional) asphalt
pavement. The pervious concrete water samples had significantly lower biochemical oxygen demand
(2.5 vs. 11 mg/l), total suspended solids (25 vs. 320 mg/l), copper (8 vs. 20 μg/l), lead (0 vs. 20 μg/l),
zinc (0 vs. 160 μg/l), #2 Diesel (0.4 vs. 1.4 mg/l), and motor oil (0.5 vs. 2.3 mg/l). Other examples of
improvements to water quality are documented (McCain, 2010 and Brown HJ).
The quality and quantity of residential stormwater runoff from a control, traditional and low impact
development (LID) watershed were compared in a paired watershed study (Bedan ES, 2009). During the
study, nitrate and nitrite-nitrogen (NO3 + NO2-N), ammonia-nitrogen (NH3-N), total Kjeldahl nitrogen
(TKN), total phosphorus (TP), and total suspended solids (TSS) were analyzed weekly using flow-
weighted and composites of stormwater. Total copper, lead, and zinc were analyzed monthly. Mean
weekly storm flow increased 600 times from the traditional watershed in the post-construction period.
Increased exports of TKN, NO3 + NO2-N, NH3-N, TP, Cu, Zn, and TSS in runoff were associated with
the increased storm flow. Post-construction storm flow in the LID watershed was reduced by 42%, while
peak discharge did not change from preconstruction conditions. Exports were reduced from the LID
watershed for NH3-N, TKN, Pb, and Zn, while TSS and TP exports increased. Similar results indicated
that the typical stormwater concentration of dissolved Cu and Zn can be removed effectively through a
pervious concrete layer (Haselbach, 2014).
Best management practices (BMP) were studied on the campus of Villanova University
(Kwiatkowski, 2007). It was found that copper and chloride were the two constituents of concern at this
site. Copper was introduced to the system from a roof, while chloride was introduced from deicing
practices. Copper was not found in pore water beneath 0.3 m and the chloride was not significant
enough to impact the ground water. This research indicates that with proper sitting, an infiltration BMP
will not adversely impact the ground water.
A similar project monitored infiltration-based stormwater best management practices (BMP) for a
commercial development site in Aurora, Colorado (Earles TA, 2008). Total precipitation for the year of
2007 was relatively close to historical averages; however, during certain months the totals were much
greater than historical average conditions. Water quality inflow into BS-IN appears to have higher
concentrations of most analyzed pollutants than BS-IS. There was little surface runoff that left the
monitored portion of the site, indicating that most runoff was infiltrated onsite by the “experimental”

27
BMPs monitored. Concentrations from the one sample event where all of the samplers triggered indicate
a large percent removal of pollutants from the influent verses the effluent for all the parameters
monitored.
The impact of glyphosate-containing herbicide (GCH) on pollution attenuation and biodegradation
in pervious paving systems was studied most recently (Mbanaso 2013). It was concluded that the GCH
stimulated high numbers of oil degrading bacteria and fungi. The protists could be immediately killed by
GCH but recovered within a week. The taxonomic richness could be reduced and the responses of the
protists may allow the development of a bio-indicator system for GCH. The GCH negated the trapping
and retention of hydrocarbons by the geotextile, and the herbicide reduced the capacity of the geotextile
to trap metals in the pervious pavement system.
The soil moisture and chemical properties of pavements were analyzed by Morgenroth (2007,
2013). It was demonstrated that the soil moisture and aeration dynamics differ greatly beneath paved and
unpaved surfaces; differences are usually insignificant between pervious and impervious paving. If
urban trees do benefit from overlying pervious paving relative to impervious paving it is probably not a
consequence of soil moisture or aeration. The pavement style changed the pH value of the soil from 5.75
to 6.3. The effect on pH was higher beneath porous pavements when a gravel base was included.
Concentrations of Al, Fe, and Mg decreased, while Na increased beneath pavements. Soil moisture was
consistently higher beneath pavements than control plots, except following periods of heavy rainfall
where high soil moisture muted all treatment effects.
Some studies of pervious concrete pavement working as a photocatalyst by mixing TiO2 with the
cementitious material have been performed (Shen, 2011, 2012). High pollutant reductions can be
obtained by using a driveway protector mix, a commercial water-based TiO2 preparation, TiO2 in water,
a water/cement slurry with low cement concentration, and the commercial PURETI coating. It was
found that nitrogen oxide was efficiently removed with each of these treatments, while volatile organic
compounds displayed more variability in removal efficiency. The infiltration rate reduction was largely
influenced by different coating methods while none of the application methods decreased the infiltration
rates below levels applicable for standard hydrological designs. Relative to traditional concrete, pervious
concrete showed higher NO reductions.
3.1.2 Waste materials applications
Fly ash, as one of the most abundant waste materials in the world, has been introduced into general
purpose Portland cement as a cementitious agent in pervious concrete samples. The properties of various
pervious concretes containing fly ash (including density, porosity, compressive strength, water
permeability and drying shrinkage ) have been carefully measured (Aoki, 2012). Fly ash pervious
concrete has the same trend of property variations as traditional pervious concrete. High porosity
samples demonstrated higher permeability, whereas their compressive strength was reduced. It was
28
found that there was no significant difference between properties of pervious concrete samples
containing fly ash and those samples comprising only cement as a cementitious agent. Apart from the fly
ash, the rice husk ash and fibers were used as cement replacement to prepare the pervious concrete. The
mechanical properties testing results indicated that the rice husk ash has positive effects on the
mechanical performance of the pervious concrete when combining with some fibers (Hesami, 2014).
Another study compared five types of pozzolanic materials as cement replacement. It was found that
replacement of 5% of the cement will lead to an enhancement of the compressive strengths and
permeability of the high permeable concrete (Mohammed, 2013).
Li (2009) also claimed that a mixing design method for no-fines pervious recycled concrete or
conventional pervious concrete is practical and feasible by using recycled aggregates. Some other
wasted material, such as Washed municipal solid waste incinerator bottom ash (MSWIBA), was also
used as substitute for natural aggregates in pervious concrete (Kuo, 2013). The mixture proportions,
permeability, compressive strength, bending and split tensile strength were tested in this study. In
specimens with the same water to cement ratio (W/C), the compressive, bending and split tensile
strengths all increased with the ratio of filling paste. The connected porosity and permeability
coefficients both decreased with increasing filling ratio.
Pervious concrete made with recycled concrete aggregate (RCA), which was obtained from
decommissioned curbs and gutters, sidewalks, and parking lots, was prepared by substituting the coarse
aggregate in the pervious concrete with 15%, 30%, 50%, and 100% RCA. The cylinders were cast in the
laboratory for each percentage of RCA and a control mix containing only virgin aggregate. The
compressive strength, permeability, and void content were tested (Rizvi 2010). It was found that the
pervious concrete containing 15% RCA had similar strength, permeability, and void content to those of
the control mix. Samples that contained 30% RCA or greater had a significant loss in strength and
increase in permeability and void content. Similar results were demonstrated by Aamer Rafique Bhutta
(2013). It was found that, if combined with Styrene butadiene rubber, the performance of the pervious
concrete prepared with RCA will be acceptable.
Apart from the hard materials, soft materials were also used as aggregates to prepare the pervious
concrete. Recently, rubber from waste tires was used as the aggregate to prepare the pervious concrete
(Shen, 2013; and Gesoğlu, 2014). The mechanical properties were investigated and the corresponding
hydraulic performance was tested as well. The results show that the use of waste tire rubber can
significantly aggravate the mechanical properties and permeability; however, the toughness, damping
capacitance, and ductility can be considerably increased (Gesoğlu, 2014).
Similarly, Gaedicke (2014) investigated the properties of cores and compacted cylinders with
various types of aggregates and different percentages of cement replacement by slag. In this study, the
cores were comprised of pea gravel, limestone, and recycled aggregates. Relative to the compacted
29
cylinders with a same porosity and same unit weight, the cores have 20% less permeability and 17%
lower compressive strength.
Geopolymer has been studied as a binding material for pervious concrete (Tawatchai, 2012). It was
found that the mechanical properties of the pervious concrete can be satisfied by using geopolymer as
the binder material. The relationships of the density-void content, compressive strength-density, and
compressive strength-void content were derived and found to be similar to those of conventional
pervious concrete.
3.1.3 Heat island effects mitigation
The heat island phenomenon has already become a large concern due a global urbanization trend.
Recently, pervious concrete pavement has been studied as a solution to this problem. In Haselbach’s
study, temperature data from a site in Iowa and heat storage phenomena for various weather patterns
were presented (Haselbach, 2010). The site contained both pervious concrete pavement with a solar
reflectance index (SRI) of 14 and traditional concrete pavement with an SRI of 37. A high SRI (>29) has
been accepted by LEED as one method to characterize a surface as a cool surface. Combined with the
high internal surface area, rainfall will result in significantly more removal of stored heat from the
pervious concrete system and reduce the thermal shock from impervious surface runoff.
Herb (2008) developed a simple model to predict the surface heat transfer processes on impervious
and pervious land surfaces for both dry and wet weather periods. In this study, equations were developed
to predict the magnitude of the irradiative, convective, conductive and evaporative heat fluxes on a dry
or wet surface using standard climate data as inputs.
Recently, a study demonstrated that wet pervious pavements have relatively lower surface
temperatures than the impermeable pavements. It was found that the peak cooling temperatures was
about 15-35ºC of the pavement surface in the early afternoon of the summer season in California (Li,
2013a).
3.1.4 Noise reduction
U.S. and European concrete pavement noise reduction methods were evaluated by Cackler (2006).
Sound absorption levels for pervious concrete pavements have been shown to increase with higher
porosity levels. Quieter pervious concrete also results from smaller aggregate sizes.
Schaefer (2011) also reported the noise reduction effects of pervious concrete overlay in MnROAD
Low Volume Road and reveal a remarkably quiet pavement. In this report, it was found that the
traditional concrete noise levels range from around 100 to 110 decibels adjusted (dBA), while the
pervious concrete range was between 96 and 98 in 2009 and 2010.

30
Tian (2014) investigated the noise reduction effect of the pervious concrete pavement from both
laboratory and field tests. It was found that the aggregate sizes and the thickness of the pervious concrete
have considerable effects on noise reduction. The 9.5 mm aggregates size had the highest acoustical
absorption coefficient, and the 80 mm thickness had the optimum noise absorption. The field testing
results showed that the noise can reduce by 4-8 dB after application of pervious concrete pavement.
3.2 Designing and Preparation
3.2.1 Mix design and preparation
Zaldo (2006) claimed that the durability of pervious concrete depends on three primary factors: mix
design, placement, and proper maintenance. Wang (2006) and Putman (2011) studied mix proportion
design and preparation techniques of pervious concrete and Schaefer el.al. (Schaefer, 2006) found
saturated freeze-thaw performance (using ASTM C666) could be improved by several different changes
to the mix design: using a small amount of fine aggregate (sand), adding polypropylene fibers, using a
slightly higher water/cement ratio, increasing compaction (lower porosity), including entrained air and
increasing paste volume, replacing some Portland cement with fly ash or silica fume, or using a latex
admixture (Kevern, 2008b; Wu, 2010).
Kevern et.al.(2006, 2008a, 2008c, 2009a, 2009b, 2010b) also published many works on mixture
proportion design and methods development, especially in cold weather climates (Kevern, 2005, 2008a,
2008b, 2008d, 2010a ).
Deo (2011) developed a methodology to proportion pervious concrete mixtures of desired porosity
using high or low cement paste contents. A consistent trend of decreasing peak stresses and strains at
peak stress with increasing porosity was obtained. A reduction in strains at peak stresses with decreasing
paste contents and a rapid drop in the post-peak response with decreasing porosity was also observed.
The compressive energy absorbed by the pervious concrete specimens was found to scale linearly with
compressive strength and was related to the porosity and critical pore sizes in the material.
3.2.2 Modeling and simulation
Deo (2010) used a statistical model to build a relationship between the compressive strength and
the relevant pore structure features. This model was then used as a base model in a Monte-Carlo
simulation to evaluate the sensitivity of the predicted compressive strength to the model terms. Lian also
presented a discrete element numerical method by using particle flow code to evaluate the structural
properties of porous concrete (Lian, 2011a, 2011b).
The condition index and performance models were developed to simulate the application of
pervious concrete pavement under different conditions, especially in winter seasons, and were modeled
by soft computing techniques (Fuzzy sets, Latin Hypercube Simulation technique, and Markov Chain
31
process), Bayesian Statistical technique, and specific panel rating method and regression analysis
techniques (Golroo, 2009, 2010, 2011, 2012a, 2012b, 2012c, 2012d).
Cofer et.al developed a finite element modeling procedure for pervious concrete pavement systems
(Alam A, 2012). With an assumption of perfect bond between the interfaces of the different material
layers, a simplified vertical porosity distribution in the previous concrete layer was used for the
modeling procedure. All the modeling analyses were for static loading conditions and linear material
properties. It was found that, if the pavement condition index data is defined to represent cyclic loading,
the required thickness needs a factor of safety of approximately two relative to the static loading
analysis. In addition, expanded finite element models for typical material properties and tire pressures
indicate that pervious concrete might be appropriate for high volume traffic applications such as
highway shoulders.
A statistical model was developed to investigate the effects of W/C, cement content and coarse
aggregate content on the density, void ratio, infiltration rate, and compressive strength of Portland
cement pervious concrete (Sonebi, 2013). It was found that the W/C, cement content, coarse aggregate
content and their interactions are key parameters that significantly affect the characteristic performance
of pervious concrete. The developed statistical models can facilitate optimizing the mixture proportions
of pervious concrete for the final performance.
3.3 Properties Evaluation
3.3.1 Hydraulic and infiltration properties
Permeability tests are frequently conducted in the laboratory on pervious concrete samples. While
not yet standardized by ASTM or AASHTO, the most common type of laboratory test is a falling head
permeability test (McCain, 2010; Huang, 2010, Rizivi, 2010; and Schaefer, 2006). In this test type of
test, a sample is sealed on the sides and the amount of time for water applied to the surface of the sample
to drop in height is recorded. The time and beginning and ending pressure head are used to compute
hydraulic conductivity. Two options for testing the infiltration rate in the field include ASTM C1701
and a method developed and refined over several years by Minnesota DOT personnel (personal
communication with Bernard Izevbekhai, MnDOT).
Luck et.al. tested the hydraulic properties of pervious concrete in detail (Luck, 2006, 2008, 2009)
and found pervious concrete has a great potential for mitigating negative impacts on the natural
environment. In addition to the runoff reduction properties, it also provides obvious benefits relative to
typical impervious concrete.
In a study by Chai, the hydraulic performance of fully permeable highway shoulder retrofits was
designed to capture all the rainfall runoff falling onto conventional highway surface pavements (Chai,
2012). The authors claimed that an aggregate depth of about 1.5 m was adequate for most California
32
areas with two-lane highways. Sensitivity analyses also revealed that the saturated hydraulic
conductivity (Ks) of the subgrade soil is the most important parameter to be considered in the design of
fully permeable pavements with a minimum effective allowable value of approximately 10-5
cm/s.
The hydraulic performance of pervious concrete pavements from field and laboratory settings was
investigated to evaluate the infiltration capacities of pervious concrete cores, the underlying soils and the
usefulness of rejuvenation methods in restoring their hydraulic performance (Chopra M, 2010). In this
study, a new field test device called an embedded ring infiltrometer was developed for evaluating the
infiltration rates of newly installed pervious concrete pavements. It was demonstrated that the
rejuvenation methods can substantially restore the performance of pervious concrete pavements for
better management of stormwater.
In fact, there is a strong relationship between the porosity and the hydraulic properties of pervious
concrete (Montes, 2006). Increasing porosity has a positive influence on the hydraulic properties while it
has a negative influence on the strengths. Huang (2010) and Shu (2011) studied the influence of porosity
on the hydraulic properties and strengths. Latex polymer, sand, and fiber were used to improve the
strength of pervious concretes of the same porosity without sacrifice to the hydraulic properties. They
found that it was possible to produce a pervious concrete mixture with acceptable permeability and
strength through the combination of latex and sand (Huang, 2010).
More recently, it has been recognized that the vertical porosity distribution is playing a key role on
the hydraulic properties of pervious concrete (Martin III, 2014). However, the real impact of the vertical
distribution on the hydraulic performance of the pervious concrete pavement is still not very clear,
especially in a quantitative way. How to accurately characterize the vertical porosity is an important
research topic that needs to be further investigated in future studies.
Of particular note, recent research has found that the hydraulic properties of pervious concrete are
largely determined by the testing methods (Brown, 2014). By comparing the two most widely used
methods, the National Center for Asphalt Technology (NCAT) permeameter and the ASTM C1701, it
was found that the permeability measured by ASTM 1701 is about 50% to 90% lower than those
measured by the NCAT approach (Li, 2013b).
3.3.2 Mechanical properties
The effects of aggregate gradation, amount and size on the static modulus of elasticity of pervious
Portland cement concrete were evaluated using four different mixtures (Crouch, 2007). It was reported
that for a uniform gradation, the compressive strength and static elastic moduli appeared to be higher
within an optimal range of voids. An increased aggregate amount resulted in a statistically significant
decrease in both compressive strength and static elastic moduli. While the compressive strengths were
higher for mixtures containing smaller aggregate sizes, there was no significant difference between the
static elastic moduli when different aggregate sizes were used.

33
Deo (2010) studied the material structure-compressive response relationships in pervious concretes.
They found that compressive strengths increased with increasing aggregate size and paste volume
fractions. Meanwhile, the compressive response was influenced by the size, distribution and spacing of
pores.
Structural performance of pervious pavements was investigated by Geode et.al. Distress surveys
were performed on two field installations of pervious concrete which were subjected to equivalent traffic
stresses as some collector streets that had been in use for 20 years (Geode, 2012). The high pavement
condition index ratings of the thicker pervious concrete sections indicate that pervious concrete, when
properly designed, is capable of being used for many collector streets and most residential streets for 20-
30 years while exhibiting structural performance similar to traditional pavements. Even though the
pervious concrete analyzed was subjected to an equivalent amount of stress from loading as a collector
street in use for between 8 and 80 years, it was only subjected to weathering stresses during its actual
life. In addition, the mechanical performance and structural integrity of the pervious concrete pavements
were evaluated most recently. It was claimed that the deflection of the pervious concrete pavements is
largely affected by the subbase materials and the compaction of the layers. The deflection of the
pervious concrete pavement with a loading application was about 1.7 to 4 times higher than the
impervious concrete pavement which is determined by the subbase characterization (Gogo-Abite, 2013).
In Chen’s study (Chen, 2012), pervious cement concrete samples modified with either polymers or
supplementary cementitious materials (SCM) were analyzed for fatigue properties, fracture energies and
compressive and flexural strengths. It was found that the strength development of SCM modified
pervious concrete was different from the polymer-modified pervious concrete. Polymer modified
pervious concrete has higher flexural strength and remarkably higher flexural-to-compressive strength
ratio than SCM modified pervious concrete at the same porosity level. Polymer modified pervious
concrete displays far longer fatigue life than SCM modified pervious concrete for any given failure
probability and at any stress level. Porosity had little effect on the strength development of either
modified concrete.
The damping properties of pervious concrete with water, glycerol, and glycerol/water blends
constituting the pore fluid at loading frequencies ranging from 0.01–25 Hz was studied by Leung (2012).
It was claimed that a significant poromechanical damping can be generated and that the frequency at
which the damping is maximized can be controlled by changing material properties. It was also
discovered that poromechanical modeling underpredicts the measured damping increase resulting from
the saturation status.
Stiffness and fatigue were analyzed by means of Westergaard’s theory of a medium-thick plate on a
Winkler foundation (Vancura 2011b). The stiffness evaluation compared the responses of pervious and
conventional concrete pavements to falling weight deflectometer stresses and to models created in
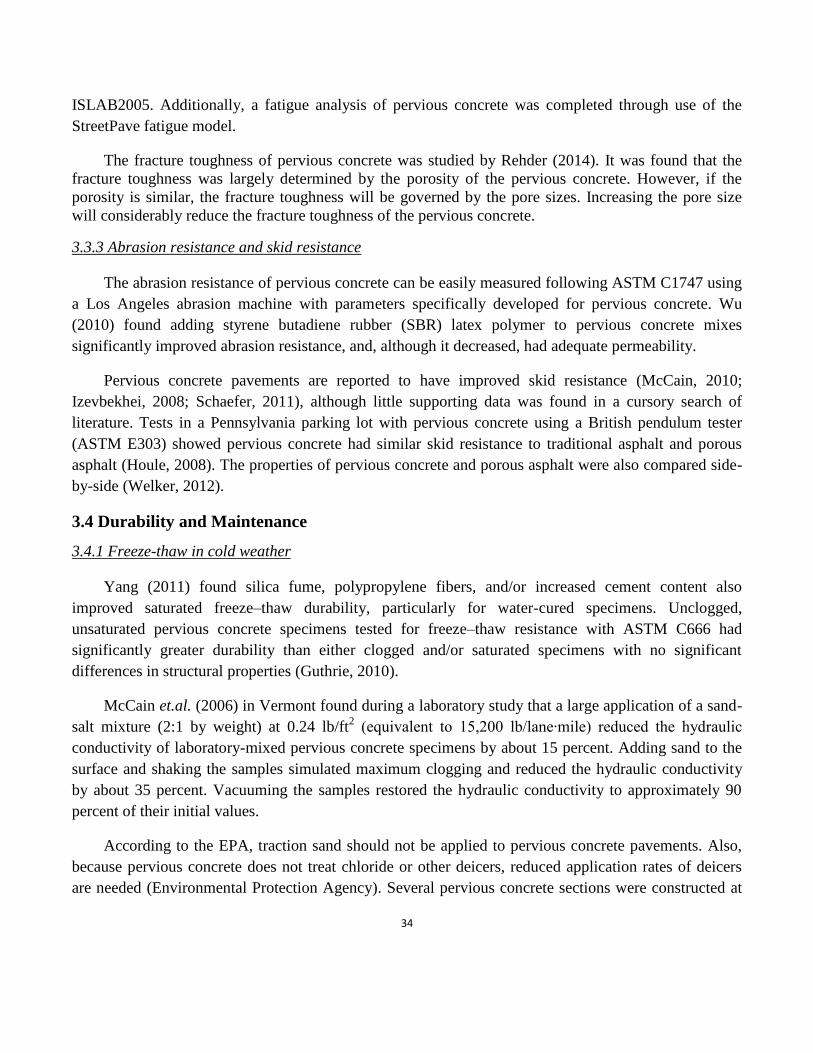
34
ISLAB2005. Additionally, a fatigue analysis of pervious concrete was completed through use of the
StreetPave fatigue model.
The fracture toughness of pervious concrete was studied by Rehder (2014). It was found that the
fracture toughness was largely determined by the porosity of the pervious concrete. However, if the
porosity is similar, the fracture toughness will be governed by the pore sizes. Increasing the pore size
will considerably reduce the fracture toughness of the pervious concrete.
3.3.3 Abrasion resistance and skid resistance
The abrasion resistance of pervious concrete can be easily measured following ASTM C1747 using
a Los Angeles abrasion machine with parameters specifically developed for pervious concrete. Wu
(2010) found adding styrene butadiene rubber (SBR) latex polymer to pervious concrete mixes
significantly improved abrasion resistance, and, although it decreased, had adequate permeability.
Pervious concrete pavements are reported to have improved skid resistance (McCain, 2010;
Izevbekhei, 2008; Schaefer, 2011), although little supporting data was found in a cursory search of
literature. Tests in a Pennsylvania parking lot with pervious concrete using a British pendulum tester
(ASTM E303) showed pervious concrete had similar skid resistance to traditional asphalt and porous
asphalt (Houle, 2008). The properties of pervious concrete and porous asphalt were also compared side-
by-side (Welker, 2012).
3.4 Durability and Maintenance
3.4.1 Freeze-thaw in cold weather
Yang (2011) found silica fume, polypropylene fibers, and/or increased cement content also
improved saturated freeze–thaw durability, particularly for water-cured specimens. Unclogged,
unsaturated pervious concrete specimens tested for freeze–thaw resistance with ASTM C666 had
significantly greater durability than either clogged and/or saturated specimens with no significant
differences in structural properties (Guthrie, 2010).
McCain et.al. (2006) in Vermont found during a laboratory study that a large application of a sand-
salt mixture (2:1 by weight) at 0.24 lb/ft2 (equivalent to 15,200 lb/lane∙mile) reduced the hydraulic
conductivity of laboratory-mixed pervious concrete specimens by about 15 percent. Adding sand to the
surface and shaking the samples simulated maximum clogging and reduced the hydraulic conductivity
by about 35 percent. Vacuuming the samples restored the hydraulic conductivity to approximately 90
percent of their initial values.
According to the EPA, traction sand should not be applied to pervious concrete pavements. Also,
because pervious concrete does not treat chloride or other deicers, reduced application rates of deicers
are needed (Environmental Protection Agency). Several pervious concrete sections were constructed at
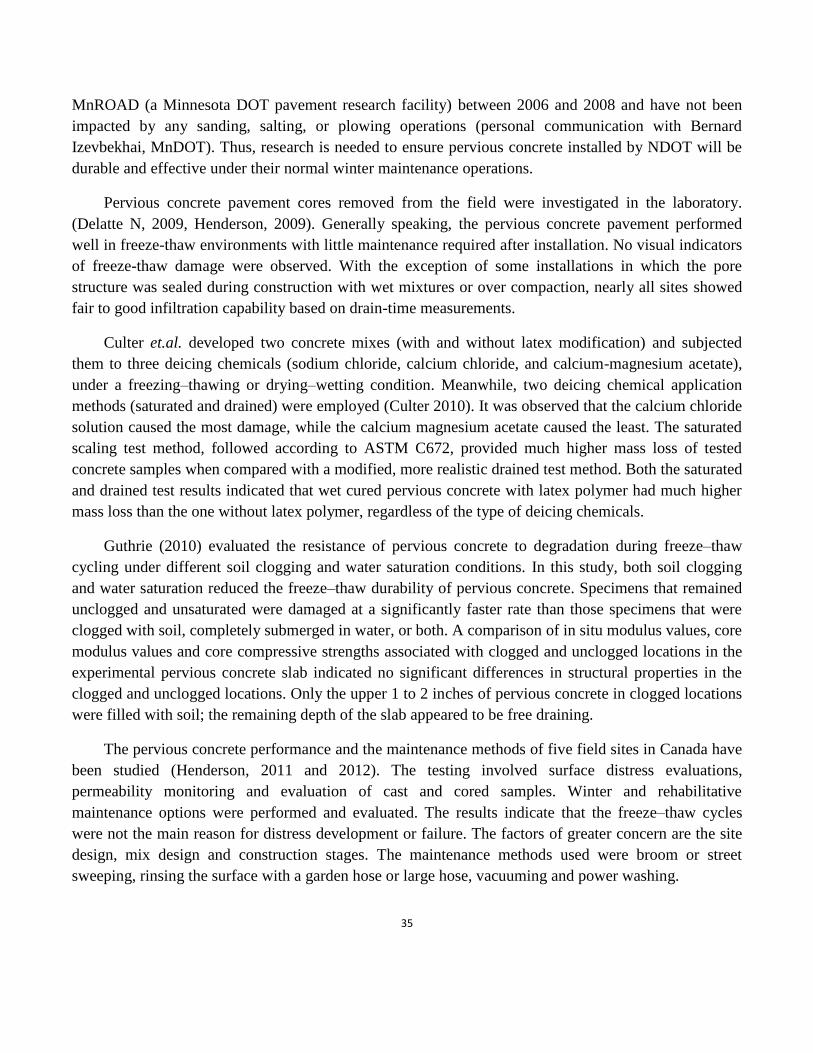
35
MnROAD (a Minnesota DOT pavement research facility) between 2006 and 2008 and have not been
impacted by any sanding, salting, or plowing operations (personal communication with Bernard
Izevbekhai, MnDOT). Thus, research is needed to ensure pervious concrete installed by NDOT will be
durable and effective under their normal winter maintenance operations.
Pervious concrete pavement cores removed from the field were investigated in the laboratory.
(Delatte N, 2009, Henderson, 2009). Generally speaking, the pervious concrete pavement performed
well in freeze-thaw environments with little maintenance required after installation. No visual indicators
of freeze-thaw damage were observed. With the exception of some installations in which the pore
structure was sealed during construction with wet mixtures or over compaction, nearly all sites showed
fair to good infiltration capability based on drain-time measurements.
Culter et.al. developed two concrete mixes (with and without latex modification) and subjected
them to three deicing chemicals (sodium chloride, calcium chloride, and calcium-magnesium acetate),
under a freezing–thawing or drying–wetting condition. Meanwhile, two deicing chemical application
methods (saturated and drained) were employed (Culter 2010). It was observed that the calcium chloride
solution caused the most damage, while the calcium magnesium acetate caused the least. The saturated
scaling test method, followed according to ASTM C672, provided much higher mass loss of tested
concrete samples when compared with a modified, more realistic drained test method. Both the saturated
and drained test results indicated that wet cured pervious concrete with latex polymer had much higher
mass loss than the one without latex polymer, regardless of the type of deicing chemicals.
Guthrie (2010) evaluated the resistance of pervious concrete to degradation during freeze–thaw
cycling under different soil clogging and water saturation conditions. In this study, both soil clogging
and water saturation reduced the freeze–thaw durability of pervious concrete. Specimens that remained
unclogged and unsaturated were damaged at a significantly faster rate than those specimens that were
clogged with soil, completely submerged in water, or both. A comparison of in situ modulus values, core
modulus values and core compressive strengths associated with clogged and unclogged locations in the
experimental pervious concrete slab indicated no significant differences in structural properties in the
clogged and unclogged locations. Only the upper 1 to 2 inches of pervious concrete in clogged locations
were filled with soil; the remaining depth of the slab appeared to be free draining.
The pervious concrete performance and the maintenance methods of five field sites in Canada have
been studied (Henderson, 2011 and 2012). The testing involved surface distress evaluations,
permeability monitoring and evaluation of cast and cored samples. Winter and rehabilitative
maintenance options were performed and evaluated. The results indicate that the freeze–thaw cycles
were not the main reason for distress development or failure. The factors of greater concern are the site
design, mix design and construction stages. The maintenance methods used were broom or street
sweeping, rinsing the surface with a garden hose or large hose, vacuuming and power washing.

36
3.4.2 Clogging
Recently, clogging problems have piqued the interests of many researchers (Sriravindrarajah 2011;
Sansalone 2012; Wang, 2012; Vancura, 2012). A “clogging potential” was defined (Deo, 2010) as either
a ratio of the porosity reduction because of clogging to the initial porosity, or as a ratio of the
permeability reduction to the permeability in the unclogged state. The influence of pore structure
features on particle retention and the consequent permeability reduction were systematically investigated
using several pervious concrete mixture proportions with different size aggregates (Deo, 2010).
Significant permeability reductions were observed when finer sand was used as the clogging material.
Pervious concrete specimens of similar porosity having very large (5–6 mm) or very small (1–2 mm)
pore sizes were found to be less susceptible to clogging.
Pervious concrete facing a series of catastrophic clogging cycles with clay laden runoff was
presented in a laboratory procedure (Haselbach, 2010). In this study, the clay materials were assumed to
remain near the surface of pervious concrete systems, since most placements have a vertical porosity
distribution with the smaller pores near the top. By testing core samples from actual field placement, the
experimental results show that substantial deposition of clay on a pervious concrete pavement will
largely reduce its service capability, even when fully “clogging” the pavement only temporarily. Despite
the clay remains at the surface, the infiltration capacity of the pervious concrete was acceptable with
simple maintenance such as surface sweeping and subsequent rinsing similar to rainfall events.
Sriravindrarajah has done similar research on the influence of clay on the clogging phenomena of
pervious concrete (Sriravindrarajah, 2011).
In addition to the clay clogging testing, by combining with experimental results, a theoretical
relation was also developed to predict the relationship between the effective permeability of a sand-
clogged pervious concrete block, the permeability of sand, and the porosity of the unclogged block
(Haselbach, 2006). The experimental results agreed well with the theoretical calculated permeability of
the pervious concrete system for pervious concrete systems fully covered on the surface with sand. In
this study, a typical pervious concrete block will allow water to pass through at flow rates greater than
0.2 cm/s and a typical extra fine sand will have a permeability of approximately 0.02 cm/s. The limit of
the system with complete sand coverage resulted in an effective system permeability of approximately
0.004 cm/s, which is similar to the rainfall intensity of 30 min duration.
The clogging dynamics of pervious concrete were assessed with time domain reflectometers in
Edison, New Jersey, and Louisville, Kentucky (Brown, 2013). In this study, the paired time domain
reflectrometers were installed at two locations at the depth of 0.4 meter below the driving surface. The
placement strategy of the time domain reflectometers was used to evaluate the spatial infiltration of
runoff and to record the clogging and infiltration dynamics. It was found that the clogging was
developed from the upgradient edge, and the Lousiville case study can support the potential surface
clogging mechanism.

37
Based on the clogging problem, some maintenance methods were developed to clean the pervious
concrete pavements, including power blowing, pressure washing, and vacuuming, or the combination of
these methods. It was found that pressure washing and vacuuming are both effective to clean the
clogging. They can increase the infiltration rate by over 90%. The cleaning effect will be considerably
increased by combining use of these methods (Hein, 2013).
A quick surface infiltration test was presented for assessment of pervious concrete maintenance
needs (Dougherty, 2011). Pressure washing and pressure washing with power blowing were applied.
Both maintenance practices improved the pervious concrete sidewalk infiltration rates by 20-fold on
average. If combined with pressure washing and power blowing, an almost 200-fold increase can be
observed on sites.
A laboratory study was performed to measure clogging by sand and clay in a saturated pervious
concrete pavement system and the subsequent effect of surface cleaning by pressure washing (Coughlin,
2012). Researchers found that measurable clogging caused by both sand and clay could not be reversed
by pressure washing. However, even after clogging, the infiltration and exfiltration rates were well
above the average intensity for the 100-year 1-h design storm, but its performance for storm-water
infiltration will be limited by the rate of exfiltration to the subgrade.
The stormwater management, infiltration rates, rejuvenation techniques, sustainable storage of the
components and complete systems, water quality and strength properties of pervious concrete pavements
were investigated in Chopra’s study (Chopra, 2007 and 2011). The use of a vacuum sweeper truck was
ineffective at removal of deep penetrating clogging, although it can successfully remove surface
sediments. The reduction in infiltration rates is only observed when significant amounts of sediments
enter the system and migrate into deeper locations.
3.5 Characterization
The internal structure, including the size, shape and distribution of the pores and aggregates, is the
key factor in determining the final properties of pervious concrete. By using 3D CT images (shown as
Figure 3.3), the relationship between the internal structures and the final properties of the pervious
concrete was analyzed (Kayhanian 2012). It was found that the scanned image analysis showed that
most clogging occurs near the surface of the pavement. While lower porosity generally appeared to be
limited to the upper 25 mm, in some core samples evidence of lower porosity was found up to 100 mm
below the surface. A recent study by Manahiloh found similar results (Manahiloh, 2012).
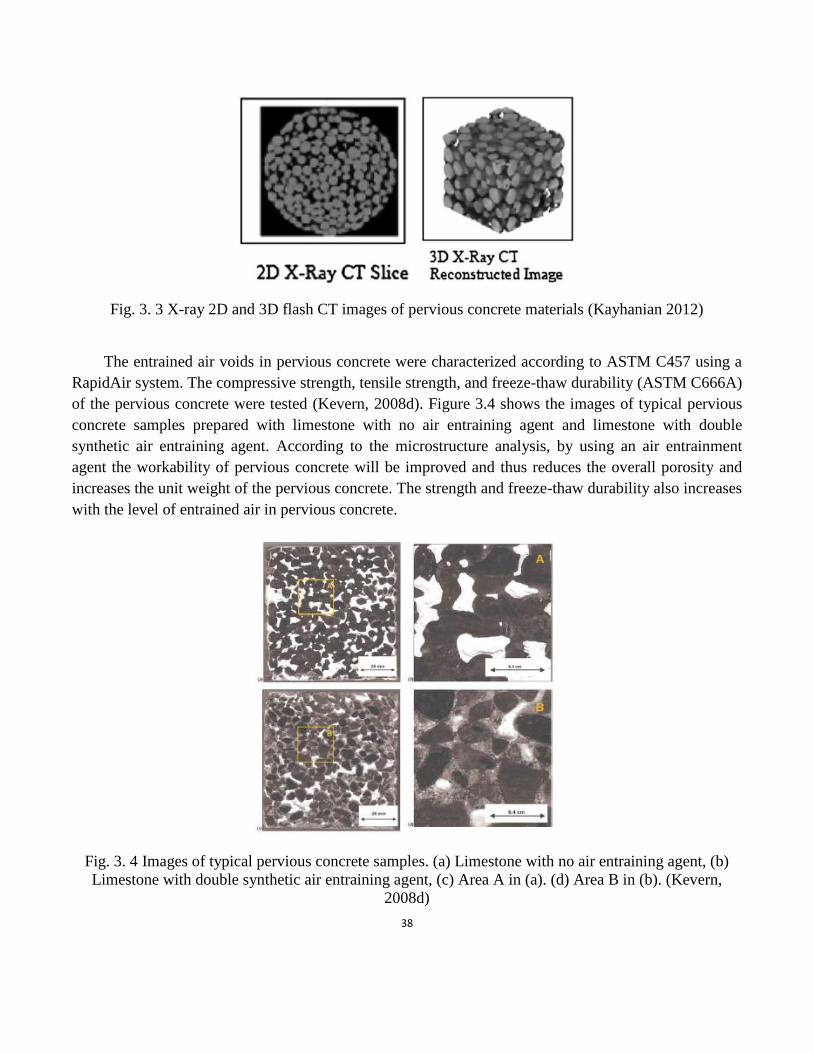
38
Fig. 3. 3 X-ray 2D and 3D flash CT images of pervious concrete materials (Kayhanian 2012)
The entrained air voids in pervious concrete were characterized according to ASTM C457 using a
RapidAir system. The compressive strength, tensile strength, and freeze-thaw durability (ASTM C666A)
of the pervious concrete were tested (Kevern, 2008d). Figure 3.4 shows the images of typical pervious
concrete samples prepared with limestone with no air entraining agent and limestone with double
synthetic air entraining agent. According to the microstructure analysis, by using an air entrainment
agent the workability of pervious concrete will be improved and thus reduces the overall porosity and
increases the unit weight of the pervious concrete. The strength and freeze-thaw durability also increases
with the level of entrained air in pervious concrete.
Fig. 3. 4 Images of typical pervious concrete samples. (a) Limestone with no air entraining agent, (b)
Limestone with double synthetic air entraining agent, (c) Area A in (a). (d) Area B in (b). (Kevern,
2008d)
39
The porosity and physical features of the pore network were characterized (Neithalath 2007) by
using Electrical Impedance Spectroscopy (EIS) incorporating a modified version of Archie's law. The
pore volume, sizes, and connectivity in pervious concretes were characterized for permeability testing
(Neithalath 2010). The Weibull probability distribution function was found to describe the pore size
distribution in pervious concretes. By using an electrical conductivity ratio along with the pore phase
connectivity, the values of porosity and pore sizes that were determined by morphologies (shown as
Figure 3.5) were used in a Katz-Thompson type relationship to predict the permeability of pervious
concretes.
Fig. 3. 5 Two-dimensional images of planar sections from pervious concrete mixture proportions with (a)
2.36 mm, (b) 4.75 mm, and (c) 9.5mm maximum size aggregates (Neithalath 2010a and 2010b)
Sumanasooriya (2009, 2011, 2012) also characterized the pore structure reconstruction of three-
dimensional material structures of pervious concretes using two-dimensional digital images obtained
from actual specimens. She also used computational permeability predictions using these reconstructed
three-dimensional material structures to predict the final properties of the pervious concrete, as shown in
Figure 3.6.
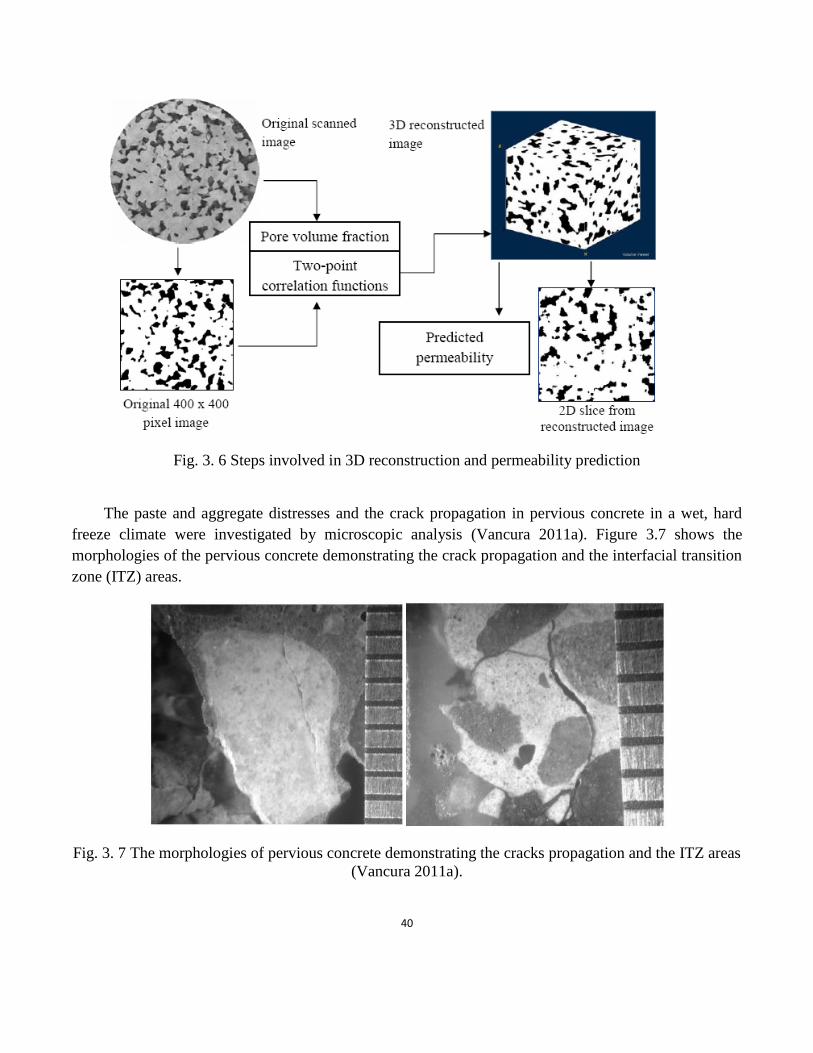
40
Fig. 3. 6 Steps involved in 3D reconstruction and permeability prediction
The paste and aggregate distresses and the crack propagation in pervious concrete in a wet, hard
freeze climate were investigated by microscopic analysis (Vancura 2011a). Figure 3.7 shows the
morphologies of the pervious concrete demonstrating the crack propagation and the interfacial transition
zone (ITZ) areas.
Fig. 3. 7 The morphologies of pervious concrete demonstrating the cracks propagation and the ITZ areas
(Vancura 2011a).
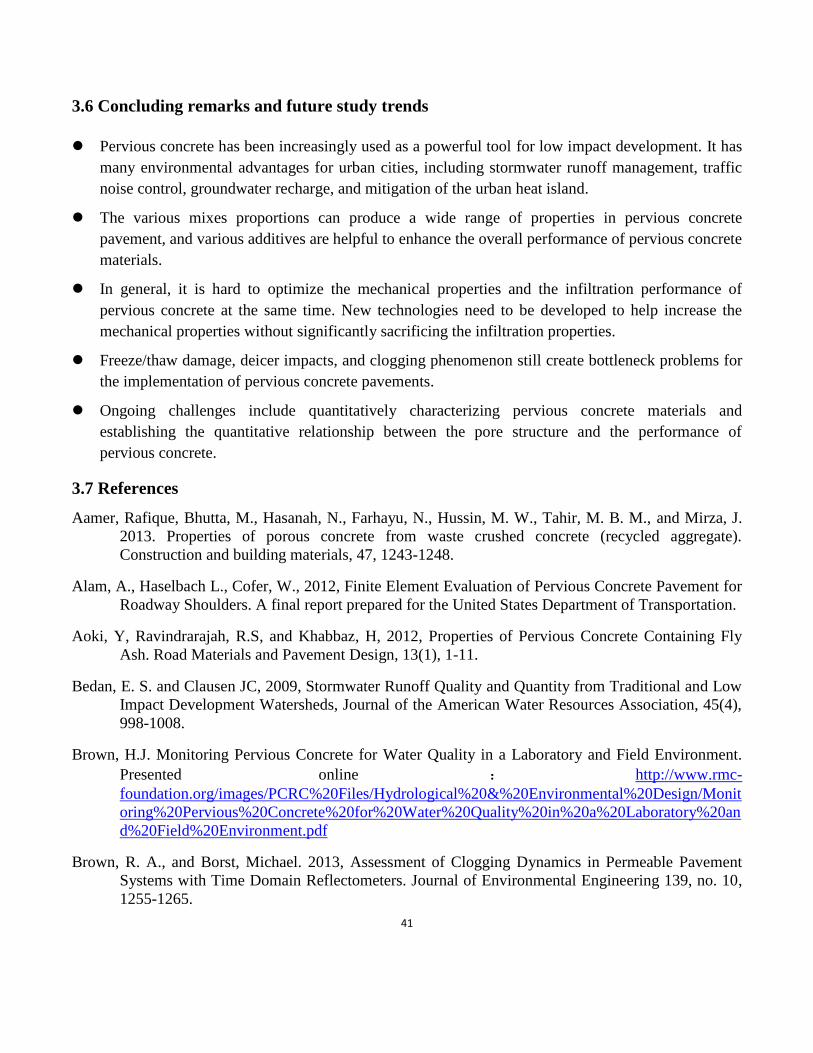
41
3.6 Concluding remarks and future study trends
Pervious concrete has been increasingly used as a powerful tool for low impact development. It has
many environmental advantages for urban cities, including stormwater runoff management, traffic
noise control, groundwater recharge, and mitigation of the urban heat island.
The various mixes proportions can produce a wide range of properties in pervious concrete
pavement, and various additives are helpful to enhance the overall performance of pervious concrete
materials.
In general, it is hard to optimize the mechanical properties and the infiltration performance of
pervious concrete at the same time. New technologies need to be developed to help increase the
mechanical properties without significantly sacrificing the infiltration properties.
Freeze/thaw damage, deicer impacts, and clogging phenomenon still create bottleneck problems for
the implementation of pervious concrete pavements.
Ongoing challenges include quantitatively characterizing pervious concrete materials and
establishing the quantitative relationship between the pore structure and the performance of
pervious concrete.
3.7 References
Aamer, Rafique, Bhutta, M., Hasanah, N., Farhayu, N., Hussin, M. W., Tahir, M. B. M., and Mirza, J.
2013. Properties of porous concrete from waste crushed concrete (recycled aggregate).
Construction and building materials, 47, 1243-1248.
Alam, A., Haselbach L., Cofer, W., 2012, Finite Element Evaluation of Pervious Concrete Pavement for
Roadway Shoulders. A final report prepared for the United States Department of Transportation.
Aoki, Y, Ravindrarajah, R.S, and Khabbaz, H, 2012, Properties of Pervious Concrete Containing Fly
Ash. Road Materials and Pavement Design, 13(1), 1-11.
Bedan, E. S. and Clausen JC, 2009, Stormwater Runoff Quality and Quantity from Traditional and Low
Impact Development Watersheds, Journal of the American Water Resources Association, 45(4),
998-1008.
Brown, H.J. Monitoring Pervious Concrete for Water Quality in a Laboratory and Field Environment.
Presented online : http://www.rmc-
foundation.org/images/PCRC%20Files/Hydrological%20&%20Environmental%20Design/Monit
oring%20Pervious%20Concrete%20for%20Water%20Quality%20in%20a%20Laboratory%20an
d%20Field%20Environment.pdf
Brown, R. A., and Borst, Michael. 2013, Assessment of Clogging Dynamics in Permeable Pavement
Systems with Time Domain Reflectometers. Journal of Environmental Engineering 139, no. 10,
1255-1265.

42
Brown, R. A., & Borst, M. 2014. Evaluation of Surface Infiltration Testing Procedures in Permeable
Pavement Systems. Journal of Environmental Engineering, 140(3).
Bury, M. A., Mawby C. A., and Fisher D. Making Pervious Concrete Placement Easy Using a Novel
Admixture System. Presented online : http://www.rmc-
foundation.org/images/PCRC%20Files/Mix%20Design/Making%20Pervious%20Concrete%20P
lacement%20Easy%20Using%20a%20Novel%20Admixture%20System.pdf
Brown H. J., Monitoring Pervious Concrete for Water Quality in a Laboratory and Field Environment,
Presentation, online, http://www.rmc-
foundation.org/images/PCRC%20Files/Hydrological%20&%20Environmental%20Design/Monit
oring%20Pervious%20Concrete%20for%20Water%20Quality%20in%20a%20Laboratory%20an
d%20Field%20Environment.pdf
Brown, R. A., Line, D.C., and Hunt, W.F., 2012, LID Treatment Train: Pervious Concrete with
Subsurface Storage in Series with Bioretention and Care with Seasonal High Water Tables.
Journal of Environmental Engineering. 2012.138, 689-697.
Cackler, E. T., Ferragut, T., Harrington, D. S., Rasmussen, R. O., and Wiegand, P, 2006, Evaluation of
U.S. and European Concrete Pavement Noise Reduction Methods, technical report prepared for
the Federal Highway Administration under Cooperative Agreement DTFH61-01-X-00042.
Chai, L., Kayhanian, M., Givens, B., Harvey, J.T., and Jones, D. 2012, Hydraulic Performance of Fully
Permeable Highway Shoulder for Storm Water Runoff Management. Journal of Environmental
Engineering. 138, 711-722.
Chen, Y., Wang, K. J., Liang, D., 2012, Mechanical properties of pervious cement concrete, Journal of
Central South University, 19, 3329-3334.
Chopra, M., Wanielista, M., Ballock, C., Spence, J., 2007, Construction and Maintenance Assessment of
Pervious Concrete Pavements, A final report prepared for the Florida Department of
Transportation, Orlando, FL.
Chopra, M., Hardin, M., and Wanielista, M., 2011, Pervious Pavements-Installation, Operations and
Strength, a final report prepared for the Florida Department of Transportation.
Chopra, M., Kakuturu, S., Ballock, C., Spence, J., and Wanielista, M., 2010. Effect of Rejuvenation
Methods on the Infiltration Rates of Pervious Concrete Pavements. Journal of Hydrologic
Engineering, Jun. 426-433.
Coughlin, J.P., Campbell, C.D.; and Mays, D.C., 2012, Infiltration and Clogging by Sand and Clay in a
Pervious Concrete Pavement System. Journal of Hydrologic Engineering, 17, 68-73.
Crouch, L.K., Smith, N., Walker, A.C., Dunn, T.R., and Sparkman, A. Determining Pervious PCC
Permeability with a Simple Triaxial Flexible-Wall Constant Head Permeameter. Presented online
: http://www.rmc-
foundation.org/images/PCRC%20Files/Specifications%20&%20Test%20Methods/Determining

43
%20Pervious%20PCC%20Permeability%20with%20a%20Simple%20Triaxial%20Flexible-
Wall%20Constant%20Head%20Permeameter.pdf
Crouch, L.K, Smith, N., Walker, A.C., Dunn, T.R., and Sparkman, A. Pervious PCC Compressive
Strength in the Laboratory and the Field: The Effects of Aggregate Properties and Compactive
Effort. Presented online : http://www.rmc-
foundation.org/images/PCRC%20Files/Construction%20Techniques/Pervious%20PCC%20Com
pressive%20Strength%20in%20the%20Laboratory%20and%20the%20Field.pdf
Crouch, L.K., Pitt, J.; and Hewitt, R., 2007, Aggregate Effects on Pervious Portland Cement Concrete
Static Modulus of Elasticity. Journal of Materials in Civil Engineering. Jul. 2007, pp. 561-568.
Cutler HE, Wang KJ, Schaefer VR, and Kevern JT, 2010, Resistance of Portland Cement Pervious
Concrete to Deicing Chemicals, Transportation Research Record: Journal of the Transportation
Research Board, No. 2164, Transportation Research Board of the National Academies,
Washington, D.C., pp. 98–104.
Deo O, Sumanasooriya M, and Neithalath N., 2010, Permeability Reduction in Pervious Concretes due
to Clogging: Experiments and Modeling, Journal of Materials in Civil Engineering, Jul. 741-751
Deo O, Neithalath N, 2010, Compressive Behavior of Pervious Concretes and a Quantification of the
Influence of Random Pore Structure Features. Materials Science and Engineering A., 528, 402-
412.
Deo O, Neithalath N, 2011, Compressive Response of Pervious Concretes Proportioned for Desired
Porosities. Construction and Building Materials, 25, 4181-4189.
Delatte N, Mrkajic A, and Miller DI., 2009, Field and Laboratory Evaluation of Pervious Concrete
Pavements. Transportation Research Record: Journal of the Transportation Research Board, No.
2113, Transportation Research Board of the National Academies, Washington, D.C., pp. 132–
139.
Dougherty M, Hein M, Martina BA, and Ferguson BK, 2011, Quick Surface Infiltration Test to Assess
Maintenance Needs on Small Pervious Concrete Sites. Journal of Irrigation and Drainage
Engineering, 137, 553-563.
Earles TA, WRE D, Keyes J, and Claffey M, 2008, Monitoring of Pervious Pavement/Infiltration Bed
System in Aurora, Colorado, World Environmental and Water Resources Congress. Ahupua'a.
Environmental Protection Agency, NPDES, Stormwater BMPs, Pervious Concrete Pavement website:
http://cfpub.epa.gov/npdes/stormwater/menuofbmps/index.cfm?action=browse&Rbutton=detail
&bmp=137&minmeasure=5
Gaedicke, Cristián, Armando Marines, and Farel Miankodila. 2014, A method for comparing cores and
cast cylinders in virgin and recycled aggregate pervious concrete. Construction and Building
Materials 52, 494-503.
44
Garber S, Rasmussen RO, and Harrington D, 2011, Guide to Cement-Based Integrated Pavement
Solutions, Technical report prepared for the Portland Cement Association.
Gesoğlu, M., Güneyisi, E., Khoshnaw, G., and İpek, S. 2014. Investigating properties of pervious
concretes containing waste tire rubbers. Construction and Building Materials, 63, 206-213.
Goede W and Haselbach L, 2012, Investigation into the Structural Performance of Pervious Concrete.
Journal of Transportation Engineering, 138, 98-104.
Gogo-Abite, I., Chopra, M., & Uju, I. 2013. Evaluation of Mechanical Properties and Structural
Integrity for Pervious Concrete Pavement Systems. Journal of Materials in Civil Engineering,
26(6).
Golroo A and Tighe SL. 2009, Use of Soft Computing Applications to Model Pervious Concrete
Pavement Condition in Cold Climates, Journal of Transportation Engineering, 135,791-800.
Golroo A and Tighe SL. 2010, Developing an Overall Combined Condition Index for Pervious Concrete
Pavements Using a Specific Panel Rating Method. Transportation Research Record: Journal of
the Transportation Research Board, No. 2153, Transportation Research Board of the National
Academies, Washington, D.C., 2010, pp. 40-48.
Golroo A, Tighe SL, 2011, Alternative modeling framework for pervious concrete pavement condition
analysis. Construction and Building Materials, 25, 4043-4051.
Golroo A. and Tighe SL., 2012a, Development of Panel Rating Protocol and Condition Evaluation
Model for Pervious Concrete Pavement, Journal of Transportation Engineering . 138, 634-648.
Golroo A. and Tighe SL., 2012b, Pervious Concrete Pavement Performance Modeling Using the
Bayesian Statistical Technique. Journal of Transportation Engineering, 138, 603-609.
Golroo A. and Tighe SL., 2012c, Development of Pervious Concrete Pavement Performance Models
Using Expert Opinions. Journal of Transportation Engineering, 138, 634-648.
Golroo A. and Tighe SL., 2012d, Pervious Concrete Pavement Performance Modeling: an Empirical
Approach in Cold Climates, Canadian Journal of Civil Engineering, 39, 1100-1112.
Guthrie WS, DeMille CB, and Eggett DL. 2010, Effects of Soil Clogging and Water Saturation on
Freeze–Thaw Durability of Pervious Concrete. Transportation Research Record: Journal of the
Transportation Research Board, No.2164, Transportation Research Board of the National
Academies, Washington, D.C., 2010, pp. 89–97.
Haselbach L., Poor, C., & Tilson, J. 2014. Dissolved zinc and copper retention from stormwater runoff
in ordinary portland cement pervious concrete. Construction and Building Materials, 53, 652-
657.
Haselbach L, Valavala S, Montes F., 2006, Permeability Predictions for Sand-Clogged Portland Cement
Pervious Concrete Pavement Systems. Journal of Environmental Management, 81, 42-49.

45
Haselbach L, 2010, Potential for Clay Clogging of Pervious Concrete under Extreme Conditions,
Journal of Hydrologic Engineering, 15, 67-69.
Haselbach L, Boyer M, Kevern JT, and Schaefer VR. 2011, Cyclic Heat Island Impacts in Traditional
versus Pervious Concrete Pavement Systems. TRB 2011 Annual Meeting.
Hein MF, Dougherty, M., & Hobbs, T. 2013. Cleaning Methods for Pervious Concrete Pavements.
International Journal of Construction Education and Research, 9(2), 102-116.
Henderson V, Tighe S, and Norris J, 2009, Pervious Concrete Pavement-Integrated Laboratory and Field
Study. Transportation Research Record: Journal of the Transportation Research Board, No.
2113, Transportation Research Board of the National Academies, Washington, D.C., pp. 13-21.
Henderson V. and Tighe S., 2011, Evaluation of pervious concrete pavement permeability renewal
maintenance methods at field sites in Canada. Canadian Journal of Civil Engineering. 38, 1404-
1413.
Henderson V. and Tighe S., 2012, Evaluation of Pervious Concrete Pavement Performance in Cold
Weather Climates. International Journal of Pavement Engineering. 13(3), 197-208.
Herb WR, Janke B, Mohseni O, Stefan HG., 2008, Ground surface temperature simulation for different
land covers. Journal of Hydrology, 356, 327-343.
Hesami, S., Ahmadi, S., and Nematzadeh, M. 2014. Effects of rice husk ash and fiber on mechanical
properties of pervious concrete pavement. Construction and Building Materials, 53, 680-691.
Houle KM, 2008, Winter Performance Assessment of Permeable Pavements: A comparative study of
porous asphalt, pervious concrete, and conventional asphalt in a northern climate. M.S. Thesis,
University of New Hampshire.
Huang BS, Wu H, Shu X, Burdette EG. 2010, Laboratory Evaluation of Permeability and Strength of
Polymer-Modified Pervious Concrete. Construction and Building Materials, 24, 818-823.
Izevbekhei B, 2008, Pervious Concrete, TERRA Fact Sheet, November 2008.
Joung Y, Grasley ZC. 2008, Evaluation and Optimization of Durable Pervious Concrete for Use in
Urban Areas. Research Report SWUTC/08/167163-1.
Kayhanian M, Anderson D, Harvey JT, Jones D, Muhunthan B., 2012, Permeability Measurement and
Scan Imaging to Assess Clogging of Pervious Concrete Pavements in Parking Lots. Journal of
Environmental Management, 95, 114-123.
Kevern JT, Wang K, Suleiman MT, and Schaefer VR, 2005, Mix Design Development for Pervious
Concrete in Cold Weather Climates. Proceedings of the 2005 Mid-Continent Transportation
Research Symposium, Ames, Iowa, August 2005.

46
Kevern JT, Wang K, Suleiman MT, and Schaefer VR, 2006, Pervious Concrete Construction: Methods
and Quality Control. NRMCA Concrete Technology Forum: Focus on Pervious Concrete, May
24-25, Nashville, TN.
Kevern JT, Schaefer VR, Wang K, and Suleiman MT, 2008a, Pervious Concrete Mixture Proportions
for Improved Freeze-Thaw Durability. Journal of ASTM International, 5(2), Paper ID
JAI101320
Kevern JT, Wang K, and Schaefer VR, 2008b, Pervious Concrete in Severe Exposures- Development of
pollution-reducing pavement for northern cities. Concrete international, July, 2008, 43-49.
Kevern JT, Wang K, and Schaefer VR, 2008c, Self-Consolidating Pervious Concrete. The Third North
American Conference on the Design and Use of Self-Consolidating Concrete (SCC08).
Kevern JT, Wang K, and Schaefer VR, 2008d, A Novel Approach to Characterize Entrained Air Content
in Pervious Concrete. Journal of ASTM International, 5(2), Paper ID JAI101434.
Kevern JT, Schaefer VR, and Wang K, 2009a, Predicting Performance of Pervious Concrete using Fresh
Unit Weight. NRMCA Concrete Technology Forum: Focus on Performance Prediction, May 13-
15.
Kevern JT, Schaefer VR, and Wang K, 2009b, Evaluation of Pervious Concrete Workability Using
Gyratory Compaction. Journal of Materials in Civil Engineering. Dec. 764-770
Kevern JT, Schaefer VR, and Wang K, 2009c, Temperature Behavior of Pervious Concrete Systems,
Transportation Research Record: Journal of the Transportation Research Board, No. 2098,
Transportation Research Board of the National Academies, Washington, D.C., pp. 94–101.
Kevern JT, Wang K, and Schaefer VR, 2010a, Effect of Coarse Aggregate on the Freeze-Thaw
Durability of Pervious Concrete. Journal of Materials In Civil Engineering . May. 469-475.
Kevern JT, 2010b, Evolution of Portland cement pervious concrete construction. Challenges,
Opportunities and Solutions in Structural Engineering, and Construction – Ghafoori (ed.), 471-
478.
Kevern JT, 2011, Operation and Maintenance of Pervious Concrete Pavements. TRB Annual Meeting.
11-0656.
Kwiatkowski M, Welker AL, Traver RG, Vanacore M, and Ladd T. 2007, Evaluation of an Infiltration
Best Management Practice Utilizing Pervious Concrete. Journal of the American Water
Resources Association. 43(5), 1208-1222.
Kuo WT, Liu CC, Su DS, 2013, Use of Washed Municipal Solid Waste Incinerator Bottom Ash in
Pervious Concrete, Cement and Concrete Composites, DOI:
http://dx.doi.org/10.1016/j.cemconcomp.2013.01.001
Lee MG., Chiu CT, Kan YC, Yen T. 2009, Experimental Study of Pervious Concrete on Parking Lot.
GeoHunan International Conference. 125-131.
47
Leung CK, and Grasley ZC, 2012, Poromechanical Damping of Cementitious Materials. Journal of
Materials in Civil Engineering, 24, 232-238.
Lian C, Zhuge Y. and Beecham S. 2011a, Modelling Pervious Concrete under Compression Loading - A
Discrete Element Approach. Advanced Materials Research, 168-170, pp. 1590-1600.
Lian C, Zhuge Y. and Beecham S. 2011b, Numerical Simulation of the Mechanical Behavior of Porous
Concrete. Engineering Computations: International Journal for Computer-Aided Engineering and
Software, 28(8), pp. 984-1002.
Li H., Harvey JT, Holland TJ, and Kayhanian M. 2013a, The use of reflective and permeable pavements
as a potential practice for heat island mitigation and stormwater management. Environmental
Research Letters 8, 015023.
Li H., Kayhanian, M., & Harvey, J. T. 2013b. Comparative field permeability measurement of
permeable pavements using ASTM C1701 and NCAT permeameter methods. Journal of
environmental management, 118, 144-152.
Li H., Harvey J., and Ge Z. 2014. Experimental investigation on evaporation rate for enhancing
evaporative cooling effect of permeable pavement materials. Construction and Building
Materials, 65, 367-375.
Li JS, 2009, Mix Design of Pervious Recycled Concrete. GeoHunan International Conference, 103-108.
Luck JD, Workman SR, Higgins SF. and Coyne MS., 2006, Hydrologic Properties of Pervious Concrete.
Transactions of the ASABE. 49(6), 1807-1813.
Luck JD, Workman SR, Coyne MS, Higgins SF., 2008, Solid Material Retention and Nutrient Reduction
Properties of Pervious Concrete Mixtures, Biosystems Engineering. 100, 401-408.
Luck JD, Workman SR, Coyne MS, Higgins SF., 2009, Consequences of Manure Filtration through
Pervious Concrete during Simulated Rainfall Events. Biosystems Engineering. 102, 417-423.
Manahiloh KN, Muhunthan B, Kayhanian M, and Gebremariam SY, 2012, X-Ray Computed
Tomography and Nondestructive Evaluation of Clogging in Porous Concrete Field Samples.
Martin III, W. D., Kaye, N. B., & Putman, B. J. 2014. Impact of vertical porosity distribution on the
permeability of pervious concrete. Construction and Building Materials, 59, 78-84.
Mbanaso FU, Coupe SJ, Charlesworth SM, Nnadi EO, 2013, Laboratory-Based Experiments to
Investigate the Impact of Glyphosate-Containing Herbicide on Pollution Attenuation and
Biodegradation in a Model Pervious Paving System, Chemosphere, 90, 737-746.
McCain GN, Suozzo MJ, Dewoolkar MM, 2010, A Laboratory Study on the Effects of Winter Surface
Applications on the Hydraulic Conductivity of Porous Concrete Pavements” Transportation
Research Board 2010 Annual Meeting CD-ROM.
48
Mohammed, B. S., Nuruddin, M. F., and Dayalan, Y. A. P. 2013, Apr. High permeable concrete
incorporating pozzolanic materials-An experimental investigation. In Business Engineering and
Industrial Applications Colloquium (BEIAC), 2013 IEEE (pp. 657-661). IEEE.
Montes F. and Haselbach L. 2006, Measuring Hydraulic Conductivity in Pervious Concrete,
Environmental Engineering Science, 23(6), 960-969.
Morgenroth J and Buchan GD, 2009, Soil Moisture and Aeration beneath Pervious and Impervious
Pavements, Arboriculture and Urban Forestry, 35(3), 135–141.
Morgenroth J, Buchan GD, and Scharenbroch BC, 2013, Belowground Effects of Porous Pavements-
Soil Moisture and Chemical Properties, Ecological Engineering, 51, 221-228.
Neithalath N., Weiss J, and Olek J, 2006, Characterizing Enhanced Porosity Concrete Using Electrical
Impedance to Predict Acoustic and Hydraulic Performance, Cement and Concrete Research, 36,
2074–2085.
Neithalath N., 2007, Extracting the Performance Predictors of Enhanced Porosity Concretes from
Electrical Conductivity Spectra. Cement and Concrete Research. 37, 796-804.
Neithalath N., Weiss J, and Olek J, Predicting the Permeability of Pervious Concrete (Enhanced Porosity
Concrete) from Non-Destructive Electrical Measurements, Presented online:
https://fp.auburn.edu/heinmic/perviousconcrete/Porosity.pdf
Neithalath N, Bentz DP, and Sumanasooriya MS. 2010a, Predicting the Permeability of Pervious
Concrete - Advances in characterization of pore structure and transport properties. Concrete
international, May. 35-40.
Neithalath N, Sumanasooriya MS, Deo O, 2010b, Characterizing Pore Volume, Sizes, and Connectivity
in Pervious Concretes for Permeability Prediction. Materials Characterization. 61, 802-813.
Offenberg M. 2005, Producing Pervious Pavements-Hints for the engineer, contractor on placement of
pervious concrete. Concrete International, Mar. 2005, 50-54.
Putman BJ, Neptune AI, 2011, Comparison of test specimen preparation techniques for pervious
concrete pavements. Construction and Building Materials, 25, 3480–3485.
Rehder, B., Banh, K., and Neithalath, N. 2014. Fracture behavior of pervious concretes: The effects of
pore structure and fibers. Engineering Fracture Mechanics, 118, 1-16.
Rizvi R, Tighe S, Henderson V, and Norris J. 2010, Evaluating the Use of Recycled Concrete Aggregate
in Pervious Concrete Pavement. Transportation Research Record: Journal of the Transportation
Research Board, No. 2164, Transportation Research Board of the National Academies,
Washington, D.C., 2010, pp. 132-140.
Sansalone J, Kuang X, Ying G, Ranieri V, 2012, Filtration and Clogging of Permeable Pavement
Loaded by Urban Drainage, Water Research, 46, 6763-6774.
49
Schaefer, V.R., K. Wang, M.T. Suleiman, and J.T. Kavern, 2006, Mix Design Development for Pervious
Concrete in Cold Weather Climates.Iowa DOT Final Report No. 2006-01.
Schaefer VR, Kevern JT, Lzevbekhai B, Wang K, Cutler HE, and Wiegand P. 2010, Construction and
Performance of Pervious Concrete Overlay at Minnesota Road Research Project. Transportation
Research Record: Journal of the Transportation Research Board, No. 2164, Transportation
Research Board of the National Academies, Washington, D.C., pp. 82–88.
Schaefer VT and Kevern JT, 2011, An Integrated Study of Pervious Concrete Mixture Design for
Wearing Course Applications, A final report prepared for Federal Highway Administration, U.S.
Department of Transportation.
Scholz M, Grabowiecki P, 2007, Review of Permeable Pavement Systems. Building and Environment,
42, 3830-3836.
Schwartz SS, 2010, Effective Curve Number and Hydrologic Design of Pervious Concrete Storm-Water
Systems. Journal of Hydrologic Engineering. Jun. 465-474.
Shen S, Burton M, Jobson B, Haselbach L. 2011, Pervious Concrete with Titanium Dioxide as a
Photocatalyst Compound for a Greener Urban Road Environment, A final report prepared for the
United States Department of Transportation.
Shen S, Burton M, Jobson B, Haselbach L. 2012, Pervious Concrete with Titanium Dioxide as a
Photocatalyst Compound for a Greener Urban Road Environment, Construction and Building
Materials 35, 874–883.
Shen, W., Shan, L., Zhang, T., Ma, H., Cai, Z., and Shi, H. 2013. Investigation on polymer–rubber
aggregate modified porous concrete. Construction and Building Materials, 38, 667-674.
Shu X, Huang BS, Wu H, Dong Q, Burdette EG., 2011, Performance Comparison of Laboratory and
Field Produced Pervious Concrete Mixtures. Construction and Building Materials, 25, 3187-
3192.
Sonebi M, and Bassuoni M, 2013, Investigating the Effect of Mixture Design Parameters on Pervious
Concrete by Statistical Modeling, Construction and Building Materials, 38, 147-154.
Sriravindrarajah R, Do HM, Nguyen LD, and Aoki Y. 2011, Effect of clogging on the water
permeability of pervious concrete. Incorporating Sustainable Practice in Mechanics of Structures
and Materials-Fragomeni, Venkatesan, Lam and Setunge (eds). 873-876.
Starke P, Göbel P, and Coldewey WG., 2010, Urban Evaporation Rates for Water-Permeable Pavement,
Water Science and Technology-WST, 62(5), 1161-1169.
Starke P, Göbel P, and Coldewey WG., 2011, Effects on Evaporation Rates from Different Water-
Permeable Pavement Designs. Water Science and Technology. 63.11, 2619-2627.
Suleiman, MT, Kevern, J, Schaefer, VR, and Wang K, Effect of Compaction Energy on Pervious
Concrete Properties. Presented online: http://www.rmc-
50
foundation.org/images/PCRC%20Files/Construction%20Techniques/Effect%20of%20Compacti
on%20Energy%20on%20Pervious%20Concrete%20Properties.pdf
Sumanasooriya MS, Bentz DP, and Neithalath N, 2009, Predicting the Permeability of Pervious
Concretes from Planar Images. NRMCA Concrete Technology Forum: Focus on Performance
Prediction. May 13-15, pp. 11.
Sumanasooriya MS and Neithalath N. 2011, Pore Structure Features of Pervious Concretes Proportioned
for Desired Porosities and Their Performance Prediction, Cement and Concrete Composites, 33,
778-787.
Sumanasooriya MS, Deo O, and Neithalath N. 2012, Particle Packing-Based Material Design
Methodology for Pervious Concretes. ACI Materials Journal, 109(2), March-April, 205-214.
Tawatchai T, Sata V, Chindaprasirt P, Jaturapitakkul C, 2012, Pervious High-Calcium Fly Ash
Geopolymer Concrete. Construction and Building Materials, 30, 366-371.
Tennis PD, Leming ML, and Akers DJ. 2004, Pervious Concrete Pavement. Portland Cement
Association. PCA Serial No. 2828.
Tian, B., Liu, Y., Niu, K., Li, S., Xie, J., and Li, X. 2013. Reduction of Tire-Pavement Noise by Porous
Concrete Pavement. Journal of Materials in Civil Engineering, 26(2), 233-239.
Tyner JS, Wright WC, Dobbs PA., 2009, Increasing Exfiltration from Pervious Concrete and
Temperature Monitoring. Journal of Environmental Management, 90, 2636-2641.
Ullate EG, Lopez EC, Fresno DC, Bayon JR. 2011, Analysis and Contrast of Different Pervious
Pavements for Management of Storm-Water in a Parking Area in Northern Spain. Water Resour
Manage, 25,1525–1535.
Vancura ME, MacDonald K, Khazanovich L. 2011a, Microscopic Analysis of Paste and Aggregate
Distresses in Pervious Concrete in a Wet, Hard Freeze Climate. Cement and Concrete
Composites, 33, 1080-1085.
Vancura ME, MacDonald K, Khazanovich L. 2011b, Structural Analysis of Pervious Concrete
Pavement, Transportation Research Record: Journal of the Transportation Research Board, No.
2226, Transportation Research Board of the National Academies, Washington, D.C., pp. 13–20.
Vancura ME, MacDonald K, and Khazanovich L. 2012, Location and Depth of Pervious Concrete
Clogging Material before and after Void Maintenance with Common Municipal Utility Vehicles.
Journal of Transportation Engineering, 138, 332-338.
Volder A, Watson T, Viswanathan B , 2009, Potential Use of Pervious Concrete for Maintaining
Existing Mature Trees During and after Urban Development, Urban Forestry and Urban
Greening, 8, 249-256.

51
Wanielista M, Chopra M, Spence J, Ballock C. 2007, Hydraulic Performance Assessment of Pervious
Concrete Pavements for Stormwater Management Credit. A final report prepared for the Florida
Department of Transportation, Orlando, FL.
Wang K, Schaefer VR, Kevern JT., and Suleiman MT. Development of Mix Proportion for Functional
and Durable Pervious Concrete. NRMCA Concrete Technology Forum: Focus on Pervious
Concrete, May 24-25, 2006, Nashville, TN.
Wang ZJ, Du XQ, Yang YS, Ye XY, 2012, Surface Clogging Process Modeling of Suspended Solids
during Urban Stormwater Aquifer Recharge, Journal of Environmental Sciences, 24(8), 1418-
1424.
Welker AL, Barbis JD, and Jeffers PA. 2012, A Side-By-Side Comparison of Pervious Concrete and
Porous Asphalt. Journal of the American Water Resources Association. 48(4), 809-819.
Wu H, Huang B, Shu X, Dong Q, Shrum E, Jared D, and Wu P, 2010, Laboratory Evaluation of Latex-
Modified Pervious Concrete, Transportation Research Board, 2010 Annual Meeting.
Wu H, Huang BS, Shu X, and Dong Q. 2011, Laboratory Evaluation of Abrasion Resistance of Portland
cement Pervious Concrete. Journal of Materials in Civil Engineering, May, 697-702.
Yakima County website, Regional Stormwater Management Program, Project: Low Impact
Development Demonstration Project, http://www.yakimacounty.us/stormwater/LID/project.htm
Yang, Z, 2011, Freezing-and-Thawing Durability of Pervious Concrete under Simulated Field
Conditions, ACI Materials Journal, 108(2), March-April, 187-195.
Yang Z, Brown H, and Cheney A, Influence of Moisture Conditions on Freeze and Thaw Durability of
Portland cement Pervious Concrete. Presented online : http://www.rmc-
foundation.org/images/PCRC%20Files/Durability%20&%20Maintenance/Influence%20of%20
Moisture%20Conditions%20on%20Freeze%20and%20Thaw%20Durabiltity%20of%20Portland
%20Cement%20Pervious%20Concrete.pdf
Yong CF, McCarthy DT, Deletic A, 2013, Predicting Physical Clogging of Porous and Permeable
Pavements, Journal of Hydrology, DOI: http://dx.doi.org/10.1016/j.jhydrol.2012.12.009
Zaldo, M. 2006, Pervious Concrete Pavements Industry Focus, National Ready Mixed Concrete
Association, presented on line: www.NRMCA.org
52
Chapter 4 Field Performance of Pervious Concrete Sections
The field testing consisted of 1) an infiltration rate test by using ASTM C1701 “Standard Test
Method for Infiltration Rate of in Place Pervious Concrete” at five or more locations within each case
study, and 2) a pavement condition survey performed by an FHWA-certified technician. A lab
simulation study by Haselbach (2006) revealed that “extreme events with substantial deposition of clay
(in runoff) on a pervious concrete pavement will substantially reduce its service capability, even
temporarily fully clogging the pavement.” However, sweeping and rinsing (e.g., subsequent rainfall)
restored permeability to acceptable levels. As such, infiltration will be measured after winter
maintenance operations and before and after sweeping or vacuum maintenance.
Two sections of pervious concrete were installed as part of the construction of the Mt Rose
Highway Water Quality Improvement Project (NDOT Project #MS-0431 [006] Contract #3501 on SR
431) and the Hwy 28 Improvement Project (NDOT Project # SI-0028 [007] Contract #3471 on SR28),
both in Incline Village, Nevada (Lake Tahoe). In addition, prior to the project construction, a test panel
was installed in Reno, Nevada. The Mt Rose section (Area A) is approximately 20 ft wide by 625 ft long
and was installed along the southern edge of Mt Rose highway northeast of College Drive. Secondly, an
approximately 20 ft wide by 350 ft long section was installed along the northern edge of State Route 28
west of Ponderosa Ave (Area B). NCE observed construction of the pervious concrete test panel and
construction of the two pervious concrete infiltration structures in the summer of 2012. After the
concrete had cured, NCE performed baseline distress surveys and infiltration testing of the pervious
concrete.
The slump, density, air void content, compressive and tensile strengths of the freshly mixed
pervious concrete were tested according to ASTM C143, C1688, C39, and C496, respectively. The
results are shown in Table 4.1. As displayed in the table, the slump of the freshly mixed pervious
concrete was 1/4 inch, the unit weight was 123.2 PCF, the total air voids was 22.8%, the average 7d and
28d compressive strengths were 2770 and 3330 psi, respectively, and the average 7d and 28d tensile
strengths were 300 and 315 psi, respectively.
The drainage of soil and roadway configuration (e.g., steep slope) were examined and documented
in the field testing of pervious concrete pavement. The infiltration was calculated according to the
following equation:
( )( ) (4.1)
where I is the infiltration rate (in/hr), M is the mass of the infiltrated water (lb), D is the infiltration ring
inside diameter (in), t is the time required for water to infiltrate concrete (sec), and K is a constant
(126.870 in-pounds)
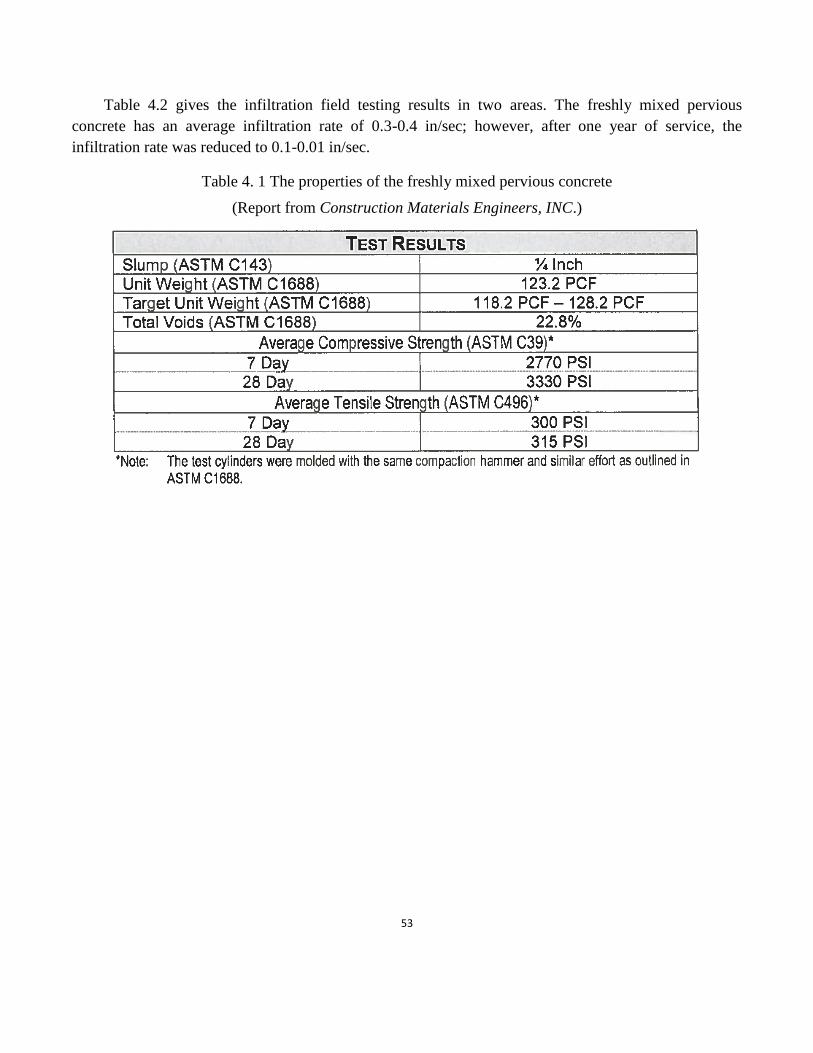
53
Table 4.2 gives the infiltration field testing results in two areas. The freshly mixed pervious
concrete has an average infiltration rate of 0.3-0.4 in/sec; however, after one year of service, the
infiltration rate was reduced to 0.1-0.01 in/sec.
Table 4. 1 The properties of the freshly mixed pervious concrete
(Report from Construction Materials Engineers, INC.)
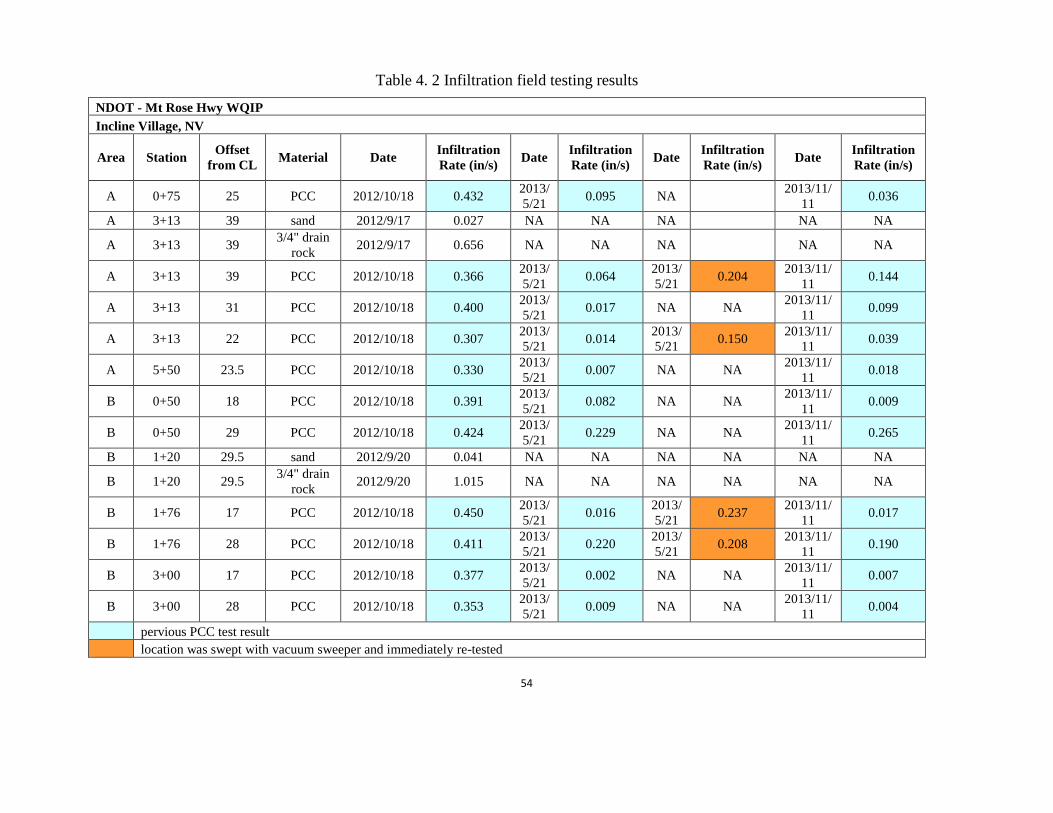
54
Table 4. 2 Infiltration field testing results
NDOT - Mt Rose Hwy WQIP
Incline Village, NV
Area Station Offset
from CL Material Date
Infiltration
Rate (in/s) Date
Infiltration
Rate (in/s) Date
Infiltration
Rate (in/s) Date
Infiltration
Rate (in/s)
A 0+75 25 PCC 2012/10/18 0.432 2013/
5/21 0.095 NA
2013/11/
11 0.036
A 3+13 39 sand 2012/9/17 0.027 NA NA NA NA NA
A 3+13 39 3/4" drain
rock 2012/9/17 0.656 NA NA NA NA NA
A 3+13 39 PCC 2012/10/18 0.366 2013/
5/21 0.064
2013/
5/21 0.204
2013/11/
11 0.144
A 3+13 31 PCC 2012/10/18 0.400 2013/
5/21 0.017 NA NA
2013/11/
11 0.099
A 3+13 22 PCC 2012/10/18 0.307 2013/
5/21 0.014
2013/
5/21 0.150
2013/11/
11 0.039
A 5+50 23.5 PCC 2012/10/18 0.330 2013/
5/21 0.007 NA NA
2013/11/
11 0.018
B 0+50 18 PCC 2012/10/18 0.391 2013/
5/21 0.082 NA NA
2013/11/
11 0.009
B 0+50 29 PCC 2012/10/18 0.424 2013/
5/21 0.229 NA NA
2013/11/
11 0.265
B 1+20 29.5 sand 2012/9/20 0.041 NA NA NA NA NA NA
B 1+20 29.5 3/4" drain
rock 2012/9/20 1.015 NA NA NA NA NA NA
B 1+76 17 PCC 2012/10/18 0.450 2013/
5/21 0.016
2013/
5/21 0.237
2013/11/
11 0.017
B 1+76 28 PCC 2012/10/18 0.411 2013/
5/21 0.220
2013/
5/21 0.208
2013/11/
11 0.190
B 3+00 17 PCC 2012/10/18 0.377 2013/
5/21 0.002 NA NA
2013/11/
11 0.007
B 3+00 28 PCC 2012/10/18 0.353 2013/
5/21 0.009 NA NA
2013/11/
11 0.004
pervious PCC test result
location was swept with vacuum sweeper and immediately re-tested

55
4.1 Maintenance Activities
Maintenance Activities
The details of the maintenance activities will be provided by NCE. At the time of NCE’s initial
infiltration testing in mid-October, 2012, no maintenance activities such as brooming, sweeping, or
vacuum sweeping had been performed on the concrete sections. Because the winter snow season had not
yet started, no traction sand had yet been applied to the highways.
During the winter months, the traction sand was applied to the asphalt highway surfaces at both
locations. The quantity and timing of traction sand application was dependent upon the duration and
severity of winter storm events. Traction sand application rates and timing cannot be predicted at this
time. The de-icing compounds such as salt was applied to the asphalt highway surfaces at both locations.
Maintenance activities such as street sweeping and vacuuming were performed by NDOT maintenance
crews within the project area. Snow plows and snow removal equipment with tire chains were subjected
the slabs to greater load weights as well as cracking.
Key findings:
The slump of the freshly mixed pervious concrete was 1/4 inch, the unit weight was 123.2 PCF, the
total air voids was 22.8%, the average 7d and 28d compressive strengths were 2770 and 3330 psi,
respectively, and the average 7d and 28d tensile strengths were 300 and 315 psi, respectively.
The freshly mixed pervious concrete has an average infiltration rate of 0.3-0.4 in/sec; however, after
one year of service, the infiltration rate was reduced to 0.1-0.01 in/sec.
56
Chapter 5 Laboratory Investigation
5.1 Introduction
Cores from the field sites were collected by NDOT and NCE and shipped to WTI for laboratory
testing. Locations for the coring were situated throughout the length of the test sites at various distances
from the pavement edge. The cores were also collected from areas identified as having various levels of
distress (limited, moderate or severe). A total of 18 cores from the SR28 site and 22 cores from the
SR431 site were collected, as shown in Table 5.1. Cores from SR431 were collected on May 20, 2013,
cores from SR28 were collected on May 21, 2013, and slabs were harvested on May 23, 2013 for both
sites. Tests to evaluate engineering properties of the constructed test sections used the limited distress
cores, in addition to two slabs from each site. A secondary investigation looking at the concrete
microstructure used the distressed cores as well.
The typical engineering properties of interest for traditional concrete and pervious concrete were
tested in general accordance to ASTM standards. Since pervious concrete features interconnected voids
between aggregates (and thus high porosity and permeability), its strength and durability are of
significant concern. Compressive and tensile strength are important with respect to cracking, shear
capacity, anchorage capacity, and durability. The tensile strength of the concrete samples was
determined by testing the splitting tensile strength of cylinders (ASTM 496). The compressive strength
of concrete cylinders was determined according to ASTM C39 (Test Method for Compressive Strength
of Cylindrical Concrete Specimens).
Durability of the pervious concrete samples was assessed by abrasion resistance, and freeze–thaw
and salt-scaling resistance tests. The abrasion resistance of the cores was determined following ASTM
C1747 (Test Method for Determining Potential Resistance to Degradation of Pervious Concrete by
Impact and Abrasion), which uses the Los Angeles abrasion machine without the steel charge used for
aggregate durability. The freeze-thaw and salt scaling of concrete slabs was evaluated following the
BNQ NQ 2621-9010 (2002 standard of the Province of Quebec, Canada), as this is a laboratory test
method better representative of the field conditions than the ASTM C672.
Absorption capacity is an indicator of a concrete's resistance to degradation from various
environmental exposures, as much of this degradation is associated with the ingress of moisture into the
hardened concrete. As such, absorption properties of the concrete cores were determined using the test
methods outlined in ASTM C642 (Test Method for Density, Absorption, and Voids in Hardened
Concrete), which involves submerging dry test specimens and monitoring their weight change over
time. Alternatively, the total porosity of cored pervious concrete samples was measured following the
water displacement method developed by Montes (2005).
Performance tests consisted of drainage testing to assess infiltration rate. A falling head
permeability test was designed based on examples identified during the literature review (McCain, 2010;
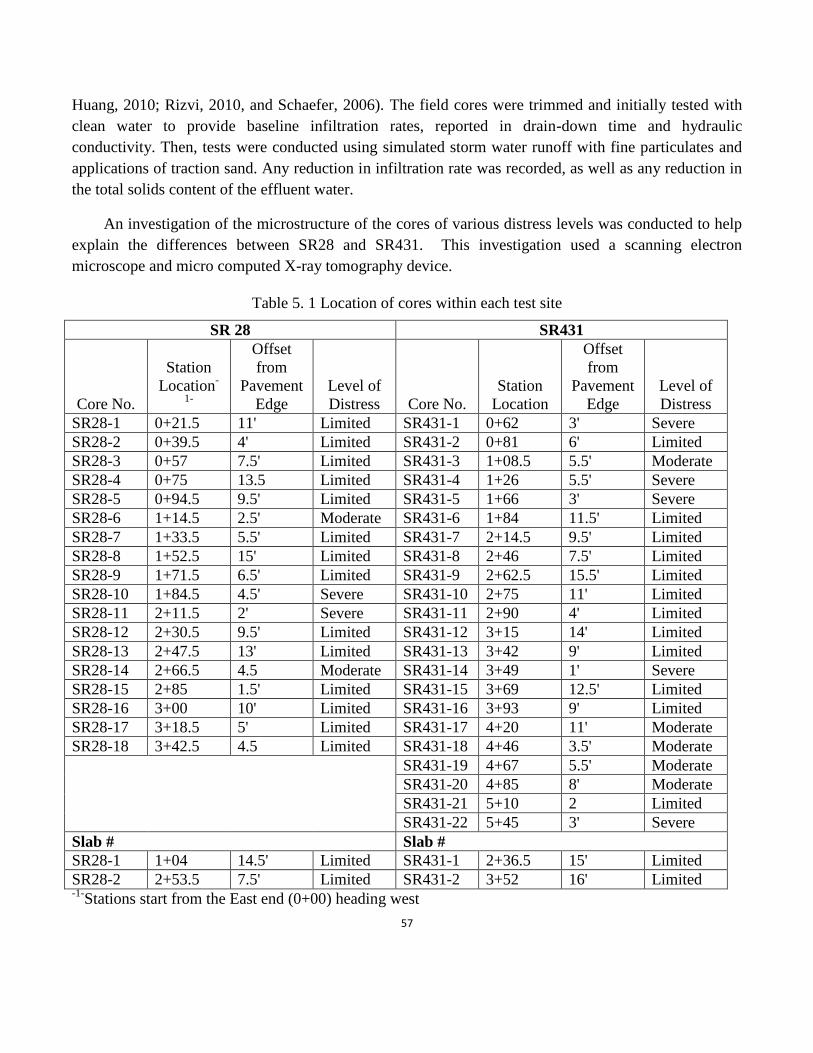
57
Huang, 2010; Rizvi, 2010, and Schaefer, 2006). The field cores were trimmed and initially tested with
clean water to provide baseline infiltration rates, reported in drain-down time and hydraulic
conductivity. Then, tests were conducted using simulated storm water runoff with fine particulates and
applications of traction sand. Any reduction in infiltration rate was recorded, as well as any reduction in
the total solids content of the effluent water.
An investigation of the microstructure of the cores of various distress levels was conducted to help
explain the differences between SR28 and SR431. This investigation used a scanning electron
microscope and micro computed X-ray tomography device.
Table 5. 1 Location of cores within each test site
SR 28 SR431
Core No.
Station
Location-
1-
Offset
from
Pavement
Edge
Level of
Distress Core No.
Station
Location
Offset
from
Pavement
Edge
Level of
Distress
SR28-1 0+21.5 11' Limited SR431-1 0+62 3' Severe
SR28-2 0+39.5 4' Limited SR431-2 0+81 6' Limited
SR28-3 0+57 7.5' Limited SR431-3 1+08.5 5.5' Moderate
SR28-4 0+75 13.5 Limited SR431-4 1+26 5.5' Severe
SR28-5 0+94.5 9.5' Limited SR431-5 1+66 3' Severe
SR28-6 1+14.5 2.5' Moderate SR431-6 1+84 11.5' Limited
SR28-7 1+33.5 5.5' Limited SR431-7 2+14.5 9.5' Limited
SR28-8 1+52.5 15' Limited SR431-8 2+46 7.5' Limited
SR28-9 1+71.5 6.5' Limited SR431-9 2+62.5 15.5' Limited
SR28-10 1+84.5 4.5' Severe SR431-10 2+75 11' Limited
SR28-11 2+11.5 2' Severe SR431-11 2+90 4' Limited
SR28-12 2+30.5 9.5' Limited SR431-12 3+15 14' Limited
SR28-13 2+47.5 13' Limited SR431-13 3+42 9' Limited
SR28-14 2+66.5 4.5 Moderate SR431-14 3+49 1' Severe
SR28-15 2+85 1.5' Limited SR431-15 3+69 12.5' Limited
SR28-16 3+00 10' Limited SR431-16 3+93 9' Limited
SR28-17 3+18.5 5' Limited SR431-17 4+20 11' Moderate
SR28-18 3+42.5 4.5 Limited SR431-18 4+46 3.5' Moderate
SR431-19 4+67 5.5' Moderate
SR431-20 4+85 8' Moderate
SR431-21 5+10 2 Limited
SR431-22 5+45 3' Severe
Slab # Slab #
SR28-1 1+04 14.5' Limited SR431-1 2+36.5 15' Limited
SR28-2 2+53.5 7.5' Limited SR431-2 3+52 16' Limited -1-
Stations start from the East end (0+00) heading west
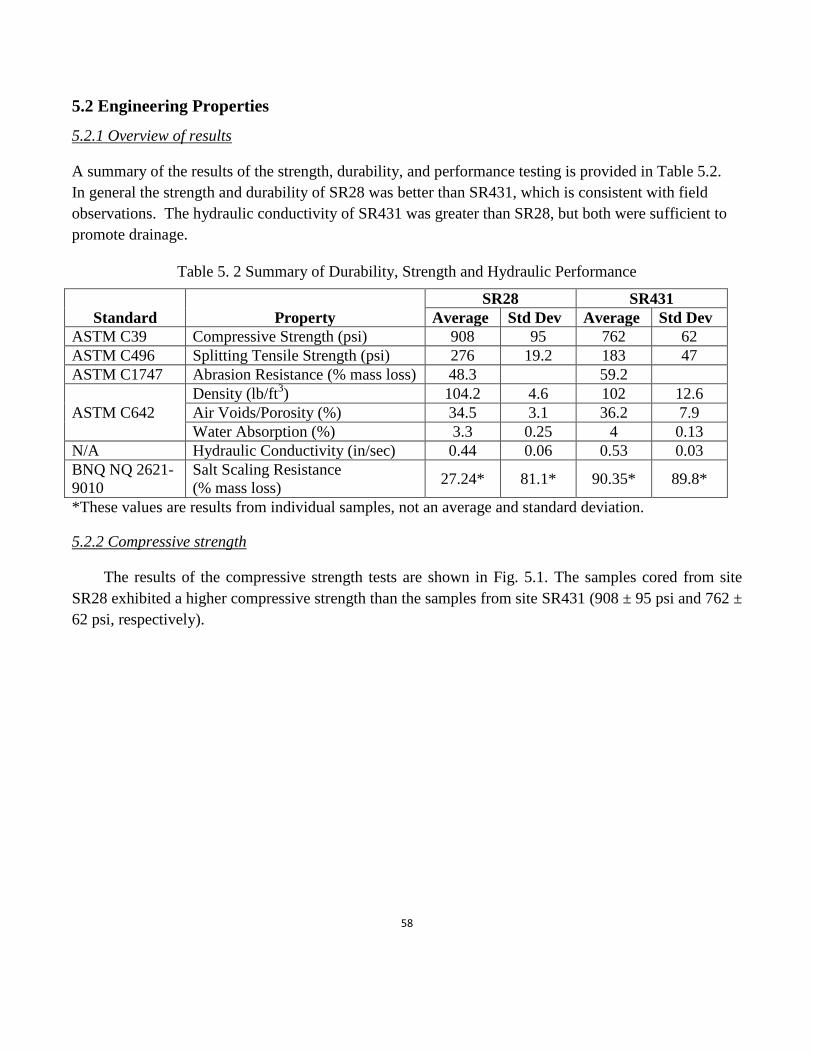
58
5.2 Engineering Properties
5.2.1 Overview of results
A summary of the results of the strength, durability, and performance testing is provided in Table 5.2.
In general the strength and durability of SR28 was better than SR431, which is consistent with field
observations. The hydraulic conductivity of SR431 was greater than SR28, but both were sufficient to
promote drainage.
Table 5. 2 Summary of Durability, Strength and Hydraulic Performance
SR28 SR431
Standard Property Average Std Dev Average Std Dev
ASTM C39 Compressive Strength (psi) 908 95 762 62
ASTM C496 Splitting Tensile Strength (psi) 276 19.2 183 47
ASTM C1747 Abrasion Resistance (% mass loss) 48.3 59.2
ASTM C642
Density (lb/ft3) 104.2 4.6 102 12.6
Air Voids/Porosity (%) 34.5 3.1 36.2 7.9
Water Absorption (%) 3.3 0.25 4 0.13
N/A Hydraulic Conductivity (in/sec) 0.44 0.06 0.53 0.03
BNQ NQ 2621-
9010
Salt Scaling Resistance
(% mass loss) 27.24* 81.1* 90.35* 89.8*
*These values are results from individual samples, not an average and standard deviation.
5.2.2 Compressive strength
The results of the compressive strength tests are shown in Fig. 5.1. The samples cored from site
SR28 exhibited a higher compressive strength than the samples from site SR431 (908 ± 95 psi and 762 ±
62 psi, respectively).
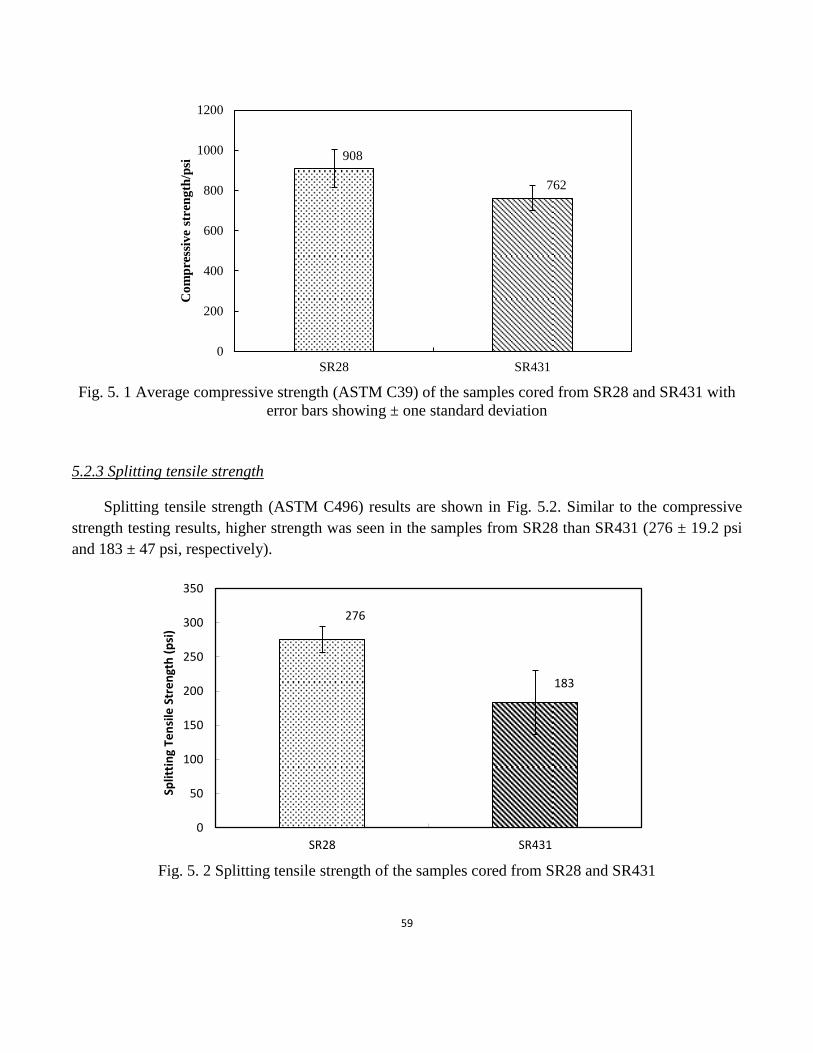
59
Fig. 5. 1 Average compressive strength (ASTM C39) of the samples cored from SR28 and SR431 with
error bars showing ± one standard deviation
5.2.3 Splitting tensile strength
Splitting tensile strength (ASTM C496) results are shown in Fig. 5.2. Similar to the compressive
strength testing results, higher strength was seen in the samples from SR28 than SR431 (276 ± 19.2 psi
and 183 ± 47 psi, respectively).
Fig. 5. 2 Splitting tensile strength of the samples cored from SR28 and SR431
908
762
0
200
400
600
800
1000
1200
SR28 SR431
Co
mp
ress
ive
stre
ng
th/p
si
276
183
0
50
100
150
200
250
300
350
SR28 SR431
Split
tin
g Te
nsi
le S
tre
ngt
h (
psi
)
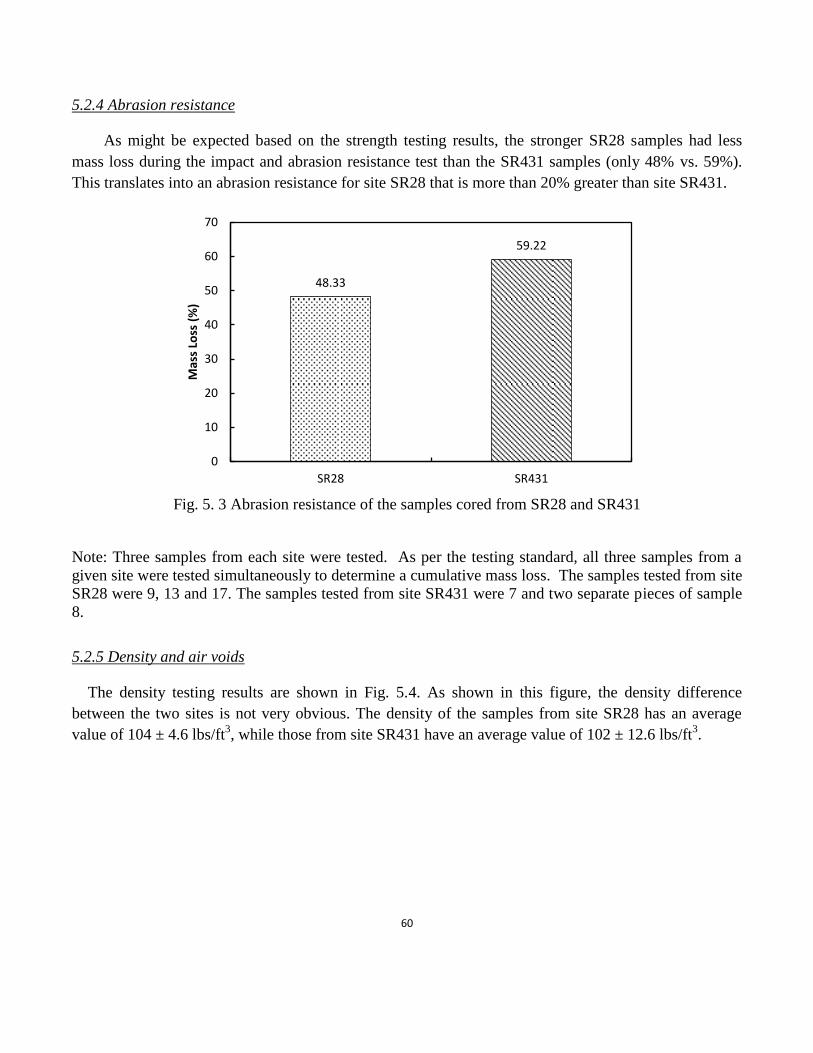
60
5.2.4 Abrasion resistance
As might be expected based on the strength testing results, the stronger SR28 samples had less
mass loss during the impact and abrasion resistance test than the SR431 samples (only 48% vs. 59%).
This translates into an abrasion resistance for site SR28 that is more than 20% greater than site SR431.
Fig. 5. 3 Abrasion resistance of the samples cored from SR28 and SR431
Note: Three samples from each site were tested. As per the testing standard, all three samples from a
given site were tested simultaneously to determine a cumulative mass loss. The samples tested from site
SR28 were 9, 13 and 17. The samples tested from site SR431 were 7 and two separate pieces of sample
8.
5.2.5 Density and air voids
The density testing results are shown in Fig. 5.4. As shown in this figure, the density difference
between the two sites is not very obvious. The density of the samples from site SR28 has an average
value of 104 ± 4.6 lbs/ft3, while those from site SR431 have an average value of 102 ± 12.6 lbs/ft
3.
48.33
59.22
0
10
20
30
40
50
60
70
SR28 SR431
Mas
s Lo
ss (
%)
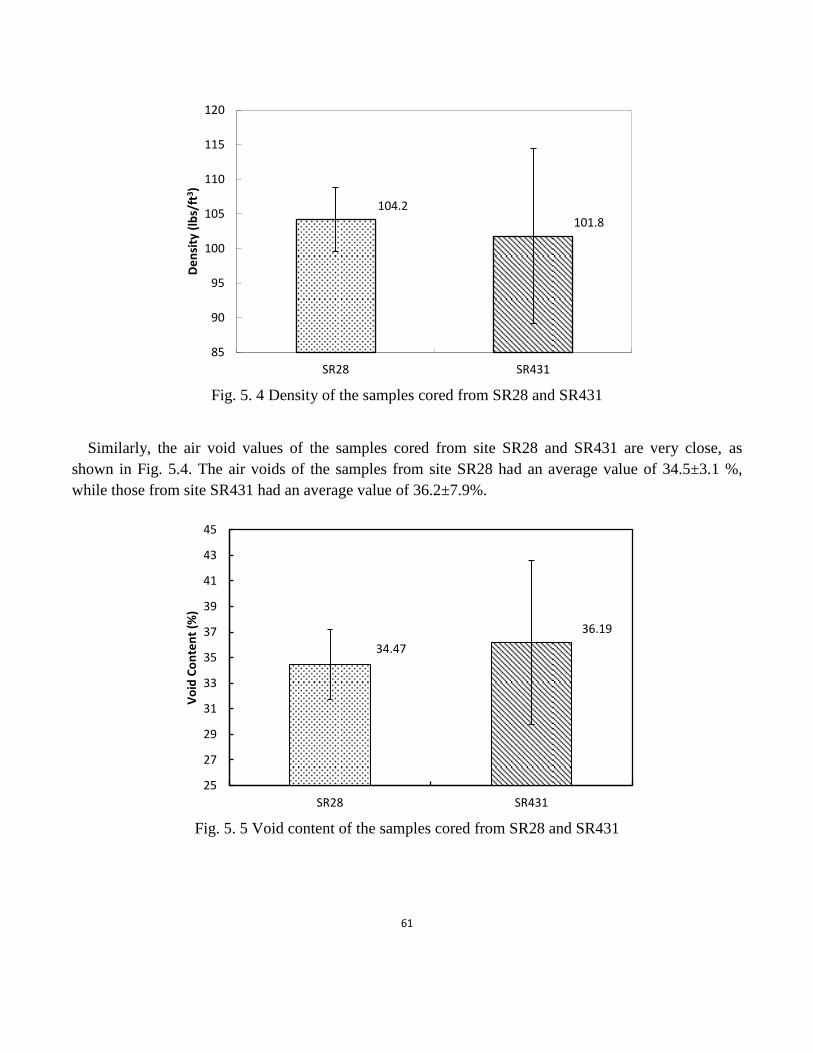
61
Fig. 5. 4 Density of the samples cored from SR28 and SR431
Similarly, the air void values of the samples cored from site SR28 and SR431 are very close, as
shown in Fig. 5.4. The air voids of the samples from site SR28 had an average value of 34.5±3.1 %,
while those from site SR431 had an average value of 36.2±7.9%.
Fig. 5. 5 Void content of the samples cored from SR28 and SR431
104.2
101.8
85
90
95
100
105
110
115
120
SR28 SR431
De
nsi
ty (
lbs/
ft3 )
34.47
36.19
25
27
29
31
33
35
37
39
41
43
45
SR28 SR431
Vo
id C
on
ten
t (%
)

62
Large deviations from the average in void content and density for samples from site SR431 indicate
an issue with placement and compaction of the pervious concrete installation at that site. Both sites
demonstrate a porosity much higher than required by the mix design. This is consistent with a lower than
expected compressive strength for both sites. The higher porosity and lower density of site SR431
relative to site SR28 is also consistent with a lower compressive strength for site SR431 relative to site
SR28.
5.2.6 Water Permeability
Although the values of the density and air voids are not remarkably different from these two sites, the
SR28 samples still shows a higher density and lower air void content. As a result, it is not surprising that
the hydraulic conductivity for samples from site SR431 is higher than for samples from site SR28, with
values of 0.44 ± 0.06 in/sec and 0.53 ± 0.03 in/sec, respectively. This is consistent with the proportional
relationship between the porosity and the permeability.
Fig. 5. 6 Hydraulic conductivity of the samples cored from SR28 and SR431
5.2.7 Water absorption
However, the water absorption difference of the samples cored from site SR28 and SR431 is
relatively higher than the density and the air voids, as shown in Fig. 5.7. The water absorption of the
samples from site SR28 has an average value of 3.3% ± 0.25%, while those from site SR431 have an
average value of 4.0% ± 0.13%, which is over 20% higher than the SR28 samples.
Unlike the density and the air voids, which are largely governed by the macro pores (with size of
centimeters to millimeters) of the samples, the value of the water absorption is largely determined by the
0.44
0.53
0.00
0.10
0.20
0.30
0.40
0.50
0.60
SR28 SR431
Hyd
rau
lic C
on
du
ctiv
ity
(in
/se
c)
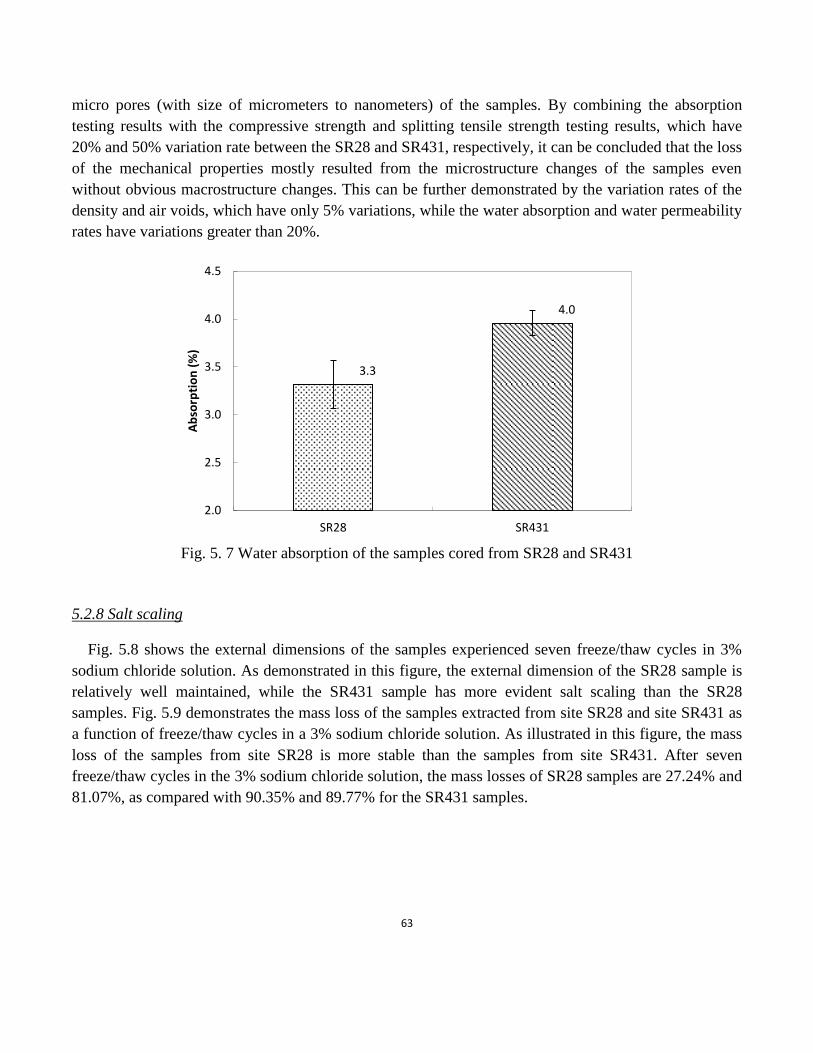
63
micro pores (with size of micrometers to nanometers) of the samples. By combining the absorption
testing results with the compressive strength and splitting tensile strength testing results, which have
20% and 50% variation rate between the SR28 and SR431, respectively, it can be concluded that the loss
of the mechanical properties mostly resulted from the microstructure changes of the samples even
without obvious macrostructure changes. This can be further demonstrated by the variation rates of the
density and air voids, which have only 5% variations, while the water absorption and water permeability
rates have variations greater than 20%.
Fig. 5. 7 Water absorption of the samples cored from SR28 and SR431
5.2.8 Salt scaling
Fig. 5.8 shows the external dimensions of the samples experienced seven freeze/thaw cycles in 3%
sodium chloride solution. As demonstrated in this figure, the external dimension of the SR28 sample is
relatively well maintained, while the SR431 sample has more evident salt scaling than the SR28
samples. Fig. 5.9 demonstrates the mass loss of the samples extracted from site SR28 and site SR431 as
a function of freeze/thaw cycles in a 3% sodium chloride solution. As illustrated in this figure, the mass
loss of the samples from site SR28 is more stable than the samples from site SR431. After seven
freeze/thaw cycles in the 3% sodium chloride solution, the mass losses of SR28 samples are 27.24% and
81.07%, as compared with 90.35% and 89.77% for the SR431 samples.
3.3
4.0
2.0
2.5
3.0
3.5
4.0
4.5
SR28 SR431
Ab
sorp
tio
n (
%)

64
Fig. 5. 8 External dimension of the samples from SR28 and SR431, after experiencing 7 freeze/thaw
cycles in 3% sodium solution.
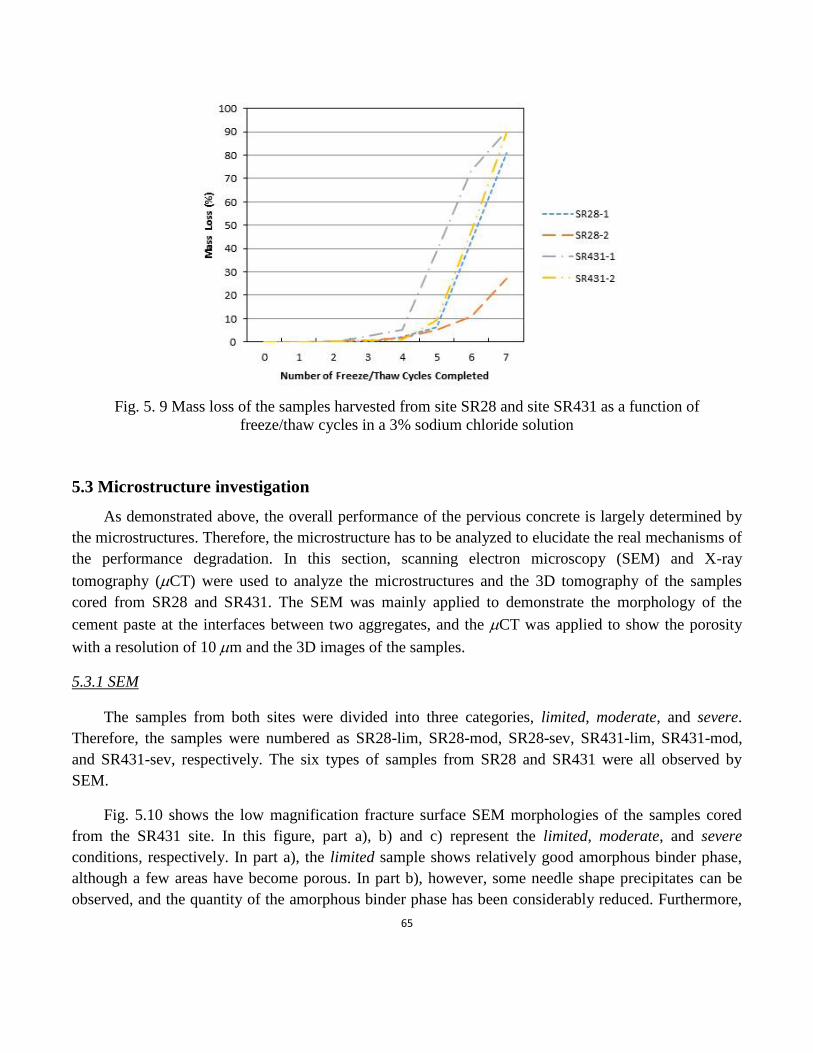
65
Fig. 5. 9 Mass loss of the samples harvested from site SR28 and site SR431 as a function of
freeze/thaw cycles in a 3% sodium chloride solution
5.3 Microstructure investigation
As demonstrated above, the overall performance of the pervious concrete is largely determined by
the microstructures. Therefore, the microstructure has to be analyzed to elucidate the real mechanisms of
the performance degradation. In this section, scanning electron microscopy (SEM) and X-ray
tomography (CT) were used to analyze the microstructures and the 3D tomography of the samples
cored from SR28 and SR431. The SEM was mainly applied to demonstrate the morphology of the
cement paste at the interfaces between two aggregates, and the CT was applied to show the porosity
with a resolution of 10 m and the 3D images of the samples.
5.3.1 SEM
The samples from both sites were divided into three categories, limited, moderate, and severe.
Therefore, the samples were numbered as SR28-lim, SR28-mod, SR28-sev, SR431-lim, SR431-mod,
and SR431-sev, respectively. The six types of samples from SR28 and SR431 were all observed by
SEM.
Fig. 5.10 shows the low magnification fracture surface SEM morphologies of the samples cored
from the SR431 site. In this figure, part a), b) and c) represent the limited, moderate, and severe
conditions, respectively. In part a), the limited sample shows relatively good amorphous binder phase,
although a few areas have become porous. In part b), however, some needle shape precipitates can be
observed, and the quantity of the amorphous binder phase has been considerably reduced. Furthermore,
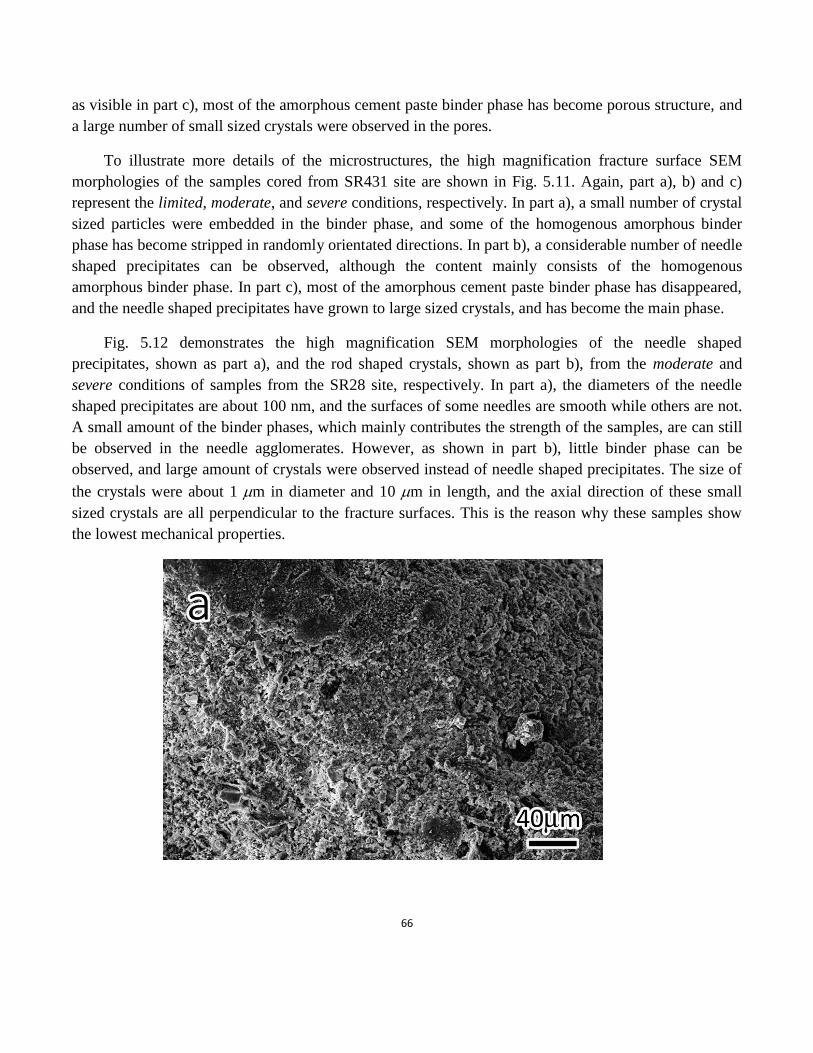
66
as visible in part c), most of the amorphous cement paste binder phase has become porous structure, and
a large number of small sized crystals were observed in the pores.
To illustrate more details of the microstructures, the high magnification fracture surface SEM
morphologies of the samples cored from SR431 site are shown in Fig. 5.11. Again, part a), b) and c)
represent the limited, moderate, and severe conditions, respectively. In part a), a small number of crystal
sized particles were embedded in the binder phase, and some of the homogenous amorphous binder
phase has become stripped in randomly orientated directions. In part b), a considerable number of needle
shaped precipitates can be observed, although the content mainly consists of the homogenous
amorphous binder phase. In part c), most of the amorphous cement paste binder phase has disappeared,
and the needle shaped precipitates have grown to large sized crystals, and has become the main phase.
Fig. 5.12 demonstrates the high magnification SEM morphologies of the needle shaped
precipitates, shown as part a), and the rod shaped crystals, shown as part b), from the moderate and
severe conditions of samples from the SR28 site, respectively. In part a), the diameters of the needle
shaped precipitates are about 100 nm, and the surfaces of some needles are smooth while others are not.
A small amount of the binder phases, which mainly contributes the strength of the samples, are can still
be observed in the needle agglomerates. However, as shown in part b), little binder phase can be
observed, and large amount of crystals were observed instead of needle shaped precipitates. The size of
the crystals were about 1 m in diameter and 10 m in length, and the axial direction of these small
sized crystals are all perpendicular to the fracture surfaces. This is the reason why these samples show
the lowest mechanical properties.
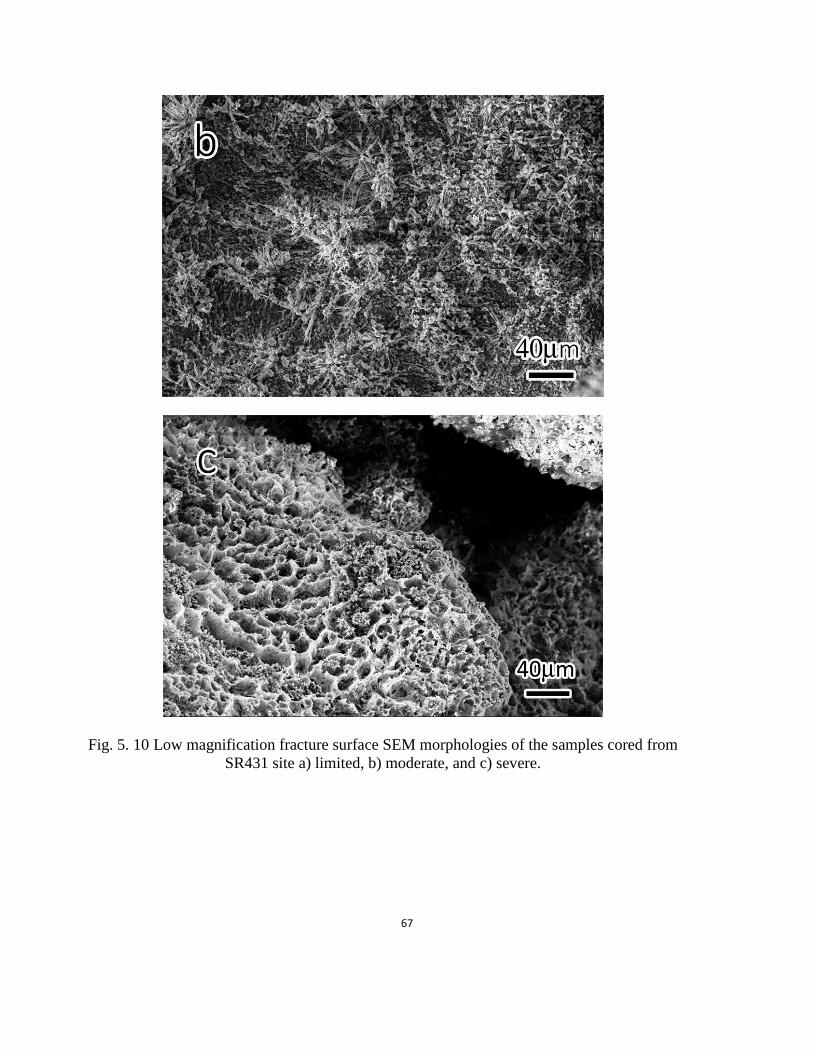
67
Fig. 5. 10 Low magnification fracture surface SEM morphologies of the samples cored from
SR431 site a) limited, b) moderate, and c) severe.
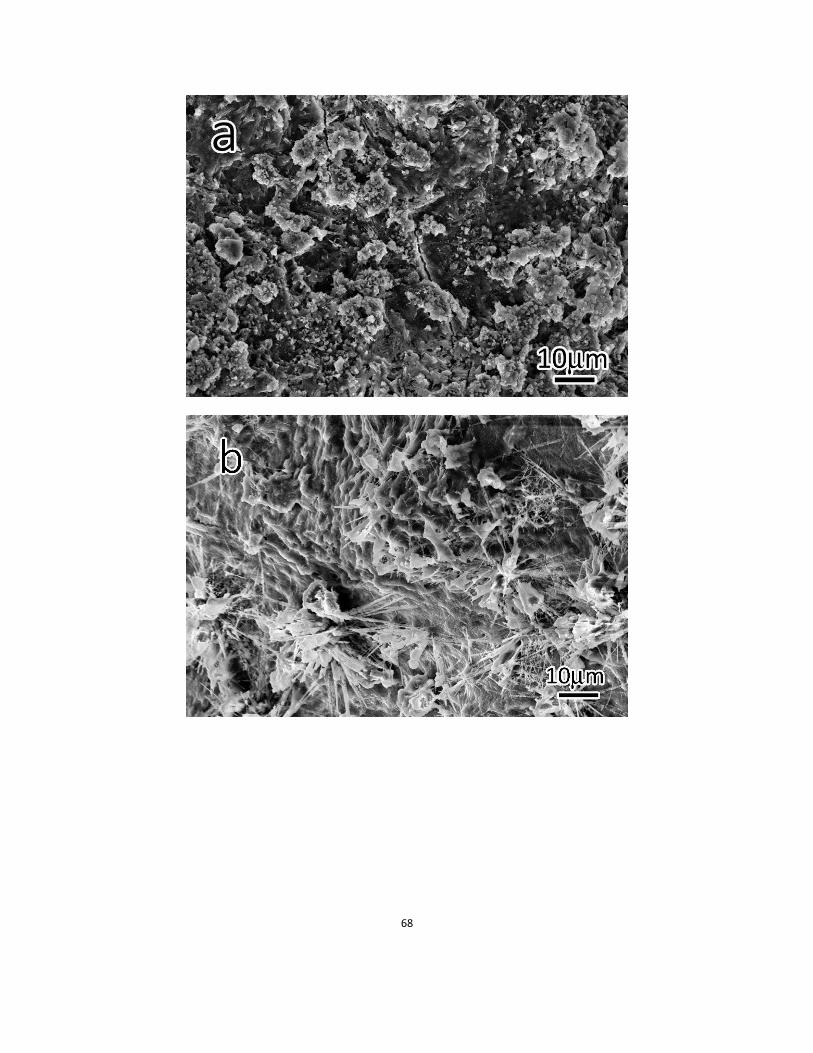
68
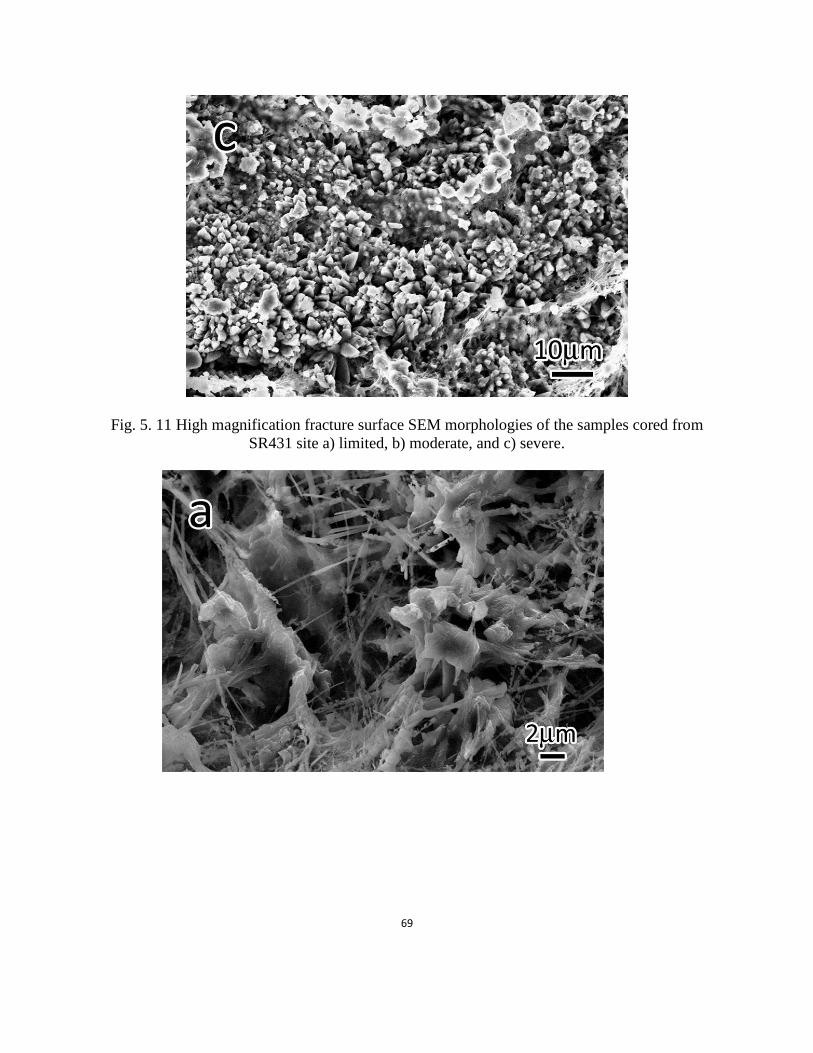
69
Fig. 5. 11 High magnification fracture surface SEM morphologies of the samples cored from
SR431 site a) limited, b) moderate, and c) severe.
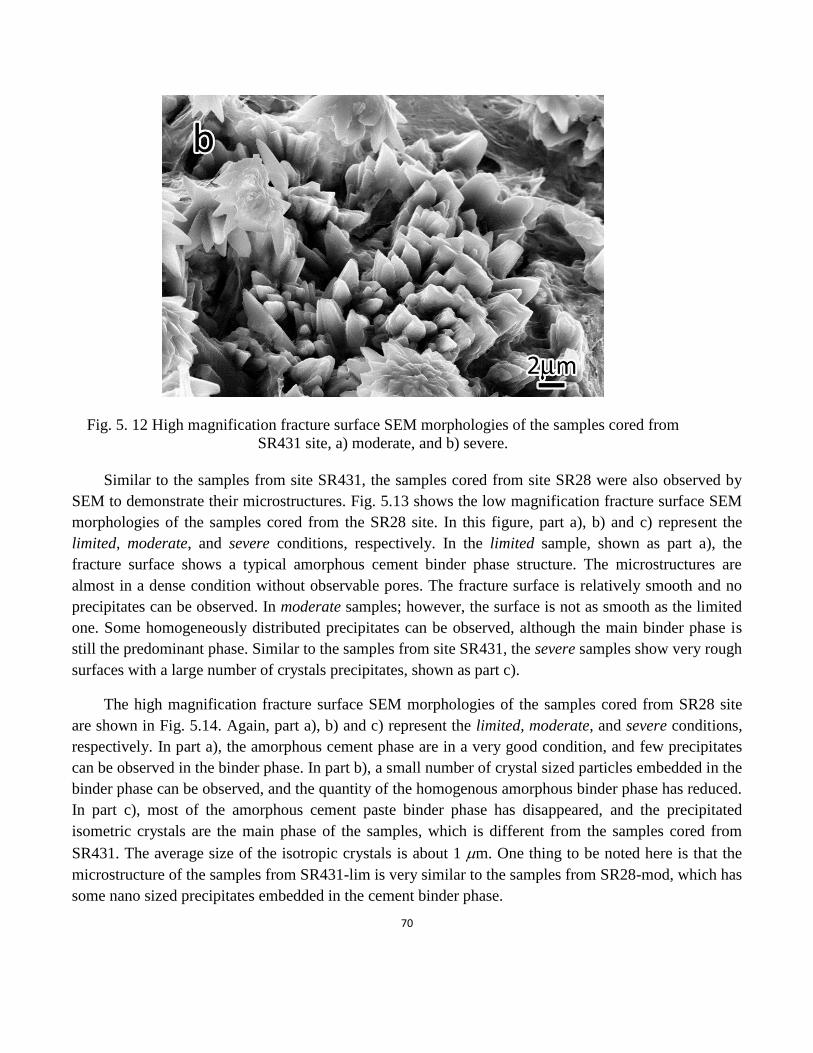
70
Fig. 5. 12 High magnification fracture surface SEM morphologies of the samples cored from
SR431 site, a) moderate, and b) severe.
Similar to the samples from site SR431, the samples cored from site SR28 were also observed by
SEM to demonstrate their microstructures. Fig. 5.13 shows the low magnification fracture surface SEM
morphologies of the samples cored from the SR28 site. In this figure, part a), b) and c) represent the
limited, moderate, and severe conditions, respectively. In the limited sample, shown as part a), the
fracture surface shows a typical amorphous cement binder phase structure. The microstructures are
almost in a dense condition without observable pores. The fracture surface is relatively smooth and no
precipitates can be observed. In moderate samples; however, the surface is not as smooth as the limited
one. Some homogeneously distributed precipitates can be observed, although the main binder phase is
still the predominant phase. Similar to the samples from site SR431, the severe samples show very rough
surfaces with a large number of crystals precipitates, shown as part c).
The high magnification fracture surface SEM morphologies of the samples cored from SR28 site
are shown in Fig. 5.14. Again, part a), b) and c) represent the limited, moderate, and severe conditions,
respectively. In part a), the amorphous cement phase are in a very good condition, and few precipitates
can be observed in the binder phase. In part b), a small number of crystal sized particles embedded in the
binder phase can be observed, and the quantity of the homogenous amorphous binder phase has reduced.
In part c), most of the amorphous cement paste binder phase has disappeared, and the precipitated
isometric crystals are the main phase of the samples, which is different from the samples cored from
SR431. The average size of the isotropic crystals is about 1 m. One thing to be noted here is that the
microstructure of the samples from SR431-lim is very similar to the samples from SR28-mod, which has
some nano sized precipitates embedded in the cement binder phase.
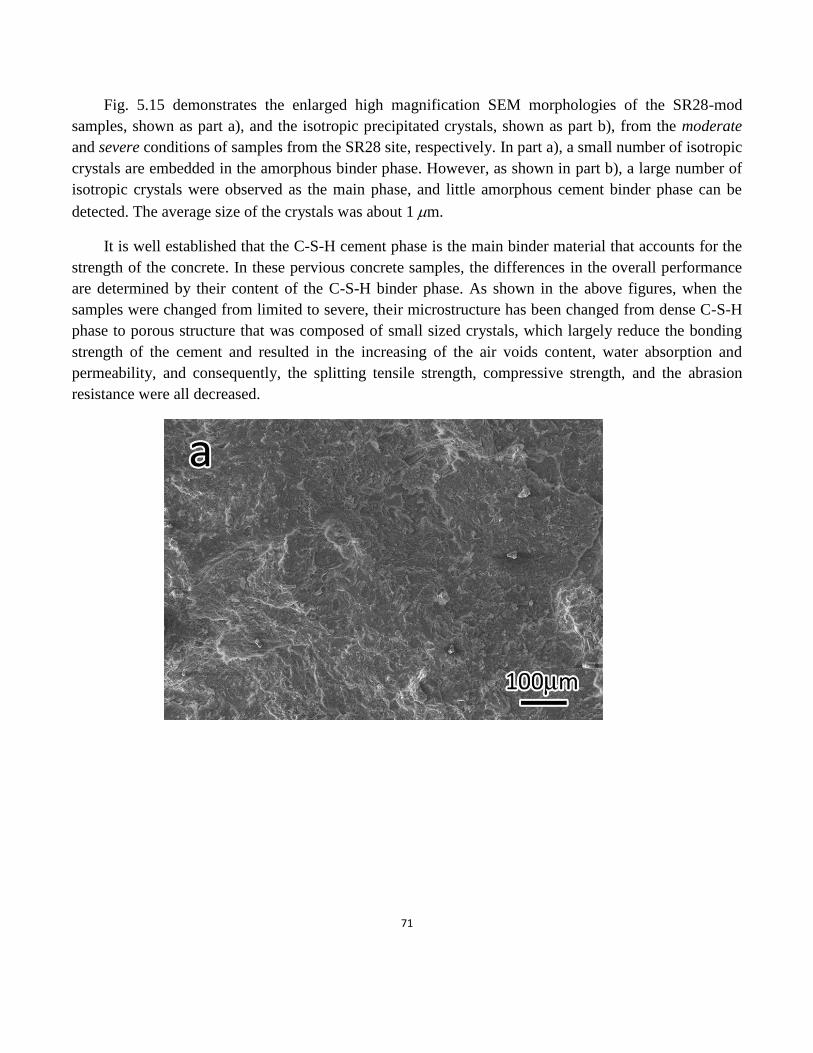
71
Fig. 5.15 demonstrates the enlarged high magnification SEM morphologies of the SR28-mod
samples, shown as part a), and the isotropic precipitated crystals, shown as part b), from the moderate
and severe conditions of samples from the SR28 site, respectively. In part a), a small number of isotropic
crystals are embedded in the amorphous binder phase. However, as shown in part b), a large number of
isotropic crystals were observed as the main phase, and little amorphous cement binder phase can be
detected. The average size of the crystals was about 1 m.
It is well established that the C-S-H cement phase is the main binder material that accounts for the
strength of the concrete. In these pervious concrete samples, the differences in the overall performance
are determined by their content of the C-S-H binder phase. As shown in the above figures, when the
samples were changed from limited to severe, their microstructure has been changed from dense C-S-H
phase to porous structure that was composed of small sized crystals, which largely reduce the bonding
strength of the cement and resulted in the increasing of the air voids content, water absorption and
permeability, and consequently, the splitting tensile strength, compressive strength, and the abrasion
resistance were all decreased.
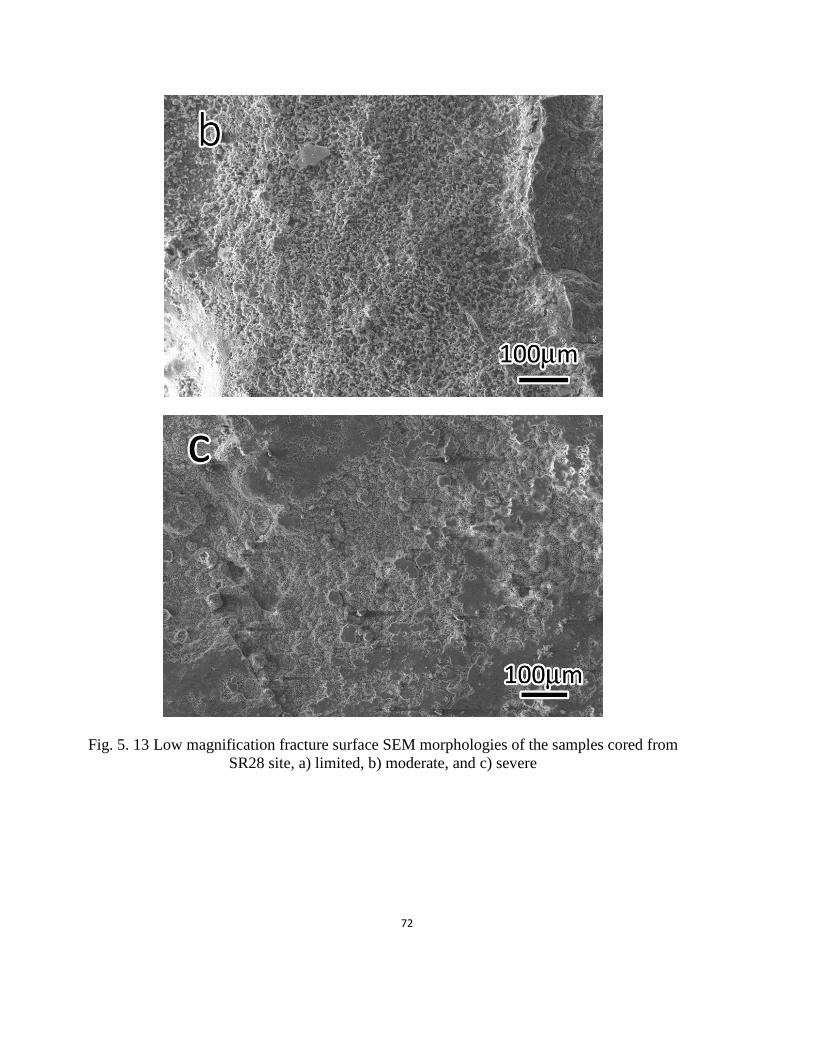
72
Fig. 5. 13 Low magnification fracture surface SEM morphologies of the samples cored from
SR28 site, a) limited, b) moderate, and c) severe
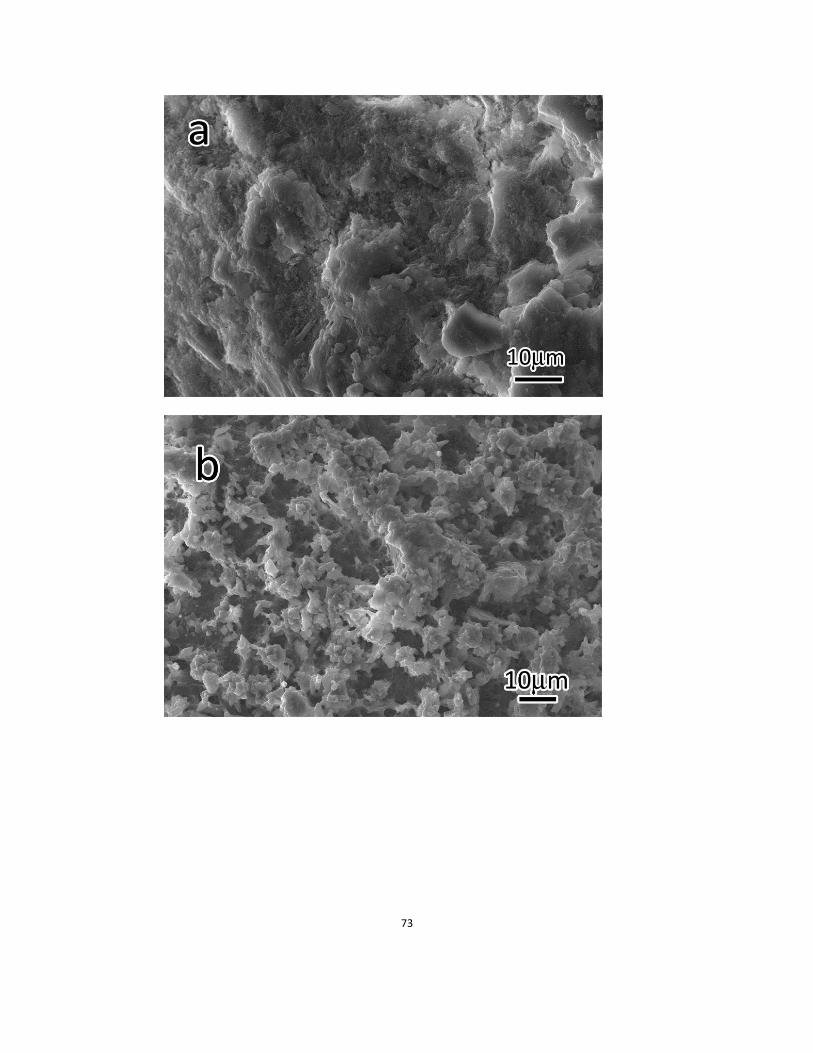
73
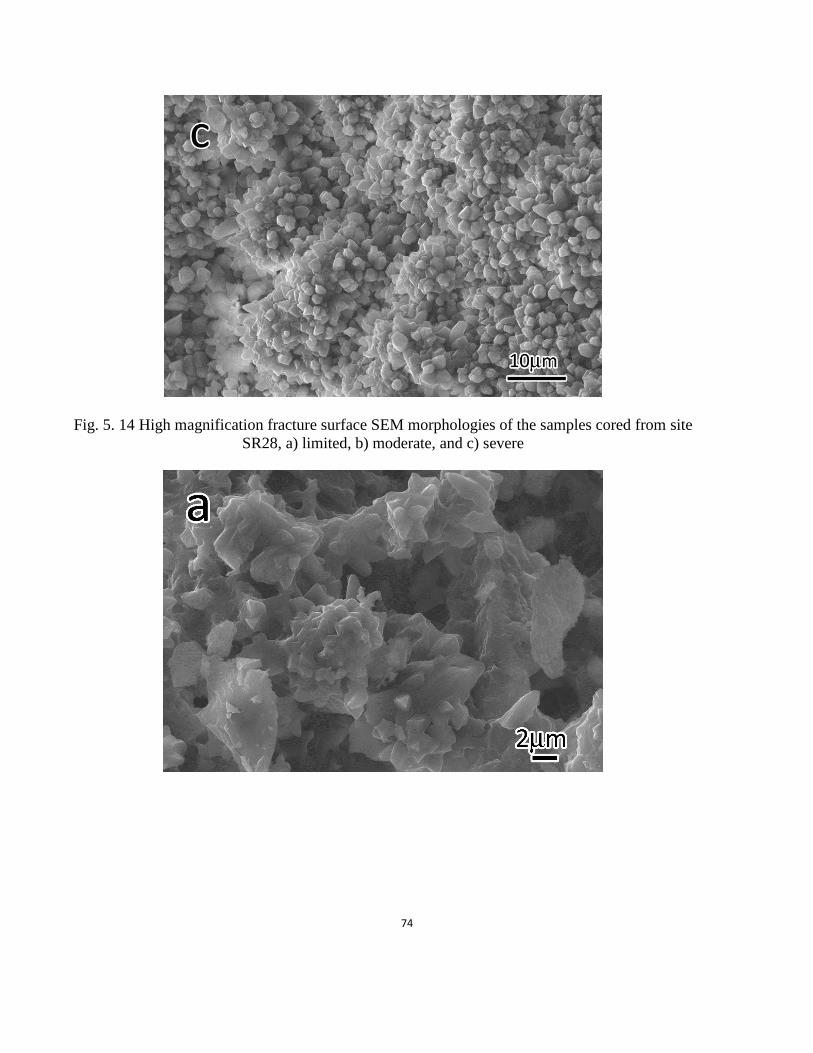
74
Fig. 5. 14 High magnification fracture surface SEM morphologies of the samples cored from site
SR28, a) limited, b) moderate, and c) severe
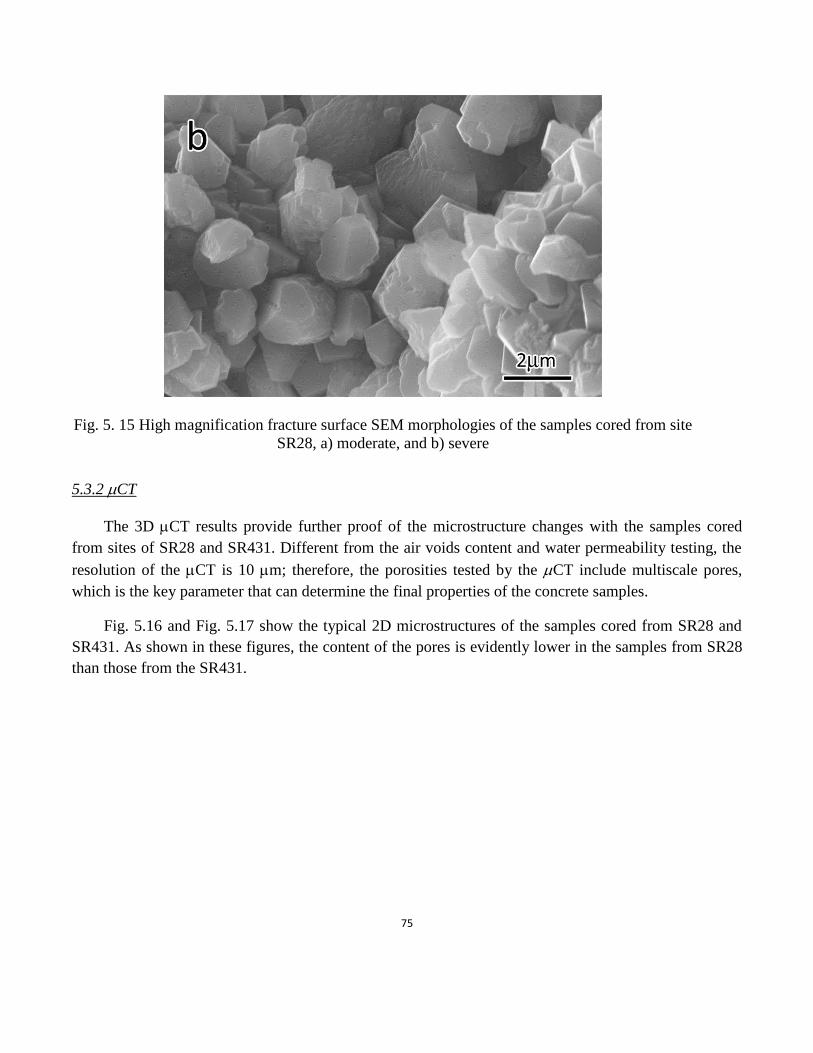
75
Fig. 5. 15 High magnification fracture surface SEM morphologies of the samples cored from site
SR28, a) moderate, and b) severe
5.3.2 CT
The 3D CT results provide further proof of the microstructure changes with the samples cored
from sites of SR28 and SR431. Different from the air voids content and water permeability testing, the
resolution of the CT is 10 m; therefore, the porosities tested by the CT include multiscale pores,
which is the key parameter that can determine the final properties of the concrete samples.
Fig. 5.16 and Fig. 5.17 show the typical 2D microstructures of the samples cored from SR28 and
SR431. As shown in these figures, the content of the pores is evidently lower in the samples from SR28
than those from the SR431.
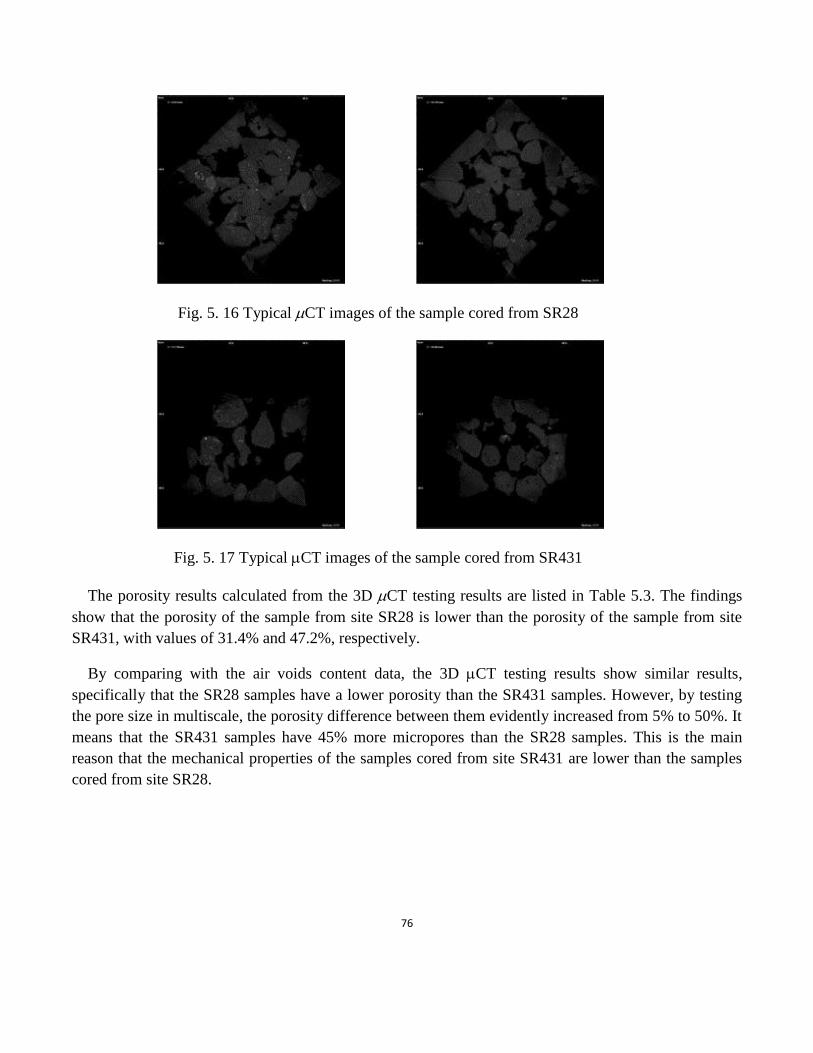
76
Fig. 5. 16 Typical CT images of the sample cored from SR28
Fig. 5. 17 Typical CT images of the sample cored from SR431
The porosity results calculated from the 3D CT testing results are listed in Table 5.3. The findings
show that the porosity of the sample from site SR28 is lower than the porosity of the sample from site
SR431, with values of 31.4% and 47.2%, respectively.
By comparing with the air voids content data, the 3D CT testing results show similar results,
specifically that the SR28 samples have a lower porosity than the SR431 samples. However, by testing
the pore size in multiscale, the porosity difference between them evidently increased from 5% to 50%. It
means that the SR431 samples have 45% more micropores than the SR28 samples. This is the main
reason that the mechanical properties of the samples cored from site SR431 are lower than the samples
cored from site SR28.
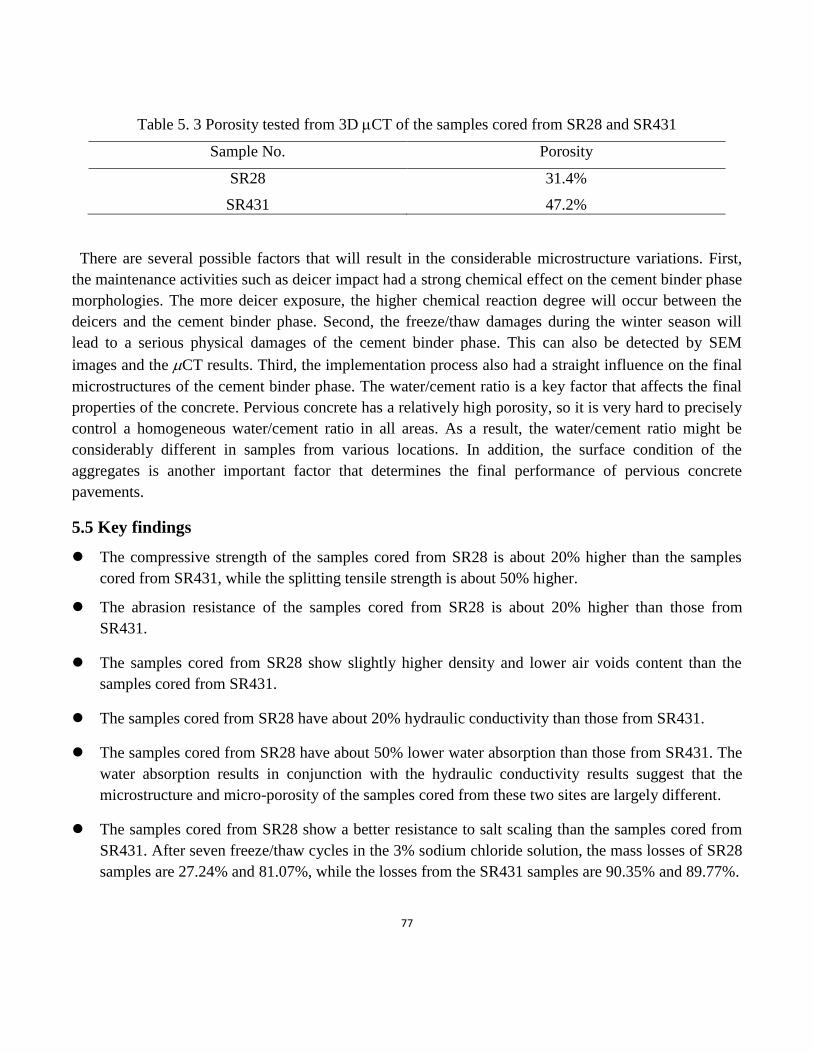
77
Table 5. 3 Porosity tested from 3D CT of the samples cored from SR28 and SR431
Sample No. Porosity
SR28 31.4%
SR431 47.2%
There are several possible factors that will result in the considerable microstructure variations. First,
the maintenance activities such as deicer impact had a strong chemical effect on the cement binder phase
morphologies. The more deicer exposure, the higher chemical reaction degree will occur between the
deicers and the cement binder phase. Second, the freeze/thaw damages during the winter season will
lead to a serious physical damages of the cement binder phase. This can also be detected by SEM
images and the CT results. Third, the implementation process also had a straight influence on the final
microstructures of the cement binder phase. The water/cement ratio is a key factor that affects the final
properties of the concrete. Pervious concrete has a relatively high porosity, so it is very hard to precisely
control a homogeneous water/cement ratio in all areas. As a result, the water/cement ratio might be
considerably different in samples from various locations. In addition, the surface condition of the
aggregates is another important factor that determines the final performance of pervious concrete
pavements.
5.5 Key findings
The compressive strength of the samples cored from SR28 is about 20% higher than the samples
cored from SR431, while the splitting tensile strength is about 50% higher.
The abrasion resistance of the samples cored from SR28 is about 20% higher than those from
SR431.
The samples cored from SR28 show slightly higher density and lower air voids content than the
samples cored from SR431.
The samples cored from SR28 have about 20% hydraulic conductivity than those from SR431.
The samples cored from SR28 have about 50% lower water absorption than those from SR431. The
water absorption results in conjunction with the hydraulic conductivity results suggest that the
microstructure and micro-porosity of the samples cored from these two sites are largely different.
The samples cored from SR28 show a better resistance to salt scaling than the samples cored from
SR431. After seven freeze/thaw cycles in the 3% sodium chloride solution, the mass losses of SR28
samples are 27.24% and 81.07%, while the losses from the SR431 samples are 90.35% and 89.77%.

78
The CT analysis shows that the micrometer-scale porosity of the samples cored from SR28 is
much lower than those from SR431.
The observed SEM images of the fracture surfaces of the samples cored from SR28 and SR431
demonstrate that the limited distress samples show a well-maintained cement binder phase. In
contrast, the moderate distress samples show some needle-shaped precipitates embedded in the
cement binder phase. The predominant phase of the severe distress samples consists of a large
number of micro-sized crystalline precipitates, instead of cement binder phase.
The specific mechanism responsible for the premature failure of pervious concrete remains unclear
and merits further investigation. One hypothesis to test is that the distresses observed in pervious
concrete originated from the construction practice, e.g., insufficient compaction at some locations,
and later aggravated by the exposure to freeze/thaw cycles, deicers, and mechanical loading in the
service environment. Enhanced understanding of the failure mechanisms would help guide better
design, construction, and maintenance practices for pervious concrete.
5.6 References
ASTM. 2012. Standard Test Method for Compressive Strength of Cylindrical Concrete Specimens.
ASTM standard C39/C39M. American Society for Testing Materials, West Conshohocken, PA.
ASTM. 2011. Standard Test Method for Splitting Tensile Strength of Cylindrical Concrete Specimens.
ASTM standard C496/C496M. American Society for Testing Materials, West Conshohocken, PA.
ASTM. 2012. Standard Practice for Capping Cylindrical Concrete Specimens. ASTM standard
C617/C617M. American Society for Testing Materials, West Conshohocken, PA.
ASTM. 2006. Standard Test Method for Density, Absorption and Voids in Hardened Concrete. ASTM
standard C642. American Society for Testing Materials, West Conshohocken, PA.
ASTM. 2012. Standard Test Method for Scaling Resistance of Concrete Surfaces Exposed to Deicing
Chemicals. ASTM standard C672/C672M. American Society for Testing Materials, West
Conshohocken, PA.
ASTM. 2011. Standard Test Method for Determining Potential Resistance to Degradation of Pervious
Concrete by Impact and Abrasion. ASTM standard C1747/C1747M. American Society for Testing
Materials, West Conshohocken, PA.
ASTM. 2012. Standard Test Method for Density and Void Content of Hardened Pervious Concrete.
ASTM standard C1754/C1754M. American Society for Testing Materials, West Conshohocken, PA.
79
Huang, B., H. Wu, X. Shu, and E.G. Burdette. 2010. “Laboratory Evaluation of Permeability and
Strength of Polymer-Modified Pervious Concrete” Constr. and Build. Mat., 24(5), 818–823.
McCain, G.N., M.J. Suozzo, M.M. Dewoolkar. 2010. “A Laboratory Study on the Effects of Winter
Surface Applications on the Hydraulic Conductivity of Porous Concrete Pavements” Transportation
Research Board 2010 Annual Meeting CD-ROM.
Montes, F., S. Valavada, L.M. Haselbach. 2005. “A New Test Method for Porosity Measurements of
Portland Cement Concrete” J. of ASTM Int’l, 2(1), January, 13pp.
Rizvi, R., S. Tighe, V. Henderson, J. Norris. 2010. “Evaluating the Use of Recycled Concrete Aggregate
in Pervious Concrete Pavement” Transportation Research Record No. 2164, 132-140.
Schaefer, V.R., K. Wang, M.T. Suleiman, and J.T. Kavern. 2006. Mix Design Development for Pervious
Concrete in Cold Weather Climates. Iowa DOT Final Report No. 2006–01.
80
Chapter 6 Conclusions
Pervious concrete has been increasingly used as a powerful tool to mitigate negative impact on the
environment. It has many advantages for urban cities, including stormwater runoff management, traffic
noise control, groundwater recharge, and mitigation of the urban heat island. The various mixes
proportions can produce a wide range of properties in pervious concrete pavement, and various additives
are helpful to enhance the overall performance of pervious concrete materials. In general, it is hard to
optimize both the mechanical properties and the infiltration performance of the pervious concrete at the
same time; therefore, new technologies need to be developed to help increase the mechanical properties
without largely sacrificing the infiltration properties. In addition, the freeze/thaw damages, deicer
impacts, and clogging phenomenon still create bottleneck problems for pervious concrete pavements.
Besides the practical problems, the ongoing designing challenges include quantitative characterization of
the pervious concrete materials and the quantitative relationship between the pore structures and the
performance of the pervious concrete.
In the summer of 2012, NDOT constructed a pervious concrete pavement near Lake Tahoe.
Specifications for this installation included a 7″ thick pervious concrete pavement surface over an 8″
thick aggregate drainage layer and 6″ thick geotextile-encapsulated sand bed. Two pervious concrete
were installed at SR 431 and SR 28. The field testing results show that the slump of the freshly mixed
pervious concrete was 1/4 inch, the unit weight was 123.2 PCF, the total air voids was 22.8%, the
average 7d and 28d compressive strengths were 2770 and 3330 psi, respectively, and the average 7d and
28d tensile strengths were 300 and 315 psi, respectively. The freshly mixed pervious concrete has an
average infiltration rate of 0.3-0.4 in/sec; however, after one year service, the infiltration rate was
reduced to 0.1-0.01 in/sec.
The engineering performance and microstructure analysis of the samples cored from the fields were
tested in the laboratory. The compressive strength of the samples cored from SR28 is about 20% higher
than the samples cored from SR431, while the splitting tensile strength is about 50% higher. The
abrasion resistance of the samples cored from SR28 is about 20% higher than the samples cored from
SR431. The density and air voids testing results show that the samples cored from SR431 and SR28
have similar values. The samples cored from SR28 shows slightly higher density and lower air voids
content and the samples cored from SR431. The hydraulic conductivity testing results show that the
samples cored from SR28 has about 20% lower value than those from SR431. The water absorption
testing results demonstrated that the samples cored from SR28 have about 50% lower value than those
from SR431. The water absorption results in conjunction with the hydraulic conductivity results suggest
that the microstructure and micro-porosity of the samples cored from these two sites are largely different.
The samples cored from SR28 shows a better freeze/thaw resistance than the samples cored from
SR431. After 7 freeze/thaw cycles in the 3% sodium chloride solution, the mass loss of SR28 samples
are 27.24% and 81.07%, while the SR431 samples are 90.35% and 89.77%. The CT analysis shows
81
that the micrometer-scale porosity of the samples cored from SR28 is much lower than those from
SR431.
A forensic investigation was conducted to shed light on the premature raveling of some pervious
concrete segments. The observed SEM images of the fracture surfaces of the samples cored from SR28
and SR431 demonstrate that the limited distress samples show a well-maintained cement binder phase.
In contrast, the moderate distress samples show some needle-shaped precipitates embedded in the
cement binder phase. The predominant phase of the severe distress samples consists of a large number
of micro-sized crystalline precipitates, instead of cement binder phase. One hypothesis to test is that the
distresses observed in pervious concrete originated from the construction practice, e.g., insufficient
compaction at some locations, and later aggravated by the exposure to freeze/thaw cycles, deicers, and
mechanical loading in the service environment. Enhanced understanding of the failure mechanisms
would help guide better design, construction, and maintenance practices for pervious concrete.
Recommended