Evaluating the Clinical Literature
Peter Flores-Quilala, RPh, MD
Faculty of Pharmacy
Pharmacy Informatics
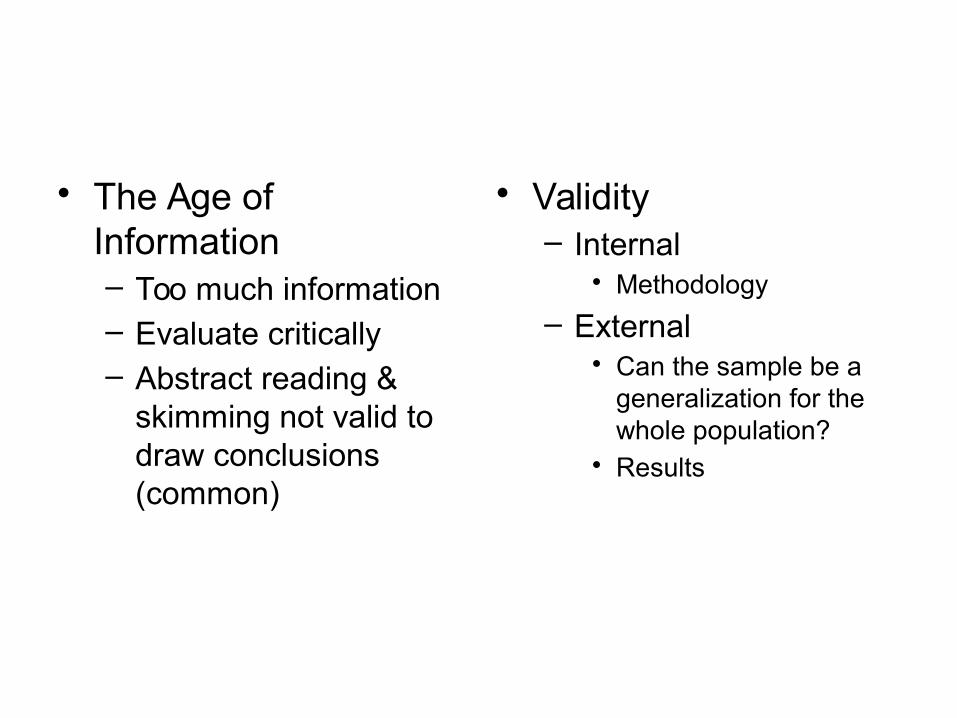
• The Age of Information– Too much information– Evaluate critically – Abstract reading &
skimming not valid to draw conclusions (common)
• Validity– Internal
• Methodology
– External• Can the sample be a
generalization for the whole population?
• Results
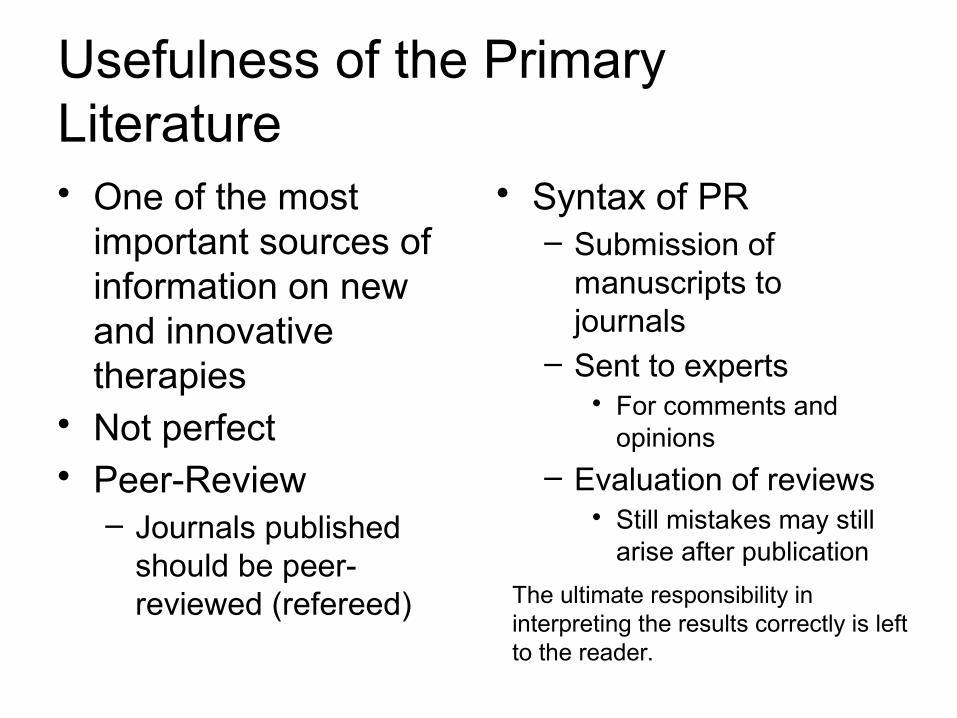
Usefulness of the Primary Literature• One of the most
important sources of information on new and innovative therapies
• Not perfect• Peer-Review
– Journals published should be peer-reviewed (refereed)
• Syntax of PR– Submission of
manuscripts to journals
– Sent to experts• For comments and
opinions
– Evaluation of reviews• Still mistakes may still
arise after publication
The ultimate responsibility in interpreting the results correctly is left to the reader.
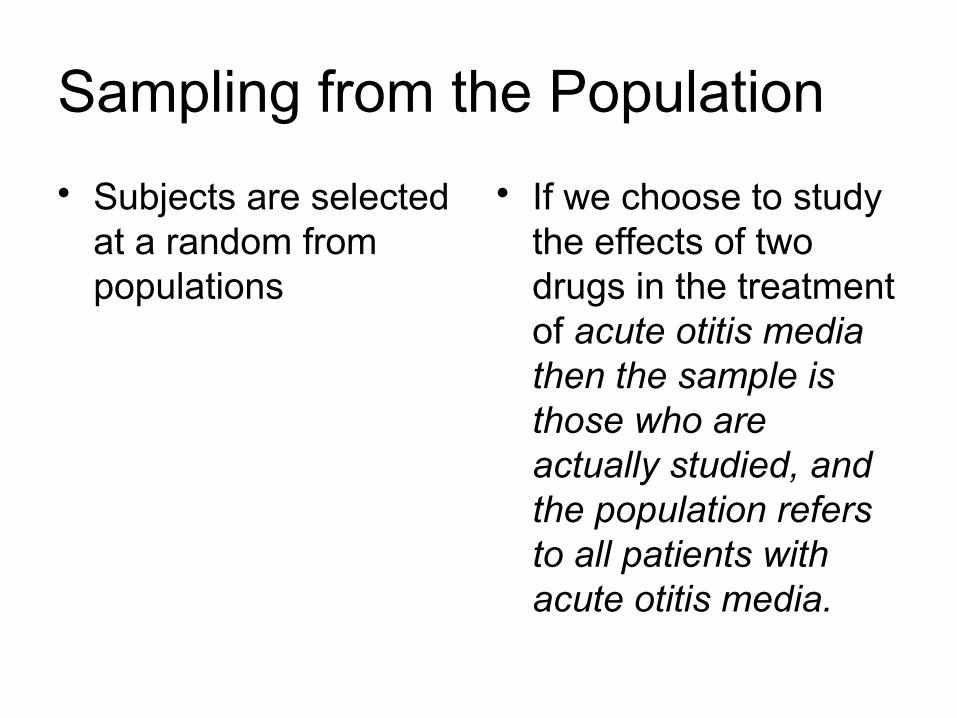
Sampling from the Population
• Subjects are selected at a random from populations
• If we choose to study the effects of two drugs in the treatment of acute otitis media then the sample is those who are actually studied, and the population refers to all patients with acute otitis media.
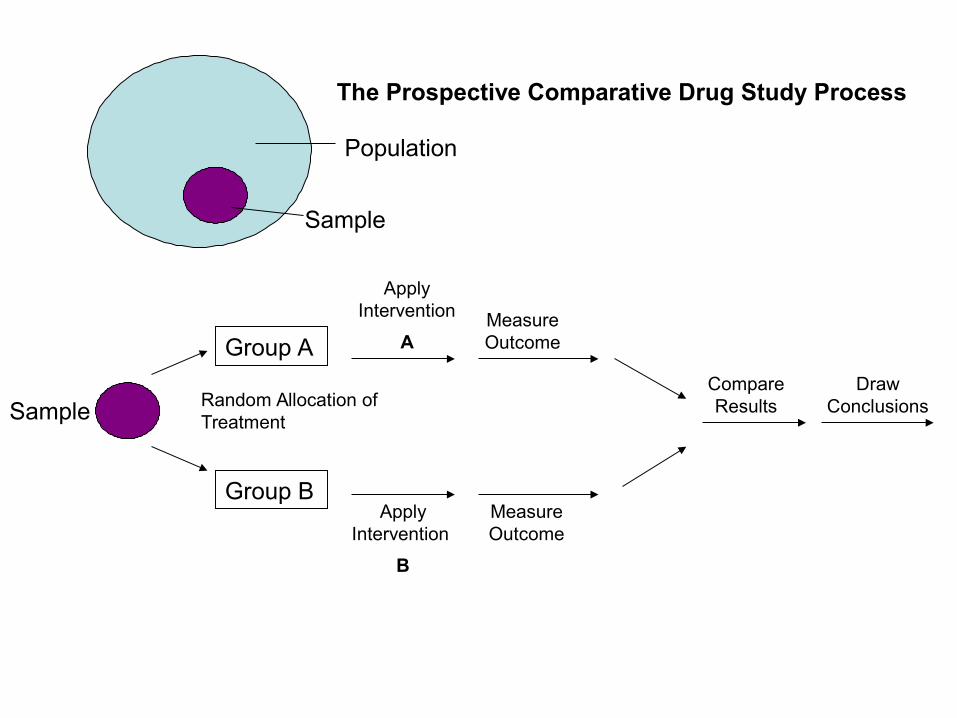
Sample
Group A
Group B
Random Allocation of Treatment
Apply Intervention
A
Apply Intervention
B
Measure Outcome
Measure Outcome
Compare Results
Draw Conclusions
Population
Sample
The Prospective Comparative Drug Study Process
Association vs Causation
• The ideal clinical study is designed such that a sample of patients with a particular disease state is selected at a random from a population.
• Patients are then randomly assigned to two or more treatment groups
• Assessment are conducted to determine if the groups are similar to each other at baseline
• Then an intervention is applied, and differences in the outcome (if any) are measured. If differences in the outcome are present the assumption is the reason for the difference is due to the effect of the independent variables
• Therefore there is an association between a particular variable and the outcome
• Difficult to prove that causation is the reason for the difference
Example
• Association– A retrospective cohort study to test whether Drug A
causes colon cancer. The results indicate that patients who consume Drug A were twice as likely to develop cancer as those patients not taking the drug.
However, we might not prove that Drug A causes cancer since this is a retrospective study that control of other variables would be necessary like other diet and intake of other drugs within the study
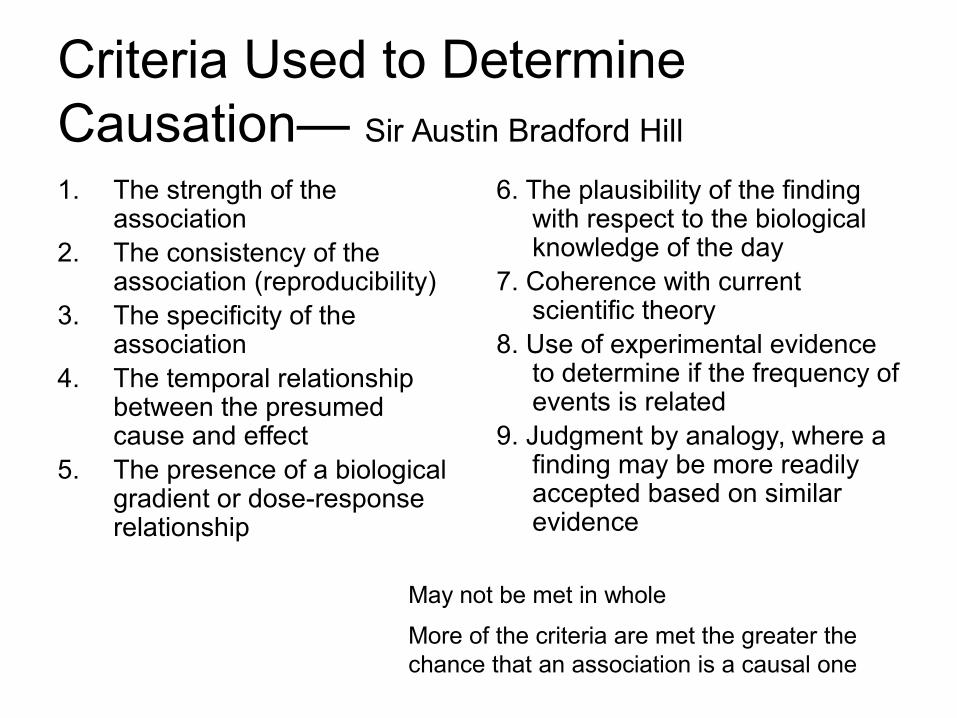
Criteria Used to Determine Causation— Sir Austin Bradford Hill
1. The strength of the association
2. The consistency of the association (reproducibility)
3. The specificity of the association
4. The temporal relationship between the presumed cause and effect
5. The presence of a biological gradient or dose-response relationship
6. The plausibility of the finding with respect to the biological knowledge of the day
7. Coherence with current scientific theory
8. Use of experimental evidence to determine if the frequency of events is related
9. Judgment by analogy, where a finding may be more readily accepted based on similar evidence
May not be met in whole
More of the criteria are met the greater the chance that an association is a causal one
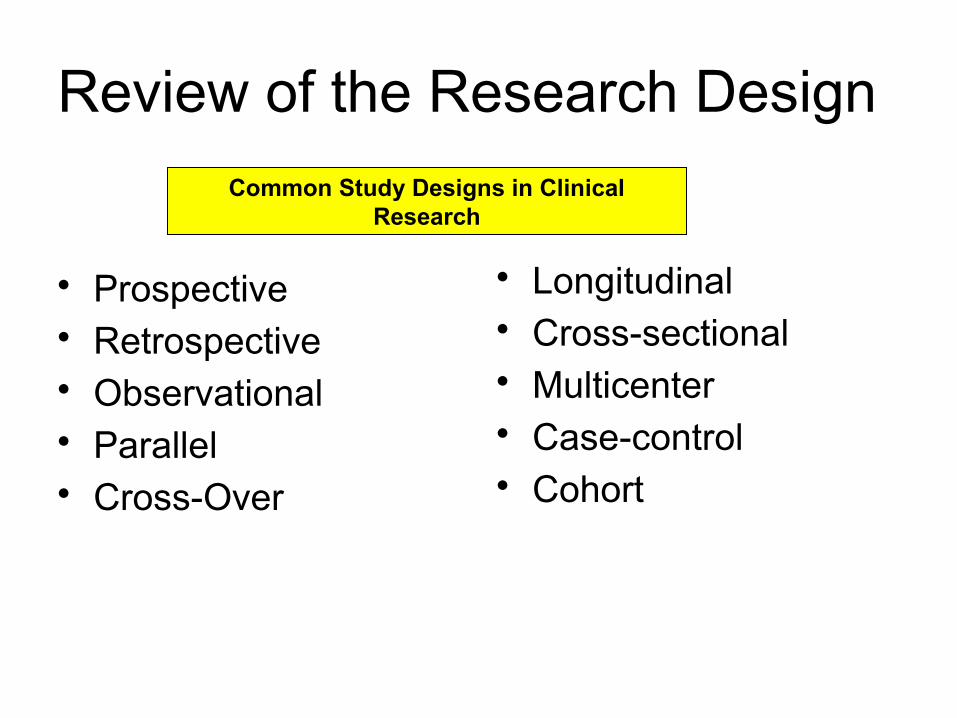
Review of the Research Design
• Prospective• Retrospective• Observational• Parallel• Cross-Over
• Longitudinal• Cross-sectional• Multicenter• Case-control• Cohort
Common Study Designs in Clinical Research
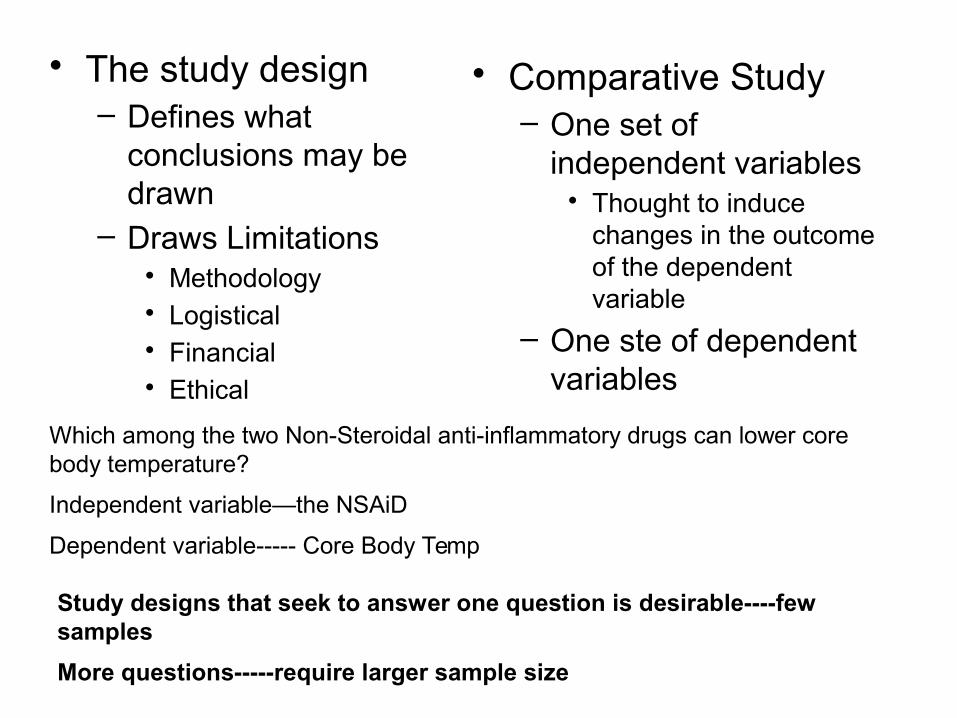
• The study design– Defines what
conclusions may be drawn
– Draws Limitations• Methodology• Logistical• Financial• Ethical
• Comparative Study– One set of
independent variables• Thought to induce
changes in the outcome of the dependent variable
– One ste of dependent variables
Which among the two Non-Steroidal anti-inflammatory drugs can lower core body temperature?
Independent variable—the NSAiD
Dependent variable----- Core Body Temp
Study designs that seek to answer one question is desirable----few samples
More questions-----require larger sample size
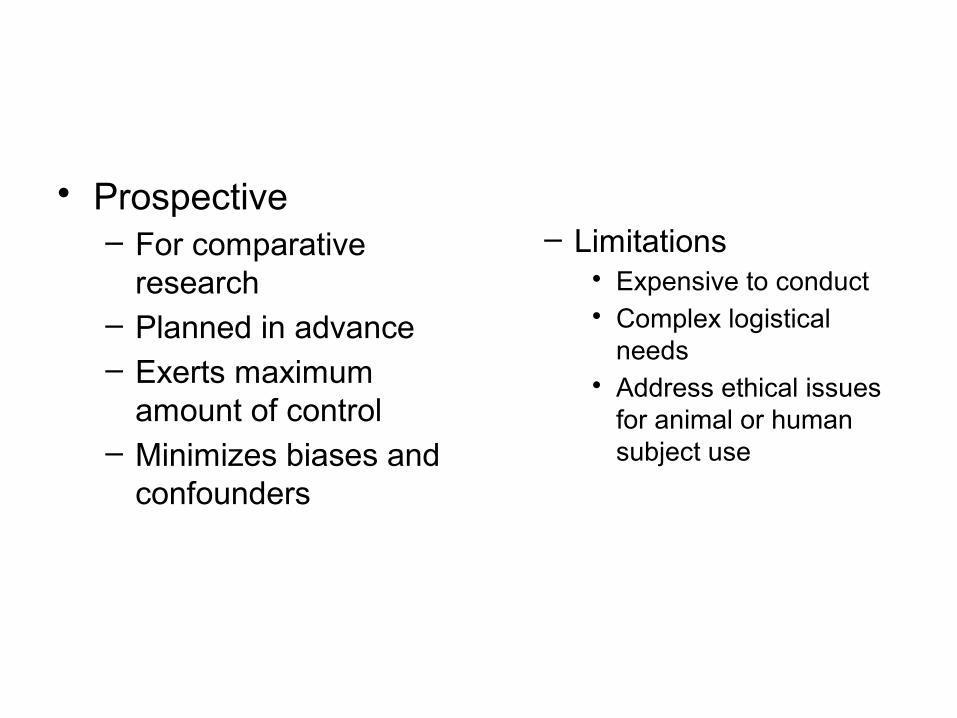
• Prospective– For comparative
research– Planned in advance– Exerts maximum
amount of control– Minimizes biases and
confounders
– Limitations• Expensive to conduct• Complex logistical
needs• Address ethical issues
for animal or human subject use
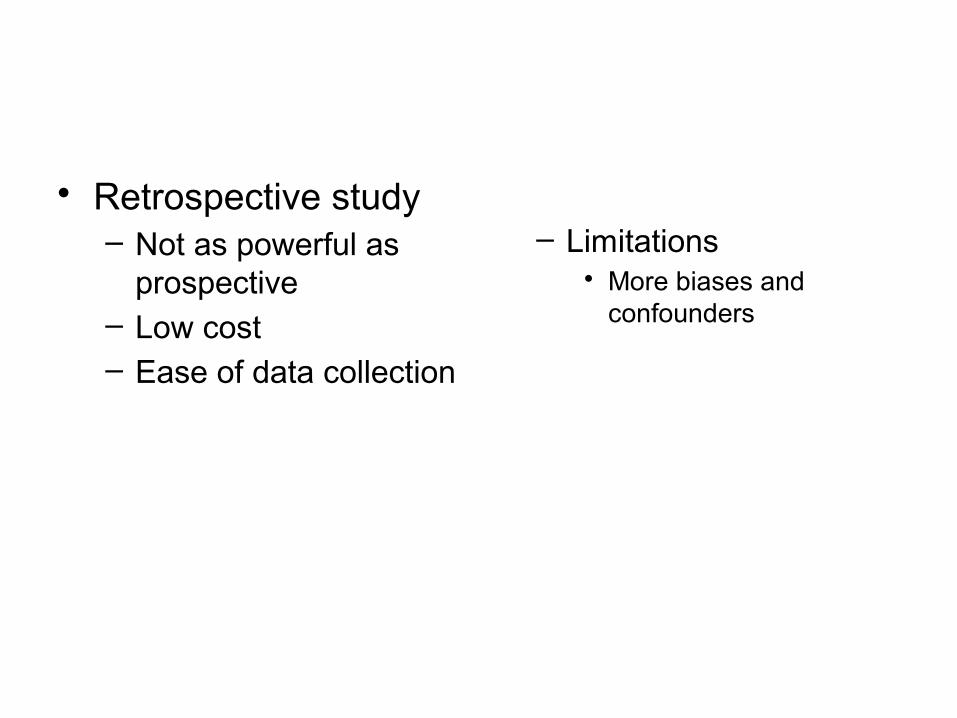
• Retrospective study– Not as powerful as
prospective– Low cost– Ease of data collection
– Limitations• More biases and
confounders
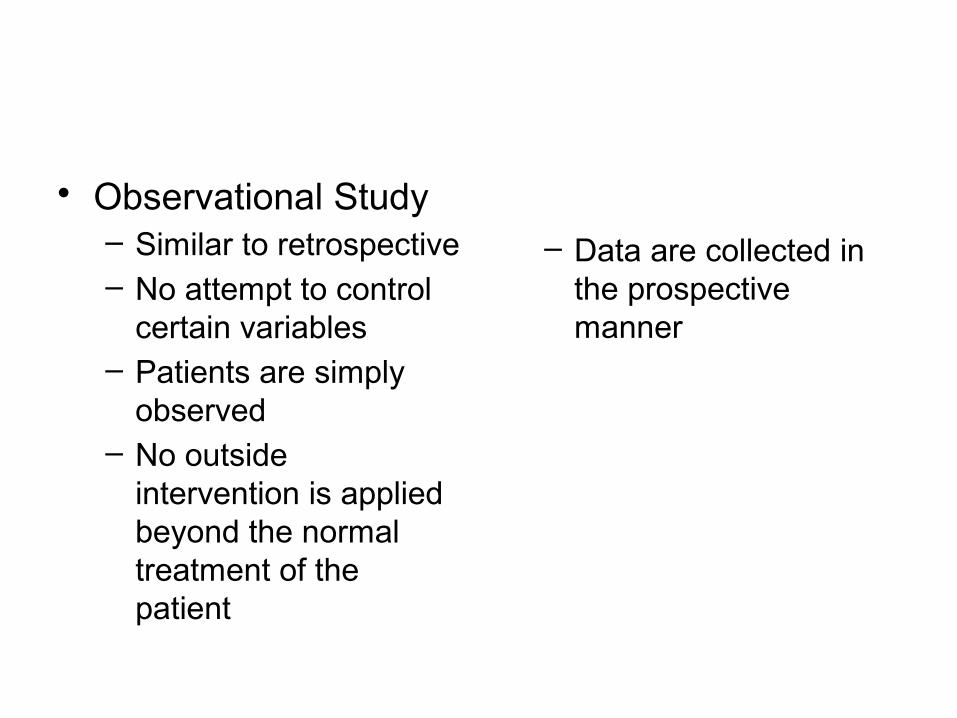
• Observational Study– Similar to retrospective– No attempt to control
certain variables– Patients are simply
observed– No outside
intervention is applied beyond the normal treatment of the patient
– Data are collected in the prospective manner
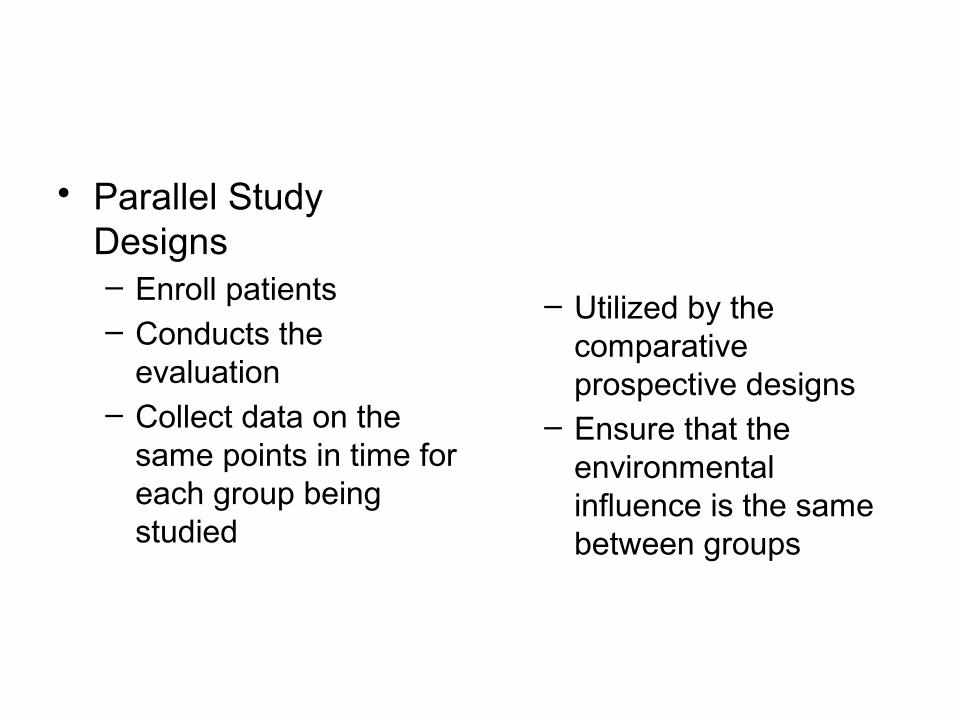
• Parallel Study Designs– Enroll patients– Conducts the
evaluation– Collect data on the
same points in time for each group being studied
– Utilized by the comparative prospective designs
– Ensure that the environmental influence is the same between groups
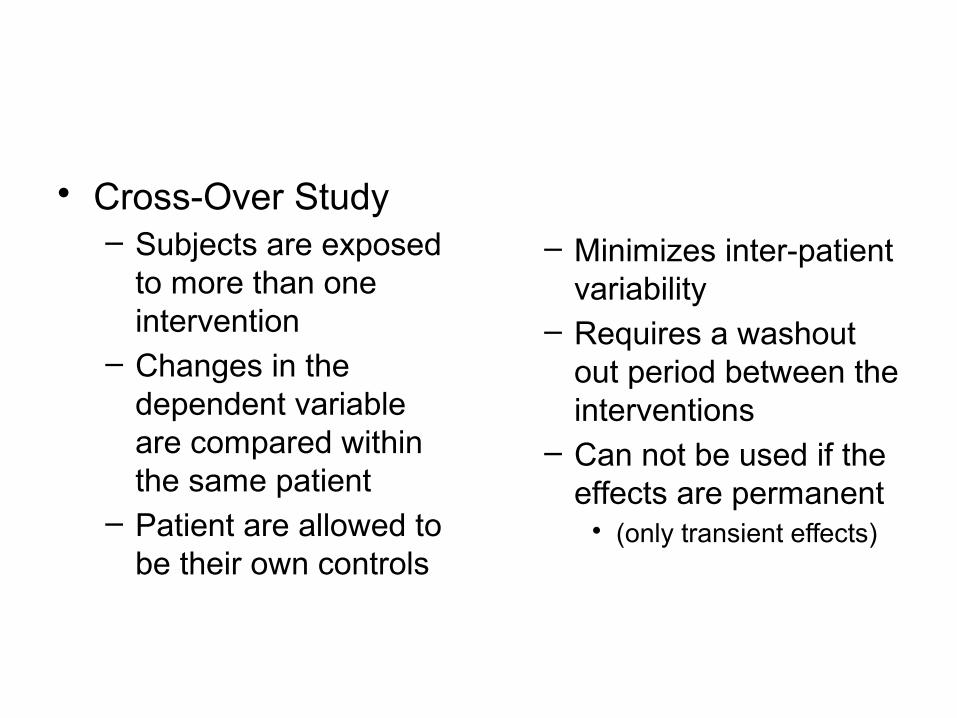
• Cross-Over Study– Subjects are exposed
to more than one intervention
– Changes in the dependent variable are compared within the same patient
– Patient are allowed to be their own controls
– Minimizes inter-patient variability
– Requires a washout out period between the interventions
– Can not be used if the effects are permanent• (only transient effects)
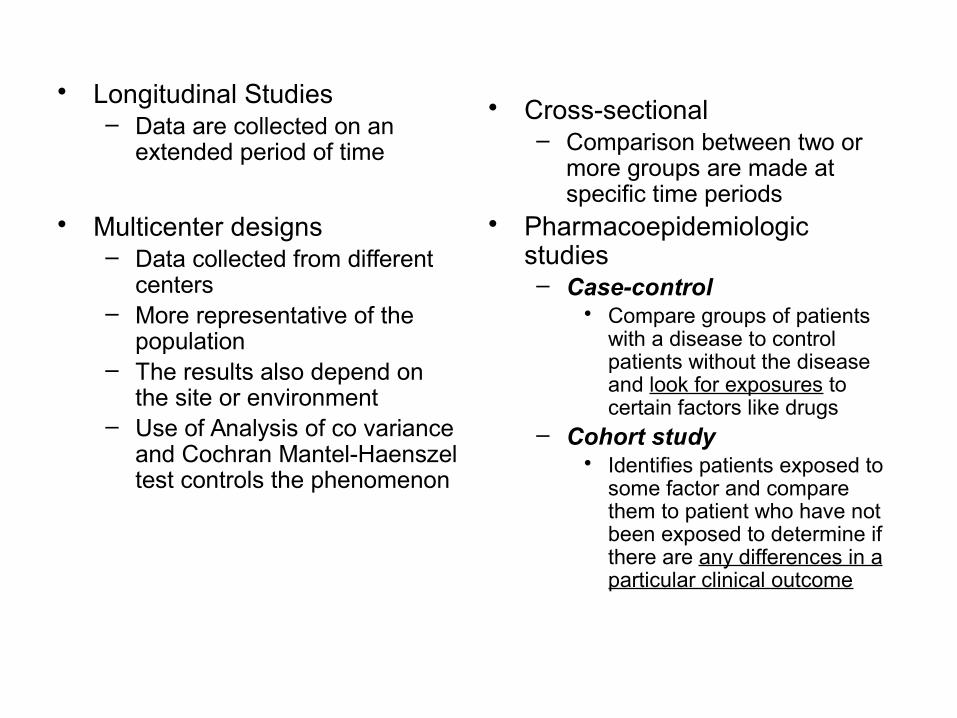
• Longitudinal Studies– Data are collected on an
extended period of time
• Multicenter designs– Data collected from different
centers– More representative of the
population– The results also depend on
the site or environment– Use of Analysis of co variance
and Cochran Mantel-Haenszel test controls the phenomenon
• Cross-sectional– Comparison between two or
more groups are made at specific time periods
• Pharmacoepidemiologic studies– Case-control
• Compare groups of patients with a disease to control patients without the disease and look for exposures to certain factors like drugs
– Cohort study• Identifies patients exposed to
some factor and compare them to patient who have not been exposed to determine if there are any differences in a particular clinical outcome
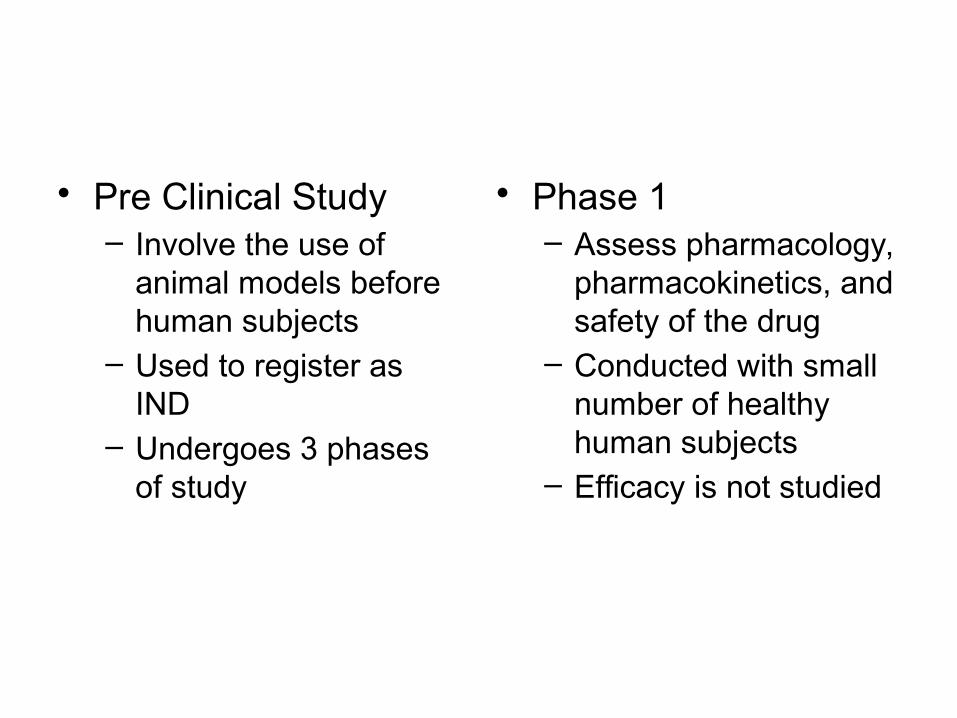
• Pre Clinical Study– Involve the use of
animal models before human subjects
– Used to register as IND
– Undergoes 3 phases of study
• Phase 1– Assess pharmacology,
pharmacokinetics, and safety of the drug
– Conducted with small number of healthy human subjects
– Efficacy is not studied
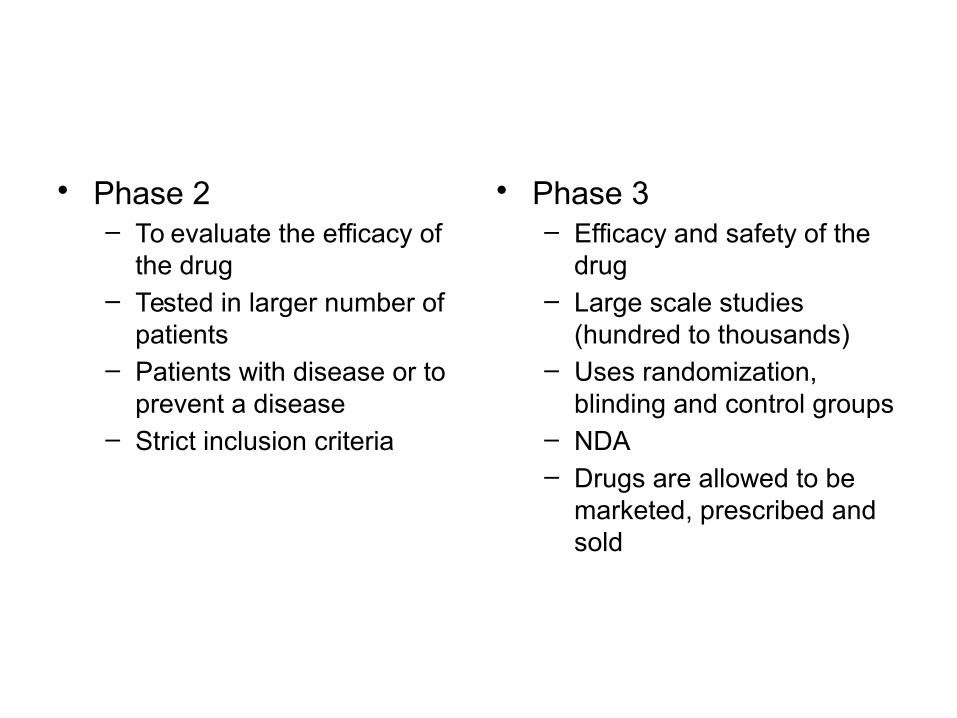
• Phase 2– To evaluate the efficacy of
the drug– Tested in larger number of
patients– Patients with disease or to
prevent a disease– Strict inclusion criteria
• Phase 3– Efficacy and safety of the
drug– Large scale studies
(hundred to thousands)– Uses randomization,
blinding and control groups– NDA– Drugs are allowed to be
marketed, prescribed and sold
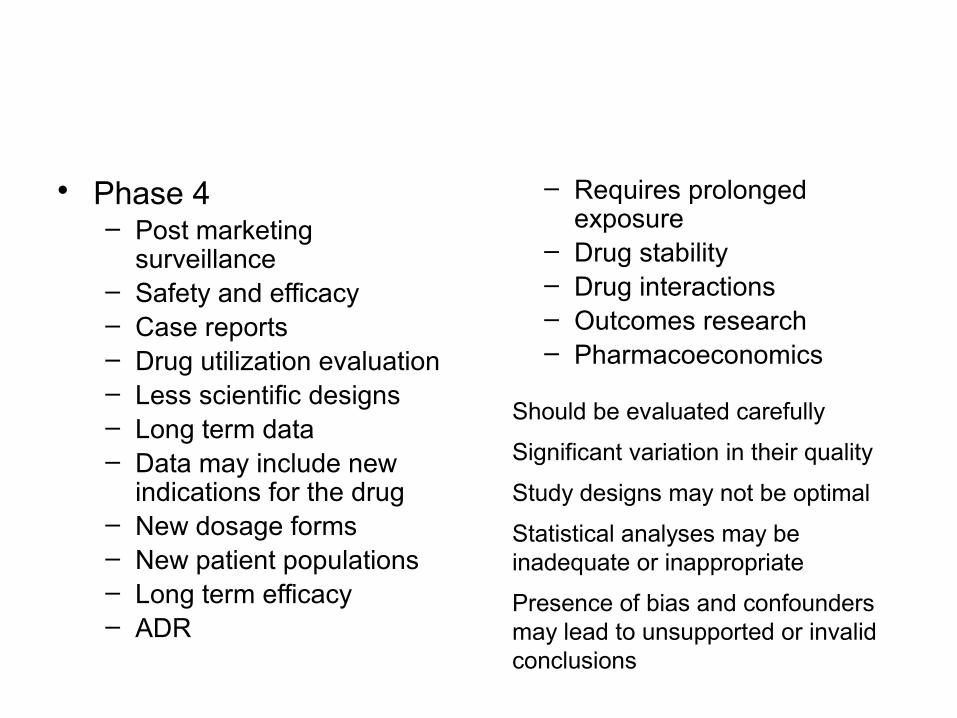
• Phase 4– Post marketing
surveillance– Safety and efficacy– Case reports– Drug utilization evaluation– Less scientific designs– Long term data– Data may include new
indications for the drug– New dosage forms– New patient populations– Long term efficacy– ADR
– Requires prolonged exposure
– Drug stability– Drug interactions– Outcomes research– Pharmacoeconomics
Should be evaluated carefully
Significant variation in their quality
Study designs may not be optimal
Statistical analyses may be inadequate or inappropriate
Presence of bias and confounders may lead to unsupported or invalid conclusions
Chance, Bias, Confounding
• The ideal study is one where the changes in the dependent variable can be attributed to the effect of the independent variables
• These are factors affecting the dependent variables
• May cause potential error
• May become difficult to interpret
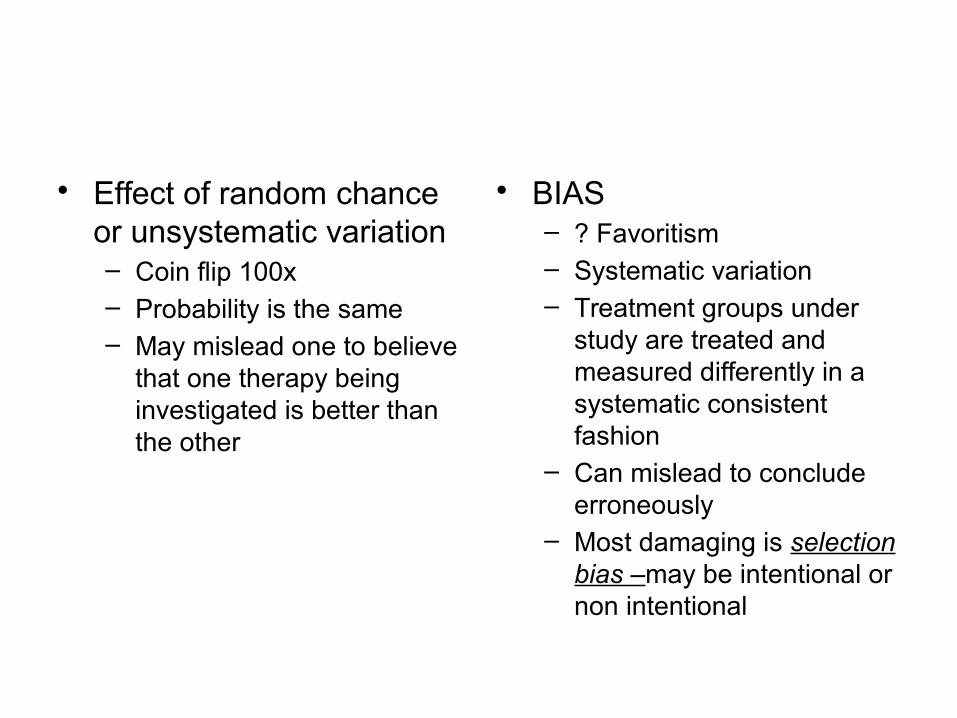
• Effect of random chance or unsystematic variation– Coin flip 100x– Probability is the same– May mislead one to believe
that one therapy being investigated is better than the other
• BIAS– ? Favoritism– Systematic variation– Treatment groups under
study are treated and measured differently in a systematic consistent fashion
– Can mislead to conclude erroneously
– Most damaging is selection bias –may be intentional or non intentional
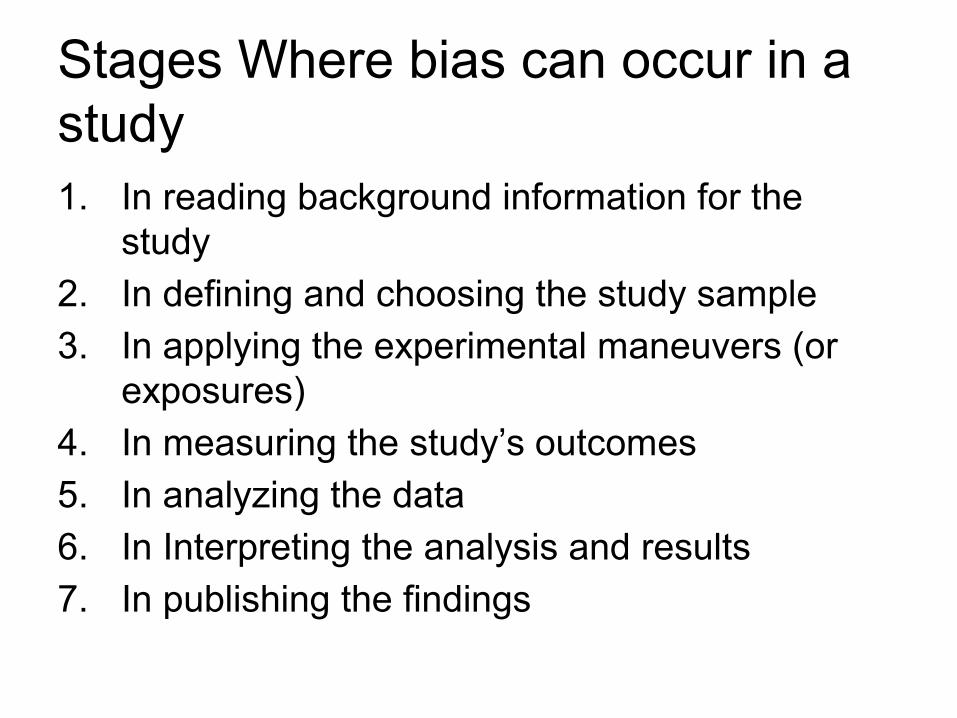
Stages Where bias can occur in a study1. In reading background information for the
study
2. In defining and choosing the study sample
3. In applying the experimental maneuvers (or exposures)
4. In measuring the study’s outcomes
5. In analyzing the data
6. In Interpreting the analysis and results
7. In publishing the findings
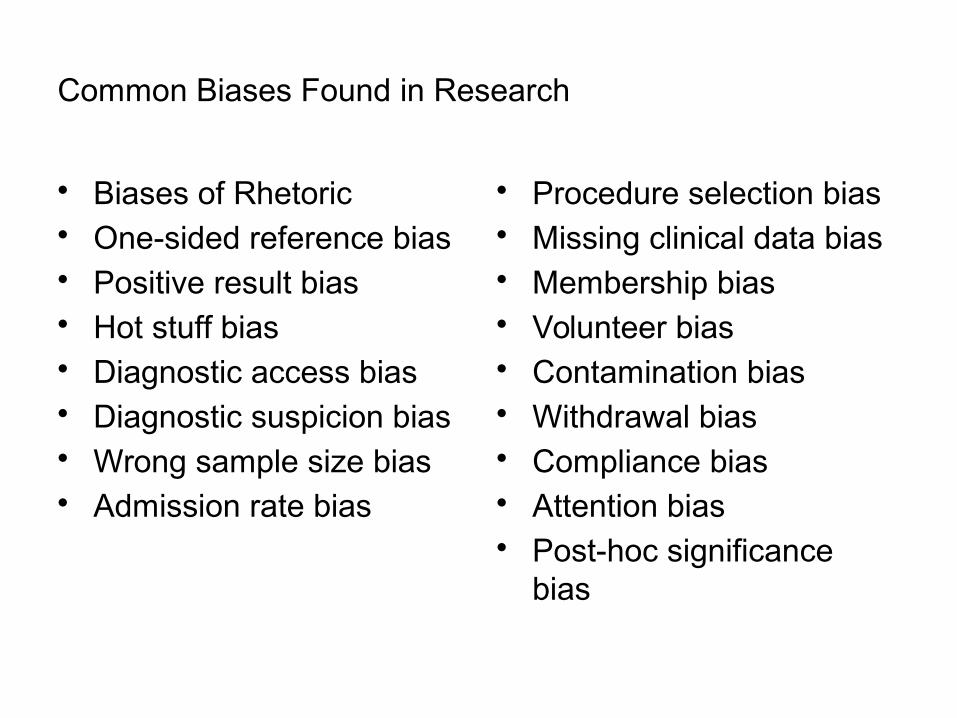
Common Biases Found in Research
• Biases of Rhetoric• One-sided reference bias• Positive result bias• Hot stuff bias• Diagnostic access bias• Diagnostic suspicion bias• Wrong sample size bias• Admission rate bias
• Procedure selection bias• Missing clinical data bias• Membership bias• Volunteer bias• Contamination bias• Withdrawal bias• Compliance bias• Attention bias• Post-hoc significance
bias
Confounding
• A confounding variable is one that affects the dependent variable the independent variable or both
• May be impossible to eliminate all confounding variables
• Solution: use the appropriate statistical method
Control Groups
• Used by comparative studies
• As a frame of reference to use when comparing
• Without it, one can not directly compare the results of one study with another study
• Positive control group is usually the Gold Standard therapy
• Dose and dosing should be equivalent
Blinding
• To minimize bias among the study group and the clinician
• Open label studies– No blinding– Both the clinician and
patient are aware • Single blind
– Blinding either the clinician or the patient
• Double blind– Both the clinician and
patient are unaware– Most desirable– Financially, logistically
and ethically impossible
Randomization
• To minimize bias in the study– Random selection
• All from a population have an equal chance of being chosen for the study
– Random Allocation• Assigned to a treatment
group by random chance
• Minimizes selection bias
Hypothesis Testing
• Null hypothesis (Ho)– Opposing hypothesis– Hypothesis of no
difference– No difference in the
outcomes measured– Data collected and
results are used to either to accept the Ho-no diff; or reject Ho-a difference exists
• Research hypothesis– Alternative hypothesis– States that there are
difference in between groups
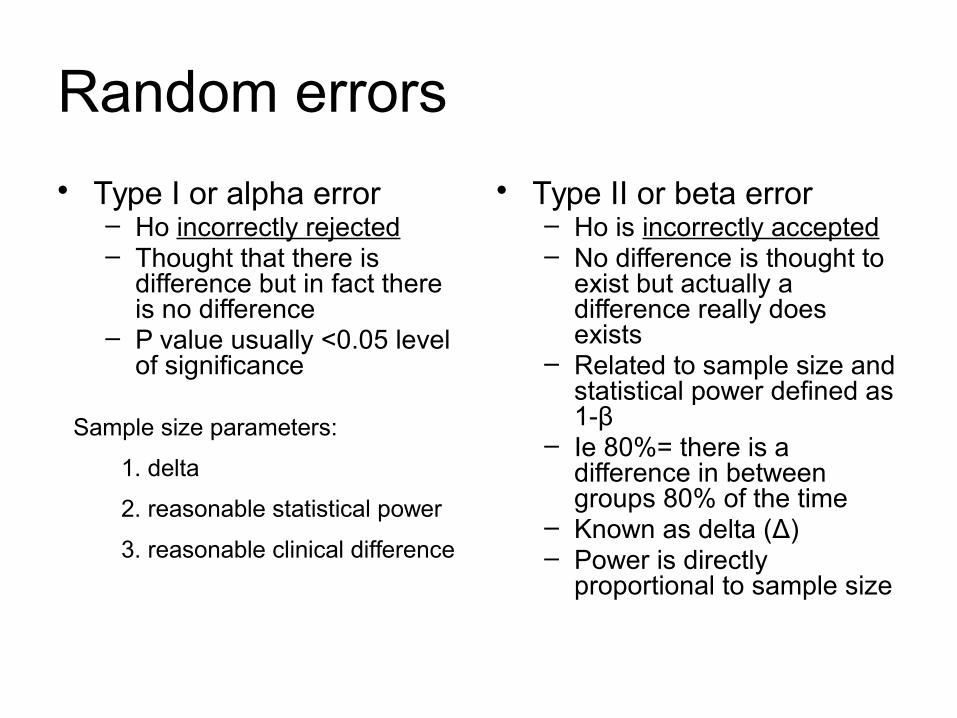
Random errors
• Type I or alpha error– Ho incorrectly rejected– Thought that there is
difference but in fact there is no difference
– P value usually <0.05 level of significance
• Type II or beta error– Ho is incorrectly accepted– No difference is thought to
exist but actually a difference really does exists
– Related to sample size and statistical power defined as 1-β
– Ie 80%= there is a difference in between groups 80% of the time
– Known as delta (Δ)– Power is directly
proportional to sample size
Sample size parameters:
1. delta
2. reasonable statistical power
3. reasonable clinical difference
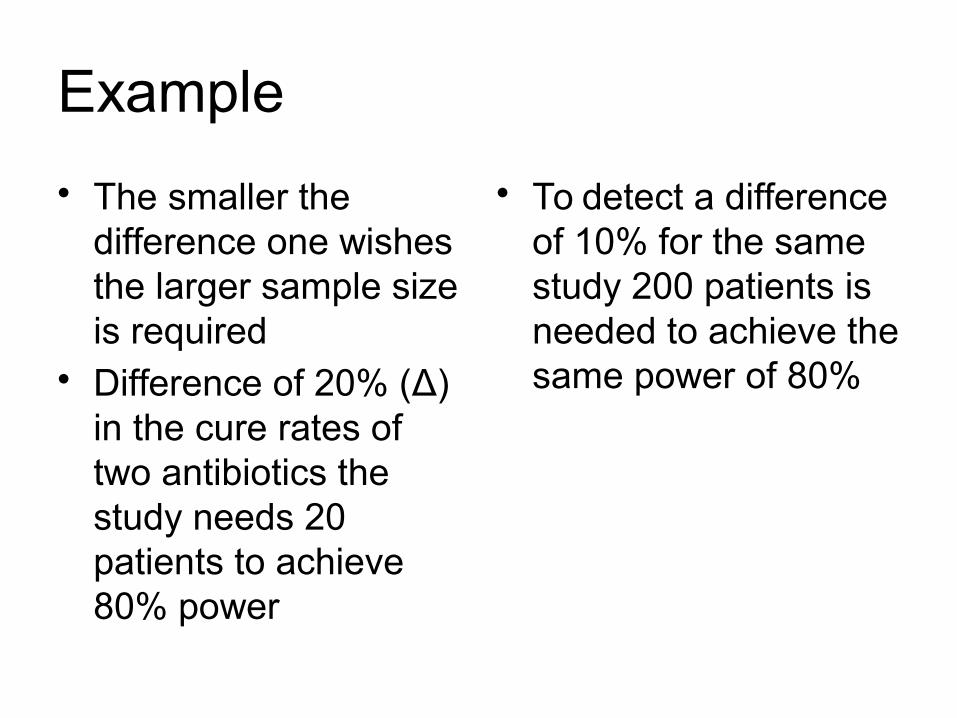
Example
• The smaller the difference one wishes the larger sample size is required
• Difference of 20% (Δ) in the cure rates of two antibiotics the study needs 20 patients to achieve 80% power
• To detect a difference of 10% for the same study 200 patients is needed to achieve the same power of 80%
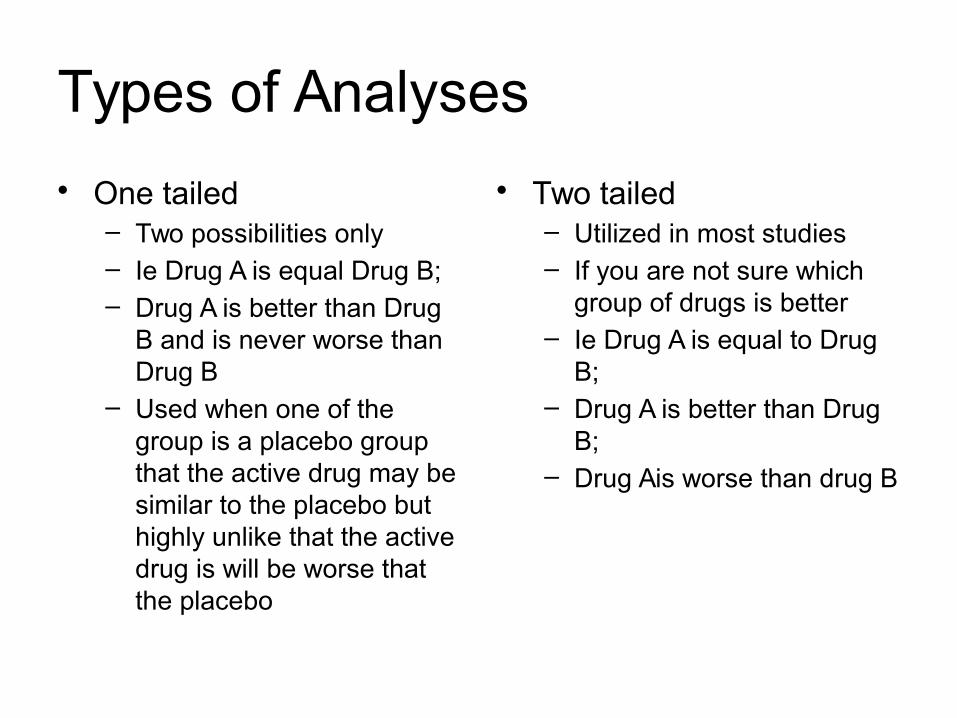
Types of Analyses
• One tailed– Two possibilities only– Ie Drug A is equal Drug B;– Drug A is better than Drug
B and is never worse than Drug B
– Used when one of the group is a placebo group that the active drug may be similar to the placebo but highly unlike that the active drug is will be worse that the placebo
• Two tailed– Utilized in most studies– If you are not sure which
group of drugs is better – Ie Drug A is equal to Drug
B;– Drug A is better than Drug
B;– Drug Ais worse than drug B
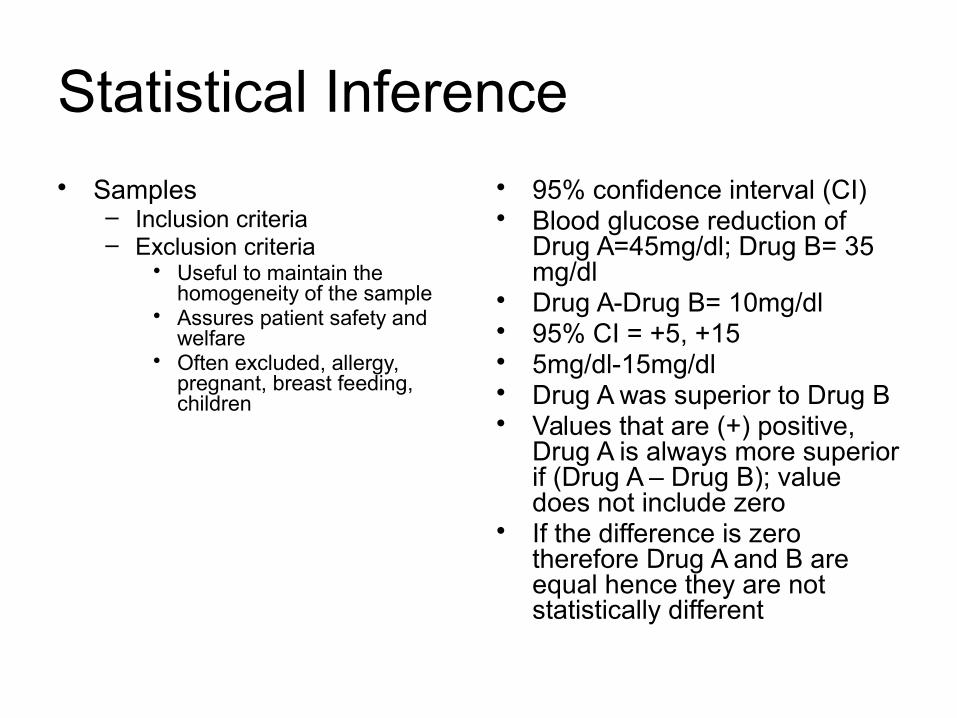
Statistical Inference
• Samples– Inclusion criteria– Exclusion criteria
• Useful to maintain the homogeneity of the sample
• Assures patient safety and welfare
• Often excluded, allergy, pregnant, breast feeding, children
• 95% confidence interval (CI)• Blood glucose reduction of
Drug A=45mg/dl; Drug B= 35 mg/dl
• Drug A-Drug B= 10mg/dl• 95% CI = +5, +15• 5mg/dl-15mg/dl• Drug A was superior to Drug B• Values that are (+) positive,
Drug A is always more superior if (Drug A – Drug B); value does not include zero
• If the difference is zero therefore Drug A and B are equal hence they are not statistically different
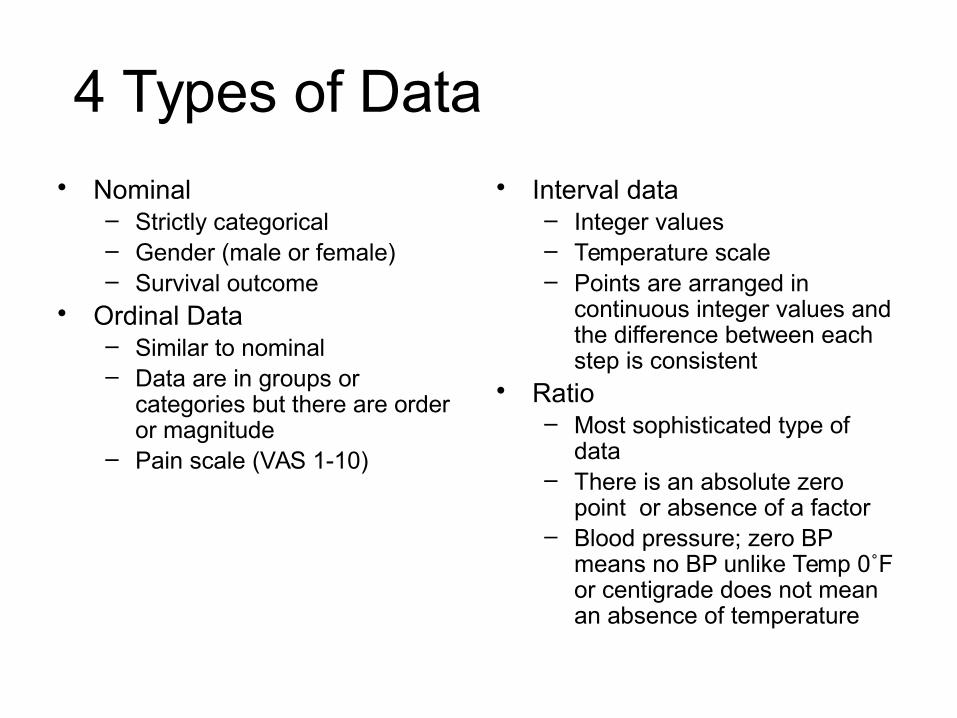
4 Types of Data
• Nominal– Strictly categorical– Gender (male or female)– Survival outcome
• Ordinal Data– Similar to nominal– Data are in groups or
categories but there are order or magnitude
– Pain scale (VAS 1-10)
• Interval data– Integer values– Temperature scale– Points are arranged in
continuous integer values and the difference between each step is consistent
• Ratio– Most sophisticated type of
data– There is an absolute zero
point or absence of a factor– Blood pressure; zero BP
means no BP unlike Temp 0˚F or centigrade does not mean an absence of temperature
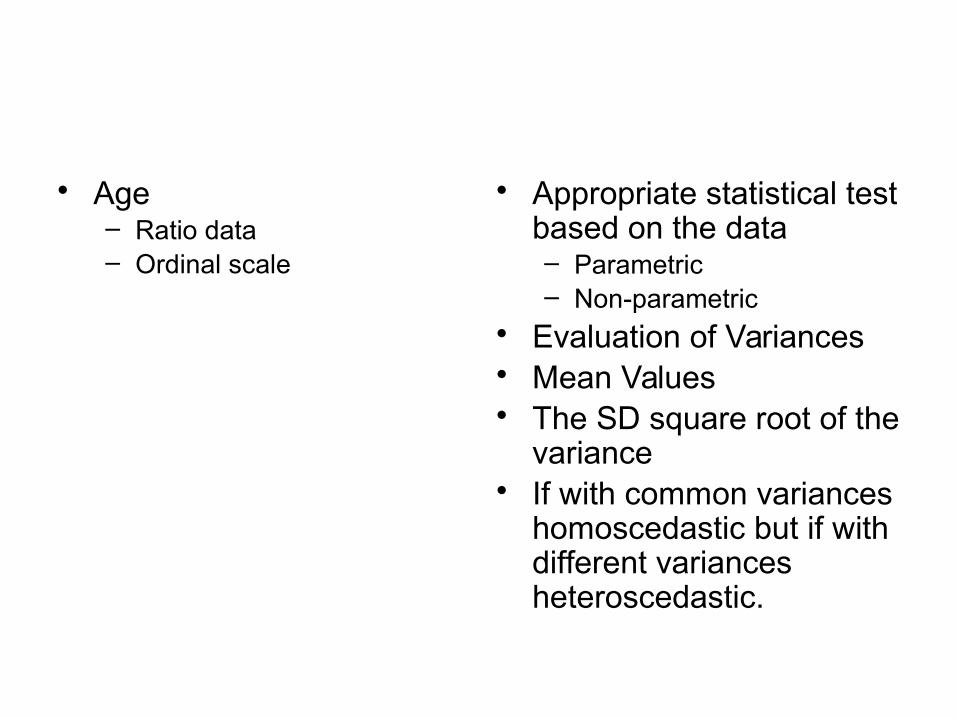
• Age– Ratio data– Ordinal scale
• Appropriate statistical test based on the data– Parametric– Non-parametric
• Evaluation of Variances• Mean Values• The SD square root of the
variance• If with common variances
homoscedastic but if with different variances heteroscedastic.
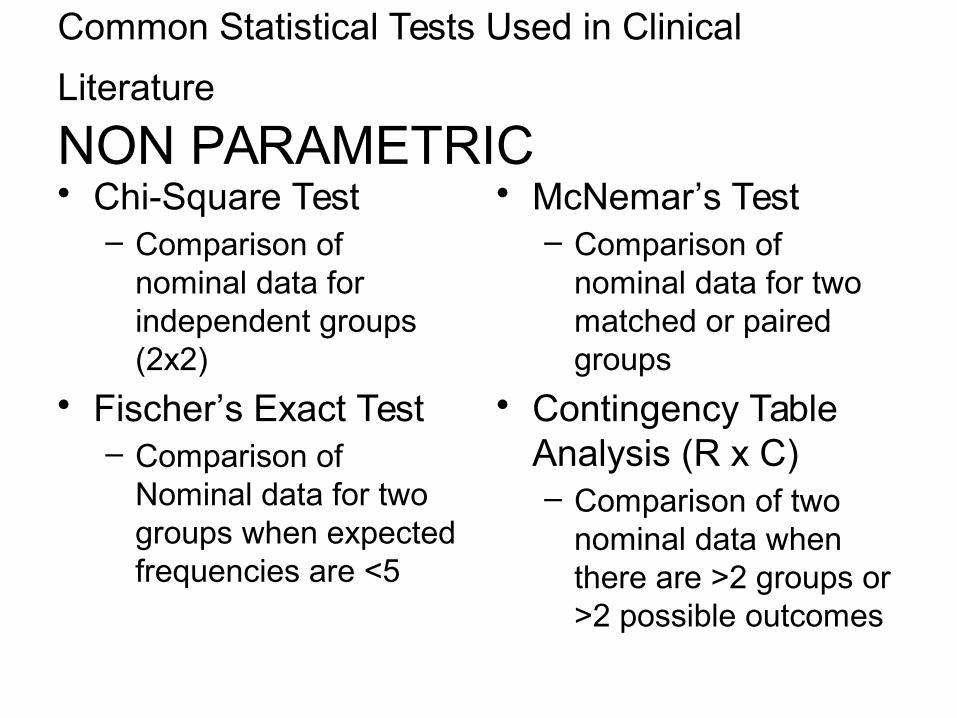
Common Statistical Tests Used in Clinical
Literature NON PARAMETRIC• Chi-Square Test
– Comparison of nominal data for independent groups (2x2)
• Fischer’s Exact Test– Comparison of
Nominal data for two groups when expected frequencies are <5
• McNemar’s Test– Comparison of
nominal data for two matched or paired groups
• Contingency Table Analysis (R x C)– Comparison of two
nominal data when there are >2 groups or >2 possible outcomes
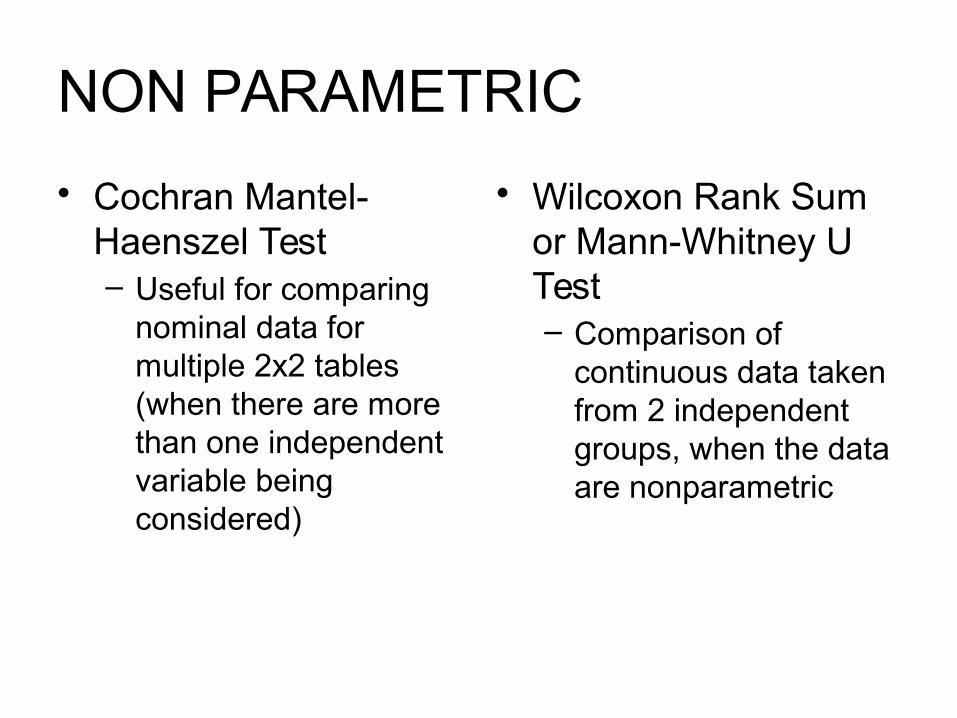
NON PARAMETRIC
• Cochran Mantel-Haenszel Test– Useful for comparing
nominal data for multiple 2x2 tables (when there are more than one independent variable being considered)
• Wilcoxon Rank Sum or Mann-Whitney U Test– Comparison of
continuous data taken from 2 independent groups, when the data are nonparametric
NON PARAMETRIC
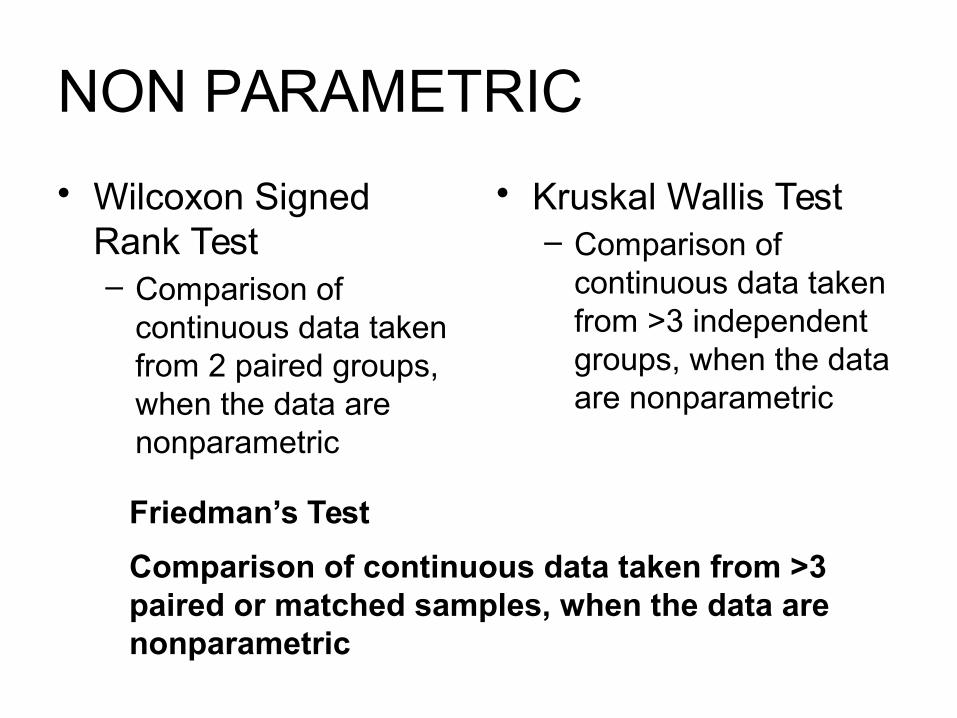
• Wilcoxon Signed Rank Test– Comparison of
continuous data taken from 2 paired groups, when the data are nonparametric
• Kruskal Wallis Test– Comparison of
continuous data taken from >3 independent groups, when the data are nonparametric
Friedman’s Test
Comparison of continuous data taken from >3 paired or matched samples, when the data are nonparametric
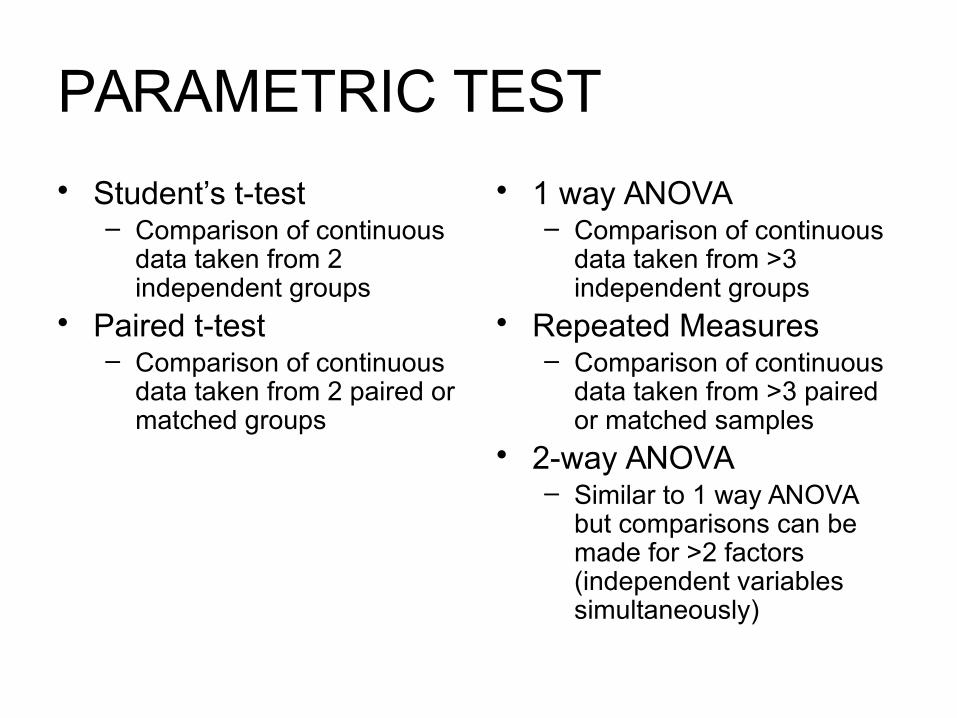
PARAMETRIC TEST
• Student’s t-test– Comparison of continuous
data taken from 2 independent groups
• Paired t-test– Comparison of continuous
data taken from 2 paired or matched groups
• 1 way ANOVA– Comparison of continuous
data taken from >3 independent groups
• Repeated Measures– Comparison of continuous
data taken from >3 paired or matched samples
• 2-way ANOVA– Similar to 1 way ANOVA
but comparisons can be made for >2 factors (independent variables simultaneously)
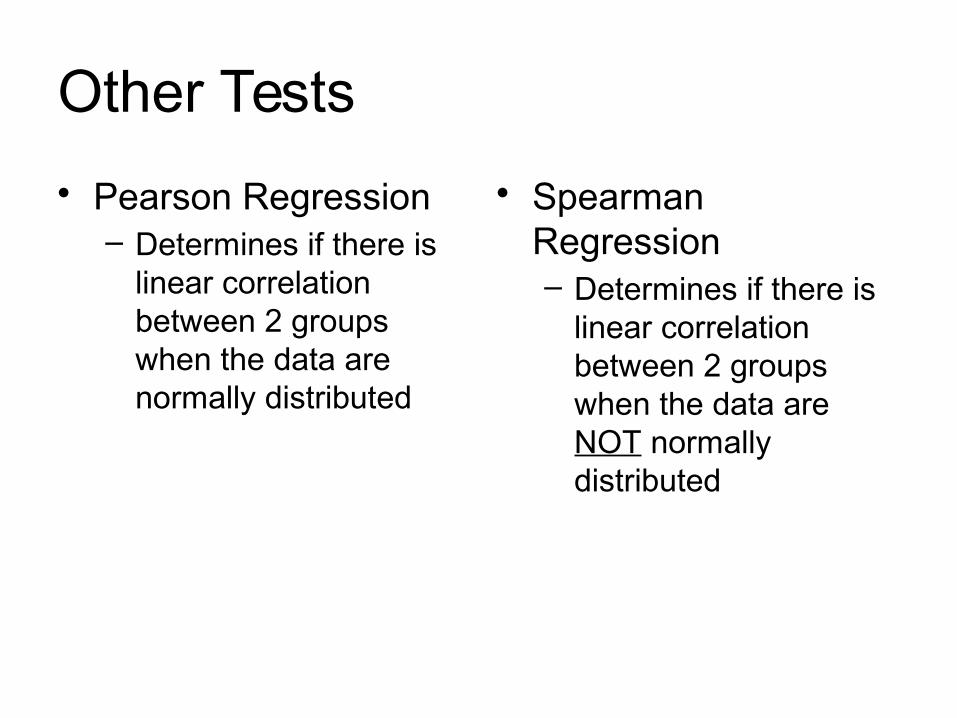
Other Tests
• Pearson Regression– Determines if there is
linear correlation between 2 groups when the data are normally distributed
• Spearman Regression– Determines if there is
linear correlation between 2 groups when the data are NOT normally distributed
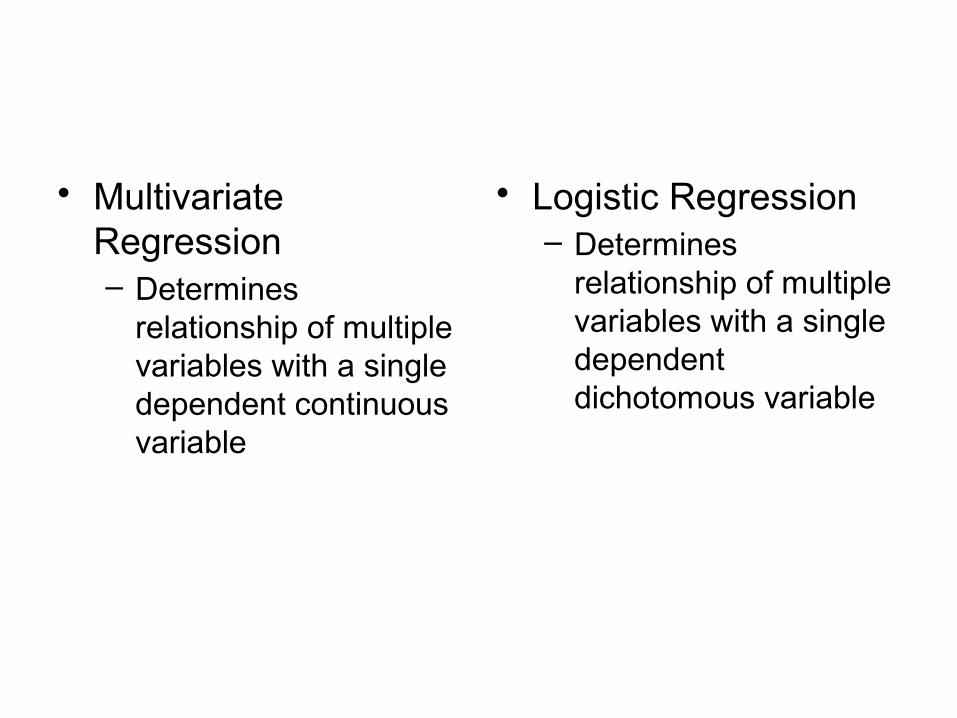
• Multivariate Regression– Determines
relationship of multiple variables with a single dependent continuous variable
• Logistic Regression– Determines
relationship of multiple variables with a single dependent dichotomous variable
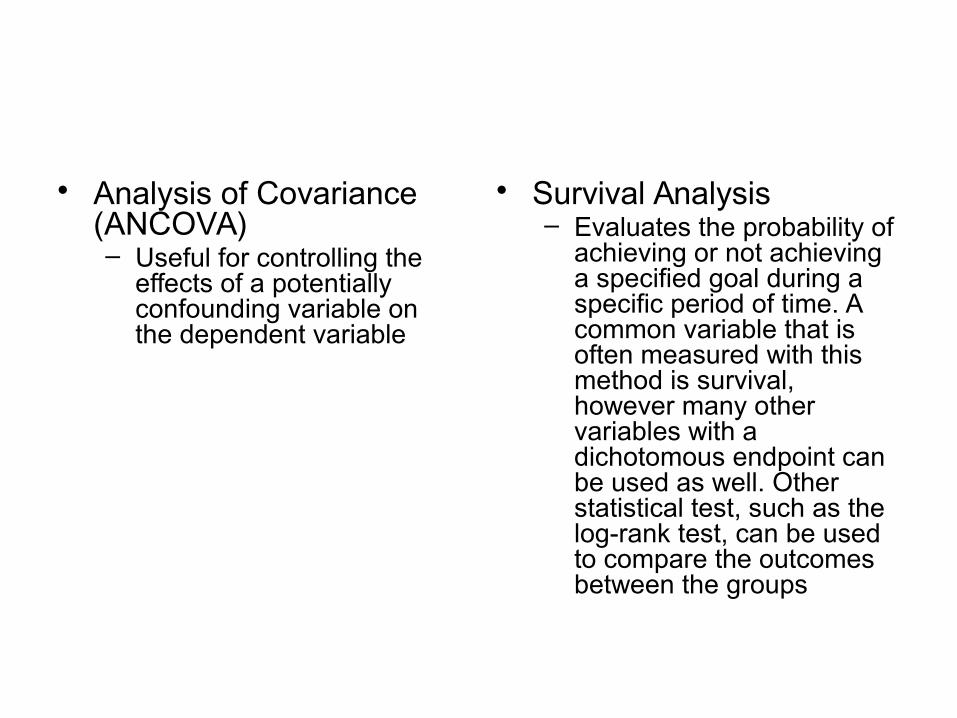
• Analysis of Covariance (ANCOVA)– Useful for controlling the
effects of a potentially confounding variable on the dependent variable
• Survival Analysis– Evaluates the probability of
achieving or not achieving a specified goal during a specific period of time. A common variable that is often measured with this method is survival, however many other variables with a dichotomous endpoint can be used as well. Other statistical test, such as the log-rank test, can be used to compare the outcomes between the groups
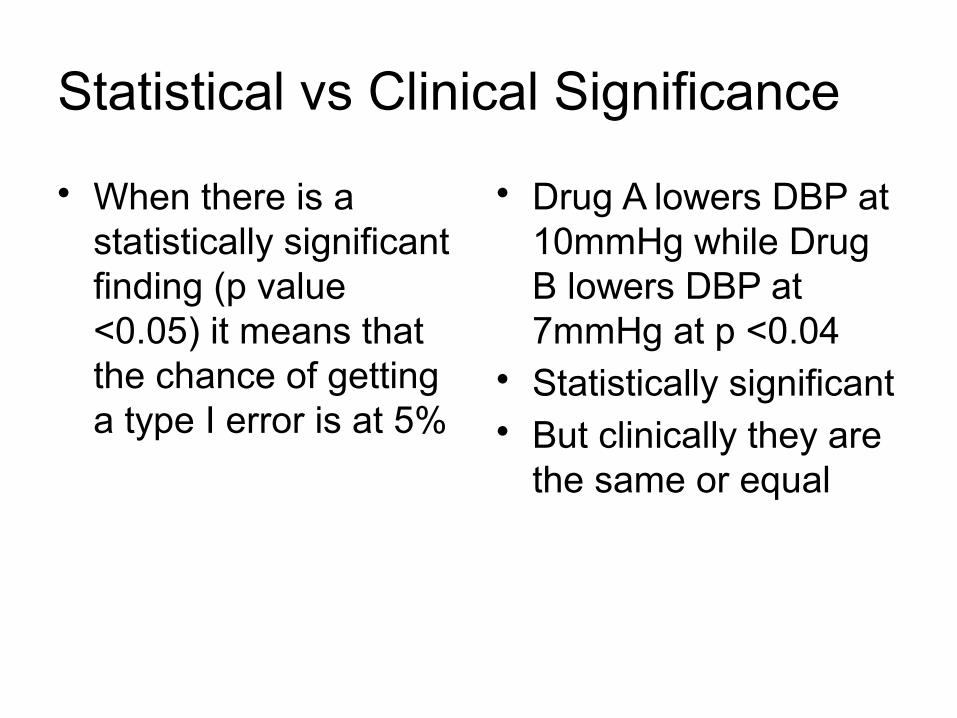
Statistical vs Clinical Significance
• When there is a statistically significant finding (p value <0.05) it means that the chance of getting a type I error is at 5%
• Drug A lowers DBP at 10mmHg while Drug B lowers DBP at 7mmHg at p <0.04
• Statistically significant• But clinically they are
the same or equal
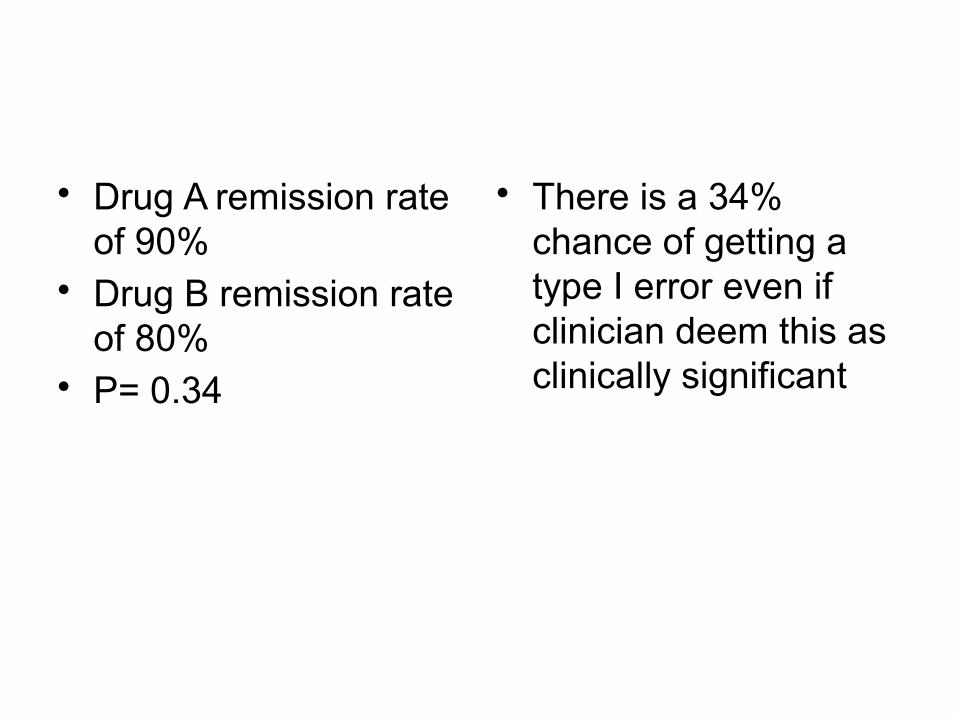
• Drug A remission rate of 90%
• Drug B remission rate of 80%
• P= 0.34
• There is a 34% chance of getting a type I error even if clinician deem this as clinically significant
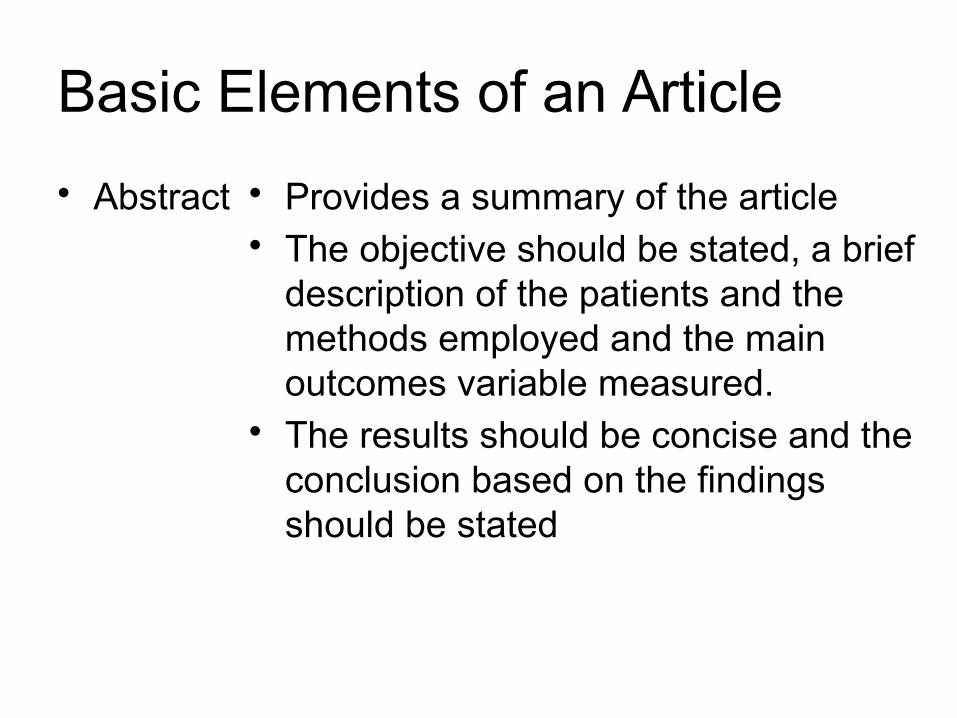
Basic Elements of an Article
• Abstract • Provides a summary of the article• The objective should be stated, a brief
description of the patients and the methods employed and the main outcomes variable measured.
• The results should be concise and the conclusion based on the findings should be stated
• Introduction • Gives background into the problem• The disease state in question• The typical therapy employed• Results from related studies• And the objective should be clearly
stated
• Methodology • The important section of the paper• Should provide in detail the methodology
employed, such as how the patients were chosen to participate, where the study was conducted, the randomization procedures, the use of blinding or control groups, and the study design.
• The methods of data collection for all outcome variables should be clearly stated.
• Laboratory measurements should be specified and described in detail if considered an outcome variable.
• Any measuring devices or analytic equipment should be described in detail, with an assessment of errors in the measurement if possible
• The statistical methods should be clearly outlined, the level of significance should be stated, and all inferential statistical test used in comparison should be listed. Sample size or statistical power calculations should be described here.
• Results • Presents the finding for the study.• There should be no evaluation or
discussion, just a presentation of the results.
• Tables, graphs and pictures may be used to clarify the findings or present material that is difficult to describe with words.
• Discussion/
Conclusion
• Discuss and interprets the findings from the study.
• May compare or contrast the results with findings from other studies.
• The limitation and strengths of the study should be discussed
• A clear conclusion should be stated based solely on the results of the study
• References • Provides a list of publications that provides background on the problem or evidence of previous investigations on related topics that may support or refute the findings of the study.
Useful Guidelines for Evaluating Statistical Reporting in Medical Articles
• 15 guidelines whew!!!!!!!• Am so exhausted na. Will just email the
test to you.• Good Nyt!!!!!!

Recommended


