ISSN: 0973-4945; CODEN ECJHAO
E-Journal of Chemistry
http://www.e-journals.net 2010, 7(3), 962-966
Estimation of Atenolol by Reverse Phase
High Performance Liquid Chromatography
NAVEEN KUMAR*, NISHANT VERMA, OMVEER SONGH,
NAVEEN JOSHI and KANWAR GAURAV SINGH§.
School of Pharmaceutical Sciences, Shobhit University, Meerut-250110, India. §Singhania University Pacheri Bari, Distt. Jhunjhunu (Rajasthan)-333515, India.
Received 6 December 2009; Accepted 2 February 2010
Abstract: A simple, precise, sensitive, fast and accurate high performance
liquid chromatography method has been developed for the determination of
atenolol using mixture of phosphate buffer and acetonitrile (53:47 v/v) as mobile
phase. Buffer was prepared by mixing 0.02 M K2PO4 and 0.003 M KH2PO4 in
equal proportion. Detection was carried out using UV detector at λmax 230 nm.
Column was ODS and dimensions of column was 25 mm x 4.6 mm. Atenolol
was eluted out at retention time of 2.1 min. Method was validated at 1.2 mL/min
flow rate. Calibration curve was linear between ranges of 40 to 200 mcg
concentration. The limit of detection was calculates 120 nano gram and limit of
quantitation is 510 nano gram. The relative standard deviation (RSD) of atenolol
was 0.6. The percentage recovery of atenolol was 99.6%.
Keywords: HPLC, ODS, Validation, Atenolol.
Introduction
HPLC is high performance liquid chromatography. It can be used for qualitative and
quantitative analysis. HPLC is very sophisticated instrument and widely used in analysis1-4
.
Atenolol is well known drug widely used in the treatment of hypertension. Atenolol (ATL),
chemically is known as (R, S)-4-(2-hydroxy-3-isopropyl-aminopropoxy) phenyl
acetamide, is a beta-adrenoceptor antagonist. It is official in the Indian Pharmacopoeia4-6
and the British Pharmacopoeia. Literature reveals that there are few methods for estimation
of atenolol in bulk and its dosage form. Several works have been reported on atenolol
determination in plasma, formulations adopting gas chromatographic techniques with an
electron capture detector or HPLC, using reverse phase columns and UV or fluorometric
detection6-10
. These methods can be used successfully for quality control testing of the drugs
from single and combined dosage form.
3.5 3.0
Time
0.0 0.5 1.0 1.5 2.0 2.5
0
200
400
600
800
(V)
Estimation of Atenolol by RP-HPLC 963
Experimental
Standard bulk drug sample of atenolol is procured from Unicare (India) Pvt. Ltd., Noida
(U.P.) India. All other reagents used were of analytical grade for spectroscopic method and
HPLC grade for HPLC method.
HPLC is schimadzu SPD 10 a modal system with 1 cm matched quartz cell was used
for spectrophotometric method. Spectra were recorded using specific program of apparatus,
having specifications as follows: Spectral bandwidth 3 nm, wavelength accuracy ± 0.5 nm
and wavelength readability 0.1 nm increments. Acetonitrile is HPLC grade from Rankem
which is already passed through 0.2 micron pore size filter paper. Water is triple distilled
that used in this experiment and passed through 0.45 micron filter paper with help of
vacuum pump. K2HPO4 and KH2PO4 were also GR grade which used in HPLC analysis and
they are both from Rankem. All the glass wares are made up of borosilicate glass.
Chromatographic conditions
Chromatographic separations were achieved using an Inertsil ODS C18 (250 x 4.6 mm, 5µ)
analytical column. The mobile phase consisting of acetonitrile and phosphate buffer (47:53 v/v)
was passed through 0.45 µ membrane filter and degas by altrasonications. The flow rate was
maintained at 1.2 mL /min and the measurements were made at 230 nm. The column and the
HPLC system were kept in ambient temperature
Preparation of buffer solution
Phosphate buffer pH 7 was prepared by dissolving 136 mg of potassium dihydrogen
phosphate in 100 mL of water and 0.52 mg of dipotassium hydrozen phosphate in 100 mL of
water. The above solutions are mixed in 1:1 ratio to get pH 7.
Preparation of mobile phase
Prepared buffer and acetonitrile were mixed in 53:47 (v/v) ratios. The solution was sonicated
to degas mixture. Mobile phase was passed through 0.45µm pore size filter paper.
Standard solution
Atenolol standard solution was prepared by separately dissolving 25 mg of pure drug in 25 mL
of mobile phase. Standard atenolol was dissolved in 15 mL of mobile phase and sonicated
for 5 min. Then diluted to 25 mL with mobile phase to get 100 µg mL-1
for atenolol and
passed through 0.45 µm membrane filter. Mixture was degas by altrasonications. At first, a
blank solution (mobile phase) was injected and chromatogram was recorded. Before
injection of these solutions into injector loop, it passed through 0.45 µm filter.
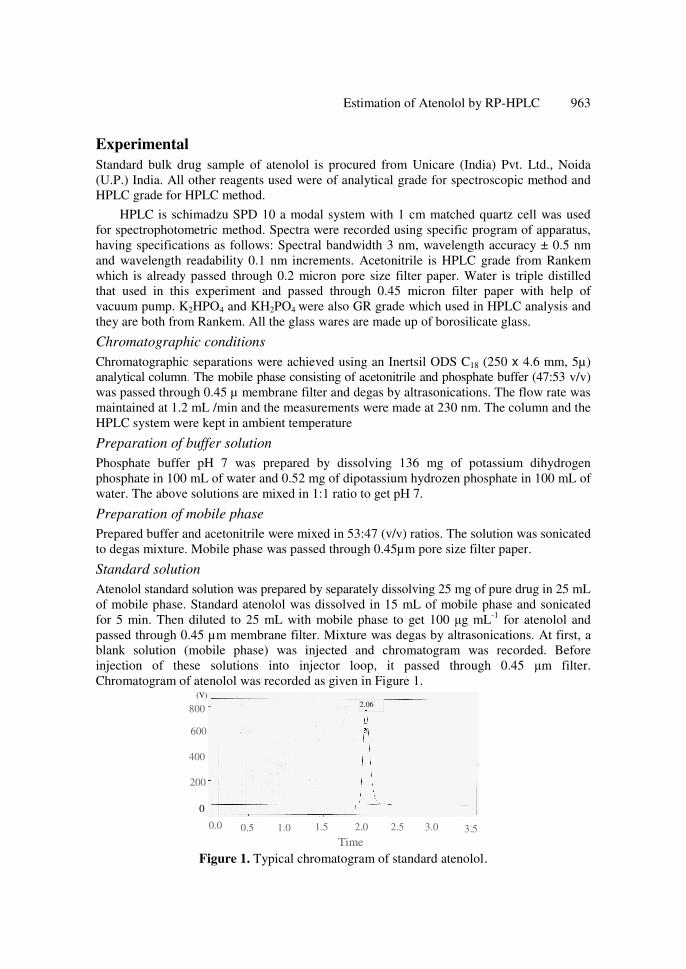
Chromatogram of atenolol was recorded as given in Figure 1.
Figure 1. Typical chromatogram of standard atenolol.
2.06

964 NAVEEN KUMAR et al.
Method validation11-13
Linearity and range of method was determined on standard solution by analyzing
40 to 200 mcg/mL concentration of test concentration and the calibration curve was plotted
using AUC versus concentration of standard solution (Figure 2). Accuracy of method was
ascertained by recovery study by adding a known amount of standard drug (±20% of test
concentration) to pre-analysed sample and reanalyzing the samples by the proposed method.
Precision was studied by analyzing six replicates of standard solution. Specificity was
carried out by injecting placebo solution. The chromatographic parameters were also
validated by system suitability studies (Table 1) which were carried out on freshly prepared
standard stock solution.
Table 1. System suitability.
S. No. Parameters Obtained values
1 Retention time, min 2.096
2 Area 2072.2
3 S.D 7.5
4 RSD 0.3
Results and Discussion Linerity
A linear relationship should be evaluated across the range of the analytical procedure. It is
be demonstrated directly on the substance (by the dilution of standard stock solution) and
separate weighing of synthetic mixture of the product component, using the proposed
procedure. The latter aspect can be studied during investigation of range.
Linearity should be evaluated by the visual inspection of a plot of signals as a function
of compound concentration content. If there is a linear relationship, test results should be
evaluated by appropiate statistical methods, for example- calculation of a regression line by
the method of least square. In some cases, to obtain linearity between assay and sample
concentration, the test data need to be subjected to a mathematical transformation prior to
regression analysis. Data from the regression line itself may be helpful to provide
mathematical estimates of the degree of linearity.
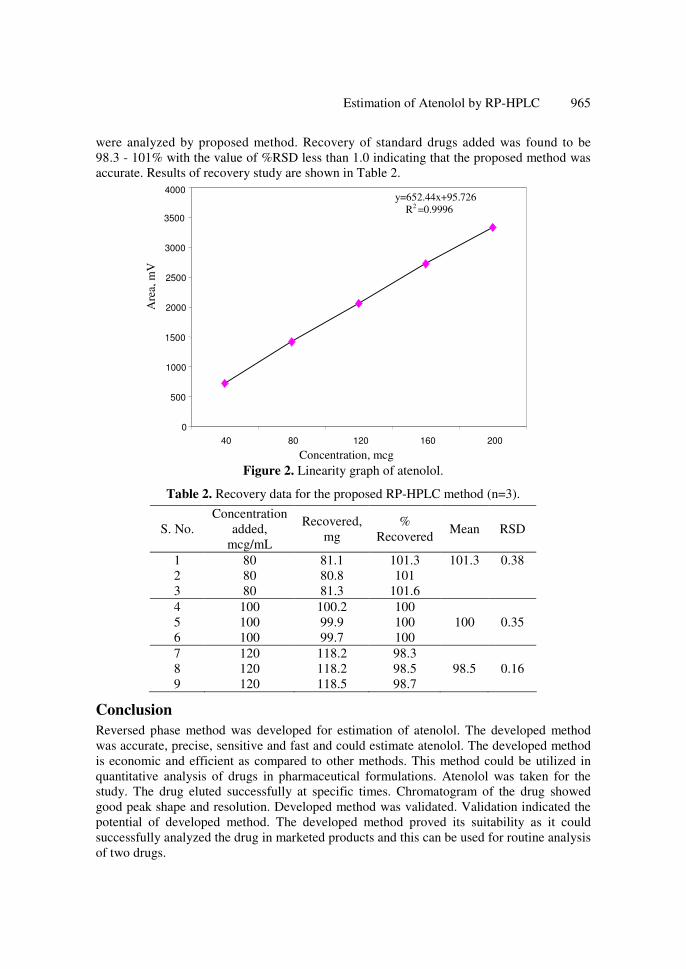
Calibration curves were constructed using three series of standard atenolol solution in
the range of 40.0-200.0 µg/mL. The equation of linear regression and statistical data are
presented in Figure 2. The linearity of the calibration curve was validated by the high value
of the correlation coefficient. They were represented by the linear regression equation
YAT = 652.44x +95.726 and R2 = 0.9996.
Precison
Intra day precison was performed for six replicate for drug in method under the limit of ICH
guideline. Relative standard deviation of atenolol is 0.64. The assays gave satisfactory
results; the relative standard deviations (RSD.) were less than 2. This level of precision of
the proposed method was adequate for the quality control analysis of atenolol in its
pharmaceutical formulations.
Accuracy test
The accuracy of the method was checked by recovery study using standard addition method
at three different concentration levels, i.e., multilevel recovery study. The preanalyzed
samples were spiked with extra 80, 100 and 120% of the standard atenolol and the mixtures
Are
a, m
V
Concentration, mcg
Estimation of Atenolol by RP-HPLC 965
were analyzed by proposed method. Recovery of standard drugs added was found to be
98.3 - 101% with the value of %RSD less than 1.0 indicating that the proposed method was
accurate. Results of recovery study are shown in Table 2.
Figure 2. Linearity graph of atenolol.
Table 2. Recovery data for the proposed RP-HPLC method (n=3).
S. No.
Concentration
added,
mcg/mL
Recovered,
mg
%
Recovered Mean RSD
1 80 81.1 101.3 101.3 0.38
2 80 80.8 101
3 80 81.3 101.6
4 100 100.2 100
5 100 99.9 100 100 0.35
6 100 99.7 100
7 120 118.2 98.3
8 120 118.2 98.5 98.5 0.16
9 120 118.5 98.7
Conclusion
Reversed phase method was developed for estimation of atenolol. The developed method
was accurate, precise, sensitive and fast and could estimate atenolol. The developed method
is economic and efficient as compared to other methods. This method could be utilized in
quantitative analysis of drugs in pharmaceutical formulations. Atenolol was taken for the
study. The drug eluted successfully at specific times. Chromatogram of the drug showed
good peak shape and resolution. Developed method was validated. Validation indicated the
potential of developed method. The developed method proved its suitability as it could
successfully analyzed the drug in marketed products and this can be used for routine analysis
of two drugs.
0
500
1000
1500
2000
2500
3000
3500
4000
40 80 120 160 200
y=652.44x+95.726
R2 =0.9996
966 NAVEEN KUMAR et al.
References
1. Gajewska M, Glass G and Koste ecki J, Acta Pol Pharm., 1992, 49(3), 1-4.
2. Keech A C, Harrison P M and Mclean A J, J Chrom Biomed Appl., 1988, 70, 234-236.
3. Rao G R, Avadhanulu A B, Giridhar R, Pantalu R R and Kokate C K, East Pharm.,
1990, 33(386), 125-126.
4. Shimoka K, Sawada Y and Teternatsu H, J Pharm Biomed Anal., 1989, 7(11), 1267-1272.
5. Indian Pharmacopoeia, Indian Pharmacopoeia Commission, 1996, 1, 73-75.
6. Arias R, Jim R M, Alonso R M, Lez M T, Arrieta I, Flores P and Lastra E O, J
Chromatogr A, 2001, 916, 297-304.
7. Carl A G, The Comprehensive Pharmacology Reference, 2008, 1-6.
8. Johnell K and Fastbom J, Arch Osteoporos, 2009, 4(1-2), 17-23.
9. Agon P, Goethals P, Van Haver, D and Kaufman J M, J Pharm Pharmacol., 1991, 43,
597-600.
10. Krzesinski J M and Scheen A J, Rev Med Liege., 2009. 64(2), 103-108.
11. Knight C J and Fox K M, Am J Cardiol., 1998, 81(2), 133-136.
12. Lindgren P, Buxton M, Kahan T, Poulter N R, Dahlöf B, Sever P S, Wedel H and
Jönsson B, Pharmacoeconomic, 2009, 27(3), 221-23.
13. Yamanaka S, Tatsumi T, Shiraishi J, Mano A, Keira N, Matoba S, Asayama J,
Fushiki S, Fliss H and Nakagawa M, J Am Coll Cardiol., 2003, 41(5), 870-878.

Submit your manuscripts athttp://www.hindawi.com
Hindawi Publishing Corporationhttp://www.hindawi.com Volume 2014
Inorganic ChemistryInternational Journal of
Hindawi Publishing Corporation http://www.hindawi.com Volume 2014
International Journal ofPhotoenergy
Hindawi Publishing Corporationhttp://www.hindawi.com Volume 2014
Carbohydrate Chemistry
International Journal of
Hindawi Publishing Corporationhttp://www.hindawi.com Volume 2014
Journal of
Chemistry
Hindawi Publishing Corporationhttp://www.hindawi.com Volume 2014
Advances in
Physical Chemistry
Hindawi Publishing Corporationhttp://www.hindawi.com
Analytical Methods in Chemistry
Journal of
Volume 2014
Bioinorganic Chemistry and ApplicationsHindawi Publishing Corporationhttp://www.hindawi.com Volume 2014
SpectroscopyInternational Journal of
Hindawi Publishing Corporationhttp://www.hindawi.com Volume 2014
The Scientific World JournalHindawi Publishing Corporation http://www.hindawi.com Volume 2014
Medicinal ChemistryInternational Journal of
Hindawi Publishing Corporationhttp://www.hindawi.com Volume 2014
Chromatography Research International
Hindawi Publishing Corporationhttp://www.hindawi.com Volume 2014
Applied ChemistryJournal of
Hindawi Publishing Corporationhttp://www.hindawi.com Volume 2014
Hindawi Publishing Corporationhttp://www.hindawi.com Volume 2014
Theoretical ChemistryJournal of
Hindawi Publishing Corporationhttp://www.hindawi.com Volume 2014
Journal of
Spectroscopy
Analytical ChemistryInternational Journal of
Hindawi Publishing Corporationhttp://www.hindawi.com Volume 2014
Journal of
Hindawi Publishing Corporationhttp://www.hindawi.com Volume 2014
Quantum Chemistry
Hindawi Publishing Corporationhttp://www.hindawi.com Volume 2014
Organic Chemistry International
Hindawi Publishing Corporationhttp://www.hindawi.com Volume 2014
CatalystsJournal of
ElectrochemistryInternational Journal of
Hindawi Publishing Corporation http://www.hindawi.com Volume 2014
Recommended