Embed Size (px)
Citation preview
Ph.D Thesis Atenolol Press Coated (HE) Tablet
Rajesh A. Keraliya 129
CHAPTER 6: FORMULATION AND EVALUATION OF
ATENOLOL PULSATILE PRESS COATED TABLETS USING
RUPTURABLE AND ERODIBLE POLYMERS
6.1. INTRODUCTION AND AIM OF THE STUDY
In order to achieve the chronopharmaceutical design for the time controlled pulsatile type
of colon targeted preparations, formulation design to control the lag time is prior to the
immediate release of drug. These systems have a peculiar mechanism of delivering the
drug rapidly and completely after a lag time (a period of no drug release). Though most
delivery systems are designed for constant drug release over a prolong period of time,
pulsatile delivery systems are characterized by a programmed drug release, as constant
blood levels of a drug may not always be desirable. Pulsatile time release systems are
designed in a manner that the drug is available at the site of action at the right time in the
right amount. These systems are beneficial for drugs having high first pass effect, drugs
administered for diseases that follow chronological behavior, drugs having specific
absorption site in GIT, targeting to colon, where night time dosing is required (Sadaphal
et al., 2011).
Atenolol, a β-blocker, is prescribed widely in diverse cardiovascular diseases like;
Hypertension, angina pectoris, arrhythmias, and myocardial infarction. In case of
cardiovascular diseases, several functions (e.g. BP, heart rate, stroke volume, cardiac
output, blood flow) of the cardiovascular system are subject to circadian rhythms. It has
been reported that more shocks and heart attacks occur during morning hours (Shweta et
al., 2008). The level of cortisol is higher in the morning hours, and its release is reported
to decline gradually during the day. Blood pressure is also reported to be high in the
morning till late afternoon, and then drops off during night (Lemmer, 1999). On oral
administration of colon targeted pulsatile drug delivery system at bed time, releases
atenolol after a desired lag time of about 6 – 6.5 hr which corresponds with peak levels of
cortisol, capillary resistance, platelet agreeability and vascular reactivity in the morning
hours, which leads to hypertension in the early hours of the morning.
Ph.D Thesis Atenolol Press Coated (HE) Tablet
Rajesh A. Keraliya 130
After oral administration, press coated tablets undergo transit from the stomach to the
cecum or colon. Despite widespread use of pH dependent systems for colon targeted
delivery of drugs, there has always been a controversy about their usefulness for the
intended purpose, mainly because of high pH variability of the gastrointestinal tract
between and within individuals and lack of proper coating materials that would dissolve
at the desired pH of the colon. It is affected by diet and disease. During acute stage of
inflammatory bowel disease colonic pH has been found to be significantly lower than
normal. In ulcerative colitis pH values 2.3—4.7 have been measured in the proximal parts
of the colon (Ashish et al., 2009). This disadvantage was overcome by developing time
dependent rupturable and erodible type press coated pulsatile colon targeted drug
delivery using combination of hydrophilic and hydrophobic polymer.
Hydroxypropylmethylcellulose (HPMC) is a well known water-soluble polymer that has
long been used as a rate-controlling membrane in medication dosage forms to regulate
drug release. HPMC has an ability to swell upon gellification once in contact with water.
The gel becomes a viscous layer around a core, acting as a protective barrier to both the
influx of water and the efflux of the drug in solution (Kiil and Dam, 2003). HPMC K4M
has a swelling, viscous property of gelation and an erosion property which might delay
the drug release because of lengthening of the drug diffusion pathway and drug release
rate. This hydrophilic polymer is responsible for rupturing the outer coat (Andrea et al.,
2008). Hydrophilic polymer (HPMC K4M) alone for controlling the drug release of
highly water soluble drugs like atenolol is restricted due to rapid diffusion of the
dissolved drug through the hydrophilic gel layer (Lin et al., 2004). Use of hydrophobic
polymers such as Ethyl cellulose with HPMC K4M will retard the drug release. So, in the
present investigation, an attempt has been to formulate time controlled pulsatile release
tablets of atenolol using hydrophilic polymer (HPMC K4M) in combination with
hydrophobic polymer (EC). Ethylcellulose (EC) is a semipermeable in nature, although it
is naturally insoluble in water, has been used as a rate-controlling membrane to regulate
drug release. EC has been directly compressed to form compact film in which plastic
deformation is the predominant consolidation mechanism (Liberman et al., 1990). Ethyl
cellulose exhibiting a porous structure, it controls the diffusion of the water inside the
coating layer of HPMC K4M, kept integrity of sweallbale layer of HPMC K4M and the
Ph.D Thesis Atenolol Press Coated (HE) Tablet
Rajesh A. Keraliya 131
retard the drug release. When the barrier layer containing HPMC K4M along with ethyl
cellulose was exposed to dissolution media, the HPMC K4M particles swell and erode
which is responsible for breakdown of outer coating, a process which was retarded to
varying degrees depending upon the quantity of EC present, demonstrating that
manipulation of both components controls the erosion rate (Rubinstein et al., 1997).
The purpose of this study was to develop press coated tablets for pulsatile drug delivery
of atenolol by achieving the pH independent time-controlled disintegrating or rupturing
function with a distinct predetermined lag time. The rapidly disintegrating inner core
tablets containing atenolol and other excipients were compression coated by a barrier
layer consisting of mixture of different weight ratios of hydrophobic polymer
(ethylcellulose) and hydrophilic polymers (HPMC K4M) to avoid drug release in gastric
and intestinal fluids. Ethyl cellulose was chosen because of its rupturable behavior and
HPMC K4M was chosen because of its swelling and erodible behavior.
6.2. PREPARATION OF ATENOLOL CORE (AT2) TABLETS
The core tablets of atenolol (AT2) were prepared by direct compression method. An
optimized core tablet was formulated using various concentrations of dry binder and
super disintegrant as describe in table 21. An accurately weighed quantity of atenolol,
microcrystalline cellulose, polyvinyl pyrroloide (PVP K30) and sodium starch glycolate
pass through 40# and mix in double cone blender for 15 min. Add talc (2% w/w) (40#)
into blend and mix in double cone blender for 10 min. Add magnesium stearate (1% w/w)
(40#) into blend and mix in double cone blender for 5 min. The resultant powder
mixtures were compressed into tablets (average tablet weight = 80 mg) by 6 mm standard
concave plain punches using rotary tabletting machine (Hardik Engineering Works,
Ahmedabad, India). The prepared atenolol core tablets were tested for weight variation,
hardness, thickness, drug content, disintegration time, friability and in vitro dissolution
study (Sawada et al., 2003, Mayur et al., 2009, Gang et al., 2004).
6.3. PREPARATION OF ATENOLOL PRESS COATED (HE) TABLETS
The core tablets were compression coated with 150 mg of coating material containing
different weight ratios of HPMC K4M and EC. The weight ratios of HPMC K4M and EC
Ph.D Thesis Atenolol Press Coated (HE) Tablet
Rajesh A. Keraliya 132
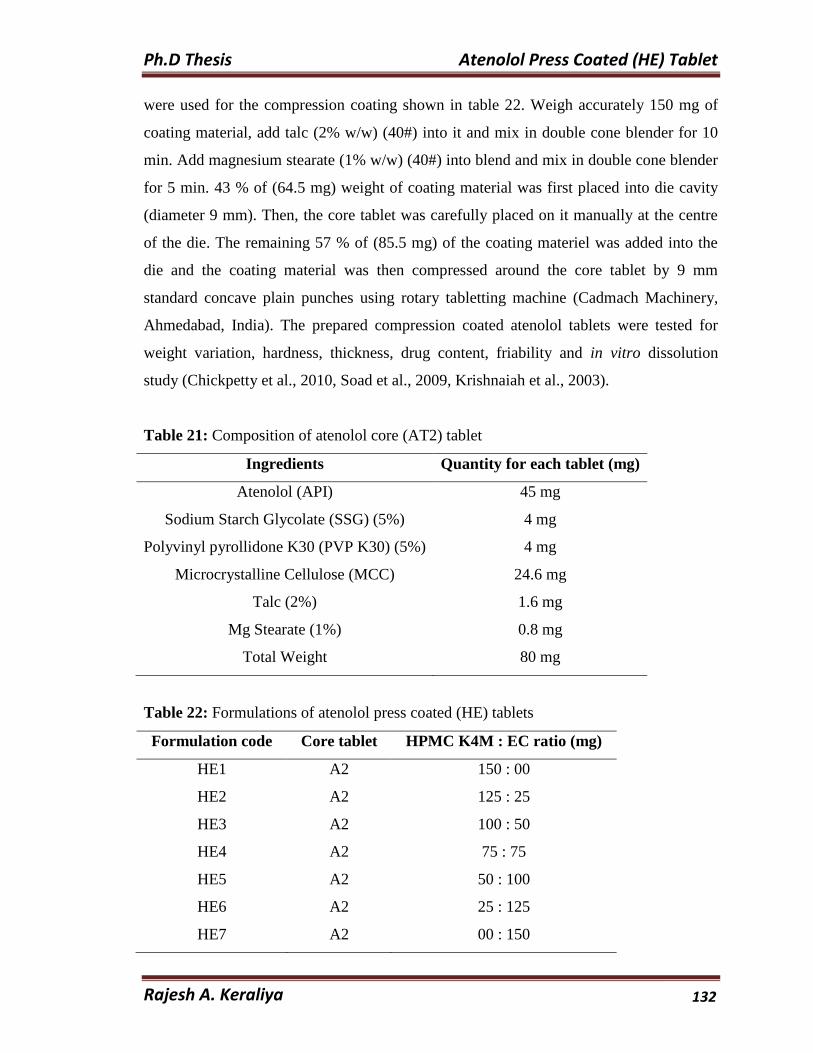
were used for the compression coating shown in table 22. Weigh accurately 150 mg of
coating material, add talc (2% w/w) (40#) into it and mix in double cone blender for 10
min. Add magnesium stearate (1% w/w) (40#) into blend and mix in double cone blender
for 5 min. 43 % of (64.5 mg) weight of coating material was first placed into die cavity
(diameter 9 mm). Then, the core tablet was carefully placed on it manually at the centre
of the die. The remaining 57 % of (85.5 mg) of the coating materiel was added into the
die and the coating material was then compressed around the core tablet by 9 mm
standard concave plain punches using rotary tabletting machine (Cadmach Machinery,
Ahmedabad, India). The prepared compression coated atenolol tablets were tested for
weight variation, hardness, thickness, drug content, friability and in vitro dissolution
study (Chickpetty et al., 2010, Soad et al., 2009, Krishnaiah et al., 2003).
Table 21: Composition of atenolol core (AT2) tablet
Ingredients Quantity for each tablet (mg)
Atenolol (API) 45 mg
Sodium Starch Glycolate (SSG) (5%) 4 mg
Polyvinyl pyrollidone K30 (PVP K30) (5%) 4 mg
Microcrystalline Cellulose (MCC) 24.6 mg
Talc (2%) 1.6 mg
Mg Stearate (1%) 0.8 mg
Total Weight 80 mg
Table 22: Formulations of atenolol press coated (HE) tablets
Formulation code Core tablet HPMC K4M : EC ratio (mg)
HE1 A2 150 : 00
HE2 A2 125 : 25
HE3 A2 100 : 50
HE4 A2 75 : 75
HE5 A2 50 : 100
HE6 A2 25 : 125
HE7 A2 00 : 150
Ph.D Thesis Atenolol Press Coated (HE) Tablet
Rajesh A. Keraliya 133
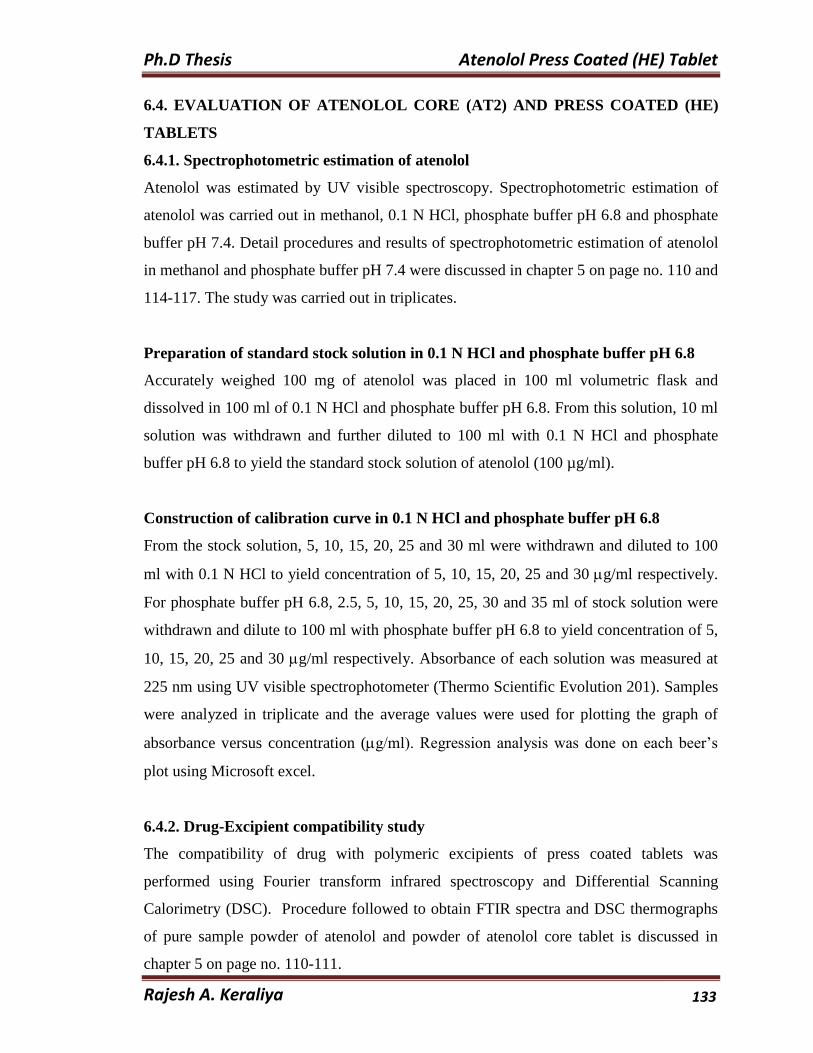
6.4. EVALUATION OF ATENOLOL CORE (AT2) AND PRESS COATED (HE)
TABLETS
6.4.1. Spectrophotometric estimation of atenolol
Atenolol was estimated by UV visible spectroscopy. Spectrophotometric estimation of
atenolol was carried out in methanol, 0.1 N HCl, phosphate buffer pH 6.8 and phosphate
buffer pH 7.4. Detail procedures and results of spectrophotometric estimation of atenolol
in methanol and phosphate buffer pH 7.4 were discussed in chapter 5 on page no. 110 and
114-117. The study was carried out in triplicates.
Preparation of standard stock solution in 0.1 N HCl and phosphate buffer pH 6.8
Accurately weighed 100 mg of atenolol was placed in 100 ml volumetric flask and
dissolved in 100 ml of 0.1 N HCl and phosphate buffer pH 6.8. From this solution, 10 ml
solution was withdrawn and further diluted to 100 ml with 0.1 N HCl and phosphate
buffer pH 6.8 to yield the standard stock solution of atenolol (100 µg/ml).
Construction of calibration curve in 0.1 N HCl and phosphate buffer pH 6.8
From the stock solution, 5, 10, 15, 20, 25 and 30 ml were withdrawn and diluted to 100
ml with 0.1 N HCl to yield concentration of 5, 10, 15, 20, 25 and 30 g/ml respectively.
For phosphate buffer pH 6.8, 2.5, 5, 10, 15, 20, 25, 30 and 35 ml of stock solution were
withdrawn and dilute to 100 ml with phosphate buffer pH 6.8 to yield concentration of 5,
10, 15, 20, 25 and 30 g/ml respectively. Absorbance of each solution was measured at
225 nm using UV visible spectrophotometer (Thermo Scientific Evolution 201). Samples
were analyzed in triplicate and the average values were used for plotting the graph of
absorbance versus concentration (g/ml). Regression analysis was done on each beer’s
plot using Microsoft excel.
6.4.2. Drug-Excipient compatibility study
The compatibility of drug with polymeric excipients of press coated tablets was
performed using Fourier transform infrared spectroscopy and Differential Scanning
Calorimetry (DSC). Procedure followed to obtain FTIR spectra and DSC thermographs
of pure sample powder of atenolol and powder of atenolol core tablet is discussed in
chapter 5 on page no. 110-111.
Ph.D Thesis Atenolol Press Coated (HE) Tablet
Rajesh A. Keraliya 134
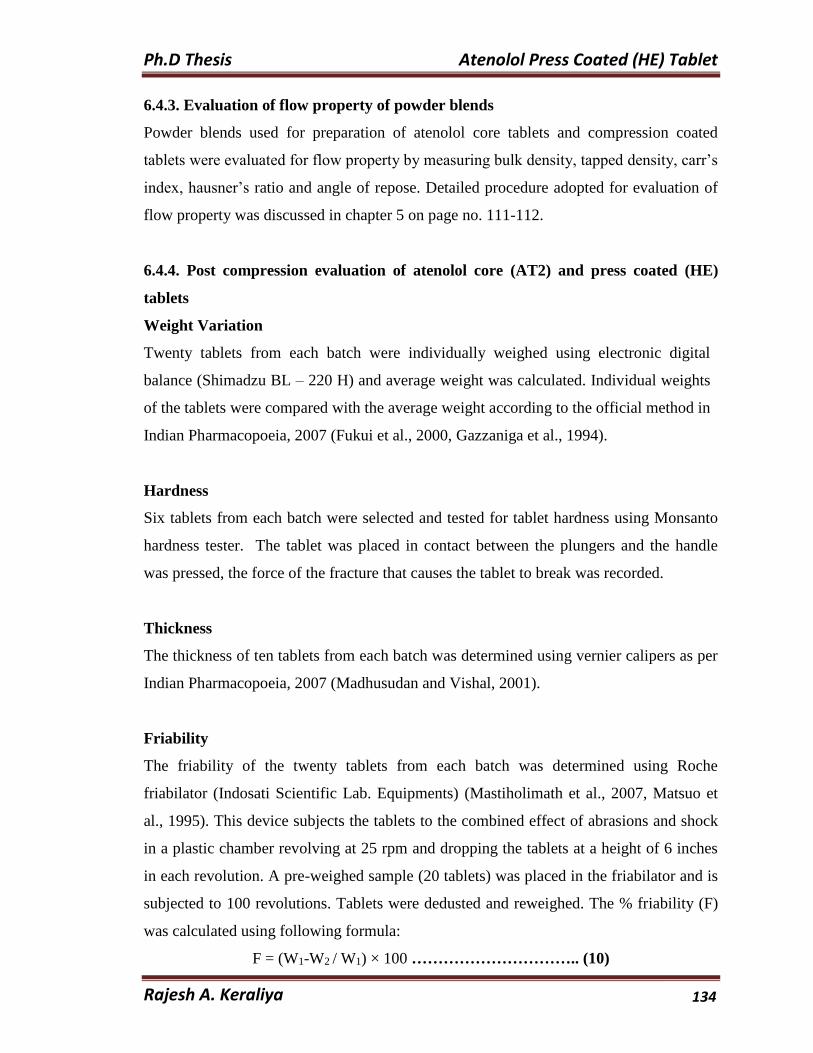
6.4.3. Evaluation of flow property of powder blends
Powder blends used for preparation of atenolol core tablets and compression coated
tablets were evaluated for flow property by measuring bulk density, tapped density, carr’s
index, hausner’s ratio and angle of repose. Detailed procedure adopted for evaluation of
flow property was discussed in chapter 5 on page no. 111-112.
6.4.4. Post compression evaluation of atenolol core (AT2) and press coated (HE)
tablets
Weight Variation
Twenty tablets from each batch were individually weighed using electronic digital
balance (Shimadzu BL – 220 H) and average weight was calculated. Individual weights
of the tablets were compared with the average weight according to the official method in
Indian Pharmacopoeia, 2007 (Fukui et al., 2000, Gazzaniga et al., 1994).
Hardness
Six tablets from each batch were selected and tested for tablet hardness using Monsanto
hardness tester. The tablet was placed in contact between the plungers and the handle
was pressed, the force of the fracture that causes the tablet to break was recorded.
Thickness
The thickness of ten tablets from each batch was determined using vernier calipers as per
Indian Pharmacopoeia, 2007 (Madhusudan and Vishal, 2001).
Friability
The friability of the twenty tablets from each batch was determined using Roche
friabilator (Indosati Scientific Lab. Equipments) (Mastiholimath et al., 2007, Matsuo et
al., 1995). This device subjects the tablets to the combined effect of abrasions and shock
in a plastic chamber revolving at 25 rpm and dropping the tablets at a height of 6 inches
in each revolution. A pre-weighed sample (20 tablets) was placed in the friabilator and is
subjected to 100 revolutions. Tablets were dedusted and reweighed. The % friability (F)
was calculated using following formula:
F = (W1-W2 / W1) × 100 ………………………….. (10)
Ph.D Thesis Atenolol Press Coated (HE) Tablet
Rajesh A. Keraliya 135
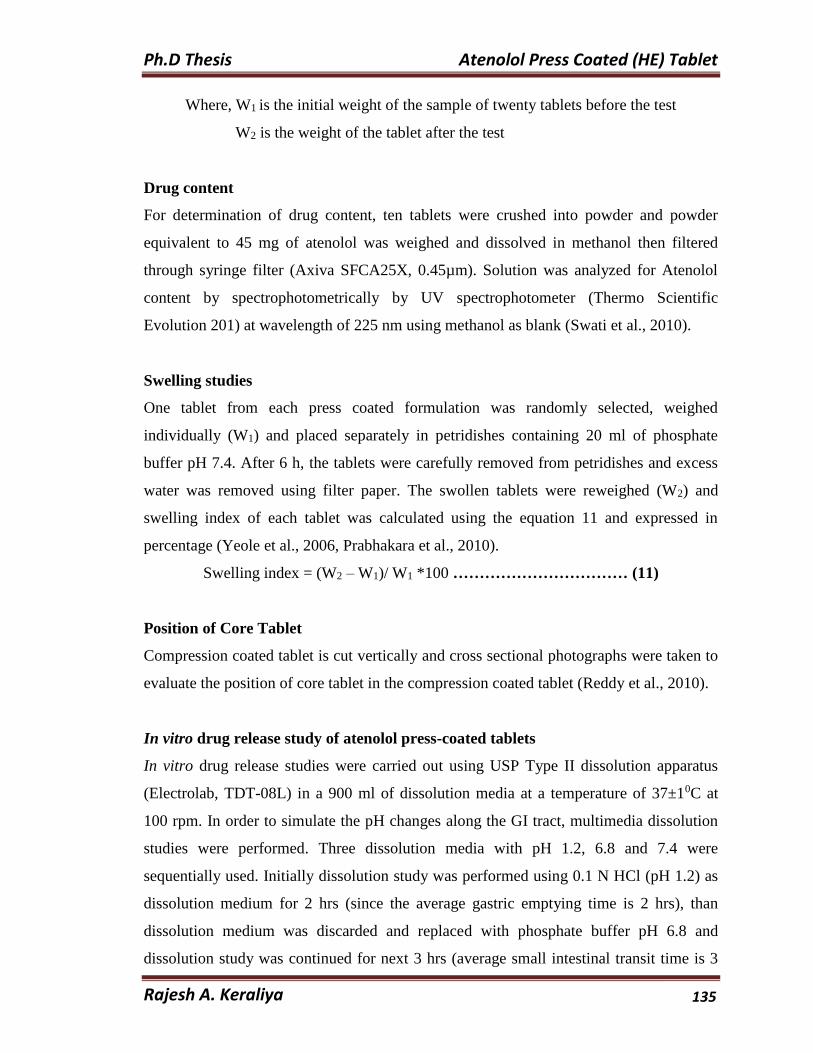
Where, W1 is the initial weight of the sample of twenty tablets before the test
W2 is the weight of the tablet after the test
Drug content
For determination of drug content, ten tablets were crushed into powder and powder
equivalent to 45 mg of atenolol was weighed and dissolved in methanol then filtered
through syringe filter (Axiva SFCA25X, 0.45µm). Solution was analyzed for Atenolol
content by spectrophotometrically by UV spectrophotometer (Thermo Scientific
Evolution 201) at wavelength of 225 nm using methanol as blank (Swati et al., 2010).
Swelling studies
One tablet from each press coated formulation was randomly selected, weighed
individually (W1) and placed separately in petridishes containing 20 ml of phosphate
buffer pH 7.4. After 6 h, the tablets were carefully removed from petridishes and excess
water was removed using filter paper. The swollen tablets were reweighed (W2) and
swelling index of each tablet was calculated using the equation 11 and expressed in
percentage (Yeole et al., 2006, Prabhakara et al., 2010).
Swelling index = (W2 – W1)/ W1 *100 …………………………… (11)
Position of Core Tablet
Compression coated tablet is cut vertically and cross sectional photographs were taken to
evaluate the position of core tablet in the compression coated tablet (Reddy et al., 2010).
In vitro drug release study of atenolol press-coated tablets
In vitro drug release studies were carried out using USP Type II dissolution apparatus
(Electrolab, TDT-08L) in a 900 ml of dissolution media at a temperature of 37±10C at
100 rpm. In order to simulate the pH changes along the GI tract, multimedia dissolution
studies were performed. Three dissolution media with pH 1.2, 6.8 and 7.4 were
sequentially used. Initially dissolution study was performed using 0.1 N HCl (pH 1.2) as
dissolution medium for 2 hrs (since the average gastric emptying time is 2 hrs), than
dissolution medium was discarded and replaced with phosphate buffer pH 6.8 and
dissolution study was continued for next 3 hrs (average small intestinal transit time is 3
Ph.D Thesis Atenolol Press Coated (HE) Tablet
Rajesh A. Keraliya 136
hrs). After 3 hrs, the dissolution medium was removed and replaced with phosphate
buffer pH 7.4 for subsequent hours. At regular time intervals, 10 ml of sample was
withdrawn and same amount replaced by fresh medium. Samples were suitably diluted
and filtered through syringe filter (Axiva SFCA25X, 0.45µm). Drug amount released was
analyzed spectrophotometrically by UV spectrophotometer (Thermo Scientific Evolution
201) at wavelength of 225 nm. All studies were carried out in triplicates (Swati et al.,
2010, Sungthongjeen et al., 2004). The time for which the tablet does not show any
release of the drug is known as its lag time. The lag time can be estimated through the
dissolution profile of the tablet. The study was carried out in triplicates.
6.4.5. Stability study
The optimized formulations of atenolol press coated tablets were subjected for
accelerated stability studies according to ICH guidelines (40 ± 2 0C and 75 ± 5% RH) for
a period of 6 months in a stability chamber. The optimized formulations of atenolol press
coated tablets were placed in vials and hermetically closed with bromobutyl rubber plugs,
sealed with aluminum caps and placed in stability chamber. The samples were withdrawn
at initial, 1 month, 2 months, 3 months and 6 months to evaluate for the drug content,
hardness, and in vitro dissolution. The study was carried out in triplicates.
6.5. RESULT AND DISCUSSION
6.5.1. Spectrophotometric estimation of atenolol
Spectrophotometric estimation of Atenolol in 0.1 N HCl
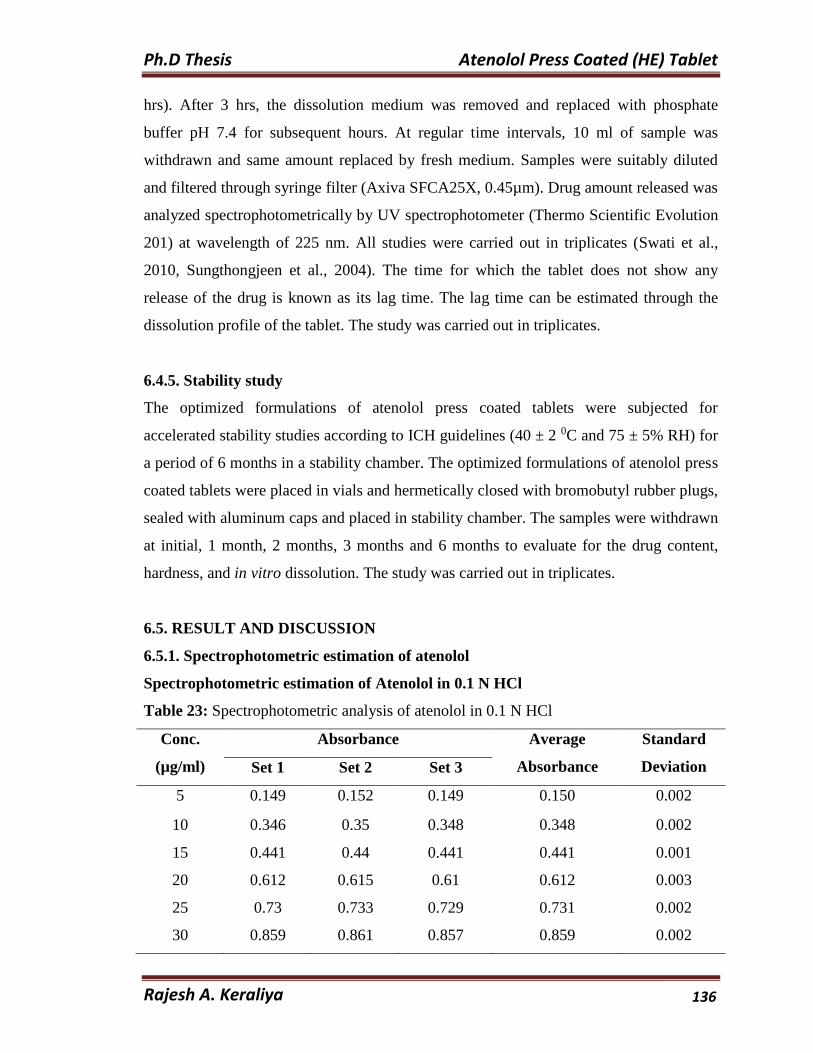
Table 23: Spectrophotometric analysis of atenolol in 0.1 N HCl
Conc.
(µg/ml)
Absorbance Average
Absorbance
Standard
Deviation Set 1 Set 2 Set 3
5 0.149 0.152 0.149 0.150 0.002
10 0.346 0.35 0.348 0.348 0.002
15 0.441 0.44 0.441 0.441 0.001
20 0.612 0.615 0.61 0.612 0.003
25 0.73 0.733 0.729 0.731 0.002
30 0.859 0.861 0.857 0.859 0.002
Ph.D Thesis Atenolol Press Coated (HE) Tablet
Rajesh A. Keraliya 137
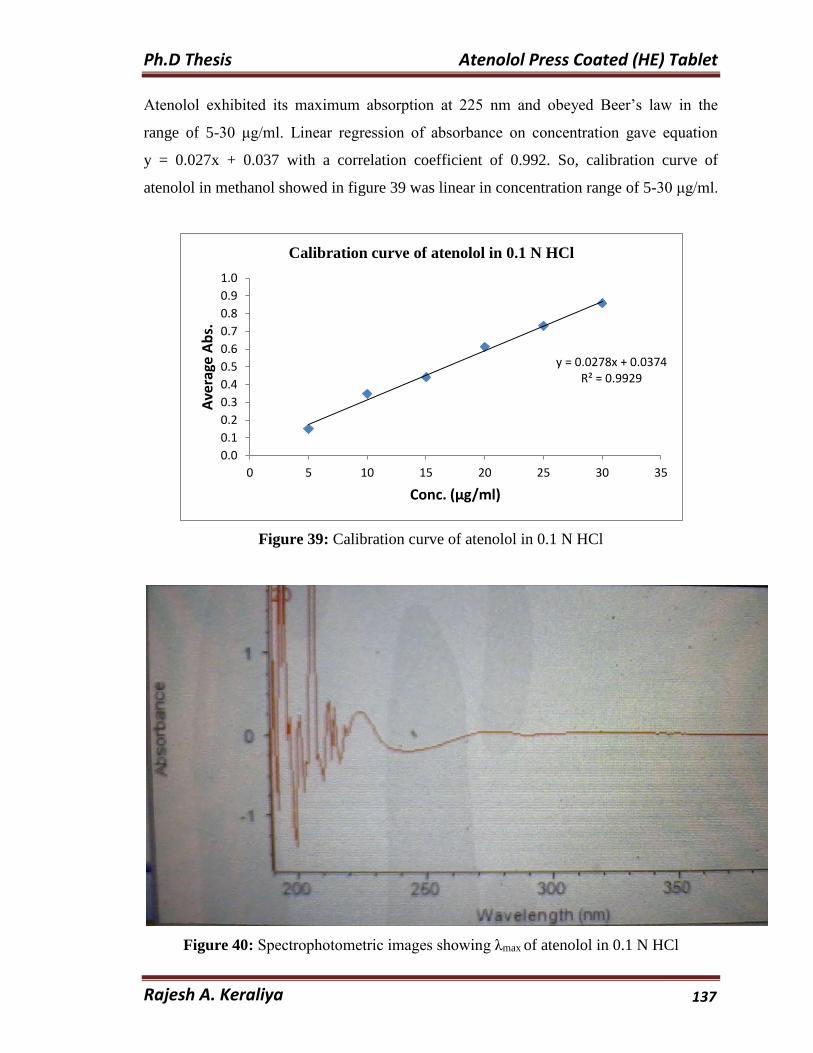
Atenolol exhibited its maximum absorption at 225 nm and obeyed Beer’s law in the
range of 5-30 μg/ml. Linear regression of absorbance on concentration gave equation
y = 0.027x + 0.037 with a correlation coefficient of 0.992. So, calibration curve of
atenolol in methanol showed in figure 39 was linear in concentration range of 5-30 μg/ml.
Figure 39: Calibration curve of atenolol in 0.1 N HCl
Figure 40: Spectrophotometric images showing λmax of atenolol in 0.1 N HCl
y = 0.0278x + 0.0374R² = 0.9929
0.0
0.1
0.2
0.3
0.4
0.5
0.6
0.7
0.8
0.9
1.0
0 5 10 15 20 25 30 35
Ave
rage
Ab
s.
Conc. (µg/ml)
Calibration curve of atenolol in 0.1 N HCl
Ph.D Thesis Atenolol Press Coated (HE) Tablet
Rajesh A. Keraliya 138
Spectrophotometric estimation of Atenolol in phosphate buffer pH 6.8
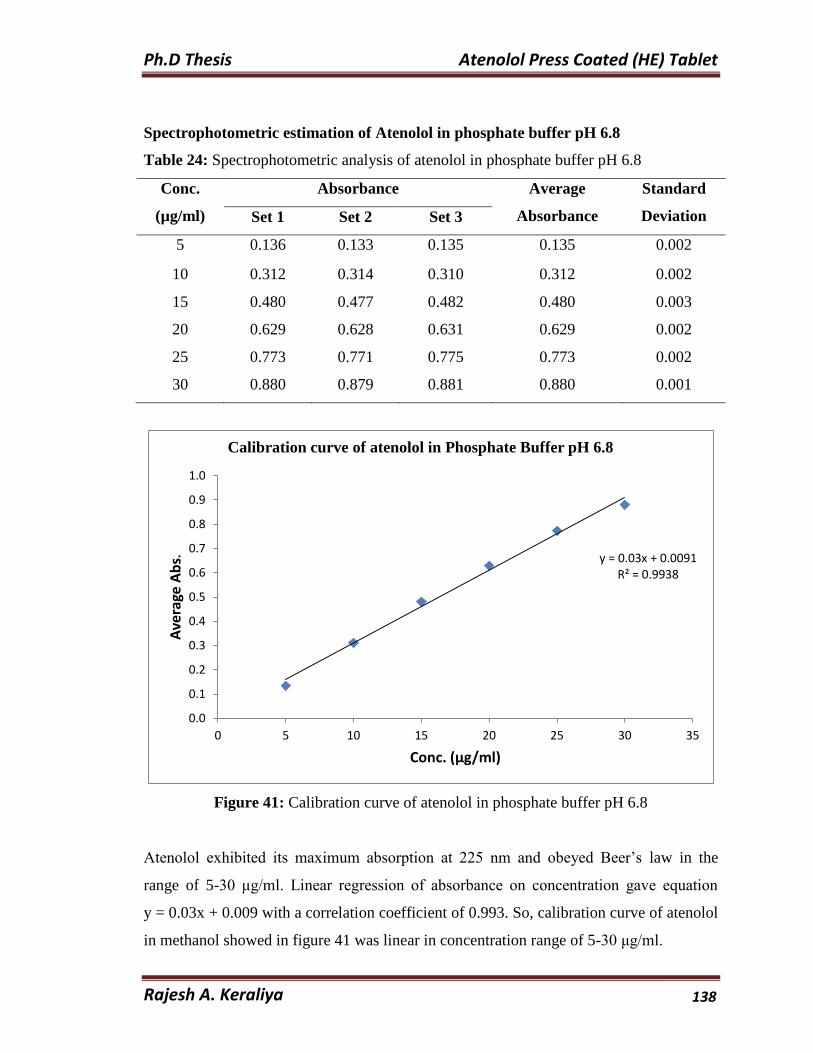
Table 24: Spectrophotometric analysis of atenolol in phosphate buffer pH 6.8
Conc.
(µg/ml)
Absorbance Average
Absorbance
Standard
Deviation Set 1 Set 2 Set 3
5 0.136 0.133 0.135 0.135 0.002
10 0.312 0.314 0.310 0.312 0.002
15 0.480 0.477 0.482 0.480 0.003
20 0.629 0.628 0.631 0.629 0.002
25 0.773 0.771 0.775 0.773 0.002
30 0.880 0.879 0.881 0.880 0.001
Figure 41: Calibration curve of atenolol in phosphate buffer pH 6.8
Atenolol exhibited its maximum absorption at 225 nm and obeyed Beer’s law in the
range of 5-30 μg/ml. Linear regression of absorbance on concentration gave equation
y = 0.03x + 0.009 with a correlation coefficient of 0.993. So, calibration curve of atenolol
in methanol showed in figure 41 was linear in concentration range of 5-30 μg/ml.
y = 0.03x + 0.0091R² = 0.9938
0.0
0.1
0.2
0.3
0.4
0.5
0.6
0.7
0.8
0.9
1.0
0 5 10 15 20 25 30 35
Ave
rage
Ab
s.
Conc. (µg/ml)
Calibration curve of atenolol in Phosphate Buffer pH 6.8
Ph.D Thesis Atenolol Press Coated (HE) Tablet
Rajesh A. Keraliya 139
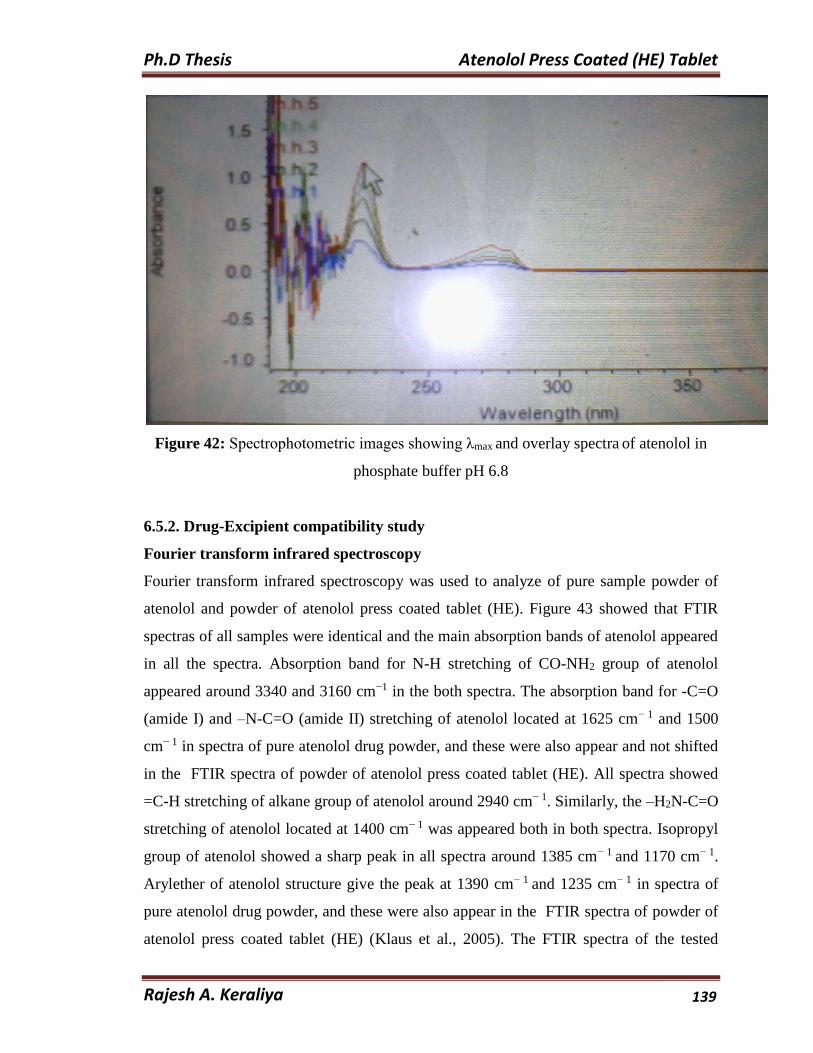
Figure 42: Spectrophotometric images showing λmax and overlay spectra of atenolol in
phosphate buffer pH 6.8
6.5.2. Drug-Excipient compatibility study
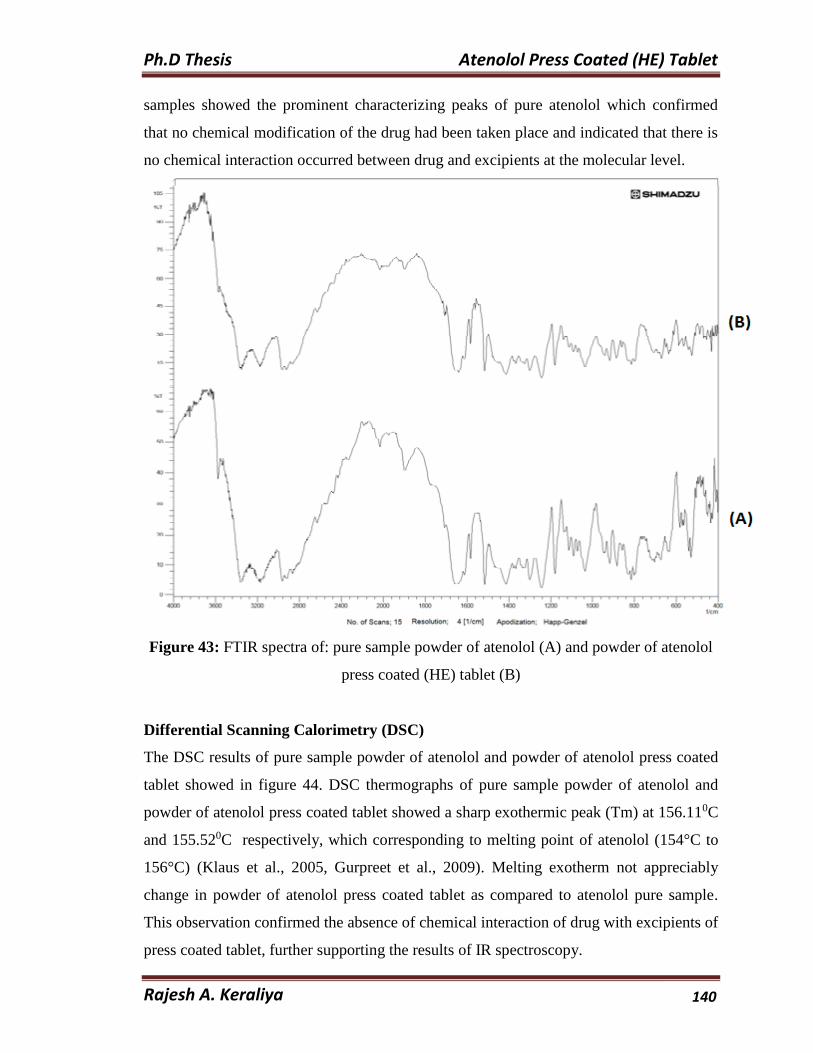
Fourier transform infrared spectroscopy
Fourier transform infrared spectroscopy was used to analyze of pure sample powder of
atenolol and powder of atenolol press coated tablet (HE). Figure 43 showed that FTIR
spectras of all samples were identical and the main absorption bands of atenolol appeared
in all the spectra. Absorption band for N-H stretching of CO-NH2 group of atenolol
appeared around 3340 and 3160 cm−1 in the both spectra. The absorption band for -C=O
(amide I) and –N-C=O (amide II) stretching of atenolol located at 1625 cm− 1 and 1500
cm− 1 in spectra of pure atenolol drug powder, and these were also appear and not shifted
in the FTIR spectra of powder of atenolol press coated tablet (HE). All spectra showed
=C-H stretching of alkane group of atenolol around 2940 cm− 1. Similarly, the –H2N-C=O
stretching of atenolol located at 1400 cm− 1 was appeared both in both spectra. Isopropyl
group of atenolol showed a sharp peak in all spectra around 1385 cm− 1 and 1170 cm− 1.
Arylether of atenolol structure give the peak at 1390 cm− 1 and 1235 cm− 1 in spectra of
pure atenolol drug powder, and these were also appear in the FTIR spectra of powder of
atenolol press coated tablet (HE) (Klaus et al., 2005). The FTIR spectra of the tested
Ph.D Thesis Atenolol Press Coated (HE) Tablet
Rajesh A. Keraliya 140
samples showed the prominent characterizing peaks of pure atenolol which confirmed
that no chemical modification of the drug had been taken place and indicated that there is
no chemical interaction occurred between drug and excipients at the molecular level.
Figure 43: FTIR spectra of: pure sample powder of atenolol (A) and powder of atenolol
press coated (HE) tablet (B)
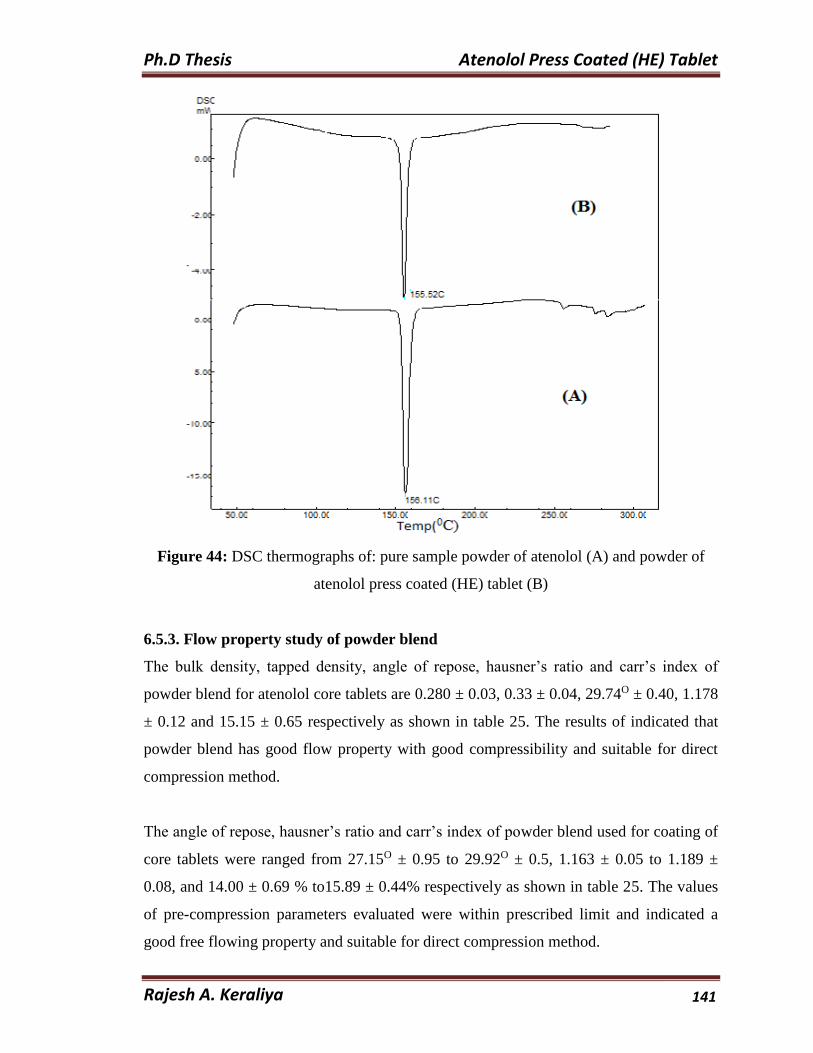
Differential Scanning Calorimetry (DSC)
The DSC results of pure sample powder of atenolol and powder of atenolol press coated
tablet showed in figure 44. DSC thermographs of pure sample powder of atenolol and
powder of atenolol press coated tablet showed a sharp exothermic peak (Tm) at 156.110C
and 155.520C respectively, which corresponding to melting point of atenolol (154°C to
156°C) (Klaus et al., 2005, Gurpreet et al., 2009). Melting exotherm not appreciably
change in powder of atenolol press coated tablet as compared to atenolol pure sample.
This observation confirmed the absence of chemical interaction of drug with excipients of
press coated tablet, further supporting the results of IR spectroscopy.
Ph.D Thesis Atenolol Press Coated (HE) Tablet
Rajesh A. Keraliya 141
Figure 44: DSC thermographs of: pure sample powder of atenolol (A) and powder of
atenolol press coated (HE) tablet (B)
6.5.3. Flow property study of powder blend
The bulk density, tapped density, angle of repose, hausner’s ratio and carr’s index of
powder blend for atenolol core tablets are 0.280 ± 0.03, 0.33 ± 0.04, 29.74O ± 0.40, 1.178
± 0.12 and 15.15 ± 0.65 respectively as shown in table 25. The results of indicated that
powder blend has good flow property with good compressibility and suitable for direct
compression method.
The angle of repose, hausner’s ratio and carr’s index of powder blend used for coating of
core tablets were ranged from 27.15O ± 0.95 to 29.92O ± 0.5, 1.163 ± 0.05 to 1.189 ±
0.08, and 14.00 ± 0.69 % to15.89 ± 0.44% respectively as shown in table 25. The values
of pre-compression parameters evaluated were within prescribed limit and indicated a
good free flowing property and suitable for direct compression method.
Ph.D Thesis Atenolol Press Coated (HE) Tablet
Rajesh A. Keraliya 142
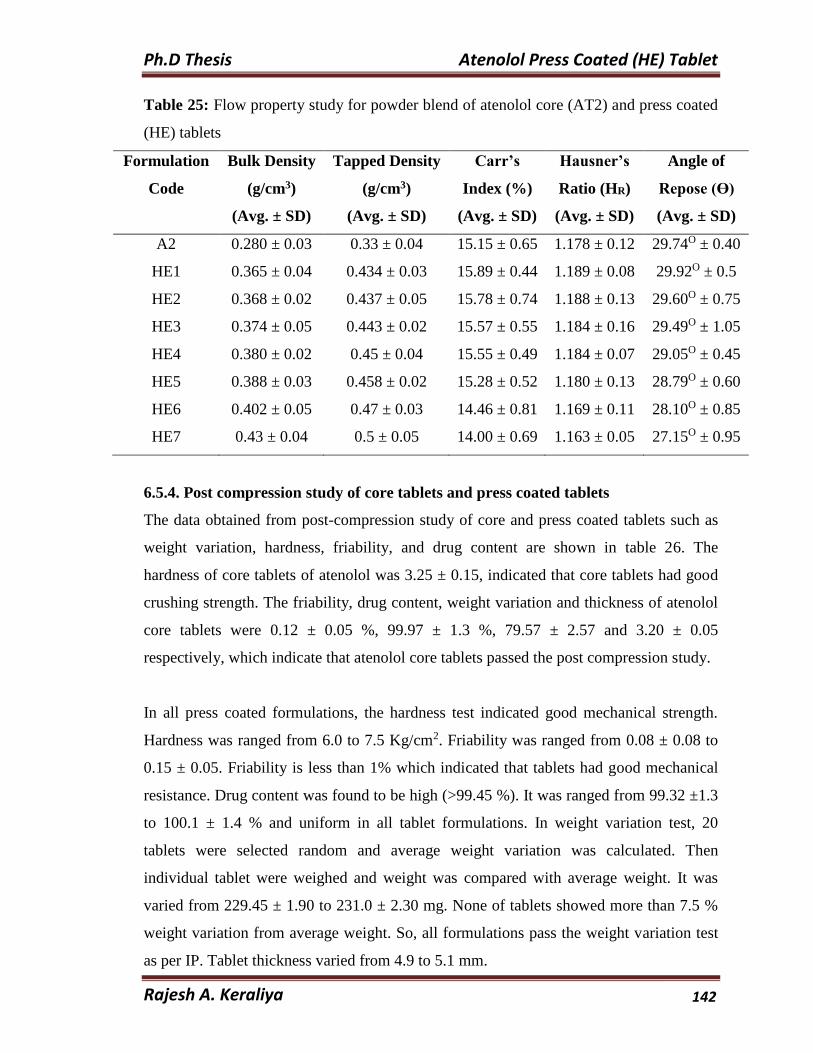
Table 25: Flow property study for powder blend of atenolol core (AT2) and press coated
(HE) tablets
Formulation
Code
Bulk Density
(g/cm3)
(Avg. ± SD)
Tapped Density
(g/cm3)
(Avg. ± SD)
Carr’s
Index (%)
(Avg. ± SD)
Hausner’s
Ratio (HR)
(Avg. ± SD)
Angle of
Repose (Ɵ)
(Avg. ± SD)
A2 0.280 ± 0.03 0.33 ± 0.04 15.15 ± 0.65 1.178 ± 0.12 29.74O ± 0.40
HE1 0.365 ± 0.04 0.434 ± 0.03 15.89 ± 0.44 1.189 ± 0.08 29.92O ± 0.5
HE2 0.368 ± 0.02 0.437 ± 0.05 15.78 ± 0.74 1.188 ± 0.13 29.60O ± 0.75
HE3 0.374 ± 0.05 0.443 ± 0.02 15.57 ± 0.55 1.184 ± 0.16 29.49O ± 1.05
HE4 0.380 ± 0.02 0.45 ± 0.04 15.55 ± 0.49 1.184 ± 0.07 29.05O ± 0.45
HE5 0.388 ± 0.03 0.458 ± 0.02 15.28 ± 0.52 1.180 ± 0.13 28.79O ± 0.60
HE6 0.402 ± 0.05 0.47 ± 0.03 14.46 ± 0.81 1.169 ± 0.11 28.10O ± 0.85
HE7 0.43 ± 0.04 0.5 ± 0.05 14.00 ± 0.69 1.163 ± 0.05 27.15O ± 0.95
6.5.4. Post compression study of core tablets and press coated tablets
The data obtained from post-compression study of core and press coated tablets such as
weight variation, hardness, friability, and drug content are shown in table 26. The
hardness of core tablets of atenolol was 3.25 ± 0.15, indicated that core tablets had good
crushing strength. The friability, drug content, weight variation and thickness of atenolol
core tablets were 0.12 ± 0.05 %, 99.97 ± 1.3 %, 79.57 ± 2.57 and 3.20 ± 0.05
respectively, which indicate that atenolol core tablets passed the post compression study.
In all press coated formulations, the hardness test indicated good mechanical strength.
Hardness was ranged from 6.0 to 7.5 Kg/cm2. Friability was ranged from 0.08 ± 0.08 to
0.15 ± 0.05. Friability is less than 1% which indicated that tablets had good mechanical
resistance. Drug content was found to be high (>99.45 %). It was ranged from 99.32 ±1.3
to 100.1 ± 1.4 % and uniform in all tablet formulations. In weight variation test, 20
tablets were selected random and average weight variation was calculated. Then
individual tablet were weighed and weight was compared with average weight. It was
varied from 229.45 ± 1.90 to 231.0 ± 2.30 mg. None of tablets showed more than 7.5 %
weight variation from average weight. So, all formulations pass the weight variation test
as per IP. Tablet thickness varied from 4.9 to 5.1 mm.
Ph.D Thesis Atenolol Press Coated (HE) Tablet
Rajesh A. Keraliya 143
Table 26: Post-compression parameters of atenolol core (AT2) and press coated (HE)
tablets
Formulation
Code
Hardness
(Kg/cm2)
(Avg. ± SD)
Friability
(%)
(Avg. ± SD)
Drug
content (%)
(Avg. ± SD)
Weight
variation (mg)
(Avg. ± SD)
Tablet
Thickness (mm)
(Avg. ± SD)
AT2 3.25 ± 0.15 0.12 ± 0.05 99.97 ± 1.3 79.57 ± 2.57 3.20 ± 0.05
HE1 7.5 ± 0.45 0.09 ± 0.04 99.89 ± 1.0 230.57 ± 1.55 4.9 ± 0.05
HE2 7.0 ± 0.5 0.08 ± 0.08 99.45 ± 1.9 229.45 ± 1.90 5.0 ± 0.02
HE3 6.5 ± 0.15 0.11 ± 0.05 99.32 ±1.3 229.18 ± 2.6 4.9 ± 0.05
HE4 6.5 ± 0.2 0.10 ± 0.06 100.1 ± 1.4 231.0 ± 2.30 4.9 ± 0.02
HE5 6.0 ± 0.6 0.13 ± 0.1 99.66 ± 1.5 229.50 ± 2.91 4.9 ± 0.02
HE6 6.0 ± 0.3 0.15 ± 0.05 99.98 ± 1.1 231.26 ± 2.75 5.0 ± 0.05
HE7 6.0 ± 0.4 0.14 ± 0.06 99.70 ± 1.6 229.5 ± 3.10 5.1 ± 0.05
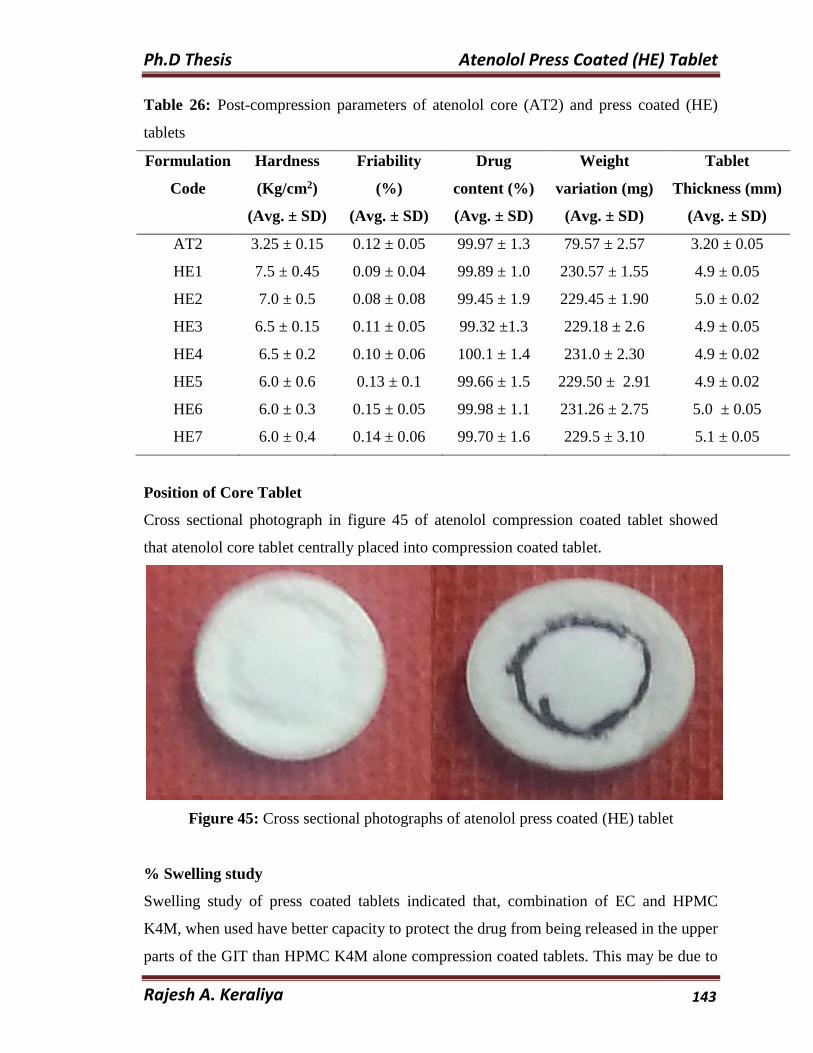
Position of Core Tablet
Cross sectional photograph in figure 45 of atenolol compression coated tablet showed
that atenolol core tablet centrally placed into compression coated tablet.
Figure 45: Cross sectional photographs of atenolol press coated (HE) tablet
% Swelling study
Swelling study of press coated tablets indicated that, combination of EC and HPMC
K4M, when used have better capacity to protect the drug from being released in the upper
parts of the GIT than HPMC K4M alone compression coated tablets. This may be due to
Ph.D Thesis Atenolol Press Coated (HE) Tablet
Rajesh A. Keraliya 144
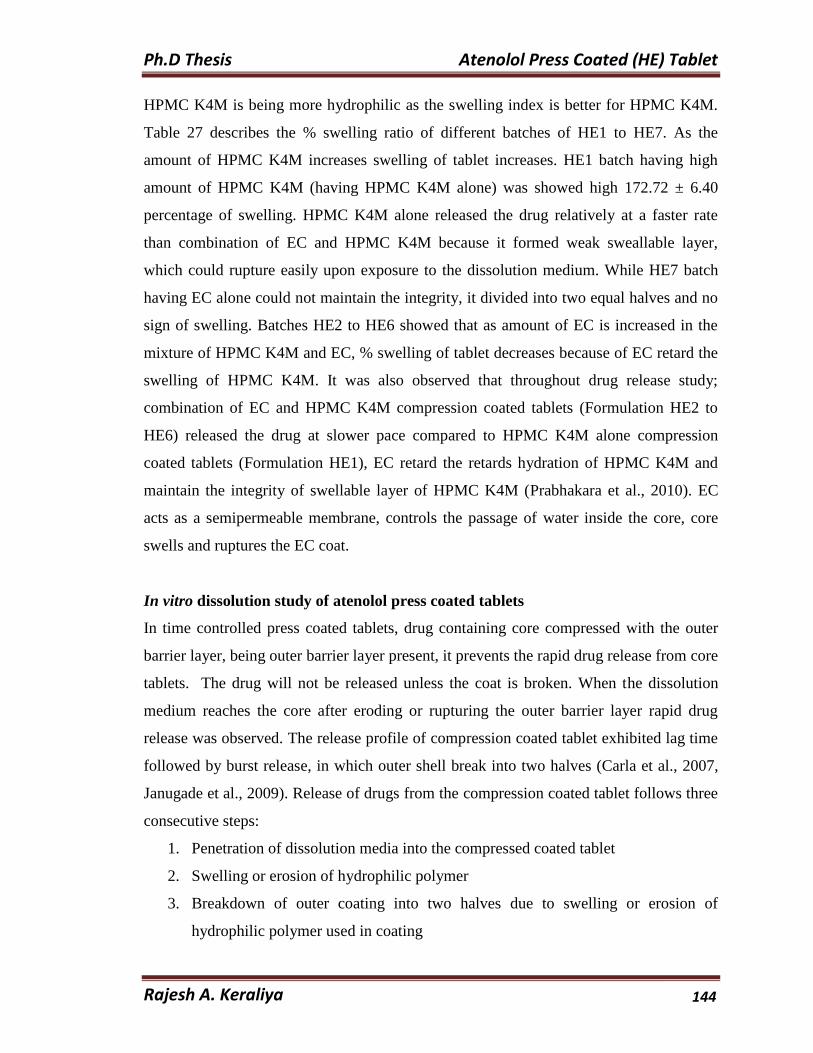
HPMC K4M is being more hydrophilic as the swelling index is better for HPMC K4M.
Table 27 describes the % swelling ratio of different batches of HE1 to HE7. As the
amount of HPMC K4M increases swelling of tablet increases. HE1 batch having high
amount of HPMC K4M (having HPMC K4M alone) was showed high 172.72 ± 6.40
percentage of swelling. HPMC K4M alone released the drug relatively at a faster rate
than combination of EC and HPMC K4M because it formed weak sweallable layer,
which could rupture easily upon exposure to the dissolution medium. While HE7 batch
having EC alone could not maintain the integrity, it divided into two equal halves and no
sign of swelling. Batches HE2 to HE6 showed that as amount of EC is increased in the
mixture of HPMC K4M and EC, % swelling of tablet decreases because of EC retard the
swelling of HPMC K4M. It was also observed that throughout drug release study;
combination of EC and HPMC K4M compression coated tablets (Formulation HE2 to
HE6) released the drug at slower pace compared to HPMC K4M alone compression
coated tablets (Formulation HE1), EC retard the retards hydration of HPMC K4M and
maintain the integrity of swellable layer of HPMC K4M (Prabhakara et al., 2010). EC
acts as a semipermeable membrane, controls the passage of water inside the core, core
swells and ruptures the EC coat.
In vitro dissolution study of atenolol press coated tablets
In time controlled press coated tablets, drug containing core compressed with the outer
barrier layer, being outer barrier layer present, it prevents the rapid drug release from core
tablets. The drug will not be released unless the coat is broken. When the dissolution
medium reaches the core after eroding or rupturing the outer barrier layer rapid drug
release was observed. The release profile of compression coated tablet exhibited lag time
followed by burst release, in which outer shell break into two halves (Carla et al., 2007,
Janugade et al., 2009). Release of drugs from the compression coated tablet follows three
consecutive steps:
1. Penetration of dissolution media into the compressed coated tablet
2. Swelling or erosion of hydrophilic polymer
3. Breakdown of outer coating into two halves due to swelling or erosion of
hydrophilic polymer used in coating
Ph.D Thesis Atenolol Press Coated (HE) Tablet
Rajesh A. Keraliya 145
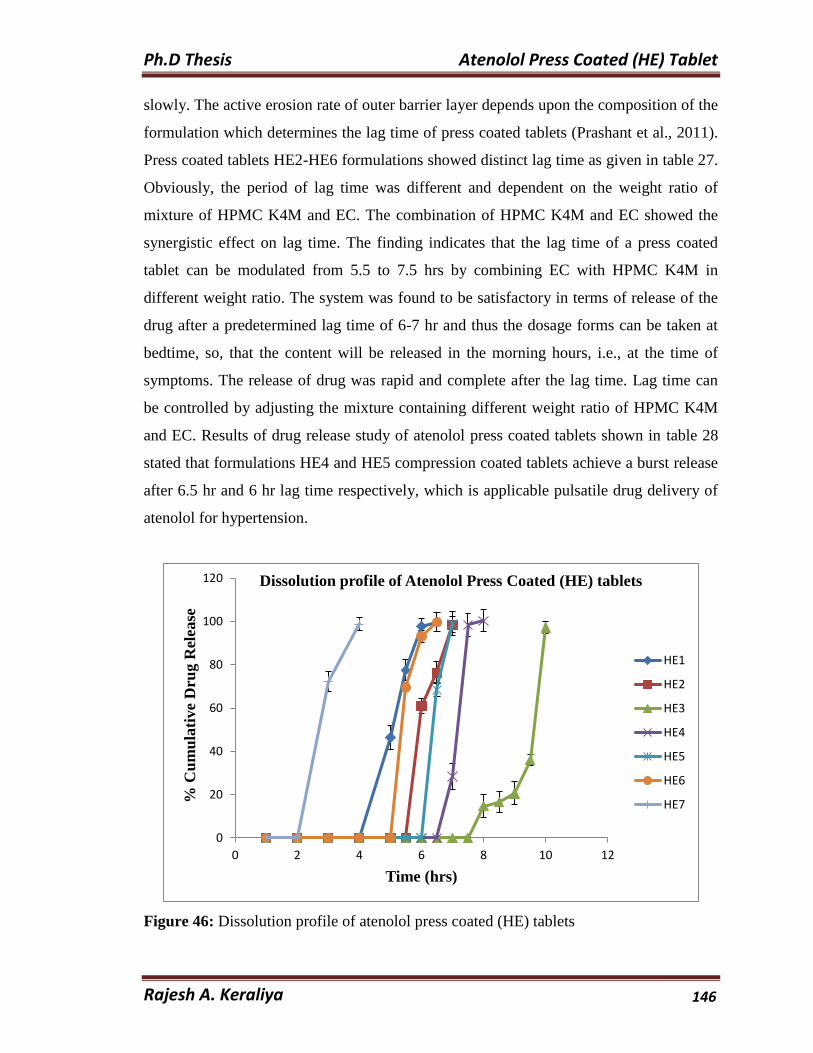
Dissolution profile showed in figure 46 produce a lag time prior to drug release due to
incorporation of core tablet into press coated tablet. Press coated tablets (HE1 to HE7
formulations) showed distinct lag time as given table 27. When, HPMC K4M alone
(HE1), showed lag time of only 04 hr. This is probably because of mechanism of
producing a lag time of this formulation was based upon the hydration and swelling of
outer barrier layer or water penetration through outer barrier layer (Ghimire et al., 2007).
When HPMC K4M was used alone, it formed a mechanically weak sweallable layer,
which could rupture easily upon exposure to the dissolution medium and resulting
development of internal pressure within tablet core and drug release was initiated
(Prashant et al., 2011). With Ethylcellulose alone (HE7), showed lowest lag time of two
hours as compared to any weight ratio of mixture of HPMC K4M and EC. The porosity is
proportional to the proportion of EC. Increase amount of EC leads to higher penetration
of dissolution media in press coated tablet. EC is semipermeable in nature, although it is
naturally insoluble in water. Water penetrates faster the coating layer of the core tablet
when used alone. After hydration of core, the drug was released (Janugade et al., 2009).
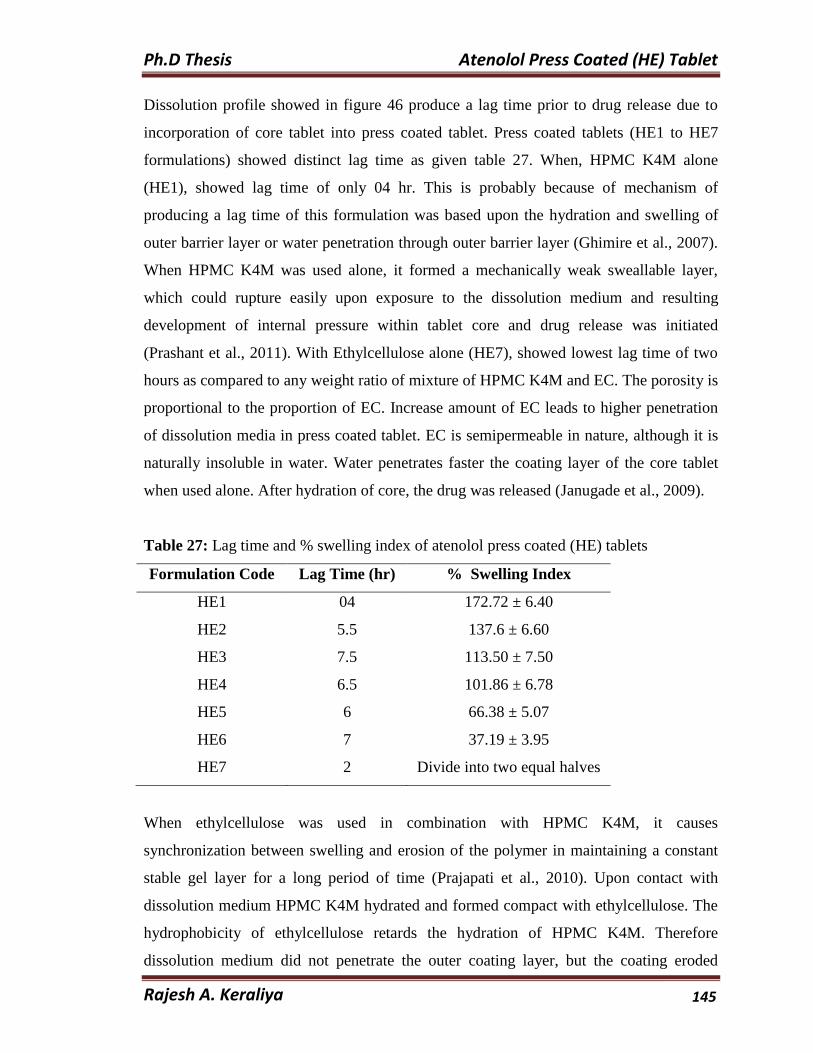
Table 27: Lag time and % swelling index of atenolol press coated (HE) tablets
Formulation Code Lag Time (hr) % Swelling Index
HE1 04 172.72 ± 6.40
HE2 5.5 137.6 ± 6.60
HE3 7.5 113.50 ± 7.50
HE4 6.5 101.86 ± 6.78
HE5 6 66.38 ± 5.07
HE6 7 37.19 ± 3.95
HE7 2 Divide into two equal halves
When ethylcellulose was used in combination with HPMC K4M, it causes
synchronization between swelling and erosion of the polymer in maintaining a constant
stable gel layer for a long period of time (Prajapati et al., 2010). Upon contact with
dissolution medium HPMC K4M hydrated and formed compact with ethylcellulose. The
hydrophobicity of ethylcellulose retards the hydration of HPMC K4M. Therefore
dissolution medium did not penetrate the outer coating layer, but the coating eroded
Ph.D Thesis Atenolol Press Coated (HE) Tablet
Rajesh A. Keraliya 146
slowly. The active erosion rate of outer barrier layer depends upon the composition of the
formulation which determines the lag time of press coated tablets (Prashant et al., 2011).
Press coated tablets HE2-HE6 formulations showed distinct lag time as given in table 27.
Obviously, the period of lag time was different and dependent on the weight ratio of
mixture of HPMC K4M and EC. The combination of HPMC K4M and EC showed the
synergistic effect on lag time. The finding indicates that the lag time of a press coated
tablet can be modulated from 5.5 to 7.5 hrs by combining EC with HPMC K4M in
different weight ratio. The system was found to be satisfactory in terms of release of the
drug after a predetermined lag time of 6-7 hr and thus the dosage forms can be taken at
bedtime, so, that the content will be released in the morning hours, i.e., at the time of
symptoms. The release of drug was rapid and complete after the lag time. Lag time can
be controlled by adjusting the mixture containing different weight ratio of HPMC K4M
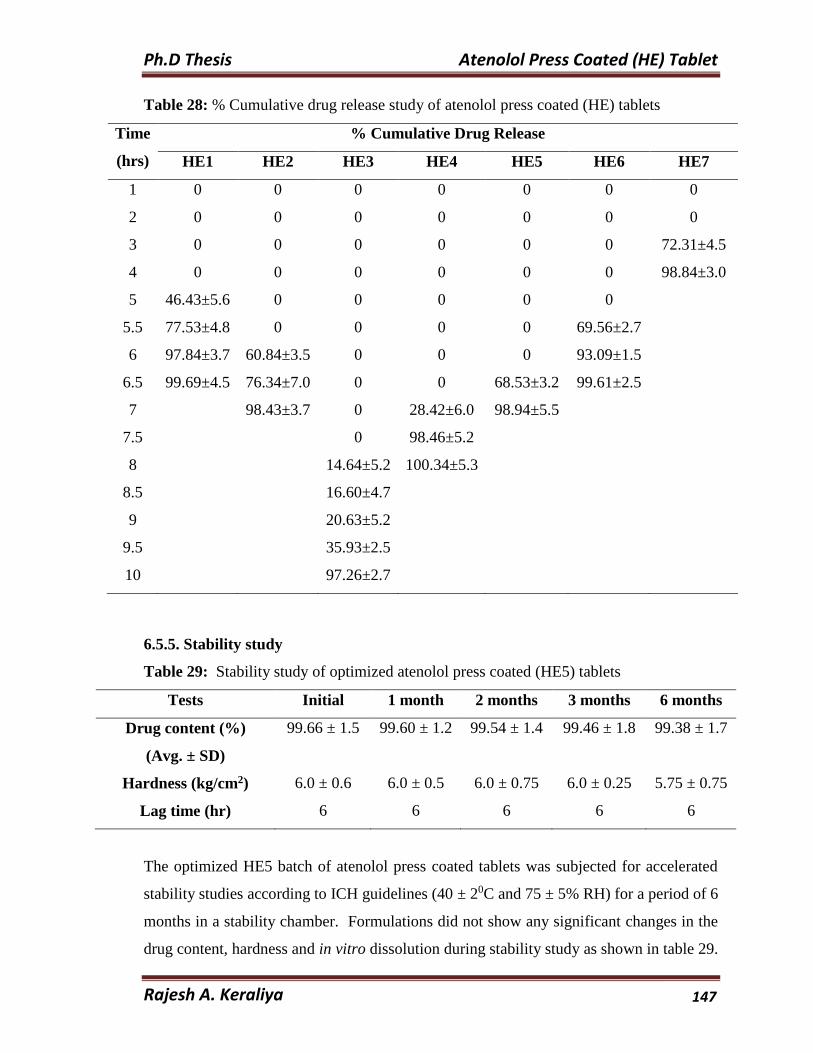
and EC. Results of drug release study of atenolol press coated tablets shown in table 28
stated that formulations HE4 and HE5 compression coated tablets achieve a burst release
after 6.5 hr and 6 hr lag time respectively, which is applicable pulsatile drug delivery of
atenolol for hypertension.
Figure 46: Dissolution profile of atenolol press coated (HE) tablets
0
20
40
60
80
100
120
0 2 4 6 8 10 12
% C
um
ula
tiv
e D
rug R
elea
se
Time (hrs)
Dissolution profile of Atenolol Press Coated (HE) tablets
HE1
HE2
HE3
HE4
HE5
HE6
HE7
Ph.D Thesis Atenolol Press Coated (HE) Tablet
Rajesh A. Keraliya 147
Table 28: % Cumulative drug release study of atenolol press coated (HE) tablets
Time
(hrs)
% Cumulative Drug Release
HE1 HE2 HE3 HE4 HE5 HE6 HE7
1 0 0 0 0 0 0 0
2 0 0 0 0 0 0 0
3 0 0 0 0 0 0 72.31±4.5
4 0 0 0 0 0 0 98.84±3.0
5 46.43±5.6 0 0 0 0 0
5.5 77.53±4.8 0 0 0 0 69.56±2.7
6 97.84±3.7 60.84±3.5 0 0 0 93.09±1.5
6.5 99.69±4.5 76.34±7.0 0 0 68.53±3.2 99.61±2.5
7 98.43±3.7 0 28.42±6.0 98.94±5.5
7.5 0 98.46±5.2
8 14.64±5.2 100.34±5.3
8.5 16.60±4.7
9 20.63±5.2
9.5 35.93±2.5
10 97.26±2.7
6.5.5. Stability study
Table 29: Stability study of optimized atenolol press coated (HE5) tablets
Tests Initial 1 month 2 months 3 months 6 months
Drug content (%)
(Avg. ± SD)
99.66 ± 1.5 99.60 ± 1.2 99.54 ± 1.4 99.46 ± 1.8 99.38 ± 1.7
Hardness (kg/cm2) 6.0 ± 0.6 6.0 ± 0.5 6.0 ± 0.75 6.0 ± 0.25 5.75 ± 0.75
Lag time (hr) 6 6 6 6 6
The optimized HE5 batch of atenolol press coated tablets was subjected for accelerated
stability studies according to ICH guidelines (40 ± 20C and 75 ± 5% RH) for a period of 6
months in a stability chamber. Formulations did not show any significant changes in the
drug content, hardness and in vitro dissolution during stability study as shown in table 29.
Ph.D Thesis Atenolol Press Coated (HE) Tablet
Rajesh A. Keraliya 148
Hence, the HE5 atenolol press coated tablets were sufficiently stable as per regulatory
requirements.
CONCLUSION
The promising colon targeted pulsatile type release of atenolol is successfully achieved
by press coating technique using combination of time dependent rupturable and erodible
polymers. Ethyl cellulose was chosen because of its rupturable behavior and HPMC K4M
was chosen because of its swelling and erodible behavior. Atenolol press coated tablets
were prepared using different weight ratios of HPMC K4M and EC. The formulations
HE4 and HE5 were achieve a burst release after 6.5 hr and 6 hr lag time respectively,
which is applicable pulsatile drug delivery of atenolol for treating early morning
hypertension.