Science Education International
Science Education International
Vol. 26, Issue 3, 2015, 392-413
Environmental literacy comparison between students taught in
Eco-schools and ordinary schools in the Madeira Island region
of Portugal
H. SPÍNOLA*
ABSTRACT: The main goal of environmental education is to improve
environmental literacy, including not just more knowledge but also a better attitude
toward the environment and a higher prevalence of pro-environmental behaviours.
The Eco-School Program is considered the world largest environmental education
program for schools, but it keeps growing without proof of its particular
effectiveness in improving environmental literacy. This study compares the level
of environmental literacy on Madeira Island (Portugal) among 9th grade students
from Eco-Schools and ordinary schools. It applies a questionnaire with three
components, addressing knowledge, attitude and behaviour toward the
environment. Results show that environmental literacy among 9th grade Eco-
School students is not significantly higher than in ordinary schools. However, there
are some features of environmental literacy that are slightly better in Eco-Schools,
namely in knowledge, attitude and behaviours. Based on our findings, we conclude
that the Eco-School Program is not really a better environmental education strategy
than others strategies adopted in ordinary schools. Nevertheless, the present study
fails to point out reasons for the results obtained since the design research is not
adequate for this purpose.
KEY WORDS: Environmental education, environmental literacy, eco-schools
program, new ecological paradigm.
INTRODUCTION
The goal of environmental education is, accordingly to the Belgrade
Charter, to develop a world population that is aware of and concerned about
the environment and its associated problems and, accordingly to the Tbilisi
conference, to promote environmentally literate citizens who undertake
environmentally friendly actions (UNESCO, 1980; Hungerford and Peyton,
1976). In fact, the development of an environmentally literate citizenry is
an important aim of environmental education and environmental literacy is
* Research and Development Centre in Education of the University of Madeira, University
of Madeira Campus, 9000-390 Funchal, Portugal. E-mail: [email protected]

Science Education International
393
a fundamental prerequisite to maintain and improve the quality of the
environment (Disinger & Roth, 1992).
In past decades, despite a common matrix, different authors have
considered a wide spectrum of components to be included in environmental
literacy, making its definition a dynamic undertaking (Hollweg et al.,
2011). For example, Simmons (1995, pp. 55-58) identified seven elements
of environmental literacy:
1. Affect (e.g., environmental sensitivity, attitudes, and moral
reasoning);
2. Ecological knowledge;
3. Socio-political knowledge (e.g., the relationship of cultural, political,
economic, and other social factors to ecology and environment);
4. Knowledge on environmental issues;
5. Skills pertaining to environmental problems/issues and action
strategies, systemic thinking, and forecasting;
6. Determinants of environmentally responsible behavior (i.e., locus of
control and assumption of personal responsibility);
7. Behavior (i.e., various forms of active participation aimed at solving
problems and resolving issues).
Another framework example, created by Wilke (1995, pp. 5-6),
defined four clusters of environmental literacy components: cognitive
dimensions (knowledge and skill), affective dimensions, additional
determinants of environmentally responsible behavior, and personal and/or
group involvement in environmentally responsible behavior. Previously,
Disinger and Roth (1992) suggested that environmental literacy was
essentially the capacity to perceive and interpret the relative health of
environmental systems and take appropriate action to maintain, restore, or
improve the health of those systems. At that time, Roth (1992) considered
that people should be able to demonstrate in some observable form what
they have learned, namely their knowledge of key concepts, skills acquired,
disposition toward issues, and the like, and emphasized that environmental
literacy should be defined in terms of observable behaviors.
Nowadays, a common understanding is that environmental literacy
must include:
knowledge and understanding of environmental concepts, problems, and
issues,
a set of cognitive and affective dispositions, and
a set of cognitive skills and abilities, together with the appropriate
behavioral strategies to apply such knowledge and understanding in
order to make sound and effective decisions in a range of environmental
contexts (Hollweg et al., 2011).

Science Education International
394
As a simple definition, environmental literacy is a domain of four
interrelated components: knowledge, dispositions, competencies and
environmentally responsible behavior (Hungerford & Volk, 1990; Cook &
Berrenberg, 1981; Stern, 2000; Hollweg et al., 2011). Despite this
simplification, each of the above four components hold a complex structure
that needs to be taken into consideration in environmental education
practices, namely the fact that, among others,
Knowledge should include physical, ecological, social, cultural and
political systems,
Dispositions involves sensitivity, attitudes, personal responsibility and
motivation,
Competencies implies identify, analyze, investigate, evaluate and
resolve environmental issues, and that
Environmentally responsible behavior includes practices in eco-
management, persuasion, consumer/economic action, political action
and legal action (Hollweg et al., 2011).
Since the main goal of environmental education is to improve
environmental literacy, evaluating the efficiency of an environmental
education program implies assessing the environmental literacy progression
in the target population. However, the complex structure of environmental
literacy makes it difficult to include all components in any single
assessment, and thus it is of fundamental importance to identify the
essential elements to be addressed in any survey. In this evaluation
approach, several authors identified knowledge, attitude and
environmentally responsible behavior as the major components of the
environmental literacy to be included in surveys (Hallfreðsdóttir, 2011;
Krnel & Naglič, 2009; Igbokwe, 2012; Mcbeth & Volk, 2010; Kuhlemeier
et al., 1999; Pe’er et al., 2007).
Several environmental education programs exist around the world,
with more or less effectiveness in promoting environmental literacy. Most
approach youth and children in their educational context in schools
(Mutisya & Barker, 2011; Bas et al, 2011). Since 1994, the Foundation for
Environmental Education (FEE), a non-governmental and non-profit
organization that promote sustainable development through environmental
education, launch the Eco-Schools, an international program that aims to
empower students, by engaging them in fun and action-oriented learning,
to be the change needed for a sustainable world. The Eco-Schools Program
assumes to be a way to improve students’ learning outcomes, attitudes and
behaviors on the environmental and sustainability challenges (Eco-Schools,
2013a). It follows a 7-step change process:
1. Eco-School committee;
2. Environmental review;

Science Education International
395
3. Action plan;
4. Monitoring and evaluation;
5. Curriculum work;
6. Informing and involving; and
7. Eco-code.
It centers the work in themes, especially water, waste and energy, but
also nature and biodiversity, mobility, and climate change, among others.
At the end of this process, successful schools are awarded with the Green-
Flag (Eco-Schools, 2013b).
Presently, this environmental education program involves more than
11 million students across 52 countries, making Eco-Schools the largest
sustainable schools program in the world (Eco-Schools, 2013a). Eco-
Schools Program is implemented in Portugal since 1996 through the
coordination of the Blue Flag of Europe Association (ABAE- Associação
Bandeira Azul da Europa, in the Portuguese designation) and assumes as its
objective to encourage actions and recognize the quality of the work
developed by schools in the scope of environmental education (Gomes,
2013). In the school year of 2011/2012, the Eco-Schools Program in
Portugal involved 1443 schools and about 800,000 students across the
country, being Madeira Island the Portuguese district with the highest
percentage of its public schools awarded with the Green-Flag (68%),
representing almost 10% of all the national schools involved in the Program
(ABAE, 2012).
Several studies have been developed in order to assess the contribution
of Eco-Schools Program on the development of student’s Environmental
Literacy. Krnel and Naglič (2009) compared environmental literacy
between Eco-Schools and ordinary schools of Slovenia and concluded that
knowledge was the only component that showed a statistical significant
improvement. In Iceland, a comparison of environmental knowledge,
attitude and actions between students from Green-Flag schools and
traditional schools showed that Eco-School students were more aware of
environmental issues but did not have a significant better environmental
knowledge or attitude. However, this study showed that, despite Eco-
Schools Program having little effect on students’ environmental knowledge
and attitude, it could encourage, through situational factors, the pro-
environmental actions directly linked to the facilities available in the
school, namely recycling containers (Hallfreðsdóttir, 2011). In Flanders
(Belgium), Pauw and Van Petegem (2011; 2013) found that Eco-Schools
Program mainly influenced their students’ environmental knowledge, but
had no positive effect on environmental attitude and behavior, but Ozsoy
and colleagues (2012), conducting research on private schools of Turkey,
found a significant increase in students from eco-schools, not just in
knowledge but also in environmental attitude.

Science Education International
396
METHODOLOGY
Research problem
This research arises from a need to know the results achieved with the Eco-
Schools Program in an insular region of Portugal, where a huge effort to
make every schools a green-flag establishment is in place. Madeira Island
has already 68% of their public schools awarded with a green-flag and there
is a public commitment to bring them altogether into the Program.
However, until now, no evaluation has been undertaken on the effect of all
this effort in the improvement of the students’ environmental literacy.
Conducting an evaluation is seen as an urgent task since, year by year, more
schools have been included in the Eco-Schools Program and, soon, it will
be difficult to find schools without a green-flag to form the basis for a
comparison.
This study intends to determine to what extend the Eco-Schools
Program is improving the environmental literacy components of
knowledge, attitude and behavior among students.
To achieve these goals, three hypothesis were stipulated:
1. Student’s knowledge on environmental issues is higher in Eco-
Schools than in Non Eco Schools.
2. Student’s pro-environmental attitude is higher in Eco-Schools than in
Non Eco-Schools.
3. Student’s environmentally responsible behavior prevalence is higher
in Eco-Schools than in Non Eco-Schools.
Questionnaire
Despite being widely used instruments, and even with taking as much care
as possible to improve its reliability and validity, questionnaires show some
limitations, especially as a single method to understand complex learning
processes, as such involved in the improvement of environmental literacy.
However, since our main purpose, before understand its process, is to
evaluate environmental literacy levels in students from different schools,
questionnaires are seen as simple and widely applicable instruments that are
adequate for this present research.
The survey design is based on the work of others, already used to
assessing environmental literacy among students, but carefully adapting it
to the local specificities and to the research goals (Krnel & Naglič, 2009;
Hallfreðsdóttir, 2011; Pauw & Van Petegem, 2011; Pauw & Van Petegem,
2013; Oszoy et al., 2012). The proposed hypotheses are tested through an
anonymous survey questionnaire with close-ended questions, designed
especially for that purpose (Appendix 1). The questionnaire consists of a
header for personal data and three main sections, each measuring and

Science Education International
397
assessing: knowledge (10 questions), attitude (15 questions) and
environmentally responsible behavior (15 questions). The environmental
knowledge section includes the three main themes of the Eco-School
Program: water (3 questions); energy (3 questions); and waste (4 questions).
The questions, designed to assess environmental knowledge, are mostly
framed in three main aspects: cause of problems, regional context and
behavior options. For each question, the respondents are confronted with
different options and select the one deemed correct. The section that
measures pro-environmental attitude is constructed with the 15 questions of
the New Ecologic Paradigm (NEP) Scale, an instrument widely used and
validated in the measurement of pro-environmental orientation (Dunlap et
al., 2000; Ogunbode, 2013; La Trobe & Acott, 2000; Watne et al., 2012;
Shoukry et al., 2012; Ogunjinmi et al., 2012; Kostova et al., 2011).
In the third section of the questionnaire, environmentally responsible
behaviors are assessed through statements that span across the three main
themes of the Eco-Schools Program: water (4 statements), energy (6
statements) and waste (5 statements). The statements address everyday
behaviors and, to each, students are asked to define the frequency of their
practices in a Likert-type scale instrument ranging from 1 (never) to 5
(always). The behaviors in the questionnaire are adapted to the students’
context and, besides the anonymity of the enquiries, special care is taken to
overcome potential social desirability bias that can appear in self-reported
assessments (Bryman, 2004, p.134; Nederhof, 1985). As much as possible,
the statements in this section are written in a neutral form and are short
enough to avoid any incentive for diagonal readings. Also, the
questionnaires are self-administered in the same way the evaluation tests
for each discipline are applied in the classrooms, except that they are
anonymous. Additionally added is an indirect statement [“l) in school, my
colleagues throw garbage on to the floor”] and, in order to obtain an internal
validity indicator, two redundant questions are added [“a) I put paper, glass
bottles and plastic bags in different containers” and j) “I put all kind of
waste in the same container”]. The statements for each of the three main
Eco-Schools Program themes are intermingled in this section, and
statements of positive and negative environmental behaviors are alternated.
The questionnaire was pre-tested on a sample of 9th grade students
included in the Eco-Schools Program and, as a result, changes were made
to address problems found in the first section. The final version of the
questionnaire was applied to all sample students between April and May
2013, after informed consent from each school board.
Participants
The sample included 491 9th grade students from five elementary schools
on Madeira Island, 3 of them Eco-Schools for at least the past 5 years and
2 others never included in the program. The questionnaire was applied to

Science Education International
398
almost all the 9th grade students of the educational establishments involved
in the survey, which, as a rule, were students that remained in the same
establishment for the five years that it took to complete studies between 5th
and 9th grade.
Data analysis
Data collected in the survey was analyzed with SPSS (version 20) statistical
software. Accordingly to the student’s responses, the data were converted,
for the items in the attitude and behavioral domains, to numeral scores
ranging from 1 to 5, , and, for knowledge, scored “1” or “0” if answers were
correct or incorrect, respectively. In some analyzes, the input files for
attitude and behavior were constructed with scores normalized as if all
questions were environmentally positive. Blank responses were scored as
missing values.
The reliability (the Cronbach’s Alpha score was 0.705 for the entire
measuring instrument) and validity [confirmed by factor analysis and
internal validity indicator questions that show a significant positive
correlation (r=0.641 p=0.000)] were evaluated followed by a set of
descriptive statistics: mean, standard deviation, and standard error of the
mean. Q-Q plot graphical measure and Kolmogorov-Smirnov test were
used to test the normality of distribution before any factor analysis of
numerical variables was carried out.
The aim of the analysis was to compare environmental knowledge,
attitudes and pro-environmental behavior between Eco-Schools and Non-
Eco-Schools students. For each of the three data domains (knowledge,
attitude and behavior), item by item and total average student’s scores were
calculated for Eco-School and Non-Eco-School students. For knowledge,
the frequency of correct answers in total and for each theme (water, energy
and waste) was calculated and compared between Eco-Schools and Non-
Eco-Schools students. With the data collected from the questionnaire’s
attitude section, the total attitude score were calculated in each of the two
categories of schools and also in concordance with the New Ecological
Paradigm (NEP), with the Dominant Social Paradigm (DSP) and those that
are undefined. Also, NEP scale questions were subdivided by its five group
items: limits to growth (Q1, Q6, Q11), anti-anthropocentrism (Q2, Q7,
Q12), fragility of nature’s balance (Q3, Q8, Q13), rejection of
exemptionalism (Q4, Q9, Q14), and possibility of an eco-crisis (Q5, Q10,
Q15); and the concordance prevalence in each of Eco-Schools and Non-
Eco-Schools was calculated and compared. The pro-environmental
behaviors prevalence in Eco-Schools and Non-Eco-Schools students was
calculated overall and for each of the themes - water, energy and waste..
Significance was addressed through independent sample t-test (2-tailed)
when comparing means and one sample z-test of proportions (2-tailed)
when comparing prevalence, with a confidence level of 95%. A one-way
Science Education International
399
analysis of variance (ANOVA) was used to identify significance between
groups.
RESULTS
The 9th grade students involved in this survey are distributed between Eco-
Schools (ES) (n=220) and Non-Eco-Schools (NES) (n=271). In each group,
males and females are evenly distributed with a 52% and 48% distribution
in NES, respectively, and a 50% equally distribution in ES. The mean age
of students was 15.06 years old in ES and 15 in NES. The participation in
a school’s environmental activities is significantly higher among Eco-
School students (33.9%) than among Non-Eco-School students (9.9%)
(p=0.000). Marks obtained in the 8th grade Natural Sciences discipline were
not significantly different between ES (3.64) and NES (3.58) (p=0.39) (on
a 5 point scale). Missing values account for 4.2% in ES and 2.1% in NES.
Knowledge
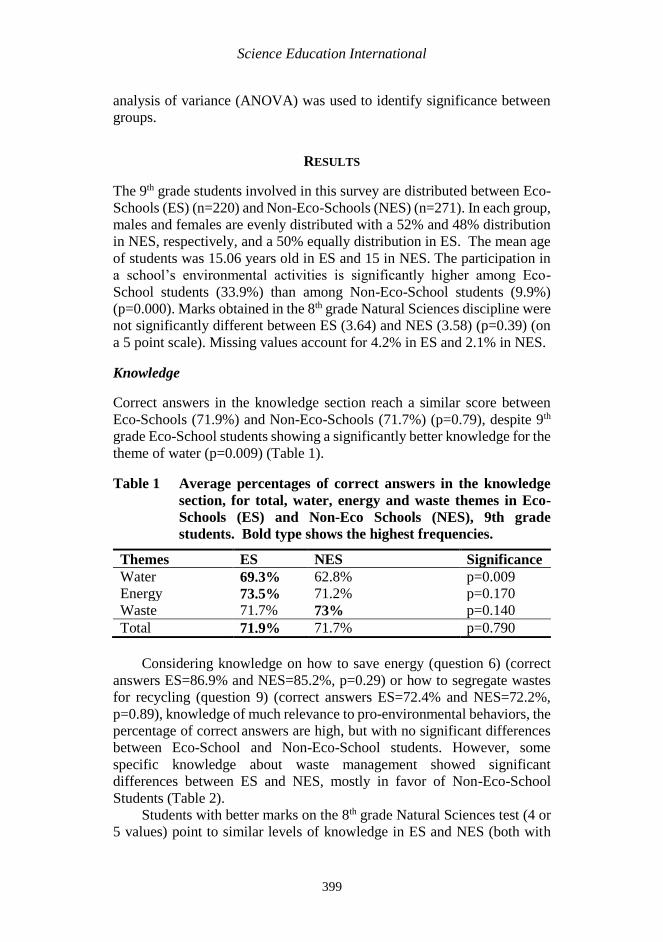
Correct answers in the knowledge section reach a similar score between
Eco-Schools (71.9%) and Non-Eco-Schools (71.7%) (p=0.79), despite 9th
grade Eco-School students showing a significantly better knowledge for the
theme of water (p=0.009) (Table 1).
Table 1 Average percentages of correct answers in the knowledge
section, for total, water, energy and waste themes in Eco-
Schools (ES) and Non-Eco Schools (NES), 9th grade
students. Bold type shows the highest frequencies.
Themes ES NES Significance
Water 69.3% 62.8% p=0.009
Energy 73.5% 71.2% p=0.170
Waste 71.7% 73% p=0.140
Total 71.9% 71.7% p=0.790
Considering knowledge on how to save energy (question 6) (correct
answers ES=86.9% and NES=85.2%, p=0.29) or how to segregate wastes
for recycling (question 9) (correct answers ES=72.4% and NES=72.2%,
p=0.89), knowledge of much relevance to pro-environmental behaviors, the
percentage of correct answers are high, but with no significant differences
between Eco-School and Non-Eco-School students. However, some
specific knowledge about waste management showed significant
differences between ES and NES, mostly in favor of Non-Eco-School
Students (Table 2).
Students with better marks on the 8th grade Natural Sciences test (4 or
5 values) point to similar levels of knowledge in ES and NES (both with

Science Education International
400
73.6% correct responses, p=1). This is despite the fact that responses to four
specific questions show significant differences; two with better results re-
ES students (abundance of water resources: ES= 64.2%, NES=29%,
p=0.000 and where to put broken window glass: ES=12.8%, NES= 7.8%,
p=0.031) and another two for NES students (returnable packaging allows
reducing waste: ES=59.3%, NES=78%, p=0.000; and disposable products
increase waste production: ES=76.3%, NES=84.8%, p=0.038).
Table 2 Percentages of correct answers for specific knowledge that
shows significant differences between Eco-Schools (ES) and
Non-Eco-Schools (NES) 9th grade students. Bold type shows
the highest frequencies.
Questions ES NES Significance
Returnable packaging allows reducing
waste?
58.6% 65.3% p=0.029
For each sheet of paper, should we use
only one side?
82.9% 89.4% p=0.036
When sorting the garbage, where
should we put a newspaper?
95.4% 98.2% p=0.045
When sorting the garbage, where
should we put broken window glass? 12.3% 7.1% p=0.036
When sorting the garbage, where
should we put a packet of crisps?
64% 74.9% p=0.049
Which is the symbol that means “put
in the garbage bin”? 99.5% 97.4% p=0.050
Attitude
In a five point scale for attitude towards the environment, where 1 and 2
relate to the Dominant Social Paradigm- DSP), 3 is Undefined, and 4 and 5
relate to the New Ecological Paradigm - NEP, ES and NES students score
the same value, 3.59 points (p=1). This indicates that, on average in any of
the two groups, the 9th grade students from Madeira Island places
themselves between Undecided and pro New Ecological Paradigm attitudes
(data not shown). Students from Eco-Schools show significant concordance
with three of the five NEP scale facets of an ecological worldview, namely
the existence of “limits to growth”, the “fragility of nature’s balance” and
with the “possibility of an eco-crisis” (Table 3).
The Pro New Ecological Paradigm attitude is not significantly
different between Eco-Schools (59.3%) and Non-Eco-Schools (57.4%)
(p=0.105) (Table 4). The only NEP scale statement with statistical
significant differences between ES (94.6% of concordance) and NES
(86.2% of concordance) was “plants and animals have as much right as

Science Education International
401
humans to exist” (p=0.038) (data not shown). Surprisingly, the pro
Dominant Social Paradigm (DSP) attitude is significantly higher in 9th
grade Eco-School students (19.5%) than in those from Non-Eco-Schools
(17.6%) (p=0.04). An Undecided attitude towards the environment is
significantly higher in NES (25%) than ES (21.3%) (p=0.000) (Table 4).
Table 3 The Pro New Ecological Paradigm (Pro NEP) attitude
prevalence in 9th grade students from Eco-Schools (ES) and
Non-Eco-Schools (NES) for each of the 5 NEP scale
worldview facets. Statistical significant differences are given
in bold.
Pro NEP attitude prevalence’s (%)
NEP worldview facets ES NES Significance
Limits to growth 49.3 44.1 0.05
Anti-anthropocentrism 73.6 71.1 0.29
Fragility of nature’s balance 72.2 67.4 0.05
Rejection of exemptionalism 51.2 50.9 0.91
Possibility of an eco-crisis 63.9 55.9 0.00
Table 4. Average percentages of pro New Ecological Paradigm
(NEP), pro Dominant Social Paradigm (DSP) and
Undecided attitudes in 9th grade students by Eco-Schools
(ES) and Non-Eco-Schools (NES). Statistical significant
differences in bold.
Attitudes towards the environment
Pro-NEP Pro-DSP Undecided
ES 59.3% 19.5% 21.3%
NES 57.4% 17.6% 25%
Significance p=0.105 p=0.04 p=0.000
Behavior
In a five point scale for practices of pro-environmental behaviors (1-Never,
2- Rarely, 3-Sometimes, 4- Very Often, 5- Always), the scores by ES
students (3.39) and NES (3.34) are similar (p=0.98), which means that, on
average in ES or NES, 9th grade students place themselves as practicing pro-
environmental behaviors, with a prevalence between ‘sometimes’ and ‘very
often’ (data not shown). Despite overall results not being statistically
different between ES and NES students, there are specific features of pro-
environmental behaviors prevalence that need to be underlined. The
prevalence of students from ES that ‘never’ (9.8%) practice pro-
environmental behaviors is significantly lower than those from NES

Science Education International
402
(12.3%) (p=0.0007). However, the percentage of students that only practice
it on a ‘rarely’ basis is statistically higher in ES (15.6%) than in NES
(13.8%) (p=0.03) (Table 5). Also, if we take together ‘never’ and ‘rarely’
prevalence as an indicator of a lowest pro-environmental behavior
commitment, there are no significant differences between ES (25.4%) and
NES (26.1%) (p=0.5).
Table 5 Pro-environmental behaviours prevalence for total, water
savings, energy savings and wastes management in 9th
grade students from Eco-Schools (ES) and Non-Eco-Schools
(NES). Statistical significant differences in bold.
Pro-environmental behaviors prevalence - Water
Savings Nev
er
Ra
rely
Some
times
Ver
y Often
Al
ways ES 10.4
% 11.
6%
16.8
%
20.
2%
41
% NES 12.2
% 8.9
%
20.1
%
19.
4%
39.
5% Signifi
cance
p=0.
21 p=
0.05
p=0.0
6
p=0
.66
p=
0.5
Pro-environmental behaviors prevalence –
Energy Savings Nev
er
Ra
rely
Some
times
Ver
y Often
Al
ways ES 11.4
%
16.
4%
26.6
% 24.
9%
20.
8% NES 14.9
%
15.
4%
28.2
% 21.
1%
20.
4% Signifi
cance
p=0.
005
p=
0.83
p=0.3
6 p=0
.016
p=
0.79
Pro-environmental behaviors prevalence –
Wastes Management Nev
er
Ra
rely
Some
times
Ver
y Often
Al
ways ES 7.5% 17
%
31.6
%
23.
9%
19.
1% NES 9.3% 16
%
30.2
%
23.
9%
20.
8% Signifi
cance
p=0.
11
p=
0.5
p=0.4
6
p=1 p=
0.30
Pro-environmental behaviors prevalence – Total
Nev
er
Ra
rely
Some
times
Ver
y Often
Al
ways ES 9.8
%
15.
6%
25.6
%
23.
3%
25.
6% NES 12.3
%
13.
8%
26.7
%
21.
6%
25.
6% Signifi
cance
p=0.
0007
p=
0.03
p=0.2
9
p=0
.08
p=
1
Considering pro-environmental behaviors separately in each of the
three areas evaluated (water savings, energy savings and waste
management), there are no statistical significant differences between the
means scores obtained on the five point scale for ES and NES students.
Water savings: 3.7 in ES, 3.65 in NES, p=0.62;
Energy savings: 3.27 in ES, 3.17 in NES, p=0.26;

Science Education International
403
Waste management: 3.29 in ES, 3.31 in NES, p=0.83).
However, for water saving and energy saving, there are significant
differences in some specific pro-environmental behaviors prevalence
levels. In fact, for water saving, students from ES show a significantly
higher ‘rarely’ practices (p=0.05) and, for energy saving, the prevalence of
ES students that ‘never’ practice pro-environmental behaviors are
significantly lower than by NES students (p=0.005) (Table 5). Also, for
energy saving, students from ES reveal a significantly higher ‘very often’
practices of pro-environmental behaviors than NES students (p=0.016)
(Table 5).
DISCUSSION
Environmental education main goal is to improve environmental literacy.
Despite the great diversity of environmental education programs around the
world, there is a common feature among all of them, a lack of evaluation
on their effectiveness to reach their goals: promote more knowledge, better
attitude and a higher prevalence of pro-environmental behaviors (Disinger
and Roth, 1992). Eco-Schools are, presently, the largest environmental
education program in the world, involving more than 11 million students
across 52 countries. As other environmental education programs, Eco-
Schools main goal is to improve environmental literacy among students.
However, several studies has shown that this goal still has a long way to go
to be achieved and, because of that, the program needs to be better evaluated
in what concerns to its real contribution to the environmental literacy
(Hallfreðsdóttir, 2011; Pauw and Van Petegem, 2011; Pauw and Van
Petegem, 2013; Ozsoy et al., 2012).
The fact that present study evaluates the level of environmental
literacy among 9th grade students attending the same eco-school for a period
of, at least, five years, allows us to evaluate children that were involved on
this environmental education program since their 6/7 years old until 14/15
or more, which gives more consistency to the comparisons. However, the
survey questionnaire used does not allow specific understanding of some
environmental literacy features found, indicating a need for other
methodologies in future studies.
The finding that eco-school students participate more in environmental
activities than students from ordinary schools can be explained with the
expected higher dynamism brought by the environmental education
program. However, despite this highest dynamism of eco-schools, only one
third of their 9th grade students admit having participated in environmental
activities along past years, which can reflect a deficient integration of the
Eco-Schools Program within the school community. It seems that Eco-
Schools Program activities do not reach the majority of students or, at least,
that they are not sufficiently striking, to the point that they still remember
Science Education International
404
them. Additionally, the Eco-Schools Program seems not to influence
positively the 8th grade marks on Natural Sciences, despite it usually being
the core discipline for the Eco-schools dynamics.
Our study shows also that there are no consistent higher influences of
Eco-Schools Program in the level of environmental knowledge of 9th grade
students of Madeira Island. In general, there are no significant differences
between both groups and also the few specific knowledge, in which we
found differences, are evenly distributed between ES and NES students.
The 9th grade students from ES have shown a significantly higher
knowledge in water thematic but, surprisingly, worse than NES students for
some specific knowledge in waste management. However, despite all the
evidence that does not allow us to accept the hypothesis that “students’
knowledge about environmental issues is higher in eco-schools than in non-
eco-schools,” our results show a good level of knowledge in both groups.
Again, results from attitude evaluation through the New Ecological
Paradigm scale does not show, in general, differences between ES and NES
students. However, the evaluation shows that the majority in both groups
places themselves in a pro New Ecological Paradigm attitude, which is in
concordance with the profile found for knowledge. This predominant pro
New Ecological Paradigm attitude, equally in ES and NES, needs to be
further addressed in order to know if ordinary schools does had in place
environmental education programs that could justify these results or if it is
a consequence of outside school influences.
The fact that a pro Dominant Social Paradigm attitude is significantly
higher in ES also contributes to reject the hypothesis that student’s pro-
environmental attitude is higher in Eco-Schools than in Non-Eco-Schools.
However, since the prevalence of pro New Ecological Paradigm attitude is
similar between ES and NES, this higher concordance with Dominant
Social Paradigm for 9th grade ES students should be also a consequence of
their lower undecided levels. Nevertheless, ES students statistically higher
levels of concordance with the existence of “limits to growth”, with the
“fragility of nature’s balance” and with the “possibility of an eco-crisis”
show that they are in a better position than NES to increase their level of
concordance with the New Ecological Paradigm.
Pro-environmental behavior evaluation also, as for knowledge and
attitude, rejects the hypothesis that 9th grade ES students have a better
performance than NES. Despite not statistically different between ES and
NES 9th grade students, almost 50% of them assumes to practice pro-
environmental behaviors in a ‘always’ and ‘very often´ basis. The most
evident differences between ES and NES student behaviors are related to
the distribution of ‘rarely’ and ‘never’ prevalence. Despite ´rarely´ and
‘never’ prevalence, summed together, resulting in a similar percentage
among ES and NES students, there is a significantly different distribution
in both groups with a highest prevalence of ‘never’ in ES and ‘rarely’ on

Science Education International
405
NES. This could mean that the Eco-Schools Program makes some
difference among the students most reluctant to engage in pro-
environmental behaviors, leading some to do it, at least, ‘rarely’.
Pro-environmental behavior prevalence in each one of the three areas
(water, energy and wastes) also does not distinguish between ES and NES.
However, water and energy saving behaviors show differences in some
prevalence levels, favoring ES students, which could be an achievement of
the Eco-Schools Program. In this particular, we could see that the ‘never-
rarely’ balance shown above is particularly evident in water and energy
saving behaviors. This ‘never-rarely’ balance effect, together with the ‘very
often higher’ prevalence of pro-environmental behaviors in ES for energy
savings, reveals that Eco-Schools Program could be responsible for a
slightly better performance on pro-environmental behaviors. However,
despite special care were taken to overcome potential social desirability
bias that could overcome in self-reported assessments, we should also
consider the possibility that this slightly better behavior in ES students
could be a consequence of that sort of effects.
Considering the interesting levels of knowledge, attitude and behavior
towards the environment, found equally in ES and NES 9th grade students
in Madeira Island, we can´t say that Eco-Schools Program is failing its
purpose but, most probably, that ordinary schools does also develop their
own specific environmental education programs and strategies with similar
results. In fact, facing these results, and in order to enlighten why there are
no substantial differences between ES and NES 9th grade students
environmental literacy, as also the low range of the eco-schools activities
among their students, a new survey should be developed in order to
characterize the environmental education programs or activities in place in
both groups of schools. Also, despite our study, as others before, does not
shown significant environmental literacy differences between ES and NES,
there are some evidences of a slightly better performance on students from
schools engaged in the Eco-Schools Program. The new survey suggested
above should also clarify the differences on the environmental education
programs in place that could support these slight differences. Together with
this, the socio-cultural and economic school surroundings should also be
evaluated as also environmental education programs or activities developed
outside the school, namely by the municipalities or environmental non-
governmental organizations. Another hypothesis that needs to be evaluated
is the influence of the disciplinary curriculum on student’s environmental
literacy. In fact, it is known that disciplinary curriculum in Portugal, with a
common structure for all schools, includes environmental education
contents in some specific disciplines along basic education, which could
influence students environmental literacy (Tracana et al, 2012).

Science Education International
406
CONCLUSIONS
There are no clear differences between ES and NES in environmental
literacy, which make us to conclude that Eco-Schools Program does not
represent a much better environmental education instrument than what is
commonly done in ordinary schools. The results of our environmental
literacy evaluation among 9th grade students from Madeira Island
(Portugal), engaged and outside Eco-Schools Program, are in agreement
with previous studies (Krnel and Naglič, 2009; Hallfreðsdóttir, 2011; Pauw
and Van Petegem, 2011; Pauw and Van Petegem, 2013; Ozsoy et al., 2012).
In fact, most of the previous studies shown that Eco-Schools Program does
not increase significantly environmental literacy among students, revealing
only the ability to improve slightly some knowledge and attitudes. Also, the
present study has shown an analogous effect of the Eco-Schools Program
in Madeira Island, although part of its achievement could be mask by a
similar efficiency of others environmental education strategies developed
in ordinary schools, as also the influences of the disciplinary curriculum
environmental education contents and the contribution of the outside school
context. Our study has shown that students integrated in the Eco-Schools
Program for at least 5 years have a slightly better performance in some
aspects of knowledge, attitude and behaviors. It is interesting to note that
the thematic areas in which, somehow, ES 9th grade students distinguished
themselves from NES are, both in knowledge and behavior, water and
energy, in wastes ES students doesn’t revealed any signs of a better
performance. This could reveal that different contributions in and out
school context is influencing student’s environmental literacy, which needs
to be clarified by further studies.
Since the level of environmental literacy could be considered
satisfactory in 9th grade students from Madeira Island, both in ES and NES,
future studies should be developed in order to characterize the
environmental education programs and activities, both in eco-schools,
ordinary schools and outside the school context, to enlighten the reasons
that justify the results of present study.6. Acknowledgments
ACKNOWLEDGEMENT
We thank the boards of the five elementary schools from Madeira Island
that have authorized and cooperated with the present study, and also all the
9th grade teachers that applied the questionnaire in their classrooms.
Science Education International
407
REFERENCES
ABAE (2012). Relatório de Atividades 2011/2012. Planificação de Atividades
2012/13. Programa Eco-Escolas. Retrieved Marsh 15 2014 from
ecoescolas.abae.pt/docs/ee_reports/relatorioEE_2011_12.pdf.
Bas, M., Teksoz, G.T., and Ertepinar, H. (2011). Emphasizing local features for
effective environmental education: Environmental attitudes of elementary
school students living in ancient Halicarnassus (Turkey). Science Education
International, 22(2), 119-132.
Bryman, A. (2004). Social Research Methods. 2nd edition. Oxford: Oxford
University Press.
Cook, S., and Berrenberg, J.L. (1981). Approaches to encouraging conservation
behavior: a review and conceptual framework. Journal of Social Issues, 37
(2), 73-107.
Disinger, J.F. and Roth, C.E. (1992). Environmental Education research news. The
Environmentalist, 12: 165-168.
Dunlap, R.E., Van Liere K.D., Mertig A.G., Jones R.E. (2000). Measuring
Endorsement of the New Ecological Paradigm: A Revised NEP Scale. Journal
of Social Issues, 56 (3): 425-442.
Eco-Schools (2013a). What is Eco-Schools? Eco-School Programme. Retrieved
June 11 2013 from http://www.eco-schools.org/menu/about/eco-schools-2.
Eco-Schools (2013b). What are the Seven Steps? Eco-School Programme.
Retrieved June 17 2013 from http://www.eco-
schools.org/menu/process/seven-steps.
Gomes, M. (Coord.) (2013). Guia Eco-Escolas. ABAE. Retrieved July 10 2013
from ecoescolas.abae.pt/docs/Guia_do_professor.pdf.
Hallfreðsdóttir, S. (2011). Eco Schools – Are They Really Better? Comparison of
Environmental Knowledge, Attitude and Actions between Students in
Environmentally Certified Schools and Traditional Schools in Iceland A
thesis submitted in partial fulfillment of the requirements of Lund University
International Master’s. Programme in Environmental Studies and
Sustainability Science (LUMES). Lund University Centre for Sustainability
Studies, LUND, Sweden.
Hollweg, K.S., Taylor, J.R., Bybee, R.W., Marcinkowski, T.J., McBeth, W.C., and
Zoido, P. (2011). Developing a framework for assessing environmental
literacy. Washington, DC: North American Association for Environmental
Education. Retrieved 12 Marsh 2013 from
http://www.google.pt/url?sa=t&rct=j&q=&esrc=s&source=web&cd=2&cad
=rja&uact=8&ved=0CC4QFjAB&url=http%3A%2F%2Fwww.naaee.net%2
Fsites%2Fdefault%2Ffiles%2Fframework%2FDevFramewkAssessEnvLitO
nlineEd.pdf&ei=ihQXVKKWMYfHPO6kgegD&usg=AFQjCNEx7jujAD2I
OdTc7vRe04VIn6XQig&bvm=bv.75097201,d.ZWU.
Hungerford, H.R. and Peyton R.B. (1976). Teaching environmental education.
Portland, ME: J. Weston Walch.
Hungerford, H.R. and Volk, T. (1990). Changing learner behavior through
environmental education. The Journal of Environmental Education, 21 (3), 8-
22.
Igbokwe, A.B. (2012). Environmental Literacy Assessment: Exploring the
Potential for the Assessment of Environmental Education/Programs in

Science Education International
408
Ontario Schools. International Journal for Cross-Disciplinary Subjects in
Education (IJCDSE), 3 (1): 648-656.
Kostova, Z., Vladimirova, E., Radoynovska, B. (2011). The environmental concern
of nine-grade students from a secondary professional school. Bulgarian
Journal of Science and Education Policy (B JSEP), 5 (1): 178-218.
Krnel, D. and Naglič, S. (2009). Environmental literacy comparison between eco-
schools and ordinary schools in Slovenia. Science Education International
Vol.20, No.1/2: 5-24.
Kuhlemeier, H., Van Den Bergh, H. and Lagerweij, N. (1999). Environmental
Knowledge, Attitudes, and Behavior in Dutch Secondary Education. The
Journal of Environmental Education, 30 (2): 4-14.
McBeth, W. and Volk, T.L. (2010). The national environmental literacy project: A
baseline study of middle grade students in United States. The Journal of
Environmental Education, 41(1), 55- 67.
Mutisya, S.M. and Barker, M. (2011). Pupils’ environmental awareness and
knowledge: A springboard for action in primary schools in Kenya’s Rift
valley, Science Education International, 22(1), 55-71.
Nederhof, A.J. (1985). Methods of coping with social desirability bias: a review.
European Journal of Social Psychology, 15: 263-280.
Ogunbode, C.A. (2013). The NEP scale: measuring ecological
attitudes/worldviews in an African context. Environment, Development and
Sustainability, 15 (6): 1477-1494.
Ogunjinmi, A.A., Onadeko, S.A. and Adewumi, A.A. (2012). An Empirical Study
of the Effects of Personal Factors on Environmental Attitudes of Local
Communities around Nigeria’s Protected Areas. The Journal of
Transdisciplinary Environmental Studies, 11 (1): 40-53.
Ozsoy, S., Ertepinar, H. and Saglam, N. (2012). Can eco-schools improve
elementary school students’ environmental literacy levels? Asia-Pacific
Forum on Science Learning and Teaching, 13 (2), Article 3: 1-25.
Pauw, J.B. and Van Petegem, P. (2011). The Effect of Flemish Eco‐ Schools on
Student Environmental Knowledge, Attitudes, and Affect. International
Journal of Science Education, 33 (11): 1513-1538.
Pauw, J.B. and Van Petegem, P. (2013). The effect of eco-schools on children’s
environmental values and behavior. Journal of Biological Education, 47 (2):
96-103.
Pe'er, S., Goldman, D. and Yavetz, B. (2007). Environmental Literacy in Teacher
Training: Attitudes, Knowledge, and Environmental Behavior of Beginning
Students. The Journal of Environmental Education, 39 (1): 45-59.
Roth, C.E. (1992). Environmental literacy: its roots, evolution and direction in the
1990s. Columbus, OH, ERIC Clearinghouse for Science, Mathematics and
Environmental Education.
Shoukry, S.H., Saad S.G., Eltemsahi A.M. and Abolfotouh M.A. (2012).
Awareness, Attitude, and Concerns of Workers and Stakeholders of an
Environmental Organization toward the Environment. SAGE Open. October-
December 2012: 1–10.
Simmons, D. (1995). Developing a framework for National Environmental
Education Standards. In Papers on the development of environmental
education standards (pp. 10-58). Troy, OH: NAAEE.

Science Education International
409
Stern, P. (2000). Toward a coherent theory of environmentally significant behavior.
The Journal of Social Issues, 56 (3), 407.
Tracana, R.B., Ferreira, E. e Carvalho, G. (2012). Environmental Education in
Portuguese School Programmes and Textbooks in Two Periods: 1991-2000
and 2001-2006. The Online Journal Of New Horizons In Education, Vol. 2,
Issue 1: 57-67.
Trobe, H.L. and Acott, T.G. (2000). A Modified NEP/DSP Environmental
Attitudes Scale. The Journal of Environmental Education, 32 (1): 12-20.
UNESCO (1980). Environmental education in the light of Tbilisi conference.
Paris, France: United Nations Educational, Scientific and Cultural
Organization.
Watne, T., Brennan, L., Binney, W. and Parker, L. (2012). 'The use of the NEP
scale as a measure of environmental attitudes', in John Cadogan, Maxwell
Wincester (ed.) Proceedings Australian and New Zealand Marketing
Academy Conference -ANZMAC 2012, Adelaide, Australia, 3-5 December
2012, pp. 1-6.
Wilke, R. (Ed.). (1995). Environmental Education Literacy/Needs Assessment
Project: Assessing environmental literacy of students and environmental
education needs of teachers. Final report for 1993-1995 (pp. 5-6). Stevens
Point, WI: University of Wisconsin-Stevens Point.
APPENDIX: QUESTIONNAIRE
School Name: __________________________________________________
Age: _____ Gender: M F School Year: 9ª grade
What was your mark in the 8th grade Natural Sciences discipline?
1 2 3 4 5
Along the last few years, have you participated in environmental activities at
school?
Yes No
1. In the region you live, water is a resource (choose only one answer):
a) Absent b) Rare c) Sufficient d) Abundant
2. What is the worst threat to water resources? (choose only one answer):
a) Soil impermeabilization.
b) Lack of rain and high temperatures.
c) Excessive consumption, waste and pollution.
d) The high prices.
3. In which of the following functions do we use more water? (choose only one
answer):
a) To drink.
b) To wash dishes in the kitchen.
c) To personal hygiene in the bathroom.
d) To cook.

Science Education International
410
4. What are the most used energy sources in Madeira Island? (choose only one
answer):
a) Renewable energy (hydro, wind and solar- environmentally friendly energy).
b) Fossil fuels (oil and gas- polluting energy).
5. Which of the following activities or situations contributes more severely to
pollute the air we breathe daily in our society? (choose only one answer):
a) Forest fires b) Industry c) Incineration d) Transports
6. Select for each of the activities listed below which option represents a LOWER
power consumption.
Activity Option 1 Option 2
Option with
LESS
energy
consumption
Switching off TV: On TV button On remote control
Illumination: Incandescent
lamps
Fluorescent
lamps
Transports: Car Bus
Alimentation: Regional products Imported products
7. In the last decades the wastes production in Madeira Island (choose only one
answer):
a) Decreased b) Remained stable c) Increased d) Oscillated
8. Tick the statements with which you agree (choose as many as you want):
a) We must put the trash in the appropriate containers.
b) Waste management is an exclusive responsibility of public entities.
c) The waste segregation is easier if we put everything in the same container.
d) When we walk in nature, we must bring back the garbage with us.
e) Returnable packaging will reduce the production of waste.
f) On school works, we should use only one page per sheet of paper.
g) Disposable products contribute to increase waste production.
h) Without trash on the floor, the staff responsible for cleaning will lost their
jobs.
9. To recycle is necessary to selectively collect the wastes. Match the items of the
two columns correctly:
Newspaper •
Diaper • • Vidrão (green container)
Windows glass •
Packet of crisps • • Papelão (blue container)
Notebook •
Tea cup • • Embalão (yellow container)
Soda can •
Plastic bag • • Container for unsorted trash
Glass botlle •
Science Education International
411
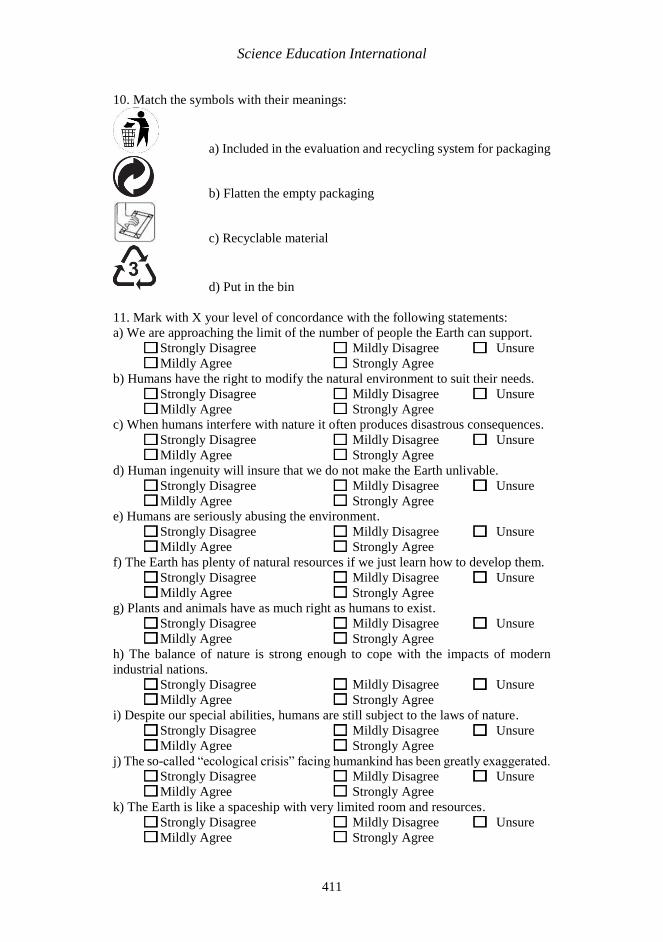
10. Match the symbols with their meanings:
a) Included in the evaluation and recycling system for packaging
b) Flatten the empty packaging
c) Recyclable material
d) Put in the bin
11. Mark with X your level of concordance with the following statements:
a) We are approaching the limit of the number of people the Earth can support.
Strongly Disagree Mildly Disagree Unsure
Mildly Agree Strongly Agree
b) Humans have the right to modify the natural environment to suit their needs.
Strongly Disagree Mildly Disagree Unsure
Mildly Agree Strongly Agree
c) When humans interfere with nature it often produces disastrous consequences.
Strongly Disagree Mildly Disagree Unsure
Mildly Agree Strongly Agree
d) Human ingenuity will insure that we do not make the Earth unlivable.
Strongly Disagree Mildly Disagree Unsure
Mildly Agree Strongly Agree
e) Humans are seriously abusing the environment.
Strongly Disagree Mildly Disagree Unsure
Mildly Agree Strongly Agree
f) The Earth has plenty of natural resources if we just learn how to develop them.
Strongly Disagree Mildly Disagree Unsure
Mildly Agree Strongly Agree
g) Plants and animals have as much right as humans to exist.
Strongly Disagree Mildly Disagree Unsure
Mildly Agree Strongly Agree
h) The balance of nature is strong enough to cope with the impacts of modern
industrial nations.
Strongly Disagree Mildly Disagree Unsure
Mildly Agree Strongly Agree
i) Despite our special abilities, humans are still subject to the laws of nature.
Strongly Disagree Mildly Disagree Unsure
Mildly Agree Strongly Agree
j) The so-called “ecological crisis” facing humankind has been greatly exaggerated.
Strongly Disagree Mildly Disagree Unsure
Mildly Agree Strongly Agree
k) The Earth is like a spaceship with very limited room and resources.
Strongly Disagree Mildly Disagree Unsure
Mildly Agree Strongly Agree
Science Education International
412
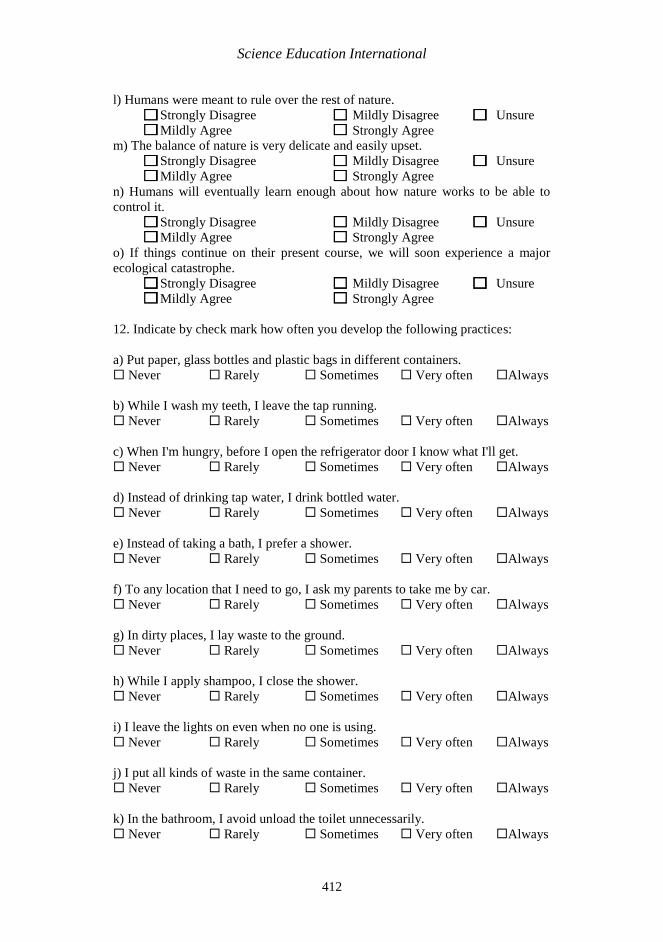
l) Humans were meant to rule over the rest of nature.
Strongly Disagree Mildly Disagree Unsure
Mildly Agree Strongly Agree
m) The balance of nature is very delicate and easily upset.
Strongly Disagree Mildly Disagree Unsure
Mildly Agree Strongly Agree
n) Humans will eventually learn enough about how nature works to be able to
control it.
Strongly Disagree Mildly Disagree Unsure
Mildly Agree Strongly Agree
o) If things continue on their present course, we will soon experience a major
ecological catastrophe.
Strongly Disagree Mildly Disagree Unsure
Mildly Agree Strongly Agree
12. Indicate by check mark how often you develop the following practices:
a) Put paper, glass bottles and plastic bags in different containers.
Never Rarely Sometimes Very often Always
b) While I wash my teeth, I leave the tap running.
Never Rarely Sometimes Very often Always
c) When I'm hungry, before I open the refrigerator door I know what I'll get.
Never Rarely Sometimes Very often Always
d) Instead of drinking tap water, I drink bottled water.
Never Rarely Sometimes Very often Always
e) Instead of taking a bath, I prefer a shower.
Never Rarely Sometimes Very often Always
f) To any location that I need to go, I ask my parents to take me by car.
Never Rarely Sometimes Very often Always
g) In dirty places, I lay waste to the ground.
Never Rarely Sometimes Very often Always
h) While I apply shampoo, I close the shower.
Never Rarely Sometimes Very often Always
i) I leave the lights on even when no one is using.
Never Rarely Sometimes Very often Always
j) I put all kinds of waste in the same container.
Never Rarely Sometimes Very often Always
k) In the bathroom, I avoid unload the toilet unnecessarily.
Never Rarely Sometimes Very often Always

Science Education International
413
l) At school, I see my colleagues throwing trash on the floor.
Never Rarely Sometimes Very often Always
m) At home, I turn off the television with the remote control.
Never Rarely Sometimes Very often Always
n) I go to school on foot or by bus.
Never Rarely Sometimes Very often Always
o) I have a preference for products from abroad (imported).
Never Rarely Sometimes Very often Always
Recommended