Rome - April 22nd, 2009
Investor Day
1
• Opening remarks F. Conti
• Enel Green Power: a leading player in renewable energies F. Starace
• Focus on technologies:
• Geothermal T. Volpe
• Hydro V. Vagliasindi
• Focus on technologies:
• Wind M. Bezzeccheri
• Solar Photovoltaic I. Wilhelm
• Business Development Model R. Deambrogio
• Financial highlights A. De Paoli
• Conclusions F. Starace
Investor DayRome - April 22nd, 2009
2
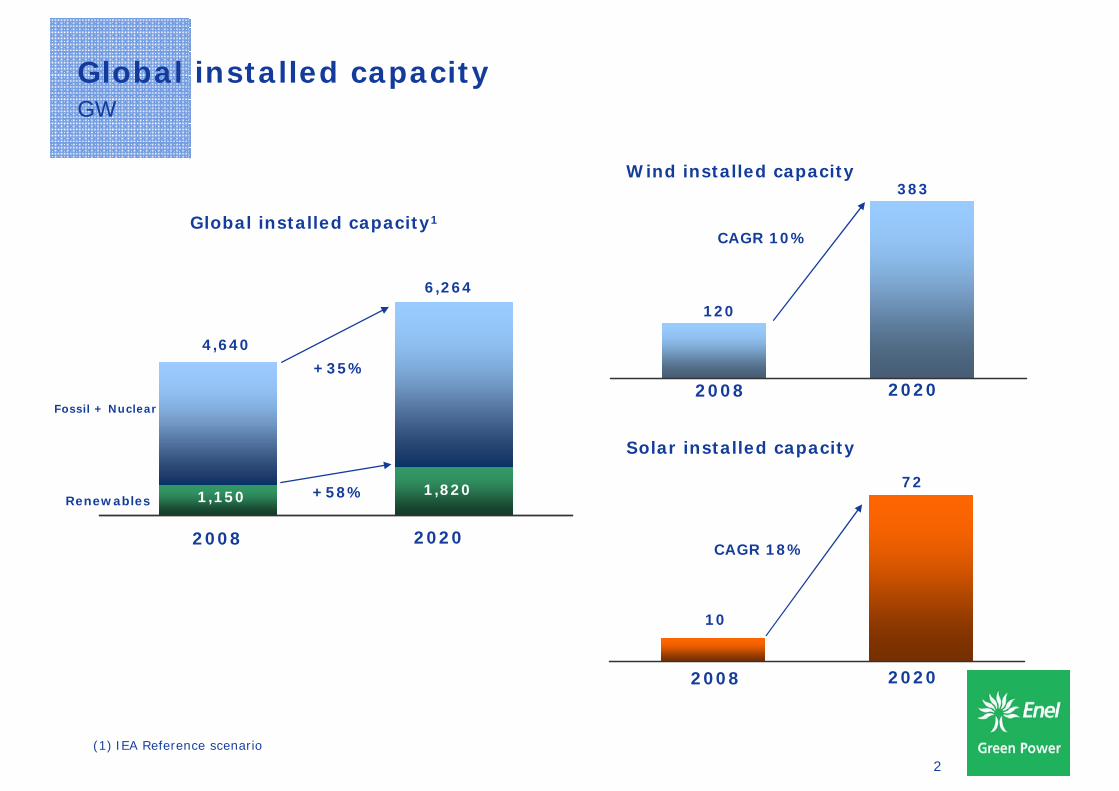
Global installed capacityGW
Global installed capacity1
Wind installed capacity
Solar installed capacity
2008 2020
4,640
6,264
1,150 1,820
+35%
+58%
2008 2020
10
72
CAGR 18%
(1) IEA Reference scenario
2008 2020
120
383
CAGR 10%
Renewables
Fossil + Nuclear
3
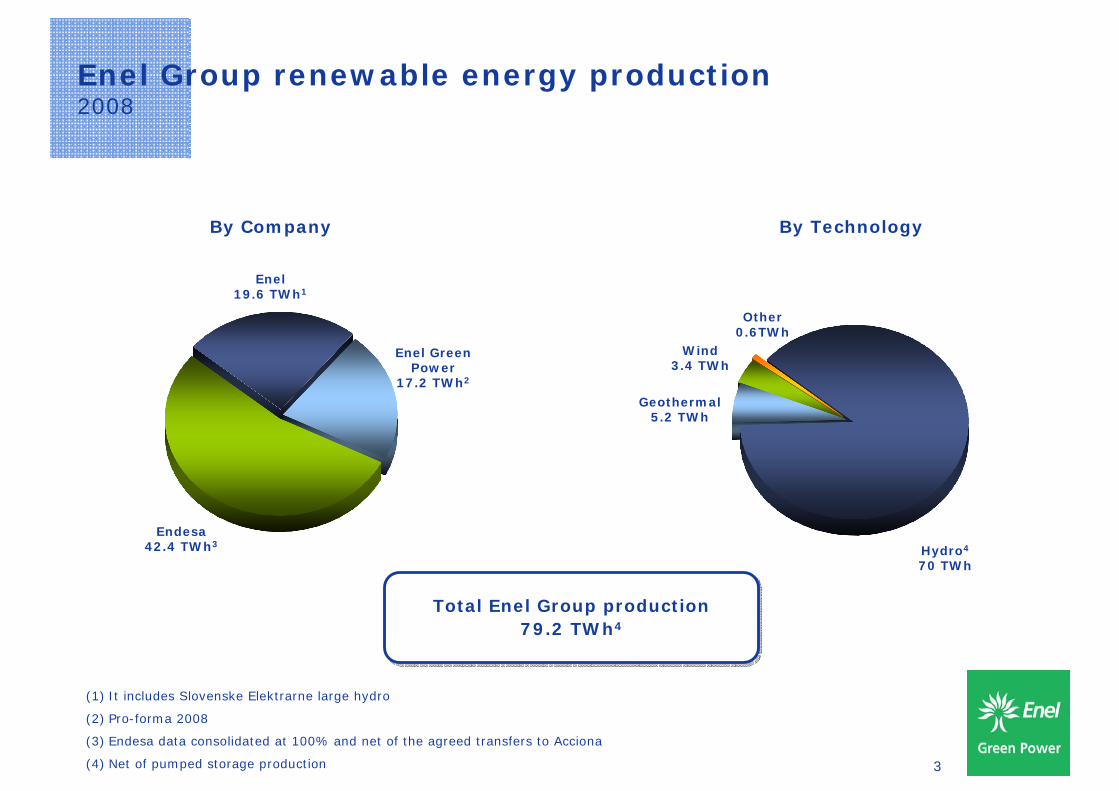
Enel Group renewable energy production2008
By Company By Technology
(1) It includes Slovenske Elektrarne large hydro
(2) Pro-forma 2008
(3) Endesa data consolidated at 100% and net of the agreed transfers to Acciona
(4) Net of pumped storage production
Enel 19.6 TWh1
Enel Green Power
17.2 TWh2
Endesa42.4 TWh3
Hydro4
70 TWh
Geothermal5.2 TWh
Wind3.4 TWh
Other0.6TWh
Total Enel Group production 79.2 TWh4
Total Enel Group production 79.2 TWh4
4
• Opening remarks F. Conti
• Enel Green Power: a leading player in renewable energies F. Starace
• Focus on technologies:
• Geothermal T. Volpe
• Hydro V. Vagliasindi
• Focus on technologies:
• Wind M. Bezzeccheri
• Solar Photovoltaic I. Wilhelm
• Business Development Model R. Deambrogio
• Financial highlights A. De Paoli
• Conclusions F. Starace
Investor DayRome - April 22nd, 2009
5
Enel Green Power: a leading player in renewable energies
Francesco Starace
Investor Day
Rome - April 22nd, 2009
6
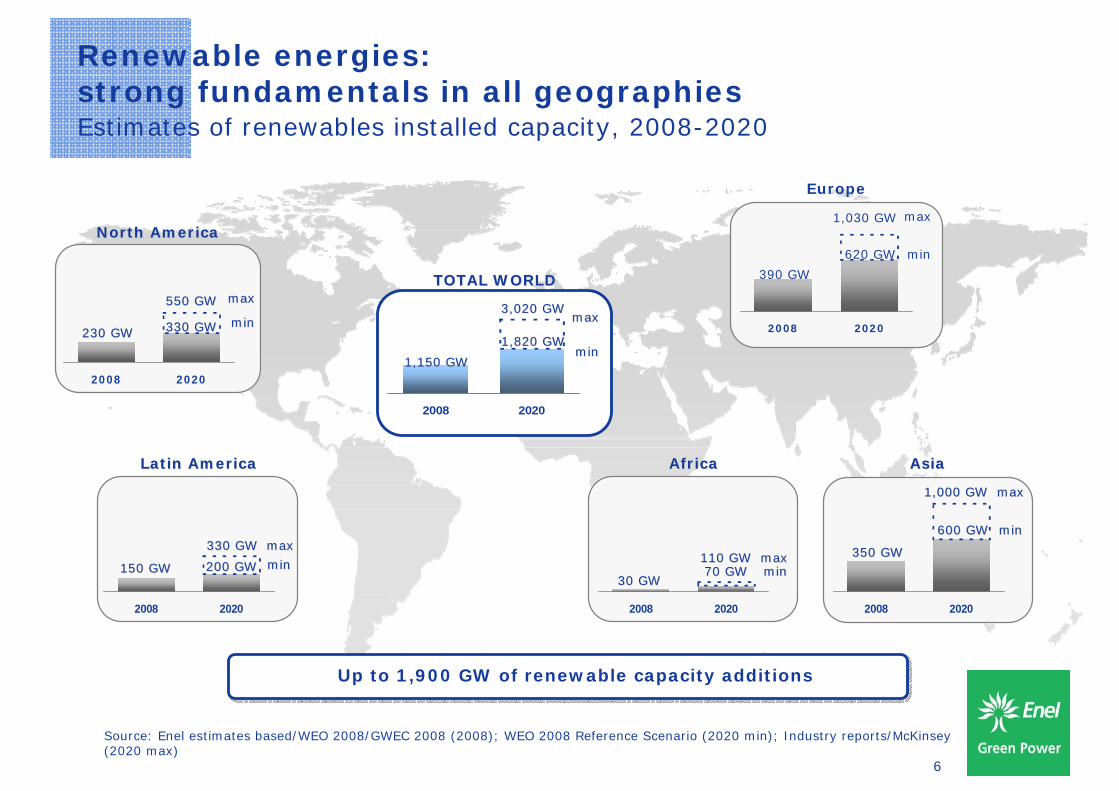
Source: Enel estimates based/WEO 2008/GWEC 2008 (2008); WEO 2008 Reference Scenario (2020 min); Industry reports/McKinsey (2020 max)
Up to 1,900 GW of renewable capacity additionsUp to 1,900 GW of renewable capacity additions
Renewable energies: strong fundamentals in all geographiesEstimates of renewables installed capacity, 2008-2020
2008 2020
230 GW230 GW
550 GW550 GW
330 GW330 GW
North AmericaNorth America
maxmax
minmin
2008 2020
150 GW150 GW
330 GW330 GW
200 GW200 GW
Latin AmericaLatin America
maxmax
minmin
2008 2020
30 GW30 GW
110 GW110 GW70 GW70 GW
AfricaAfrica
maxmaxminmin
2008 2020
350 GW350 GW
1,000 GW1,000 GW
600 GW600 GW
AsiaAsia
maxmax
minmin
2008 2020
390 GW
1,030 GW
620 GW
Europe
max
min
2008 2020
1,150 GW1,150 GW
3,020 GW3,020 GW
1,820 GW1,820 GW
TOTAL WORLDTOTAL WORLD
maxmax
minmin
7
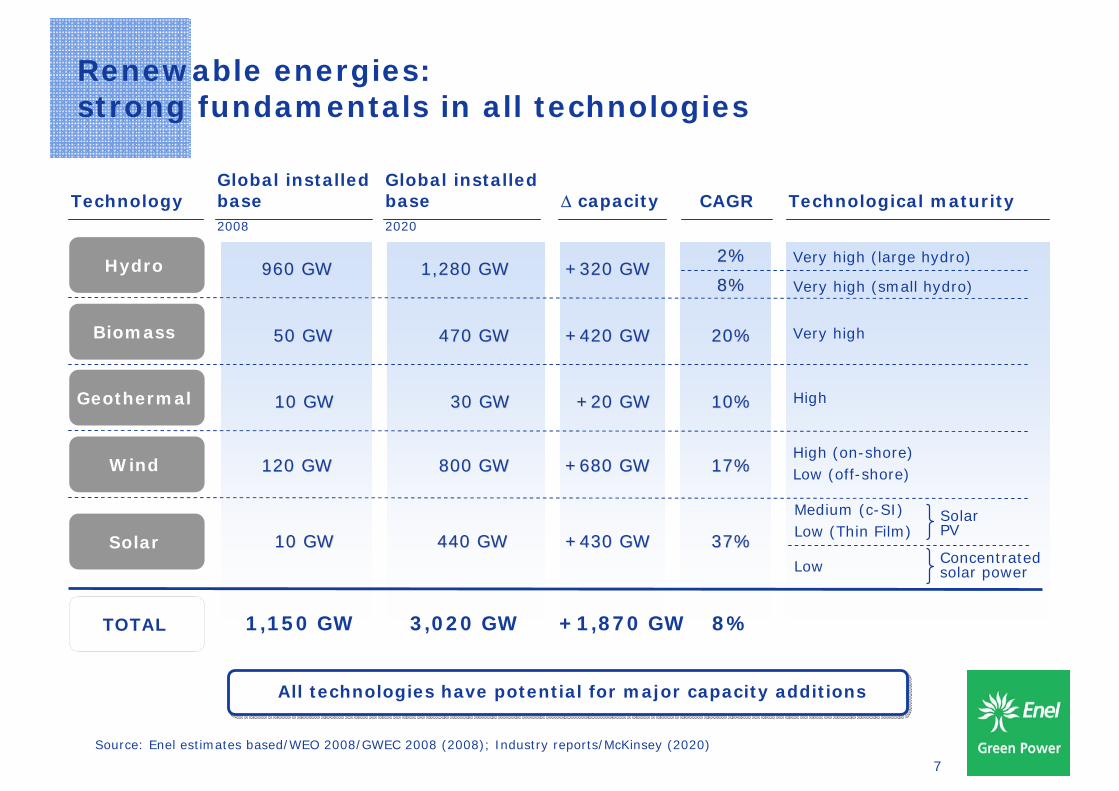
Renewable energies: strong fundamentals in all technologies
All technologies have potential for major capacity additionsAll technologies have potential for major capacity additions
TechnologyGlobal installedbase2008
CAGRGlobal installedbase2020
Technological maturityΔ capacity
960 GW960 GW 1,280 GW1,280 GWHydro +320 GW+320 GW
10 GW10 GW
Wind
440 GW440 GW 37%37%
10 GW10 GW 30 GW30 GW 10%10%
120 GW120 GW 800 GW800 GW 17%17%High (on-shore)Low (off-shore)
High
Medium (c-SI)Low (Thin Film)
Geothermal
SolarLow
+430 GW+430 GW
+20 GW+20 GW
+680 GW+680 GW
50 GW50 GW 470 GW470 GW 20%20% Very highBiomass +420 GW+420 GW
1,150 GW 3,020 GW 8%TOTAL +1,870 GW
Solar PV
Concentrated solar power
Source: Enel estimates based/WEO 2008/GWEC 2008 (2008); Industry reports/McKinsey (2020)
2%2% Very high (large hydro)
8%8% Very high (small hydro)
8
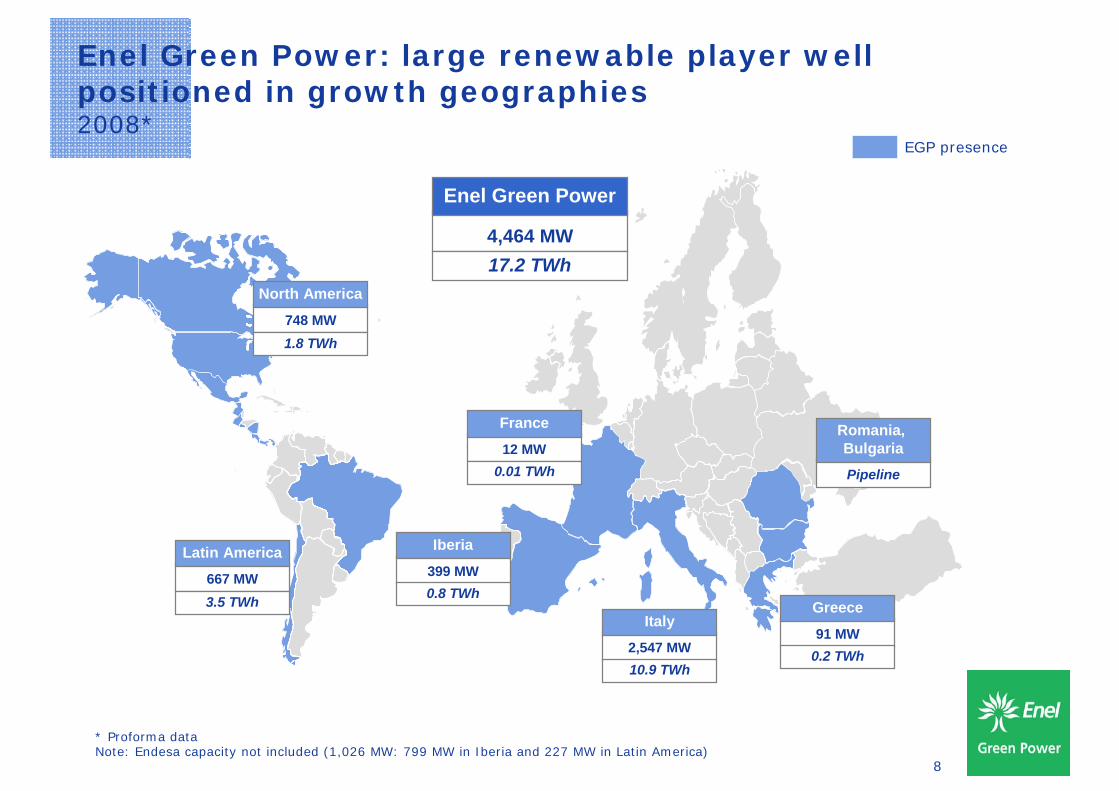
Enel Green Power: large renewable player well positioned in growth geographies2008*
EGP presence
4,464 MW
Enel Green Power
17.2 TWh
748 MW
North America
1.8 TWh
399 MW
Iberia
0.8 TWh
2,547 MW
Italy
10.9 TWh
12 MW
France
0.01 TWh
91 MW
Greece
0.2 TWh
667 MW
Latin America
3.5 TWh
* Proforma dataNote: Endesa capacity not included (1,026 MW: 799 MW in Iberia and 227 MW in Latin America)
Pipeline
Romania, Bulgaria
9
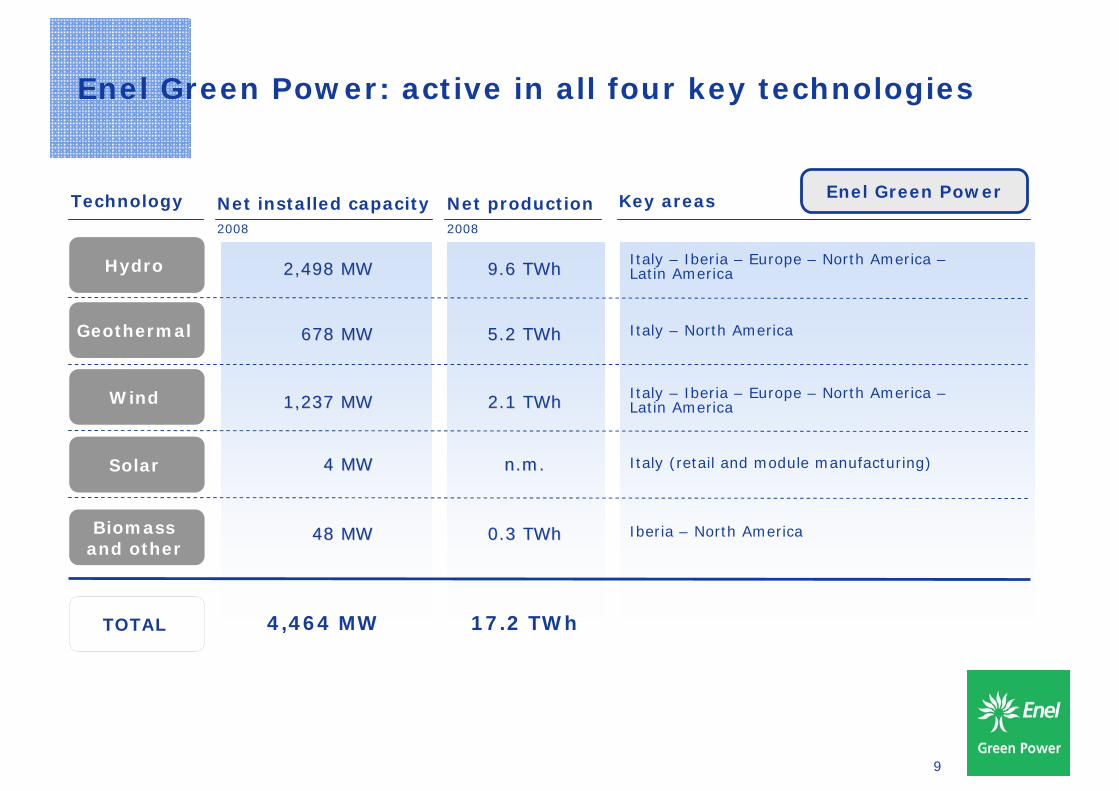
Enel Green Power: active in all four key technologies
Technology Net installed capacity2008
Net production2008
Key areas
2,498 MW2,498 MW 9.6 9.6 TWhTWh Italy – Iberia – Europe – North America –Latin AmericaHydro
48 MW48 MW 0.3 0.3 TWhTWh Iberia – North AmericaBiomass and other
4,464 MW 17.2 TWhTOTAL
4 MW4 MW
Wind
n.mn.m. .
678 MW678 MW 5.2 5.2 TWhTWh
1,237 MW1,237 MW 2.1 2.1 TWhTWh
Italy – North AmericaGeothermal
Solar Italy (retail and module manufacturing)
Italy – Iberia – Europe – North America –Latin America
Enel Green Power
10
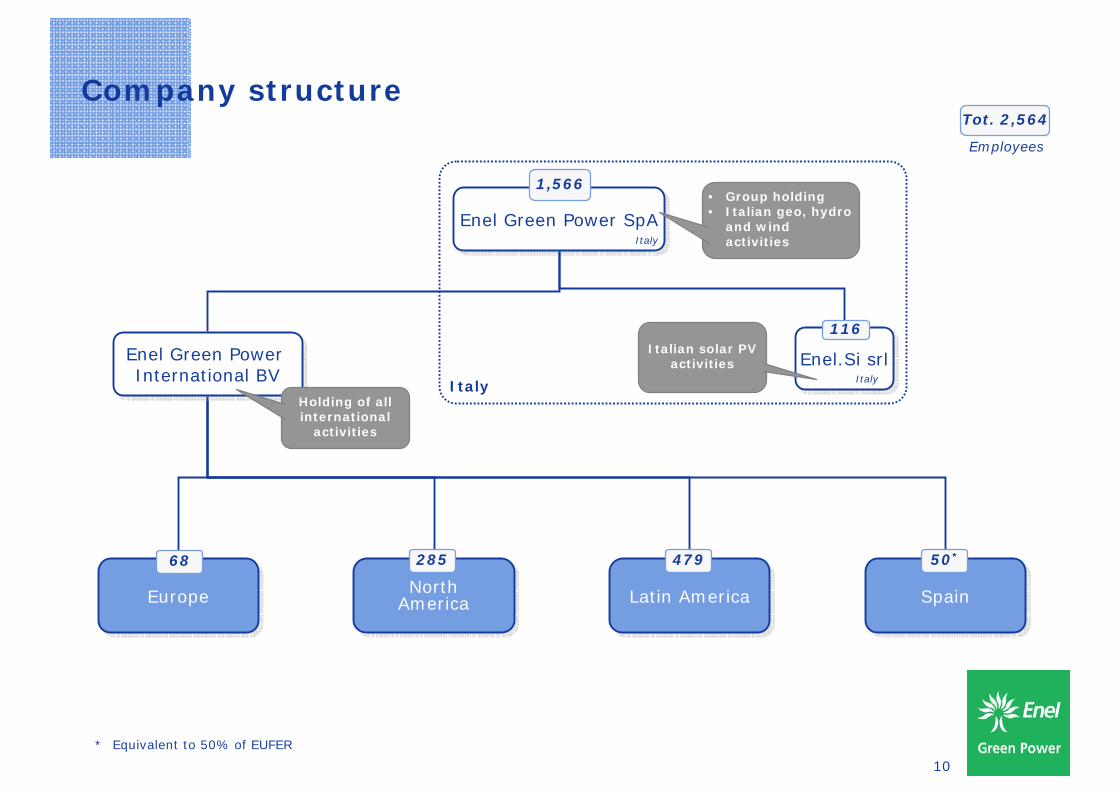
Company structure
Enel Green Power SpAEnel Green Power SpA
North AmericaNorth
America
Italy
SpainSpainEuropeEurope Latin AmericaLatin America
Enel Green Power International BV
Enel Green Power International BV
Enel.Si srlEnel.Si srlItaly
Holding of all international
activities
Italian solar PV activities
• Group holding• Italian geo, hydro
and wind activities
1,566
116
50*47928568
Employees
Tot. 2,564
* Equivalent to 50% of EUFER
Italy
11
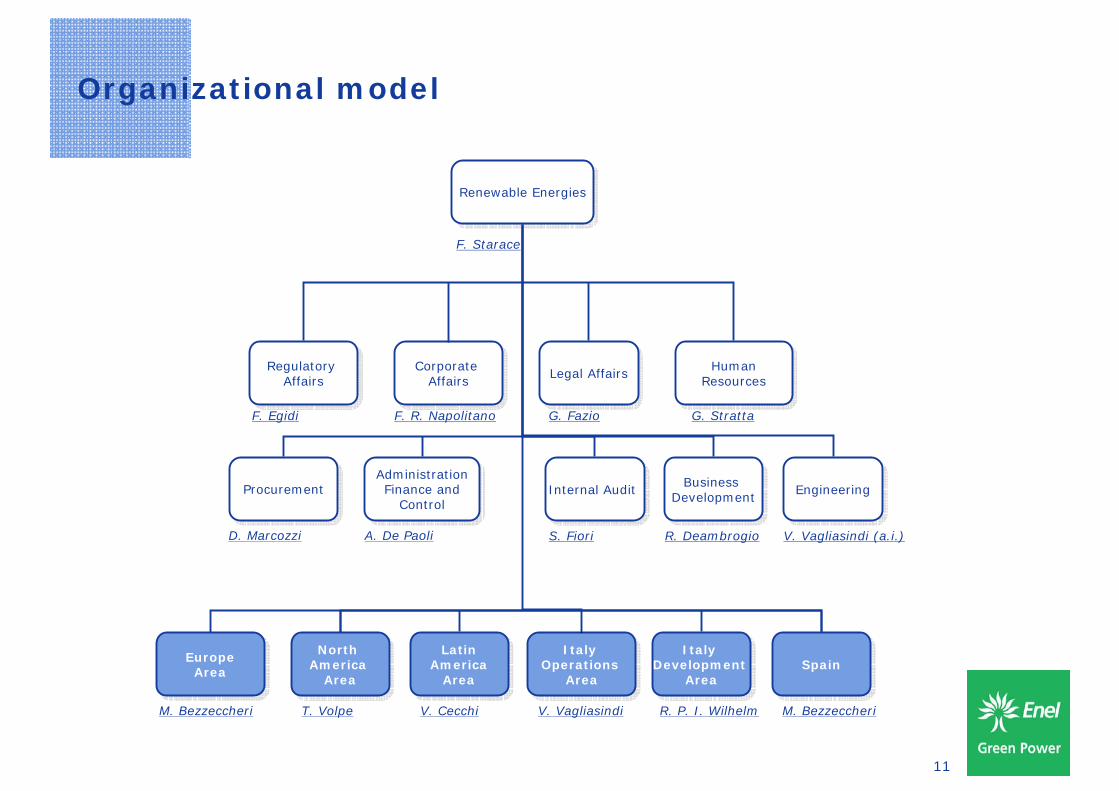
Organizational model
D. Marcozzi R. DeambrogioS. Fiori
ProcurementProcurement
Legal AffairsLegal Affairs
Business DevelopmentBusiness
Development
G. Stratta
Renewable EnergiesRenewable Energies
Administration Finance and
Control
Administration Finance and
Control
G. Fazio
EngineeringEngineering
V. Vagliasindi (a.i.)
Human ResourcesHuman
Resources
A. De Paoli
V. VagliasindiT. Volpe
Italy Operations
Area
Italy Operations
Area
Italy Development
Area
Italy Development
Area
North America
Area
North America
Area
F. Starace
SpainSpainEuropeArea
EuropeArea
Latin America
Area
Latin America
Area
V. CecchiM. Bezzeccheri M. BezzeccheriR. P. I. Wilhelm
Internal AuditInternal Audit
F. Egidi F. R. Napolitano
RegulatoryAffairs
RegulatoryAffairs
Corporate Affairs
Corporate Affairs
12
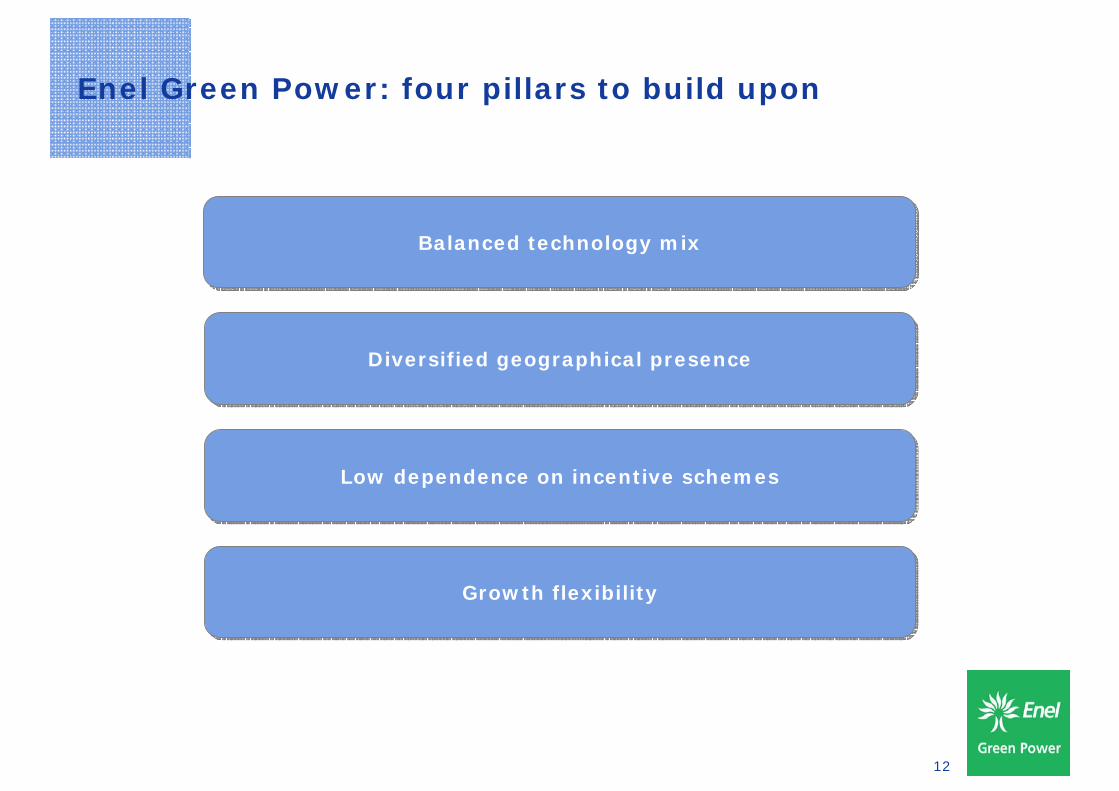
Diversified geographical presenceDiversified geographical presence
Enel Green Power: four pillars to build upon
Low dependence on incentive schemesLow dependence on incentive schemes
Growth flexibilityGrowth flexibility
Balanced technology mixBalanced technology mix
13
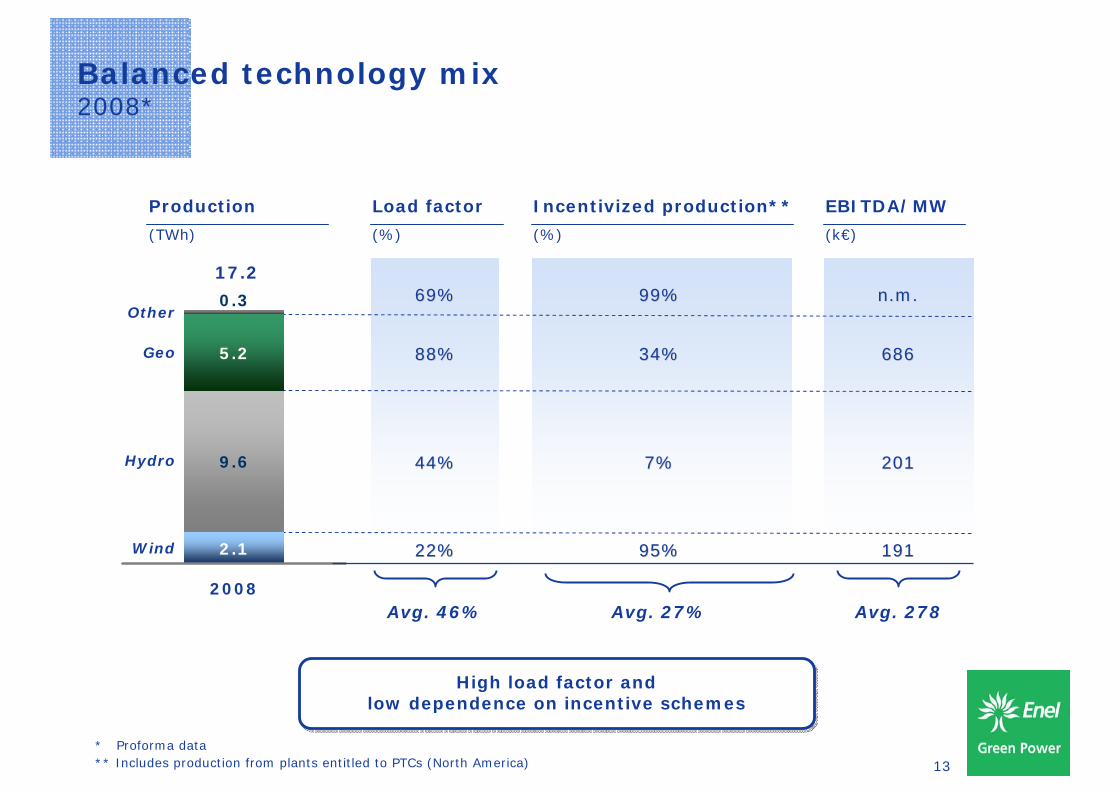
Balanced technology mix2008*
Production
(TWh)
Load factor
(%)
Incentivized production**
(%)
69%69%
22%22%
Avg. 46%
Hydro
Geo
Wind
Other
EBITDA/MW
(k€)
99%99%
95%95%
Avg. 27%
88%88% 34%34% 686686
n.mn.m..
191191
44%44% 7%7% 201201
Avg. 278
2.1
5.2
9.6
0.3
2008
** Includes production from plants entitled to PTCs (North America)
17.2
* Proforma data
High load factor and low dependence on incentive schemes
High load factor and low dependence on incentive schemes
14
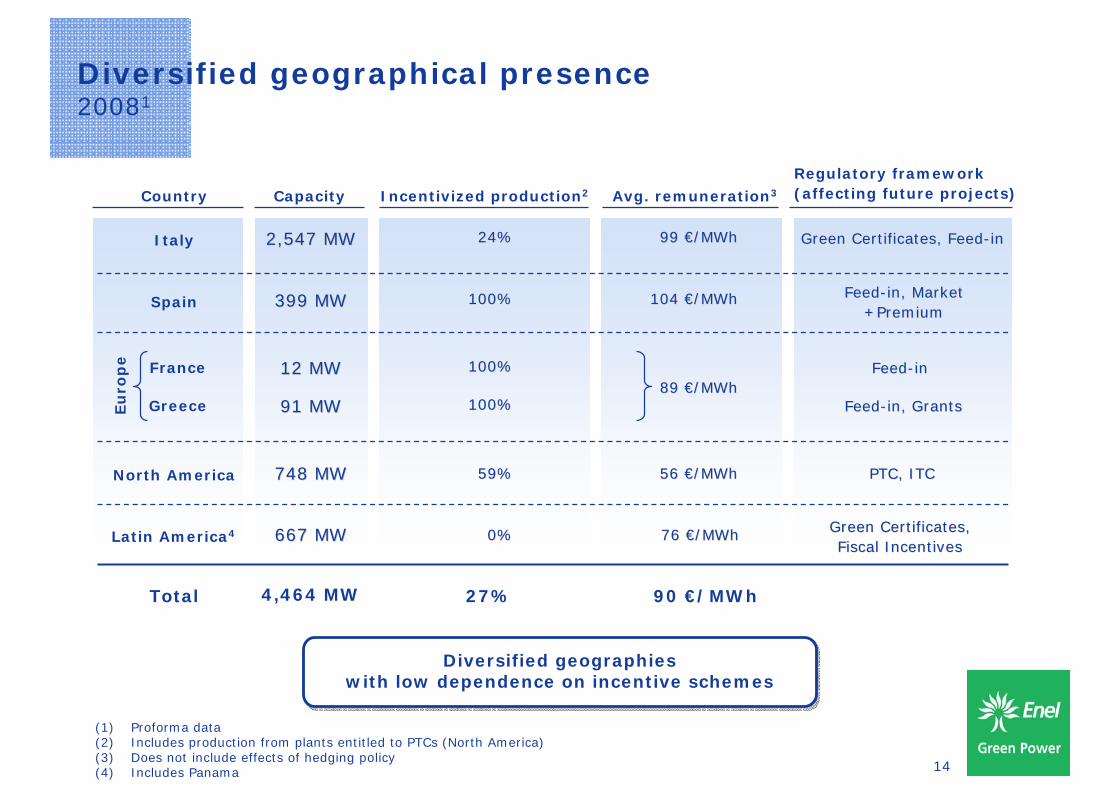
Diversified geographical presence20081
Incentivized production2
Latin America4 667 MW667 MW
Country
Italy
Spain
Capacity
2,547 MW2,547 MW
399 MW399 MW
France
Greece
12 MW12 MW
91 MW91 MW
North America 748 MW748 MW
76 76 €€/MWh/MWh
Avg. remuneration3
99 99 €€/MWh/MWh
104 104 €€/MWh/MWh
89 89 €€/MWh/MWh
56 56 €€/MWh/MWh
Green Certificates, Green Certificates, Fiscal IncentivesFiscal Incentives
Regulatory framework (affecting future projects)
Green Certificates, FeedGreen Certificates, Feed--inin
FeedFeed--in, Market in, Market +Premium+Premium
FeedFeed--inin
FeedFeed--in, Grantsin, Grants
PTC, ITCPTC, ITC
Eu
rop
e
0%0%
24%24%
100%100%
100%100%
100%100%
59%59%
Total 4,464 MW 90 €/MWh27%
(1) Proforma data(2) Includes production from plants entitled to PTCs (North America)(3) Does not include effects of hedging policy(4) Includes Panama
Diversified geographies with low dependence on incentive schemes
Diversified geographies with low dependence on incentive schemes
15
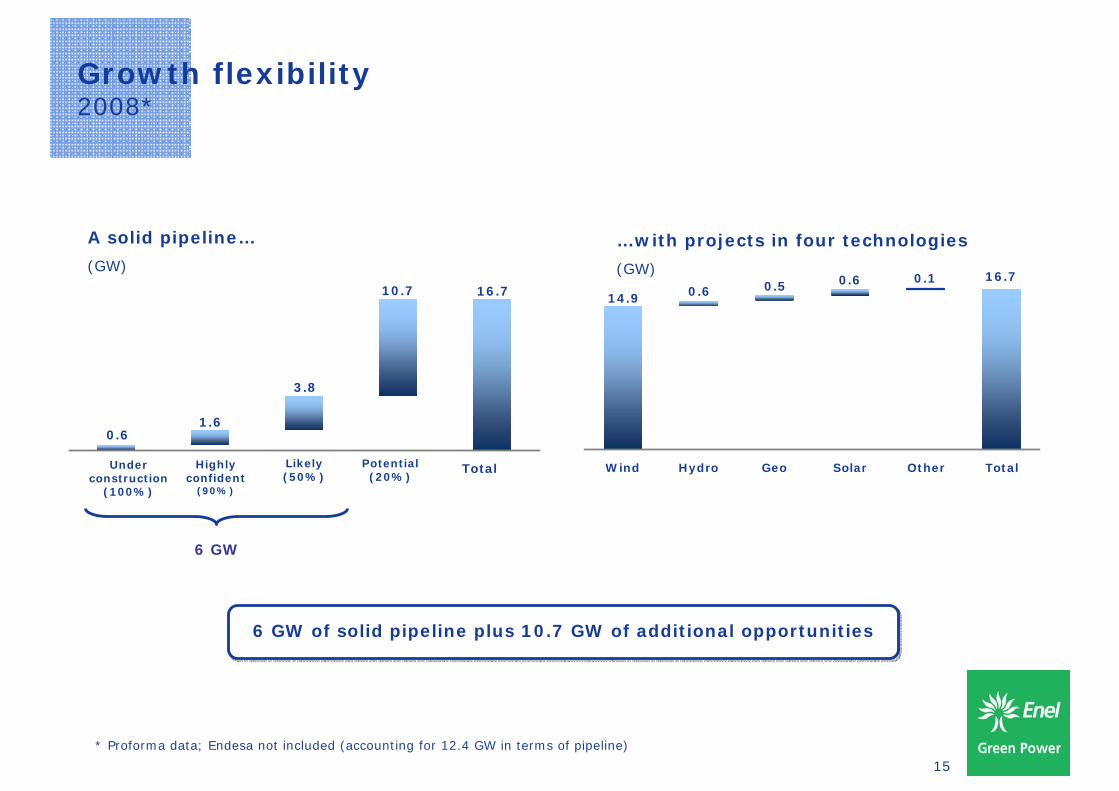
Growth flexibility2008*
0.61.6
3.8
16.710.7
Underconstruction
(100%)
Highly confident(90%)
Likely (50%) Potential (20%) Total
A solid pipeline…
(GW)
6 GW
Highly confident
(90%)
Likely (50%)
Potential (20%)
TotalUnder construction
(100%)
* Proforma data; Endesa not included (accounting for 12.4 GW in terms of pipeline)
…with projects in four technologies
(GW)0.6 16.70.1
0.50.614.9
Wind Hydro Geo Solar Other Total
6 GW of solid pipeline plus 10.7 GW of additional opportunities6 GW of solid pipeline plus 10.7 GW of additional opportunities
16
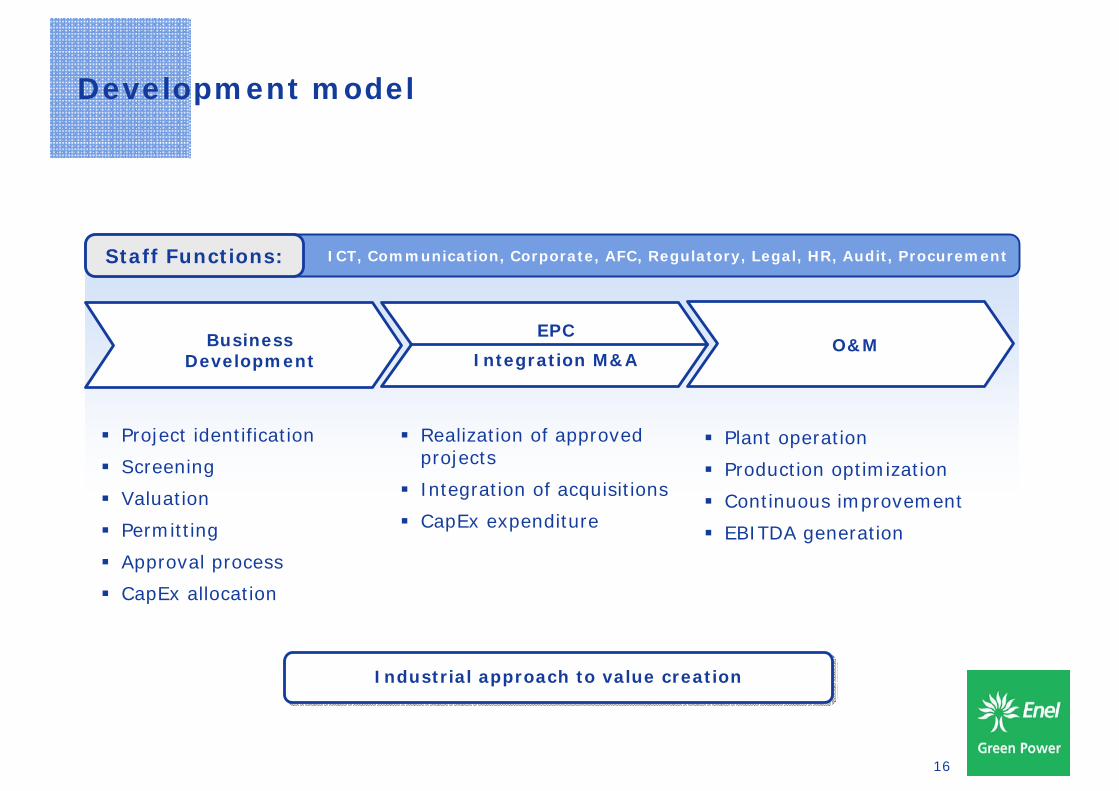
Development model
Project identification
Screening
Valuation
Permitting
Approval process
CapEx allocation
Realization of approved projects
Integration of acquisitions
CapEx expenditure
Plant operation
Production optimization
Continuous improvement
EBITDA generation
ICT, Communication, Corporate, AFC, Regulatory, Legal, HR, Audit, ProcurementStaff Functions:
Business Development
EPC
Integration M&AO&M
Industrial approach to value creationIndustrial approach to value creation
17
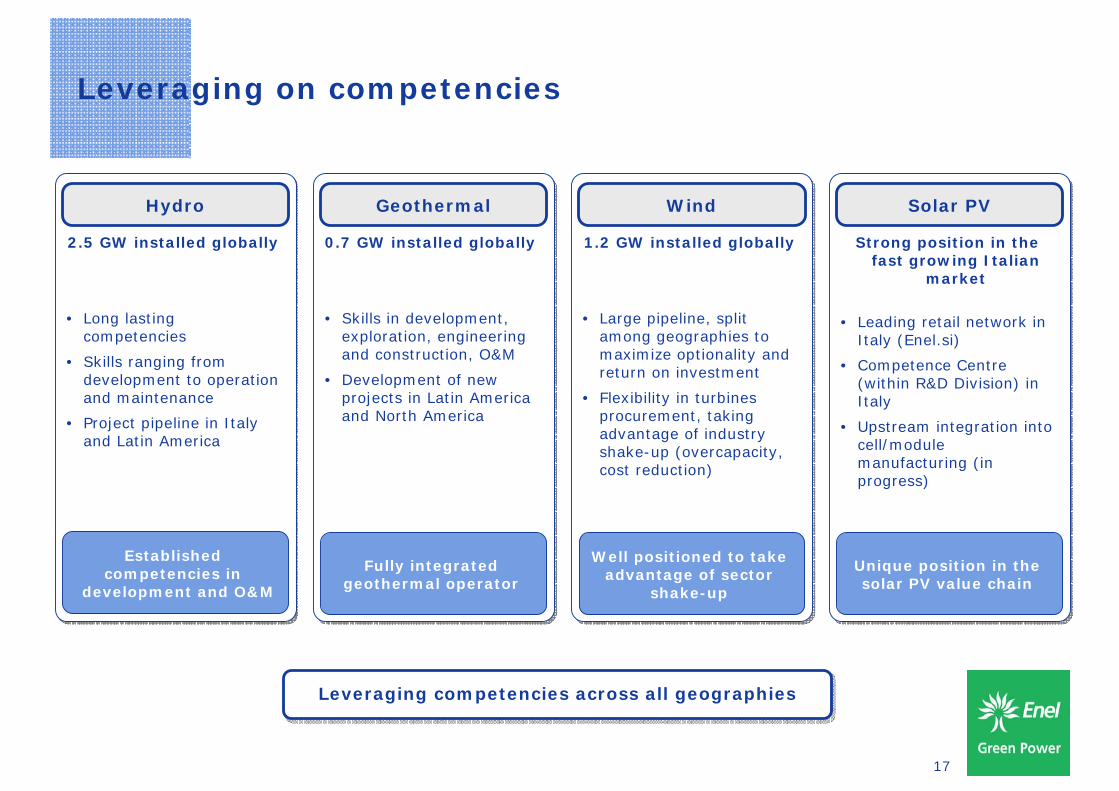
Leveraging on competencies
2.5 GW installed globally
• Long lasting competencies
• Skills ranging from development to operation and maintenance
• Project pipeline in Italy and Latin America
Established competencies in
development and O&M
Hydro
0.7 GW installed globally
• Skills in development, exploration, engineering and construction, O&M
• Development of new projects in Latin America and North America
Fully integrated geothermal operator
Geothermal
Strong position in the fast growing Italian
market
• Leading retail network in Italy (Enel.si)
• Competence Centre (within R&D Division) in Italy
• Upstream integration into cell/module manufacturing (in progress)
Unique position in the solar PV value chain
Solar PV
1.2 GW installed globally
• Large pipeline, split among geographies to maximize optionality and return on investment
• Flexibility in turbines procurement, taking advantage of industry shake-up (overcapacity, cost reduction)
Well positioned to take advantage of sector
shake-up
Wind
Leveraging competencies across all geographiesLeveraging competencies across all geographies
18
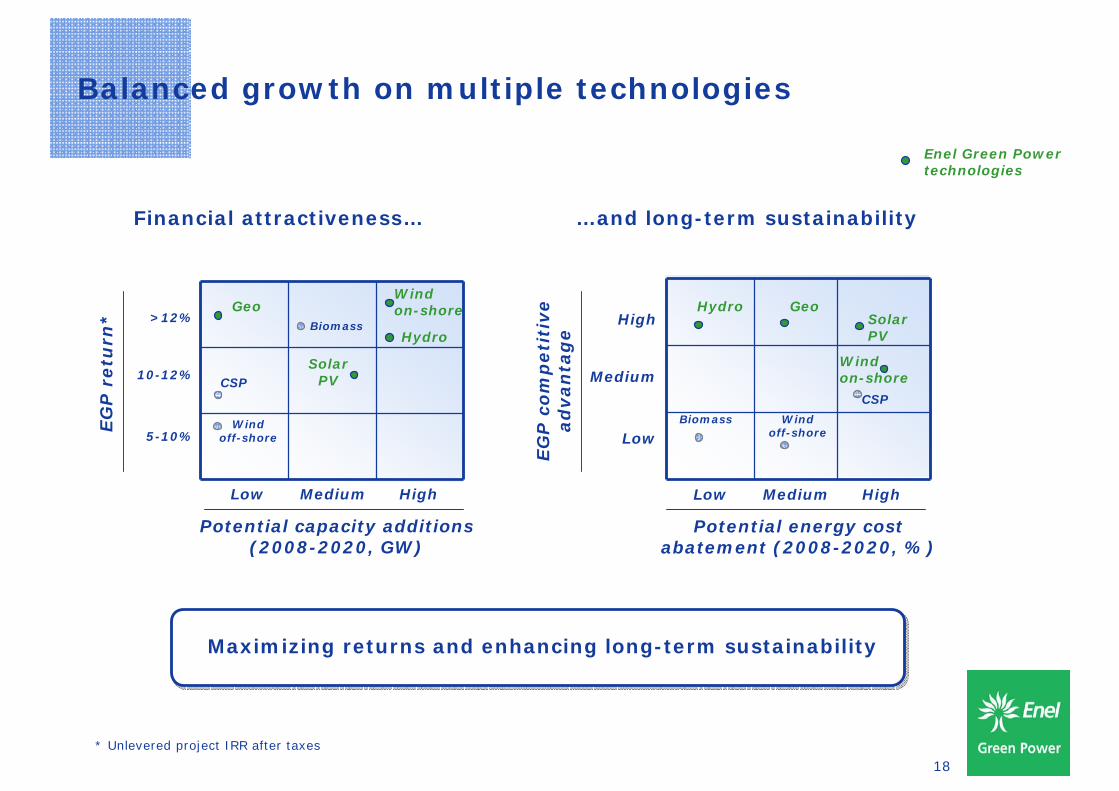
Balanced growth on multiple technologies
High
Medium
Low
EG
P c
om
peti
tive
ad
van
tag
e
Low Medium High
Hydro GeoSolarPV
Biomass Wind off-shore
CSP
Wind on-shore
…and long-term sustainabilityFinancial attractiveness…
Potential energy cost abatement (2008-2020, %)
Potential capacity additions (2008-2020, GW)
>12%
10-12%
5-10%
EG
P r
etu
rn*
Low Medium High
Geo
CSP
Wind off-shore
SolarPV
BiomassHydro
Wind on-shore
Maximizing returns and enhancing long-term sustainability Maximizing returns and enhancing long-term sustainability
Enel Green Power technologies
* Unlevered project IRR after taxes
19
Investor DayRome - April 22nd, 2009
• Opening remarks F. Conti
• Enel Green Power: a leading player in renewable energies F. Starace
• Focus on technologies:
• Geothermal T. Volpe
• Hydro V. Vagliasindi
• Focus on technologies:
• Wind M. Bezzeccheri
• Solar Photovoltaic I. Wilhelm
• Business Development Model R. Deambrogio
• Financial highlights A. De Paoli
• Conclusions F. Starace
20
21
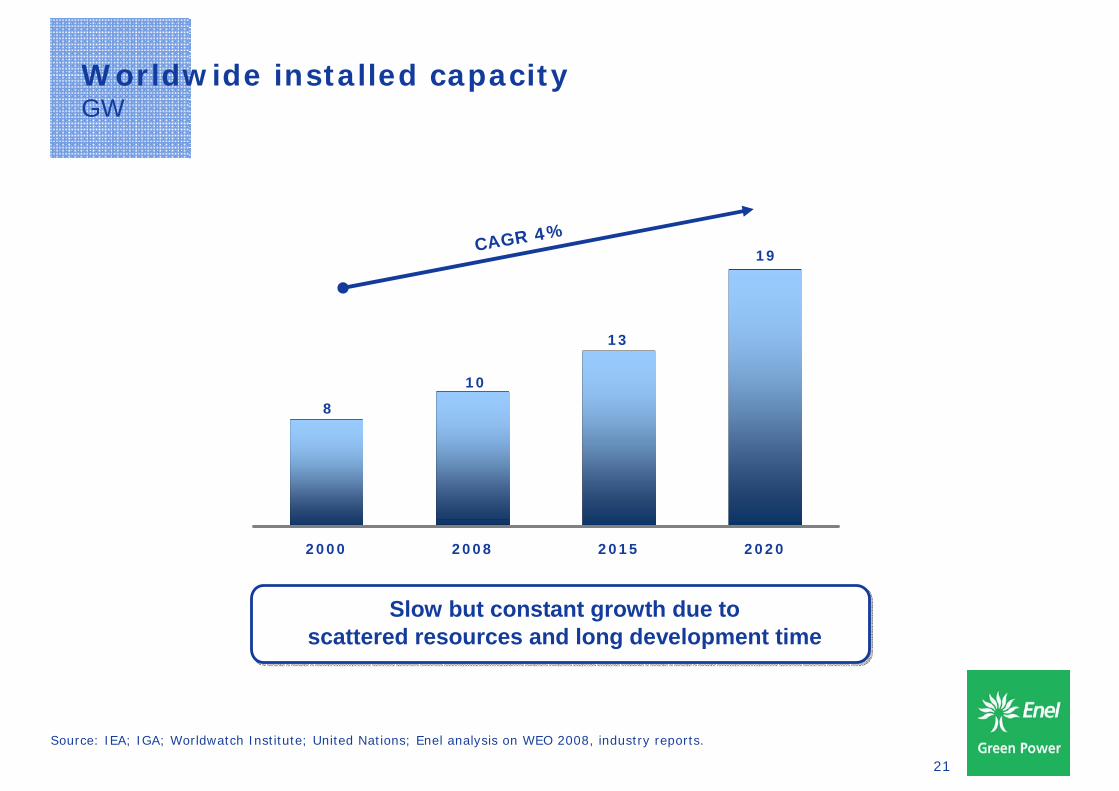
Worldwide installed capacityGW
Source: IEA; IGA; Worldwatch Institute; United Nations; Enel analysis on WEO 2008, industry reports.
Slow but constant growth due to scattered resources and long development time
Slow but constant growth due to scattered resources and long development time
19
10
8
13
2000 2008 2015 2020
CAGR 4%
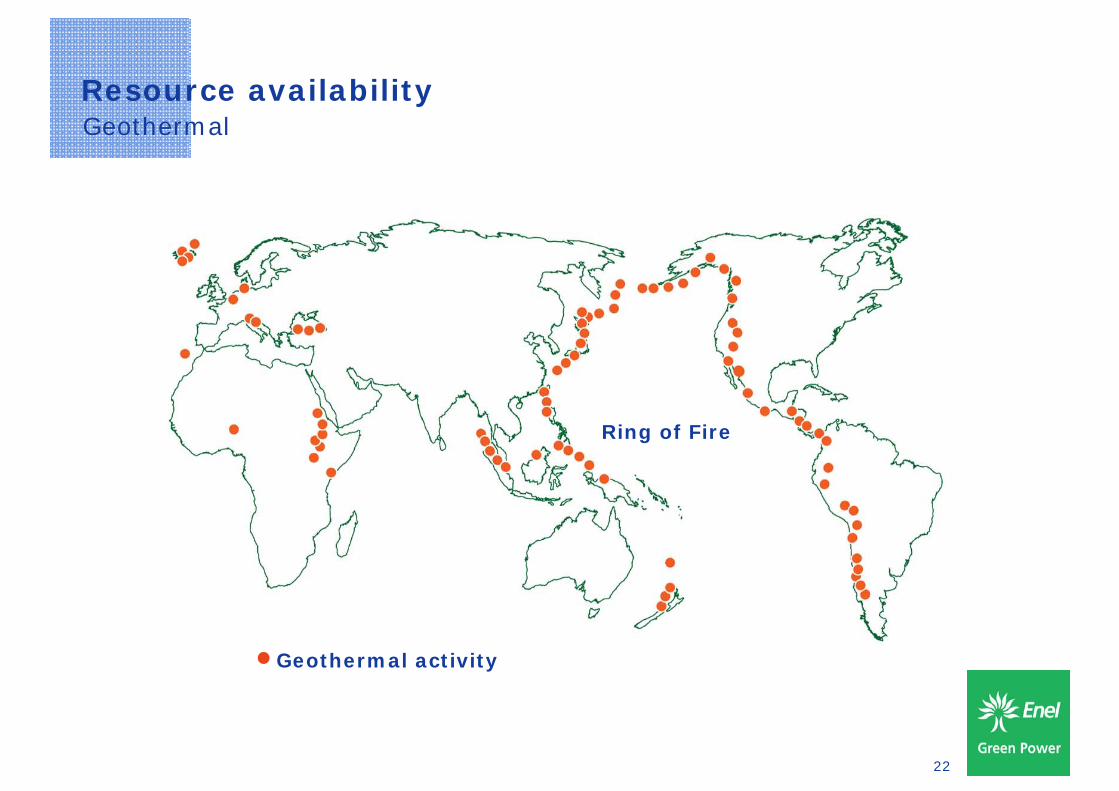
22
Resource availabilityGeothermal
Ring of Fire
Geothermal activity
23
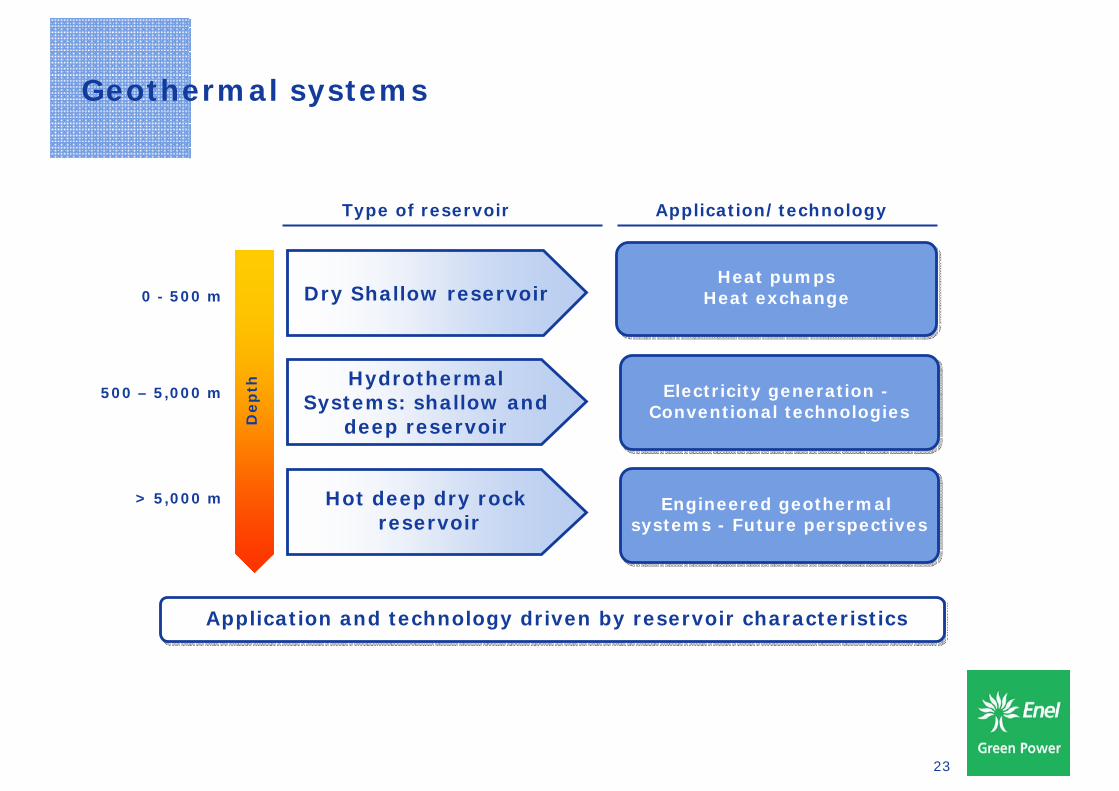
Geothermal systems
0 - 500 m
500 – 5,000 m
> 5,000 m
Application and technology driven by reservoir characteristics Application and technology driven by reservoir characteristics
Dry Shallow reservoir
Hydrothermal Systems: shallow and
deep reservoirDep
th
Type of reservoir Application/technology
Hot deep dry rock reservoir
Heat pumpsHeat exchangeHeat pumps
Heat exchange
Electricity generation -Conventional technologiesElectricity generation -
Conventional technologies
Engineered geothermal systems - Future perspectives
Engineered geothermal systems - Future perspectives
24
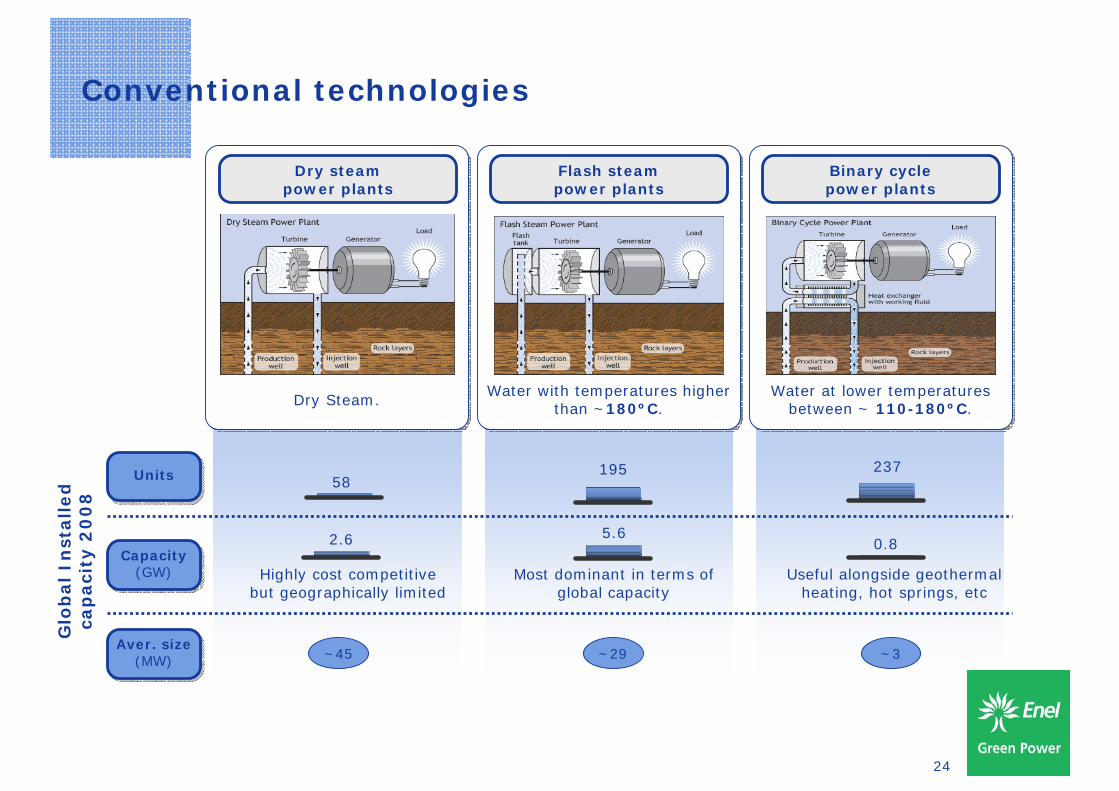
Conventional technologies
58
2.6
237
0.8
Highly cost competitive but geographically limited
Most dominant in terms of global capacity
Useful alongside geothermal heating, hot springs, etc
195
5.6
~45 ~29 ~3
Glo
bal
Inst
all
ed
ca
paci
ty 2
00
8
UnitsUnits
Dry steam power plants
Dry Steam.
Flash steam power plants
Water with temperatures higher than ~180ºC.
Binary cycle power plants
Water at lower temperatures between ~ 110-180ºC.
Capacity(GW)
Capacity(GW)
Aver. size(MW)
Aver. size(MW)
25
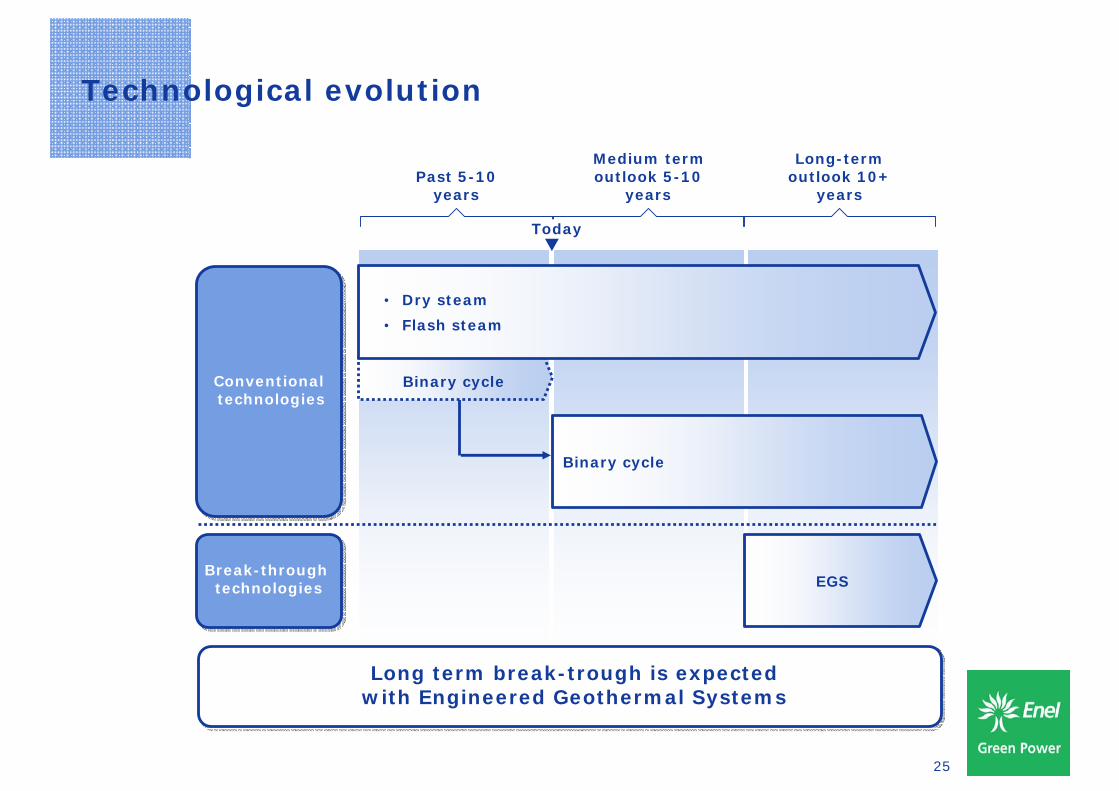
Technological evolution
Past 5-10 years
Medium term outlook 5-10
years
Long-term outlook 10+
years
Binary cycle
EGS
Long term break-trough is expected with Engineered Geothermal SystemsLong term break-trough is expected
with Engineered Geothermal Systems
Today
Conventionaltechnologies
Conventionaltechnologies
Break-through technologies
Break-through technologies
Binary cycle
• Dry steam
• Flash steam
26
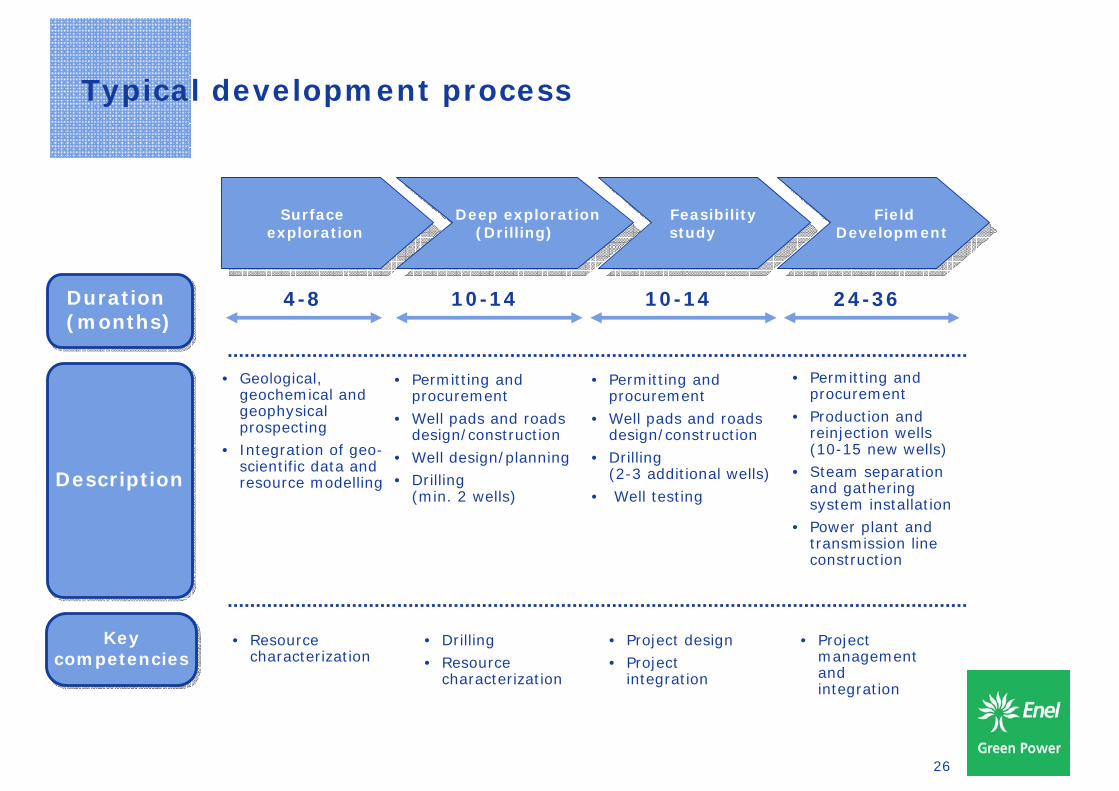
Typical development process
DescriptionDescription
Surface exploration
Surface exploration
Deep exploration(Drilling)
Deep exploration(Drilling)
Feasibility study
Feasibility study
Field Development
Field Development
• Resource characterization
• Drilling• Resource
characterization
• Project design• Project
integration
• Project management and integration
4-8 10-14 10-14 24-36
• Geological, geochemical and geophysical prospecting
• Integration of geo-scientific data and resource modelling
• Permitting and procurement
• Well pads and roads design/construction
• Well design/planning • Drilling
(min. 2 wells)
• Permitting and procurement
• Production and reinjection wells (10-15 new wells)
• Steam separationand gathering system installation
• Power plant and transmission line construction
• Permitting and procurement
• Well pads and roads design/construction
• Drilling (2-3 additional wells)
• Well testing
Duration (months)Duration (months)
Key competencies
Key competencies
27
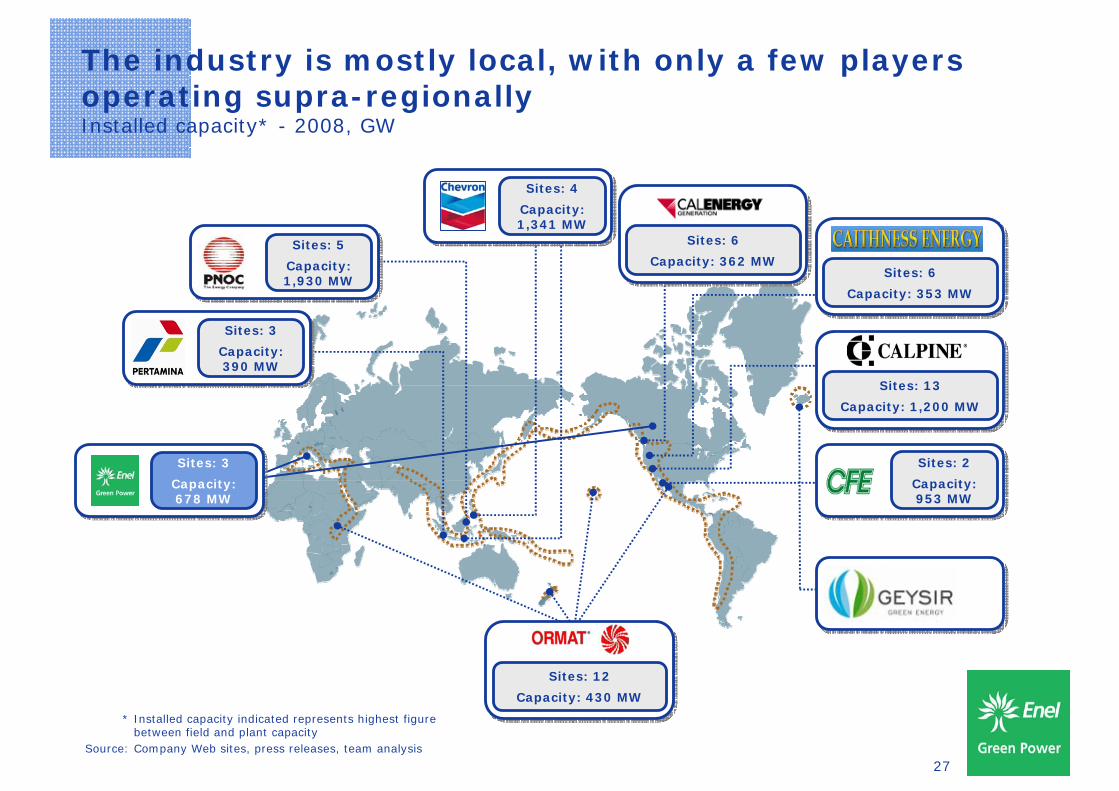
* Installed capacity indicated represents highest figure between field and plant capacity
Source: Company Web sites, press releases, team analysis
Sites: 5
Capacity: 1,930 MW
Sites: 4
Capacity: 1,341 MW
Sites: 6
Capacity: 362 MWSites: 6
Capacity: 353 MW
Sites: 13
Capacity: 1,200 MW
Sites: 2
Capacity: 953 MW
Sites: 12
Capacity: 430 MW
Sites: 3
Capacity: 390 MW
Sites: 3
Capacity: 678 MW
The industry is mostly local, with only a few players operating supra-regionallyInstalled capacity* - 2008, GW
28
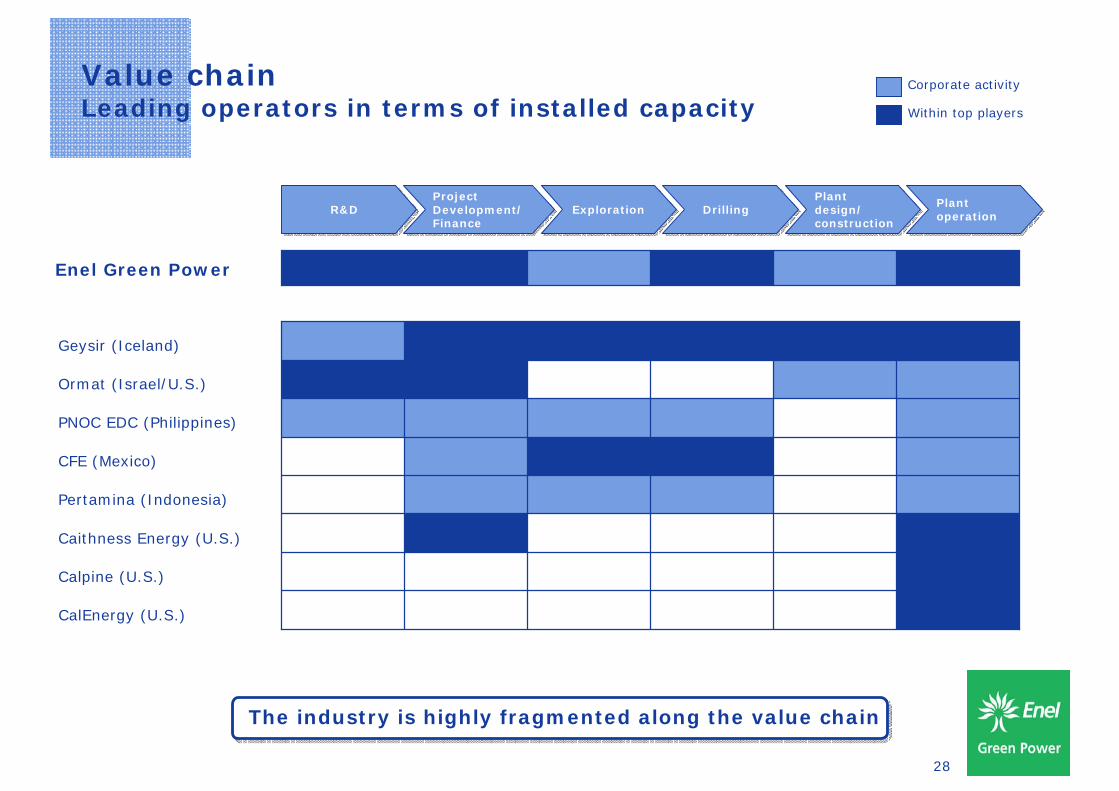
Value chainLeading operators in terms of installed capacity
Corporate activity
Within top players
The industry is highly fragmented along the value chainThe industry is highly fragmented along the value chain
R&DR&DProject Development/Finance
Project Development/Finance
ExplorationExploration DrillingDrillingPlant design/construction
Plant design/construction
PlantoperationPlantoperation
CFE (Mexico)
CalEnergy (U.S.)
PNOC EDC (Philippines)
Caithness Energy (U.S.)
Ormat (Israel/U.S.)
Calpine (U.S.)
Pertamina (Indonesia)
Geysir (Iceland)
Enel Green Power
29
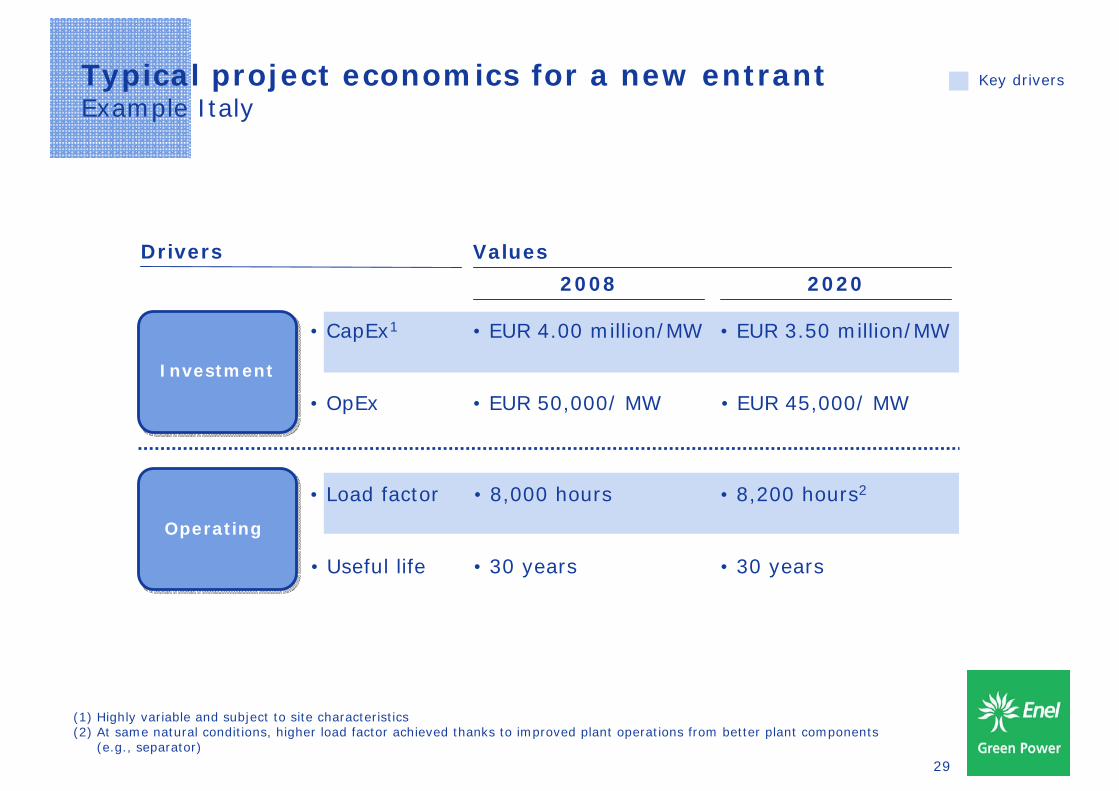
Typical project economics for a new entrantExample Italy
Key drivers
(1) Highly variable and subject to site characteristics(2) At same natural conditions, higher load factor achieved thanks to improved plant operations from better plant components
(e.g., separator)
Drivers
• CapEx1
• Load factor
• OpEx
• Useful life
Values
2008 2020
• EUR 4.00 million/MW • EUR 3.50 million/MW
• 8,000 hours • 8,200 hours2
• EUR 50,000/ MW • EUR 45,000/ MW
• 30 years • 30 years
InvestmentInvestment
OperatingOperating
30
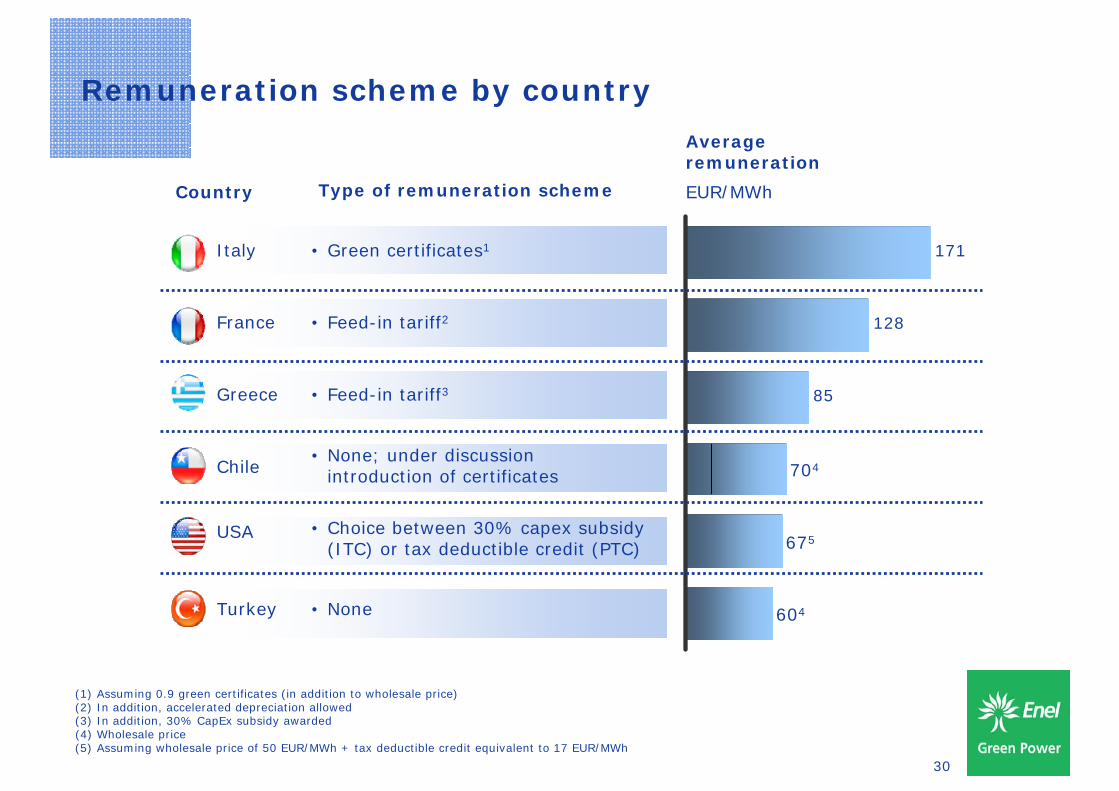
Country
Average remuneration
EUR/MWhType of remuneration scheme
85
128
171
704
675
604
Italy • Green certificates1
Turkey • None
France • Feed-in tariff2
Greece • Feed-in tariff3
(1) Assuming 0.9 green certificates (in addition to wholesale price)(2) In addition, accelerated depreciation allowed(3) In addition, 30% CapEx subsidy awarded(4) Wholesale price(5) Assuming wholesale price of 50 EUR/MWh + tax deductible credit equivalent to 17 EUR/MWh
USA • Choice between 30% capex subsidy (ITC) or tax deductible credit (PTC)
Chile• None; under discussion
introduction of certificates
Remuneration scheme by country
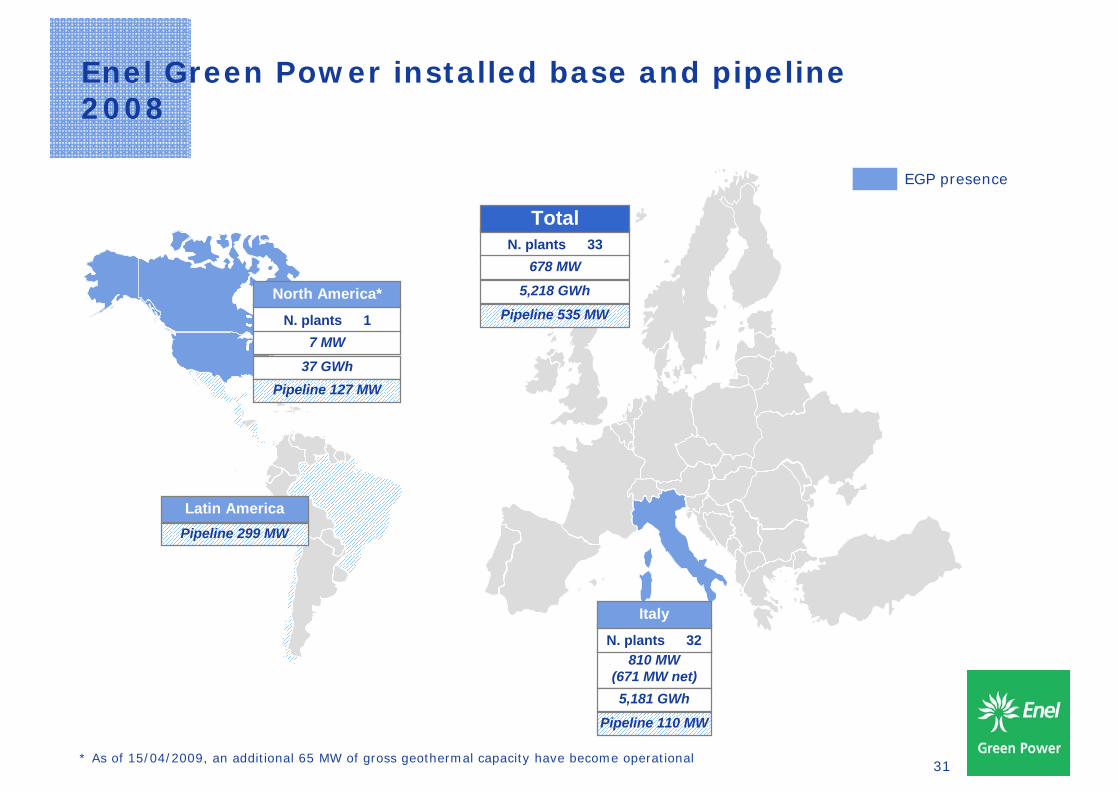
31
810 MW (671 MW net)
Enel Green Power installed base and pipeline2008
EGP presence
N. plants 1
North America*
7 MW
37 GWh
N. plants 32
Italy
5,181 GWh
N. plants 33
Total
678 MW
5,218 GWh
Pipeline 127 MW
Pipeline 110 MW
Pipeline 535 MW
Latin AmericaPipeline 299 MW
* As of 15/04/2009, an additional 65 MW of gross geothermal capacity have become operational
32
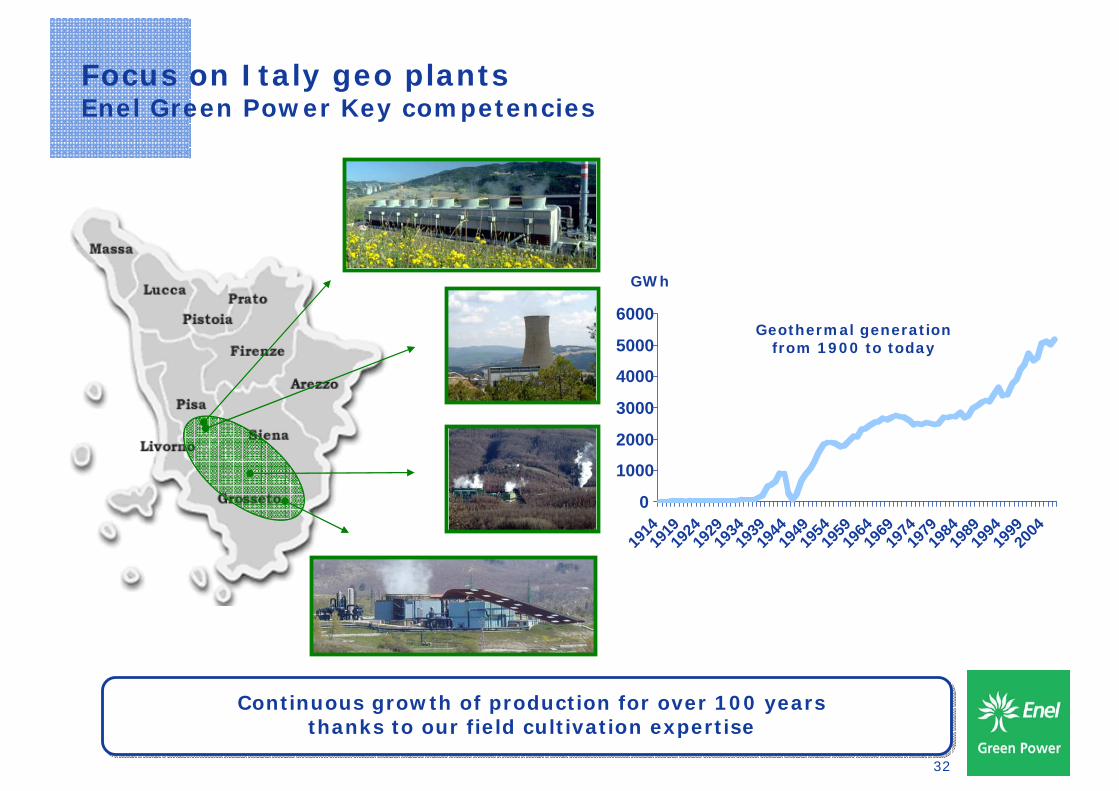
Focus on Italy geo plantsEnel Green Power Key competencies
Continuous growth of production for over 100 years thanks to our field cultivation expertise
Continuous growth of production for over 100 years thanks to our field cultivation expertise
0
1000
2000
3000
4000
5000
6000
1914
1919
1924
1929
1934
1939
1944
1949
1954
1959
1964
1969
1974
1979
1984
1989
1994
1999
2004
Geothermal generation from 1900 to today
GWh
33
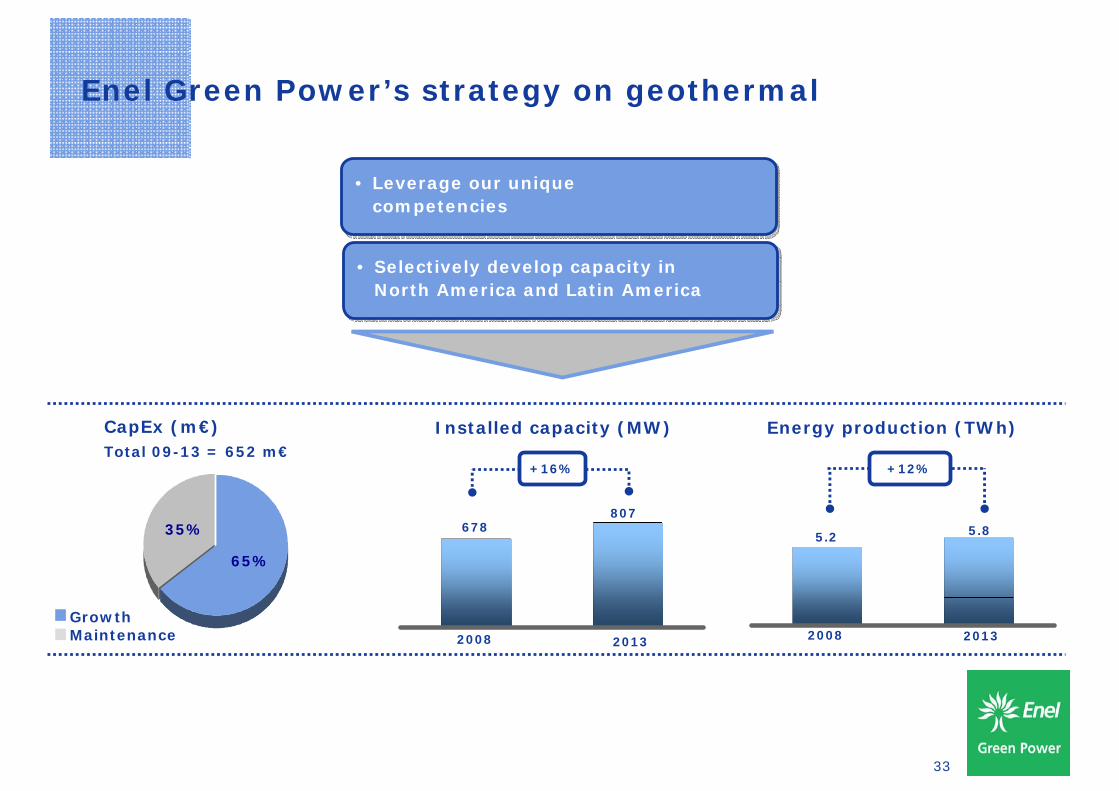
Enel Green Power’s strategy on geothermal
2008 2013
678807
+16%
Installed capacity (MW)
65%
35%
CapEx (m€)
Growth Maintenance
Total 09-13 = 652 m€
• Leverage our unique competencies
• Leverage our unique competencies
• Selectively develop capacity in North America and Latin America
• Selectively develop capacity in North America and Latin America
Energy production (TWh)
2008 2013
5.2 5.8
+12%
34
Investor DayRome - April 22nd, 2009
• Opening remarks F. Conti
• Enel Green Power: a leading player in renewable energies F. Starace
• Focus on technologies:
• Geothermal T. Volpe
• Hydro V. Vagliasindi
• Focus on technologies:
• Wind M. Bezzeccheri
• Solar Photovoltaic I. Wilhelm
• Business Development Model R. Deambrogio
• Financial highlights A. De Paoli
• Conclusions F. Starace
35
Hydroelectric
Vittorio Vagliasindi
Investor Day
Rome - April 22nd, 2009
36
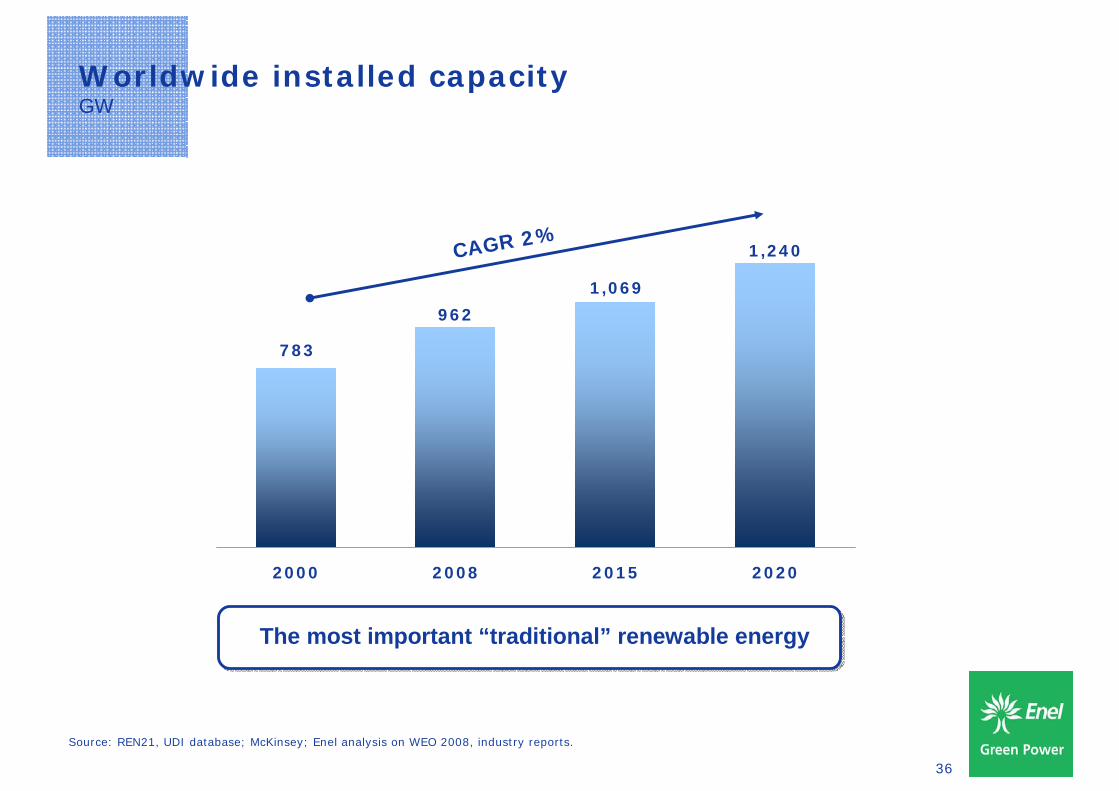
Worldwide installed capacityGW
Source: REN21, UDI database; McKinsey; Enel analysis on WEO 2008, industry reports.
1,240
962
783
1,069
2000 2008 2015 2020
CAGR 2%
The most important “traditional” renewable energy The most important “traditional” renewable energy
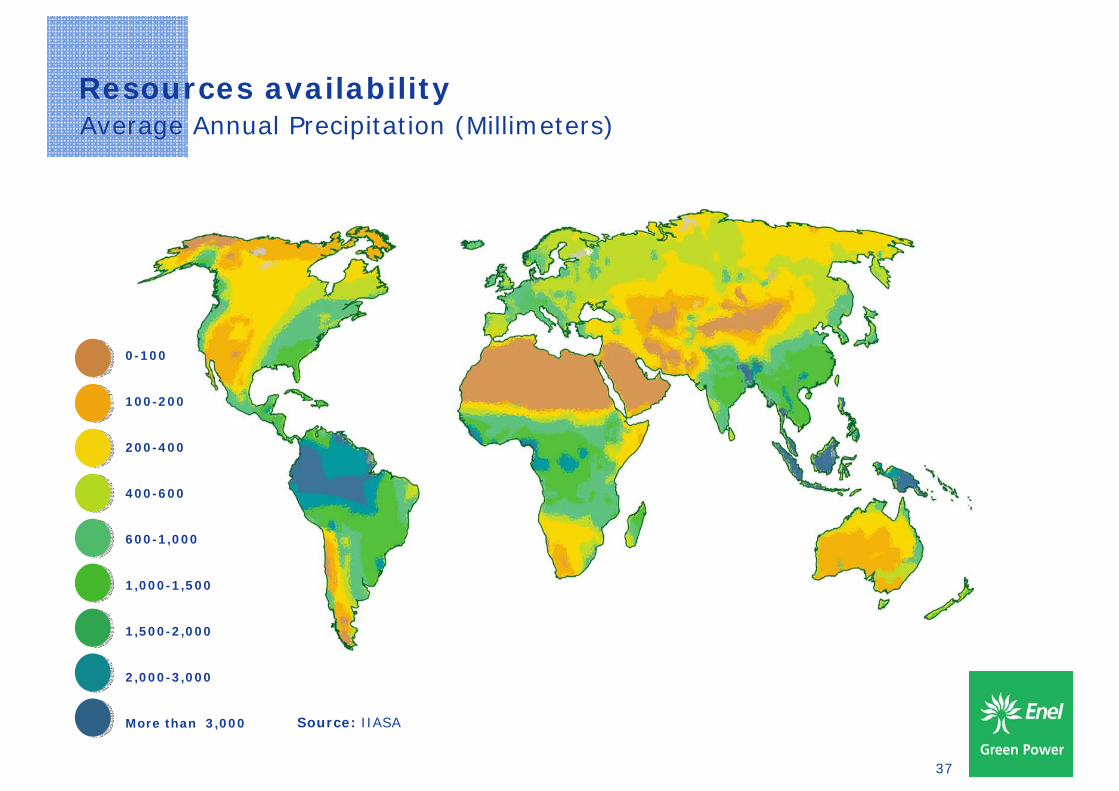
37
Resources availabilityAverage Annual Precipitation (Millimeters)
Source: IIASA
0-100
2,000-3,000
100-200
400-600
1,000-1,500
200-400
600-1,000
1,500-2,000
More than 3,000
38
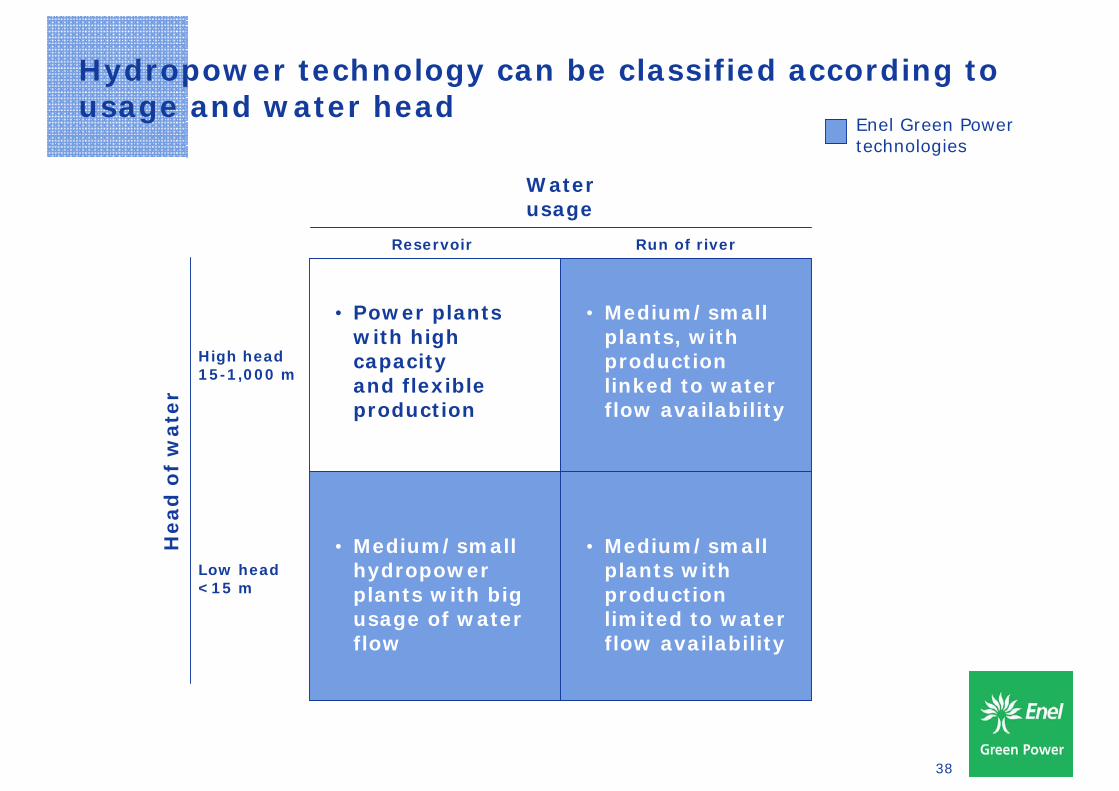
Hydropower technology can be classified according to usage and water head
• Power plants with high capacity and flexible production
• Medium/small plants, with production linked to water flow availability
• Medium/small hydropower plants with big usage of water flow
• Medium/small plants with production limited to water flow availability
Reservoir Run of river
Low head<15 m
High head15-1,000 m
Water usage
Head
of
wate
r
Enel Green Power technologies
39
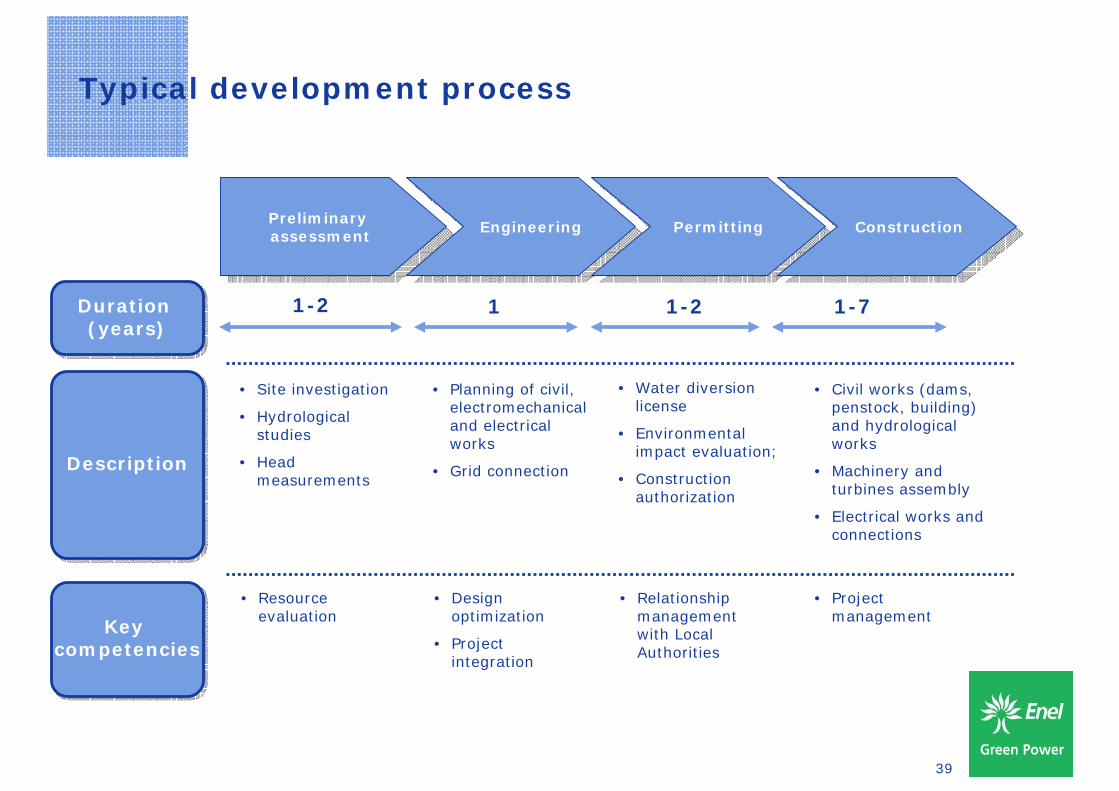
Typical development process
Preliminary assessment
Preliminary assessment EngineeringEngineering PermittingPermitting ConstructionConstruction
• Site investigation
• Hydrological studies
• Head measurements
• Planning of civil, electromechanical and electrical works
• Grid connection
• Water diversion license
• Environmental impact evaluation;
• Construction authorization
• Civil works (dams, penstock, building) and hydrological works
• Machinery and turbines assembly
• Electrical works and connections
• Resource evaluation
• Design optimization
• Project integration
• Relationship management with Local Authorities
• Project management
1-2 1 1-2 1-7
DescriptionDescription
Duration (years)
Duration (years)
Key competencies
Key competencies
40
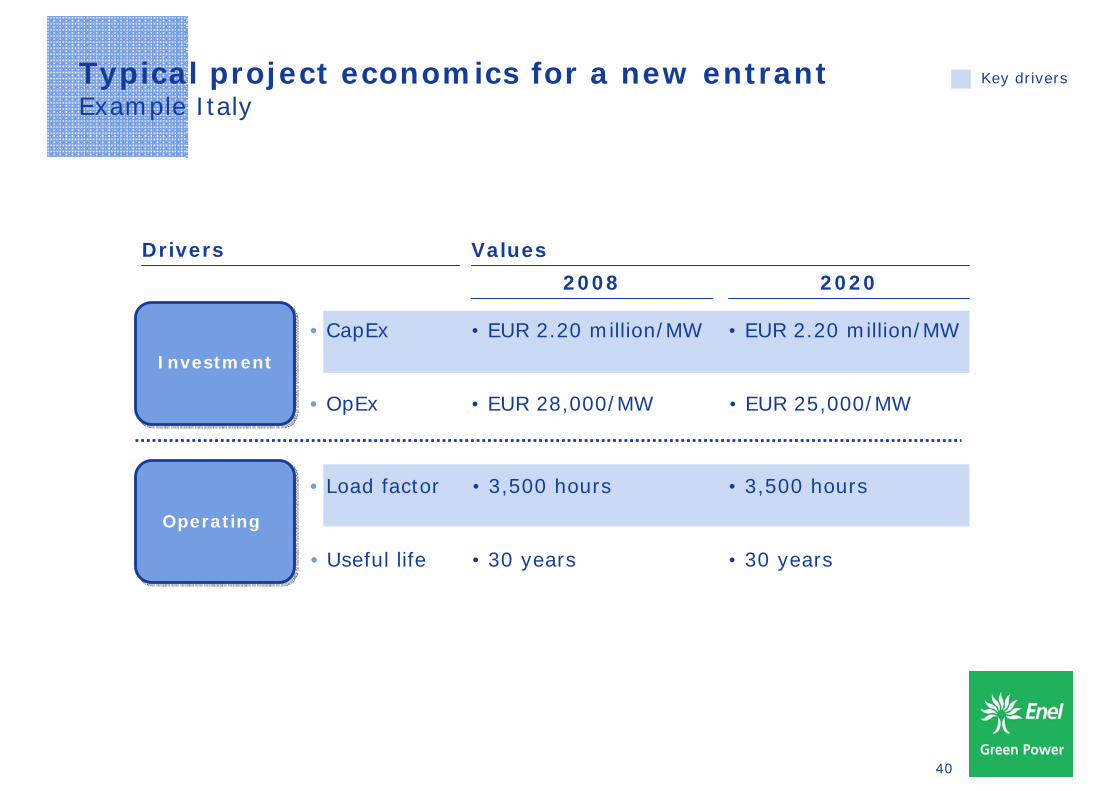
Drivers
• CapEx
• Load factor
• OpEx
• Useful life
Values
2008 2020
• EUR 2.20 million/MW • EUR 2.20 million/MW
• 3,500 hours • 3,500 hours
• EUR 28,000/MW • EUR 25,000/MW
• 30 years • 30 years
InvestmentInvestment
OperatingOperating
Typical project economics for a new entrantExample Italy
Key drivers
41
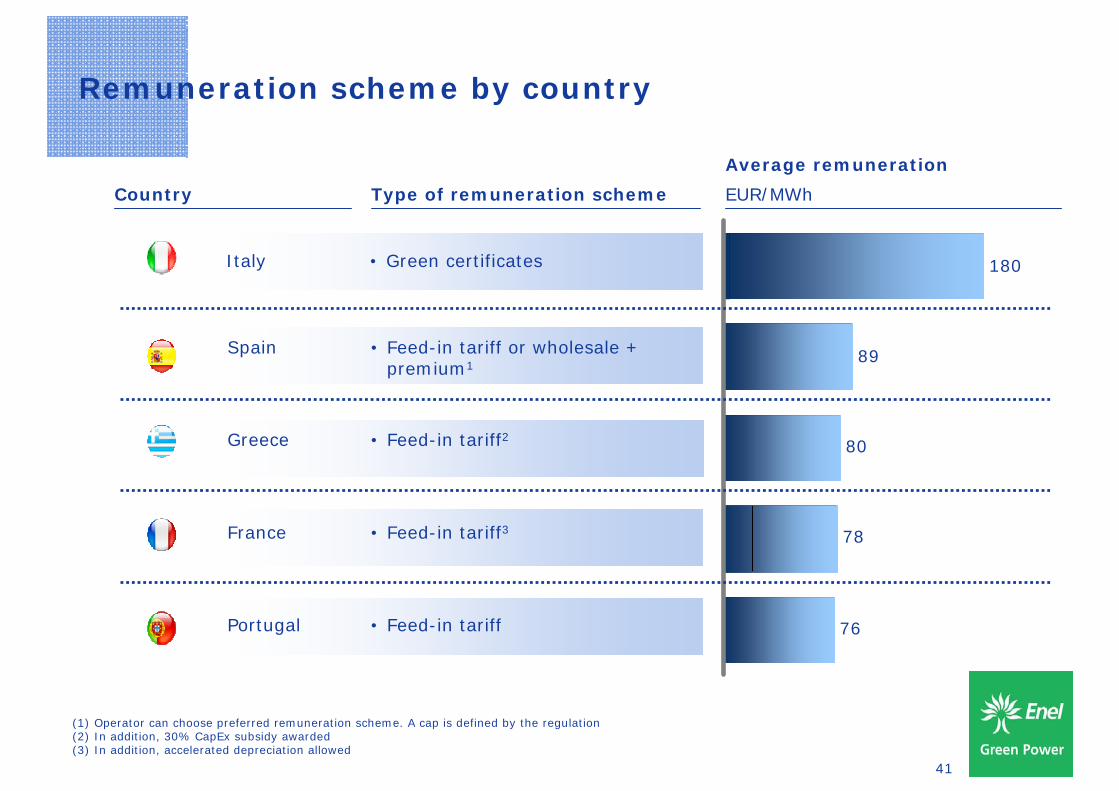
Remuneration scheme by country
Country
Average remuneration
EUR/MWhType of remuneration scheme
76
78
80
89
180Italy • Green certificates
Spain • Feed-in tariff or wholesale + premium1
Portugal • Feed-in tariff
France • Feed-in tariff3
Greece • Feed-in tariff2
(1) Operator can choose preferred remuneration scheme. A cap is defined by the regulation(2) In addition, 30% CapEx subsidy awarded(3) In addition, accelerated depreciation allowed
42
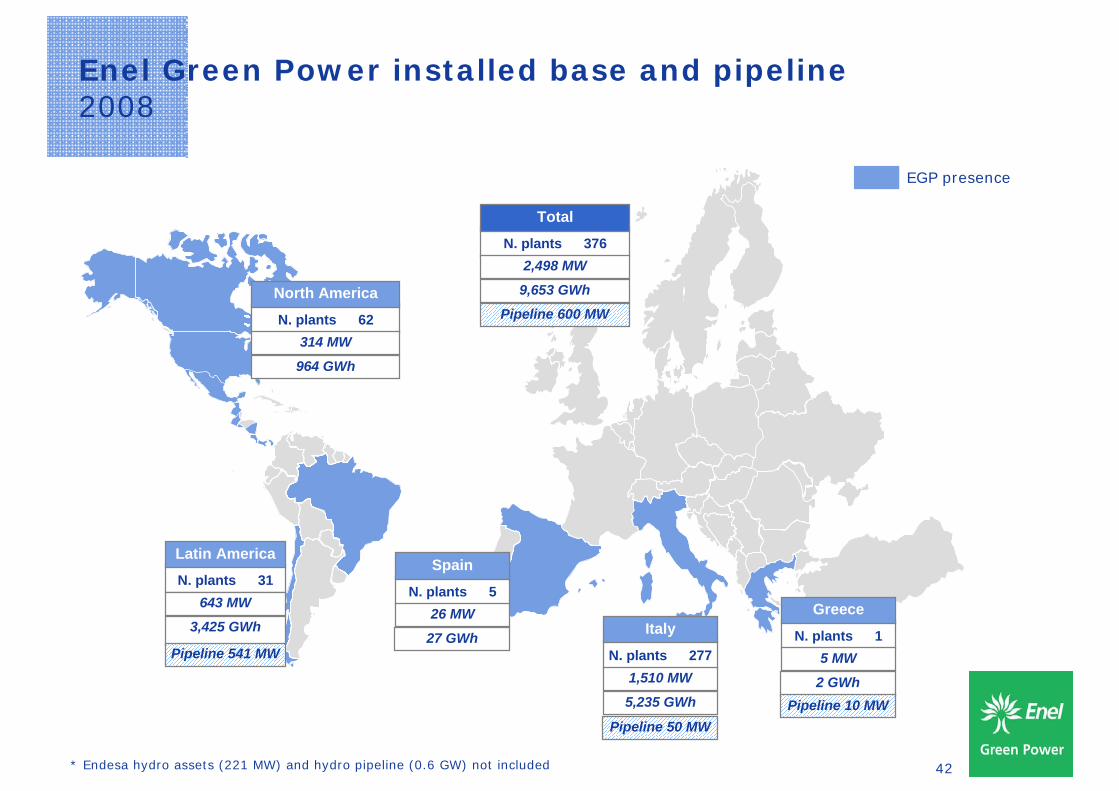
Enel Green Power installed base and pipeline2008
EGP presence
N. plants 62
North America
314 MW
964 GWh
N. plants 31
Latin America
643 MW
3,425 GWh
N. plants 376
Total
2,498 MW
9,653 GWh
N. plants 5
Spain
26 MW
27 GWhN. plants 277
Italy
1,510 MW
5,235 GWh
N. plants 1
Greece
5 MW
2 GWh
Pipeline 600 MW
Pipeline 10 MW
Pipeline 541 MW
Pipeline 50 MW
* Endesa hydro assets (221 MW) and hydro pipeline (0.6 GW) not included
43
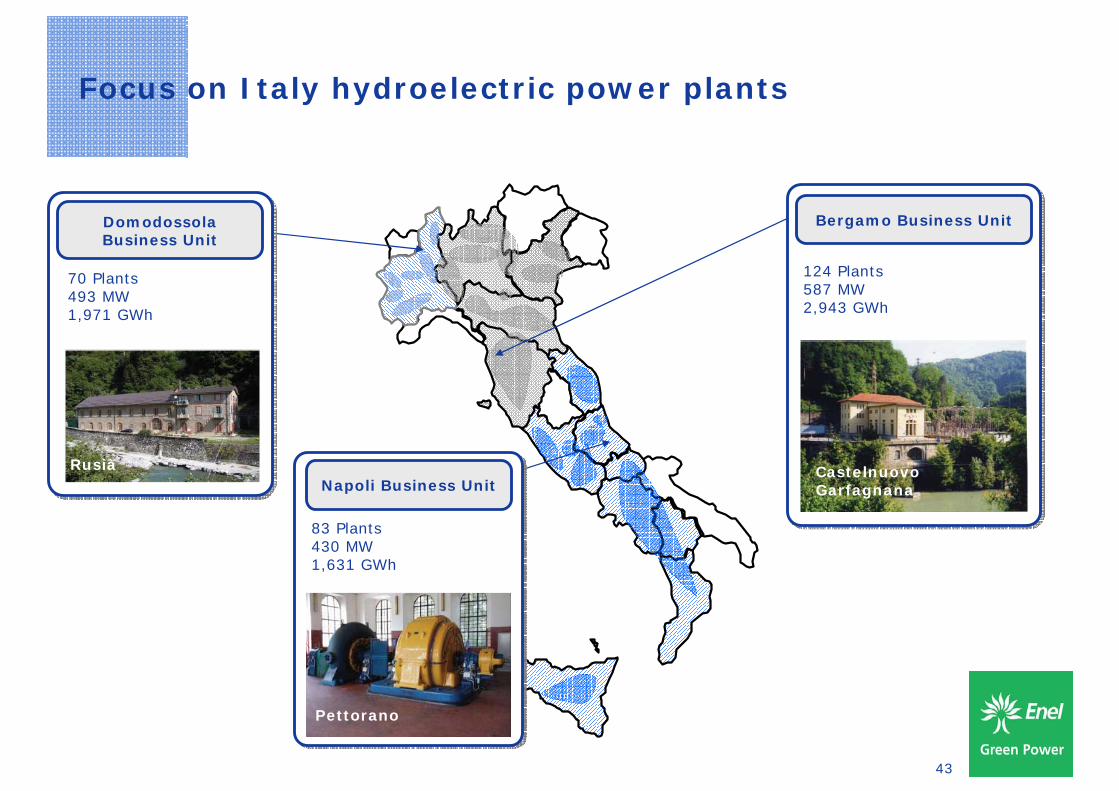
Focus on Italy hydroelectric power plants
70 Plants493 MW1,971 GWh
Domodossola Business Unit
83 Plants430 MW1,631 GWh
Pettorano
Napoli Business Unit
124 Plants587 MW2,943 GWh
Castelnuovo Garfagnana
Bergamo Business Unit
Rusià
44
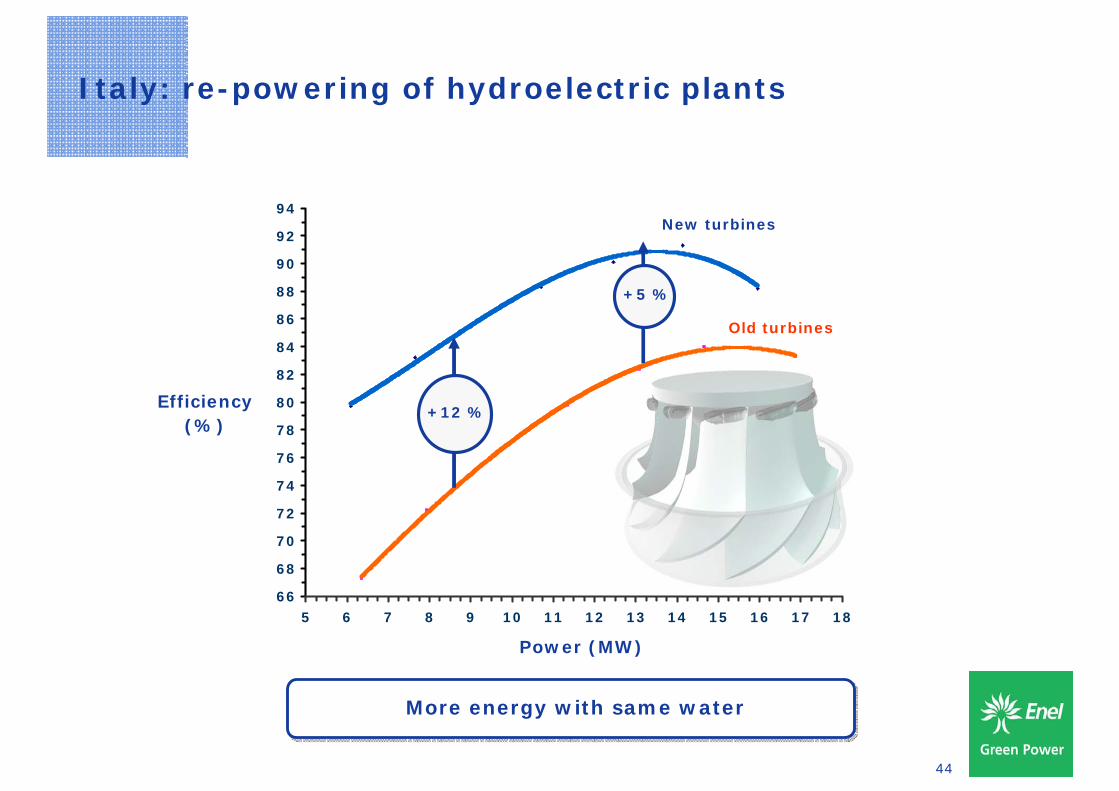
Italy: re-powering of hydroelectric plants
More energy with same waterMore energy with same water
66
68
70
72
74
76
78
80
82
84
86
88
90
92
94
5 6 7 8 9 10 11 12 13 14 15 16 17 18
+12 %Efficiency
(%)
Power (MW)
New turbines
Old turbines
+5 %
45
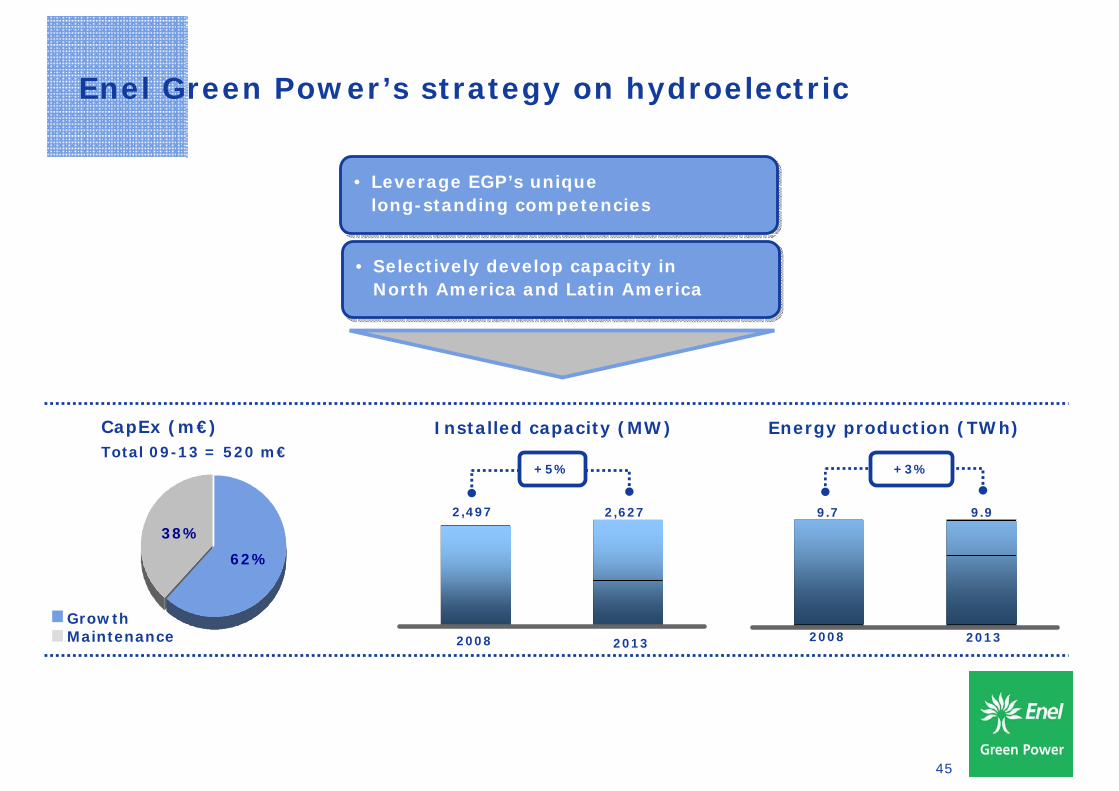
Enel Green Power’s strategy on hydroelectric
2008 2013
2,497 2,627
+5%
Installed capacity (MW)
62%
38%
CapEx (m€)
Growth Maintenance
Total 09-13 = 520 m€
• Leverage EGP’s unique long-standing competencies
• Leverage EGP’s unique long-standing competencies
• Selectively develop capacity in North America and Latin America
• Selectively develop capacity in North America and Latin America
Energy production (TWh)
2008 2013
9.7 9.9
+3%
46
Investor DayRome - April 22nd, 2009
• Opening remarks F. Conti
• Enel Green Power: a leading player in renewable energies F. Starace
• Focus on technologies:
• Geothermal T. Volpe
• Hydro V. Vagliasindi
• Coffee break
• Focus on technologies:
• Wind M. Bezzeccheri
• Solar Photovoltaic I. Wilhelm
• Business Development Model R. Deambrogio
• Financial highlights A. De Paoli
• Conclusions F. Starace
• Lunch (Q&A)
Wind
Maurizio Bezzeccheri
Investor DayRome - April 22nd, 2009
48
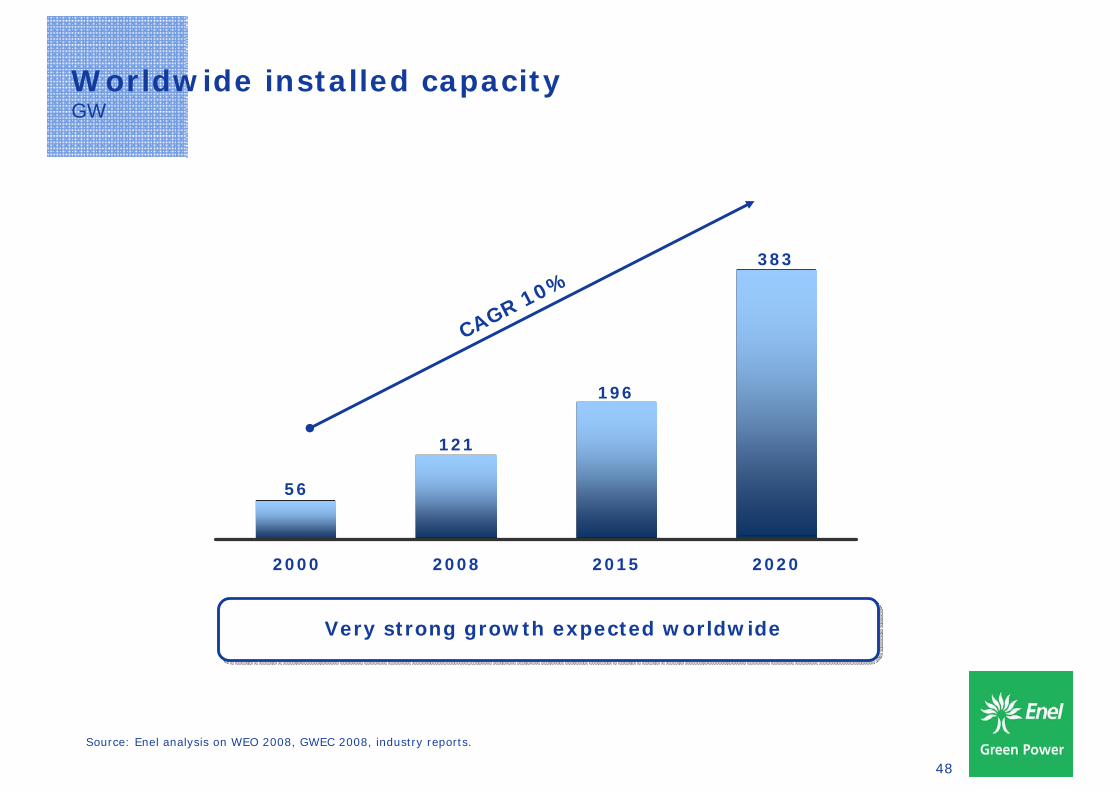
Worldwide installed capacityGW
Source: Enel analysis on WEO 2008, GWEC 2008, industry reports.
56
121
383
196
2000 2008 2015 2020
CAGR 10%
Very strong growth expected worldwide Very strong growth expected worldwide
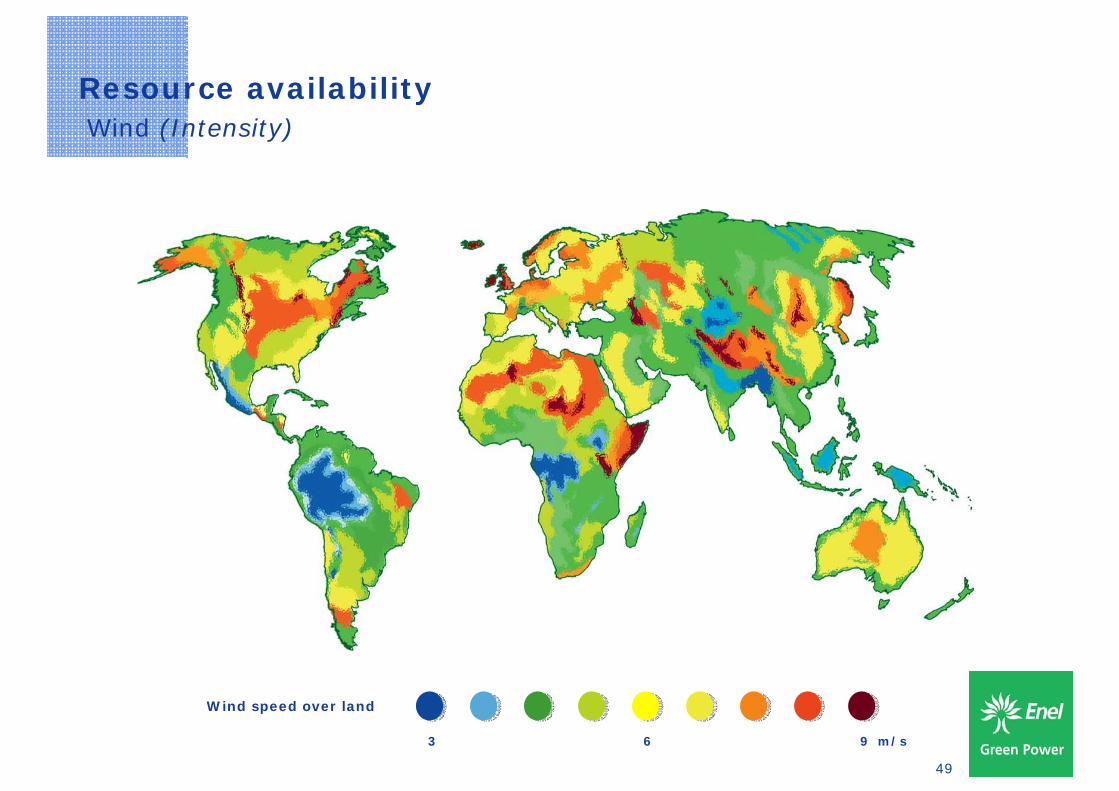
49
Resource availabilityWind (Intensity)
3 6 9 m/s
Wind speed over land
50
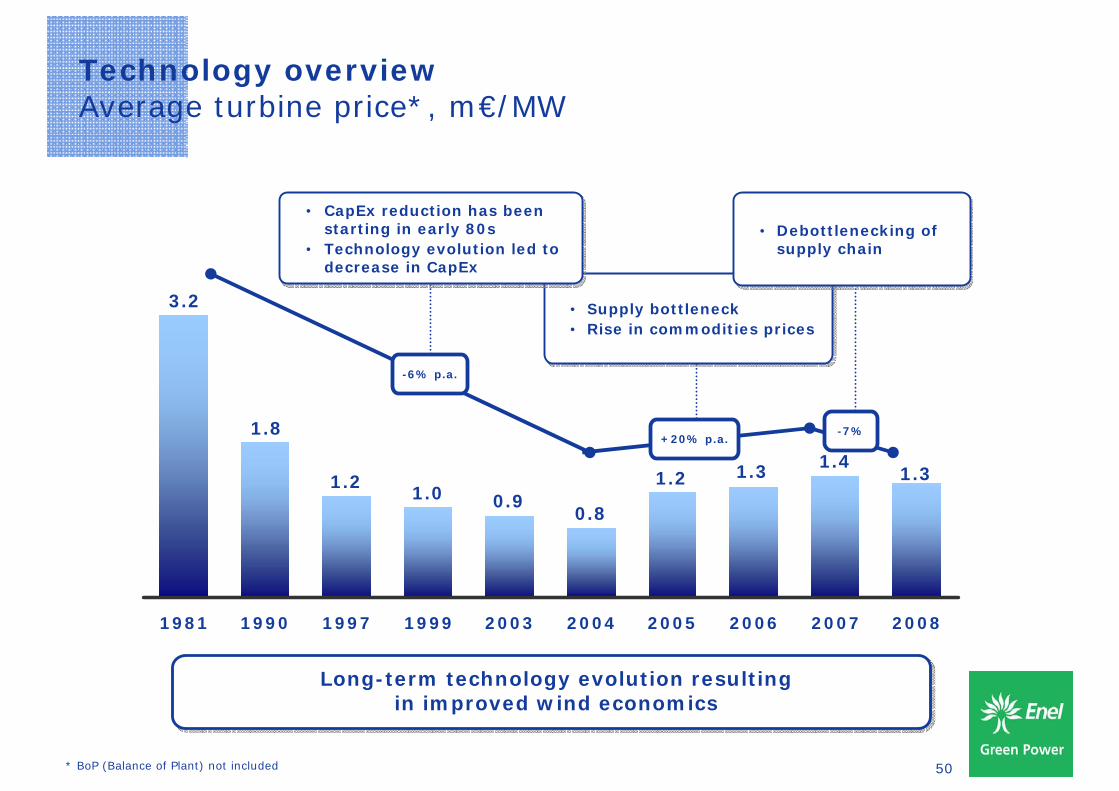
Technology overviewAverage turbine price*, m€/MW
* BoP (Balance of Plant) not included
1.31.41.31.2
0.80.91.0
1.2
1.8
3.2
1981 1990 1997 1999 2003 2004 2005 2006 2007 2008
Long-term technology evolution resulting in improved wind economics
Long-term technology evolution resulting in improved wind economics
-13%+20% p.a.
• Supply bottleneck• Rise in commodities prices• Supply bottleneck• Rise in commodities prices
• Debottlenecking of supply chain
• Debottlenecking of supply chain
• CapEx reduction has been starting in early 80s
• Technology evolution led to decrease in CapEx
• CapEx reduction has been starting in early 80s
• Technology evolution led to decrease in CapEx
-6% p.a.
+20% p.a.-7%
51
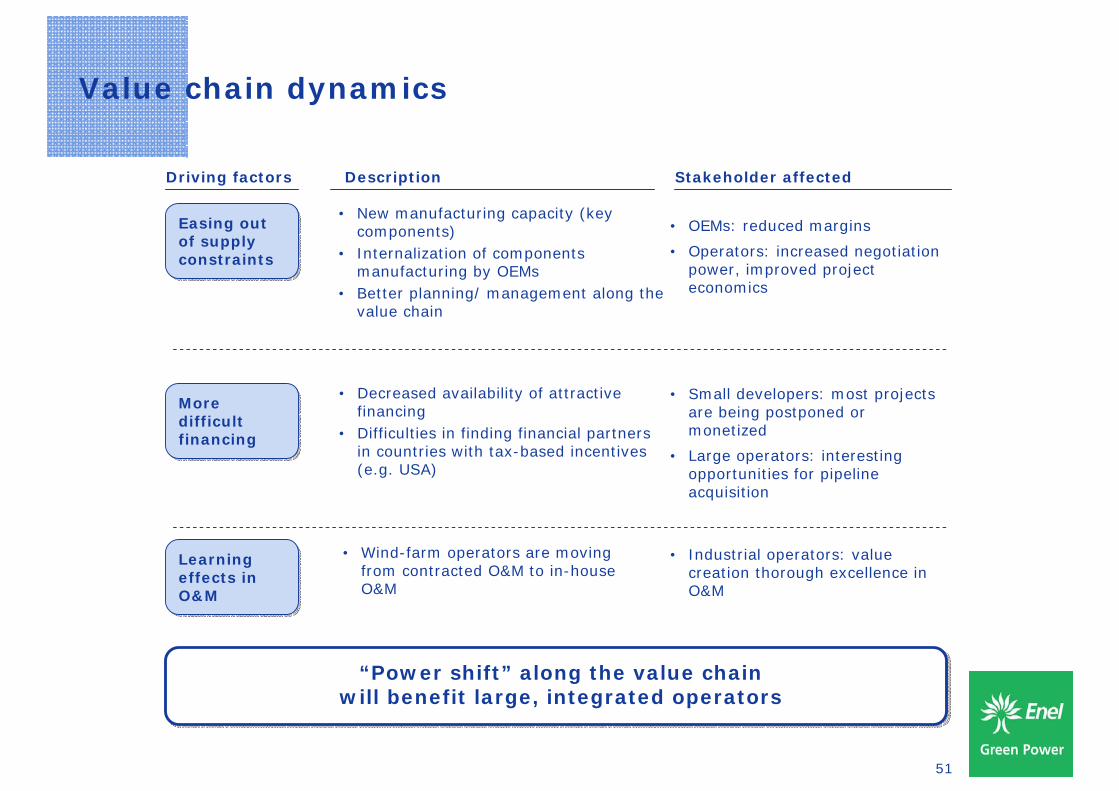
Value chain dynamics
“Power shift” along the value chain will benefit large, integrated operators
“Power shift” along the value chain will benefit large, integrated operators
Driving factors
Easing out of supply constraints
Easing out of supply constraints
More difficult financing
More difficult financing
Learning effects in O&M
Learning effects in O&M
Description
• New manufacturing capacity (key components)
• Internalization of components manufacturing by OEMs
• Better planning/ management along the value chain
• Decreased availability of attractive financing
• Difficulties in finding financial partners in countries with tax-based incentives (e.g. USA)
• Wind-farm operators are moving from contracted O&M to in-house O&M
Stakeholder affected
• OEMs: reduced margins
• Operators: increased negotiation power, improved project economics
• Small developers: most projects are being postponed or monetized
• Large operators: interesting opportunities for pipeline acquisition
• Industrial operators: value creation thorough excellence in O&M
52
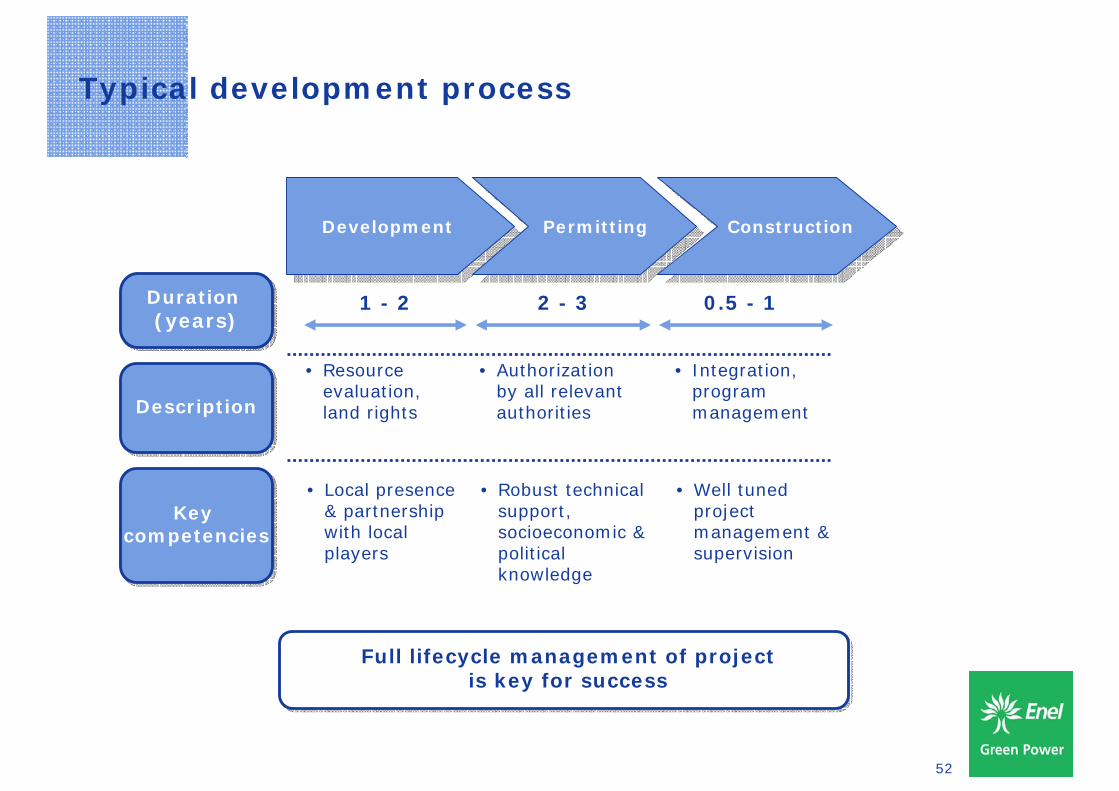
Typical development process
DevelopmentDevelopment PermittingPermitting ConstructionConstruction
• Resource evaluation, land rights
• Authorization by all relevant authorities
• Integration, program management
• Local presence & partnership with local players
• Robust technical support, socioeconomic & political knowledge
• Well tuned project management & supervision
1 - 2
Full lifecycle management of project is key for success
Full lifecycle management of project is key for success
2 - 3 0.5 - 1
DescriptionDescription
Duration (years)
Duration (years)
Key competencies
Key competencies
53
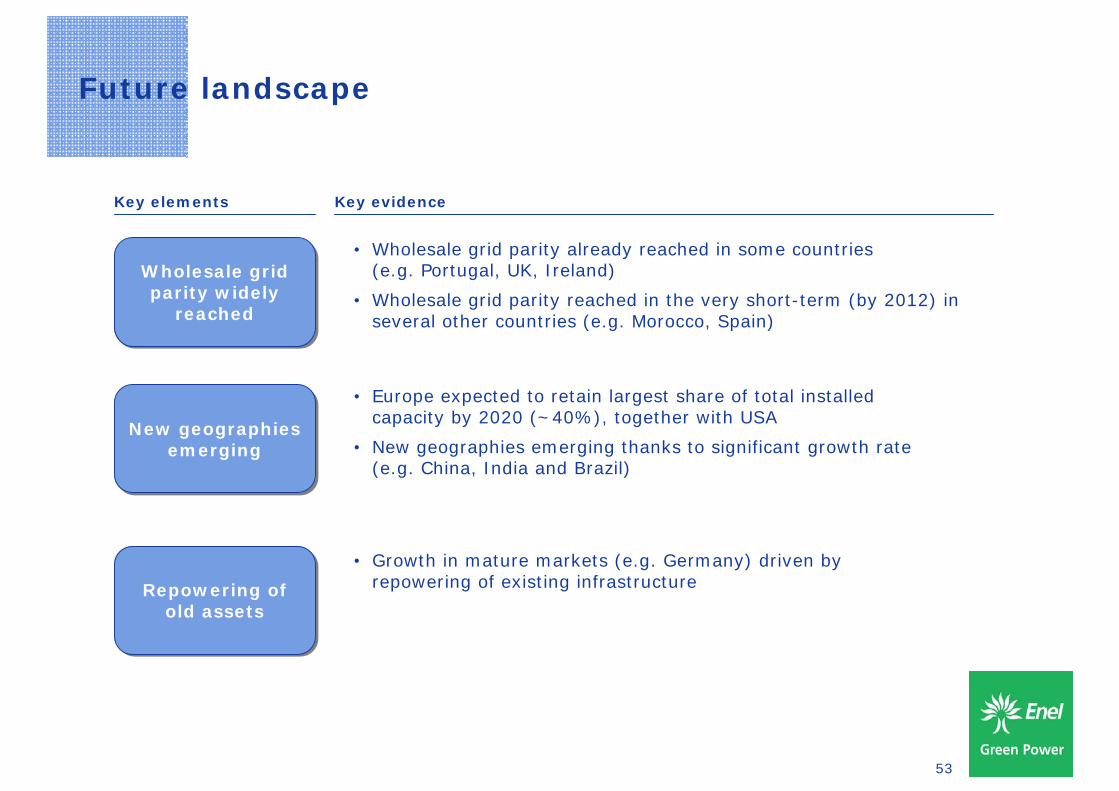
Future landscape
Key elements Key evidence
• Wholesale grid parity already reached in some countries(e.g. Portugal, UK, Ireland)
• Wholesale grid parity reached in the very short-term (by 2012) in several other countries (e.g. Morocco, Spain)
Wholesale grid parity widely
reached
Wholesale grid parity widely
reached
• Europe expected to retain largest share of total installed capacity by 2020 (~40%), together with USA
• New geographies emerging thanks to significant growth rate (e.g. China, India and Brazil)
New geographies emerging
New geographies emerging
• Growth in mature markets (e.g. Germany) driven by repowering of existing infrastructure
Repowering of old assets
Repowering of old assets
54
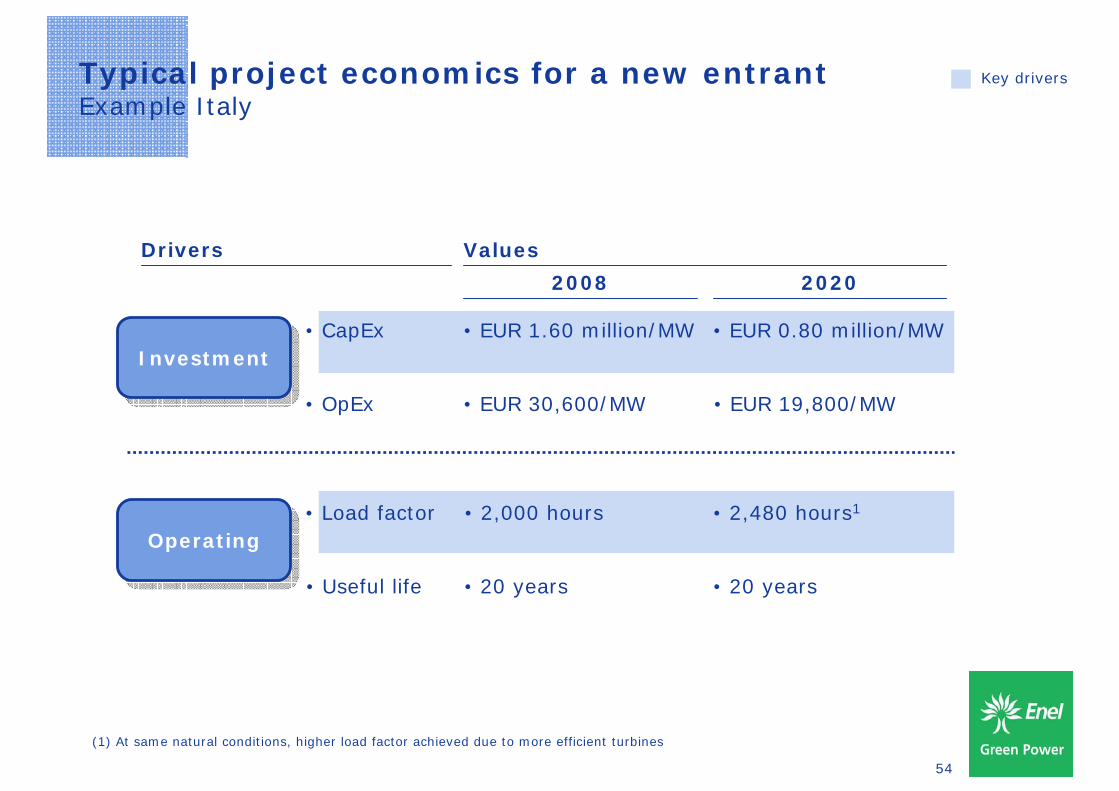
Typical project economics for a new entrantExample Italy
Key drivers
Drivers
• CapEx
Operating Operating • Load factor
InvestmentInvestment
• OpEx
• Useful life
Values
2008 2020
• EUR 1.60 million/MW • EUR 0.80 million/MW
• 2,000 hours • 2,480 hours1
• EUR 30,600/MW • EUR 19,800/MW
• 20 years • 20 years
(1) At same natural conditions, higher load factor achieved due to more efficient turbines
55
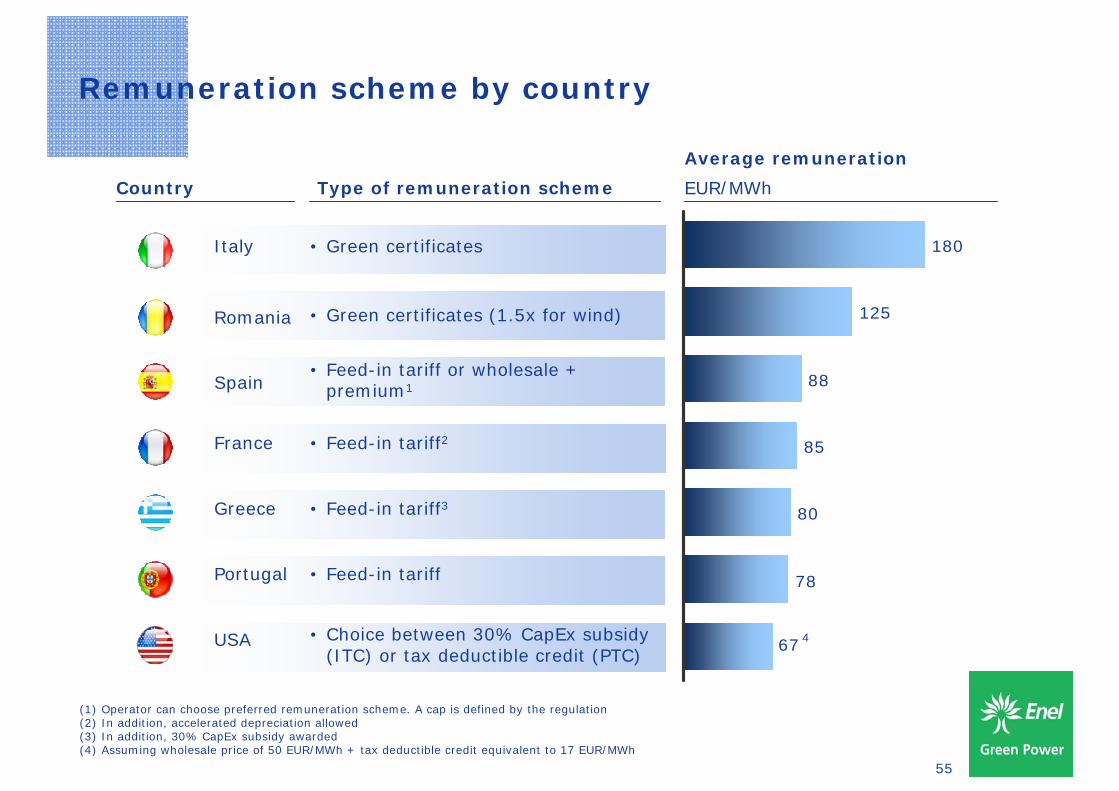
Remuneration scheme by country
• Feed-in tariff or wholesale + premium1
• Feed-in tariff
• Feed-in tariff2
• Feed-in tariff3
• Green certificates (1.5x for wind)
• Choice between 30% CapEx subsidy (ITC) or tax deductible credit (PTC)
Country
Average remuneration
EUR/MWhType of remuneration scheme
67
180
125
88
85
80
78
4
Italy • Green certificates
Spain
Portugal
France
Greece
Romania
(1) Operator can choose preferred remuneration scheme. A cap is defined by the regulation(2) In addition, accelerated depreciation allowed(3) In addition, 30% CapEx subsidy awarded(4) Assuming wholesale price of 50 EUR/MWh + tax deductible credit equivalent to 17 EUR/MWh
USA
56
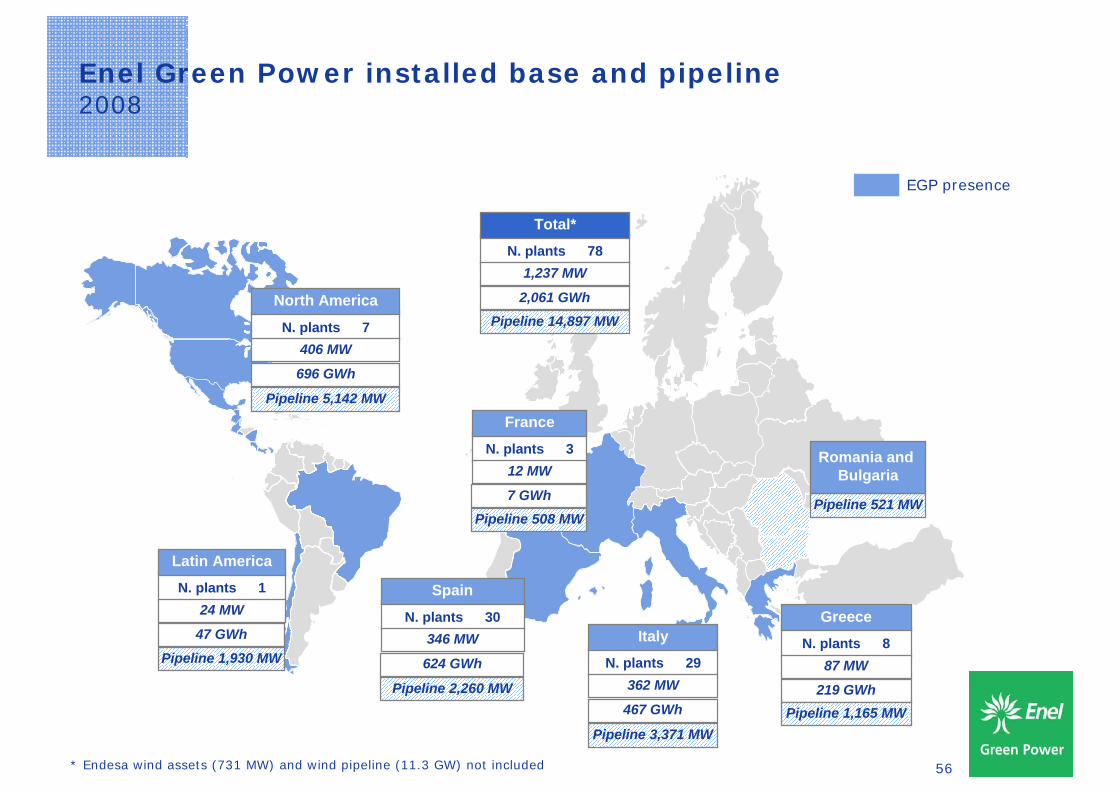
EGP presence
Pipeline 521 MW
Romania and Bulgaria
N. plants 7
North America
406 MW
696 GWh
N. plants 1
Latin America
24 MW
47 GWh
N. plants 78
Total*
1,237 MW
2,061 GWh
N. plants 3
France
12 MW
7 GWh
N. plants 30
Spain
346 MW
624 GWh N. plants 29
Italy
362 MW
467 GWh
N. plants 8
Greece
87 MW
219 GWh
Pipeline 14,897 MW
Pipeline 5,142 MW
Pipeline 1,930 MW
Pipeline 2,260 MW
Pipeline 508 MW
Pipeline 3,371 MWPipeline 1,165 MW
* Endesa wind assets (731 MW) and wind pipeline (11.3 GW) not included
Enel Green Power installed base and pipeline2008
57
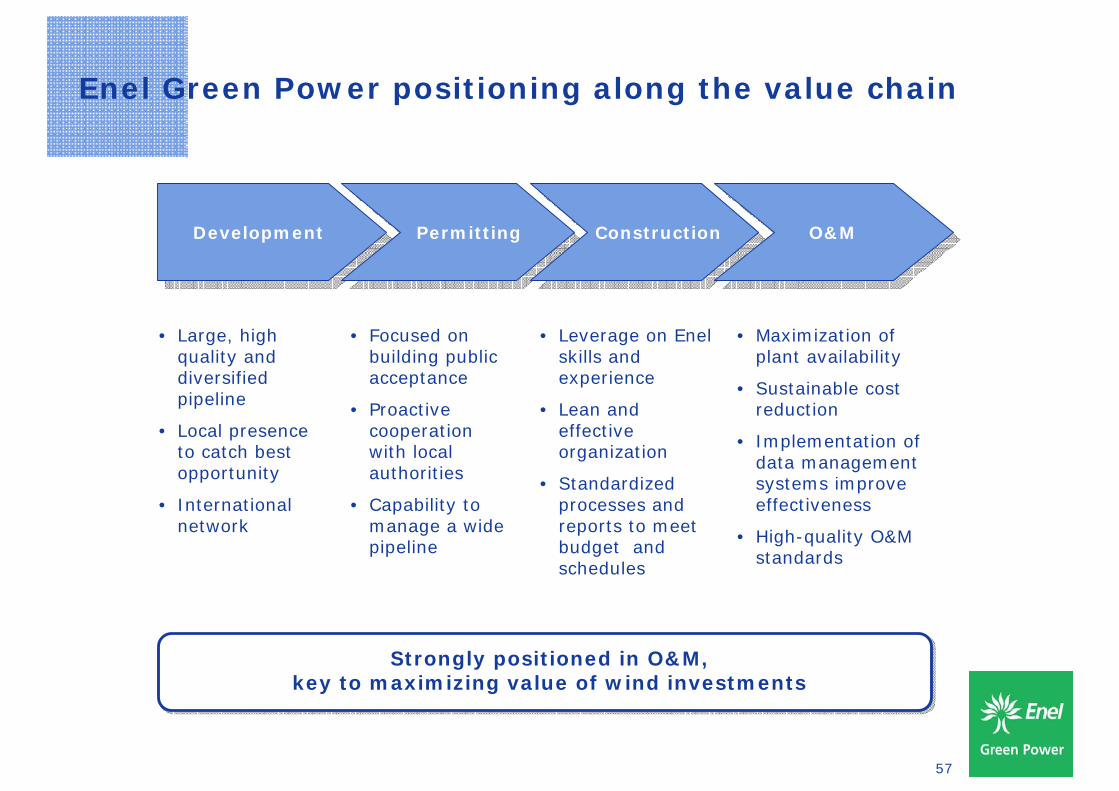
Enel Green Power positioning along the value chain
DevelopmentDevelopment PermittingPermitting ConstructionConstruction O&MO&M
• Large, high quality and diversified pipeline
• Local presence to catch best opportunity
• International network
• Focused on building public acceptance
• Proactive cooperation with local authorities
• Capability to manage a wide pipeline
• Leverage on Enel skills and experience
• Lean and effective organization
• Standardized processes and reports to meet budget and schedules
• Maximization of plant availability
• Sustainable cost reduction
• Implementation of data management systems improve effectiveness
• High-quality O&M standards
Strongly positioned in O&M,key to maximizing value of wind investments
Strongly positioned in O&M,key to maximizing value of wind investments

58
• Data exchanged with different Market/Transport Operators• Systems upgraded to new standards • Centralized database
• Data exchanged with different Market/Transport Operators• Systems upgraded to new standards • Centralized database
Centre of expertise to leverage on technological competencies
• Real time and historical data collection • Supervision and telecontrol• KPI tracking • Fast response to grid events
• Real time and historical data collection • Supervision and telecontrol• KPI tracking • Fast response to grid events
• Hourly updated • Reliability and fast communication.• Improvement of short time forecasting models
• Hourly updated • Reliability and fast communication.• Improvement of short time forecasting models
• Meteorological models• Short time real-data-based models
• Meteorological models• Short time real-data-based models
SCADA (Supervisory Control And Data Acquisition)
TCP/IP METERING (GPRS modem)
TCP/IP METERING (GPRS modem)
TCP/IP METERING (GPRS modem)

59
Enel Green Power’s strategy on wind
Installed capacity (MW)
99%
1%
CapEx (m€)Total 09-13 = 2,194 m€
Energy production (TWh)
• Develop growth options in core markets• Develop growth options in core markets
• Maintain a diversified geographical presence• Maintain a diversified geographical presence
• Capture opportunities in equipment procurement• Capture opportunities in equipment procurement
• Mixed development model• Mixed development model
2008 2013
+124%
1,237
2,773
2.1
6.4
+213%
2008 2013Growth Maintenance

60
Investor DayRome - April 22nd, 2009
• Opening remarks F. Conti
• Enel Green Power: a leading player in renewable energies F. Starace
• Focus on technologies:
• Geothermal T. Volpe
• Hydro V. Vagliasindi
• Focus on technologies:
• Wind M. Bezzeccheri
• Solar Photovoltaic I. Wilhelm
• Business Development Model R. Deambrogio
• Financial highlights A. De Paoli
• Conclusions F. Starace

Ingmar Wilhelm
Solar Photovoltaic
Investor DayRome - April 22nd, 2009

62
The Market: solar energy world-wide
• All major renewable energy sources such as hydro, wind, and obviously photovoltaic power ultimately come from the sun
• Total solar energy absorbed by the Earth is 3,850,000 EJ (exajoules) per year
• Total Wind energy on Earth is 2,250 EJ and total Biomass energy is 3,000 EJ per year
• Total Human Primary Energy use is some 500 EJ per year (of which electricity some 12%)
The map shows average irradiation on Earth.
The black spots represent the space necessary to replace the world’s primary energy supply with solar electricity.
18 TWe equals 568 EJ.
Irradiation
Source: NASA 2008
W/m2
350
0
300
200
100
250
150
50

63
Worldwide installed Photovoltaic CapacityCumulative Power in GW
2000 2008 2015 2020
Source: Enel analysis on WEO 2008, industry reports
• Capacity growth rates of photovoltaic power above 15% per year• In 2008 worldwide capacity increased by over 5,000 MW
• Capacity growth rates of photovoltaic power above 15% per year• In 2008 worldwide capacity increased by over 5,000 MW
1
15
85
210
x15
x15

64
The Market: Europe
• Europe’s installed photovoltaic capacity today is over 9,000 MW• Very high irradiation levels around the Mediterranean basin
• Europe’s installed photovoltaic capacity today is over 9,000 MW• Very high irradiation levels around the Mediterranean basin
Source: EPIA Policy driven Scenario, Enel analysis
2000 2008 2015 2020
0.2
9
45
75
x45
x8Irradiation
1,600-1,750 kWh/m2* year
1,200-1,400
<1,050
1,400-1,600
1,050-1,200

65
The Market: Italy
• In 2008 over 340 MW of new capacity: Italy is among global TOP 5• High irradiation levels in the Southern parts of Italy
• In 2008 over 340 MW of new capacity: Italy is among global TOP 5• High irradiation levels in the Southern parts of Italy
0.4
8
18
0.002
x 200
x 45
Global horizontal irradiation kWh/m2 * year
1,000
1,200
1,400
1,600
1,800
20082000 2015 2020
Irradiation

66
Medium/long term technology evolution
Wave 3 – Solar thermal
Solar PVSolar PV
Solar thermalSolar
thermal
• a-Si thin film evolves as a new competitive large-scale technology• Still large potential for technological evolution
• a-Si thin film evolves as a new competitive large-scale technology• Still large potential for technological evolution
Short term1-5 years
Medium term5-10 years
Long term10+ years
Wave 1 – Crystal Silicon (c-Si)
Wave 2a – Thin film: amorphous Silicon (a-Si)
Cadmium Telluride (CdTe)
Wave 2b – Thin film: Copper, Indium, Gallium,
Selenide (CIGS)nano-technologies

67
Key driver for market growth: grid parity
2008
2015
2020
Australia
Greece
France
Germany
India
ItalyJapan
South Korea
Portugal
SpainCalifornia other
China Southwest US
US
North East
California Tier 5
1,000 1,100 1,200 1,300 1,400 1,500 1,600 1,700 1,800 1,900800 900Annual solarenergy hours
0
0.10
0.15
0.20
0.25
0.30
0.35
0.40
0.45
0.50
0.05
0.55
0.60
0.65
0.70
Average power price for households
EUR/KWh
c-Si cumulative installed capacity in 2020 in GW
Cost to generate power with solar system @ ca.
EUR4.70/Wp
Cost to generate power with solar system @ ca.
EUR4.70/Wp
• Grid parity to be reached in several countries within the next 5 years• Italy will be the first “grid parity” market in Europe
• Grid parity to be reached in several countries within the next 5 years• Italy will be the first “grid parity” market in Europe

68
Enel Green Power positioning along the value chain
Long Term Partnership EGP IPP Projects EGP / Enel.si
•Flexible contracts
•Set of asset-based and commercial long-term supply options under study
•Dedicated development and engineering team
•Specialized engineering team: Construction Project management
•Combined O&M with existing renewables
•Network of PV installers throughout Italy
ManufacturingManufacturing DistributionDistribution DevelopmentDevelopment ConstructionConstruction O&MO&M
Enel.si
•Procurement
•Franchising network with over 450 entrepreneurs
•Over 50 MW of PV installed in past three years
•Building & Production Equipment*
(*) Silicon Crystalline Production Plant
•Land Scouting
•Due diligence
•Conceptual design
•Supplying of photovoltaic components
•Final design
•Modules, inverters, BOS integration
•Plant certification
•Plant visual inspection
•PV testing
•PV field measurement
EGPEGP
Major contentMajor
content
ActivityActivity

69
Typical development process: 9-12 months
• Solar energy potential
• Cost (purchase/ rental)
• Feasibility study on production potential and costs (material, BOS, grid, etc.)
• Conceptual design
• Administrative procedures (building statement, grid connection, leases, etc.)
• Approval design
• Data base local regulations
• Relationship
• Screening capabilities
• Valuation
• Due diligence capabilities
• Business modeling
• Regulatory expertise
• Permitting & authorization
• Project Management and design capabilities
• Design tools (CAD)
Land ScoutingLand Scouting Due diligence
Due diligence
Permitting Authorization
Permitting Authorization
Project Finance
Project Finance
Project Engineering
Project Engineering
• Project presentation
• Discussion with banks
• Network with credit institutes
1 1 6-911 - 2
DescriptionDescription
Duration (months)Duration (months)
Key competencies
Key competencies

70
Typical project economics for a new entrantExample Italy
Key drivers
(1) Average of thin film technologies. Efficiency around 9%.(2) 10 MW power plant (insurance not included)
Drivers
• CapEx1
• Load factor
• OpEx2
• Useful life
• Productivity decay
Values
2008 2020
• EUR 4.30 million/MW • EUR 1.60 million/MW
• 1,250 hours • 1,250 hours
• EUR 40,000/MW • EUR 35,000/MW
• 20 years • 20 years
• 0.5%/year • 0.5%/year
InvestmentInvestment
OperatingOperating

71
Remuneration scheme by country
Country Average remuneration2008, EUR/MWhType of remuneration scheme
Italy • Feed-in tariff2
Spain • Feed-in tariff or wholesale + premium5
Portugal • Feed-in tariff1
Greece • Feed-in tariff4
(1) Assuming 310 EUR/MWh for ground installation and 650 for plants smaller than 3.68 kWp(2) Assuming 360 EUR/MWh for ground installation + ~90 EUR/MWh for energy sale into the market and max 490 for BIPV(3) Assuming 320 EUR/MWh for ground installation and 570 EUR/MWh for BIPV(4) Assuming 403 EUR/MWh for ground installation on mainland and 503 EUR/MWh for small plant on islands. In addition, 30% CapEx subsidy
can be awarded(5) Assuming 320 EUR/MWh for ground installation and 340 for roof top installations
France • Feed-in tariff 3
320
407
320
450
310 650
590
503
570
340
Large Scale
BIPV/Small scale

72
Codrongianos
Montalto di Castro
Enel Green Power’s solar pipeline development
• Very high irradiation
• Positive policy scenario
• Diversification into CSP
Carpio de Tajo
Guijo de Coria
• High irradiation in Southern Italy
• Positive policy scenario
• Cost competitive projects at existing Enel sites
• Projects with fast authorization process
IberiaPipeline 325 MW
Nazzano
Palazzo
Cerano
Serre P.
Priolo Gargallo
N. plants 4
Italy
4 MWPipeline 267 MW
N. plants 4
Total
4 MWPipeline 592 MW
Adrano
Selected investment opportunities
900
1,100
1,300
1,600
1,800
1,000
1,200
1,400
1,700
1,500

73
Enel.si: access to the prosperous retail market
• Franchising: local entrepreneurs supported by Enel.si
• Enel.si provides centralized communications, products, technical
assistance, finance solutions, sales and technical training platform
• Development of distributed renewable energy generation
devices and energy efficiency solutions
• Over 450 franchisees with local points of sale
• Over 50 MW photovoltaic solutions sold
• Refueling product pipeline with new innovative applications
• Expansion of franchise network to over 1,000
• Extension of business model to selected countries with local partners
Over 450 franchiseeslocally distributed over Italy
Business modelBusiness model
StatusStatus
Development opportunitiesDevelopment opportunities

74
Strategy: Solar Photovoltaic
Installed capacity (MW)
100%
CapEx (m€)Total 09-13 = 202 m€
Energy production (GWh)
• Large-scale power plants in key geographies• Large-scale power plants in key geographies
• Downstream integration into retail market• Downstream integration into retail market
• Upstream value chain integration• Upstream value chain integration
2008
4
75
2013
+1,983%
2008 2013
2
59
n.a.
Growth Maintenance

75
Investor DayRome - April 22nd, 2009
• Opening remarks F. Conti
• Enel Green Power: a leading player in renewable energies F. Starace
• Focus on technologies:
• Geothermal T. Volpe
• Hydro V. Vagliasindi
• Focus on technologies:
• Wind M. Bezzeccheri
• Solar Photovoltaic I. Wilhelm
• Business Development Model R. Deambrogio
• Financial highlights A. De Paoli
• Conclusions F. Starace

Business Development Model
Roberto Deambrogio
Investor DayRome - April 22nd, 2009

77
The Workflow for Creating Value in Enel Green Power
Project identification
Screening
Valuation
Permitting
Approval process
CapEx allocation
Realization of approved projects
Integration of acquisitions
CapEx expenditure
Plant operation
Production optimization
Continuous improvement
EBITDA generation
ICT, Communication, Corporate, AFC, Regulatory, Legal, HR, Audit, ProcurementStaff Functions:
Business Development
EPC
Integration M&AO&M

78
A strong and significant pipeline can lead EGP to optionality, more flexibility and profitable growth
A strong and significant pipeline can lead EGP to optionality, more flexibility and profitable growth
Fully integrated geothermal operator
Greenfield
• Market Monitoring
• Strong local relationship
• Take advantage of Enel development capabilities
• Higher return projects
• Acquisition of a cost-free option to invest
• Skilled local team required
• 1-3 years as lead time
Co-development
• Implementation of the pipeline with strategic partners in medium term
• More rapid development process
• Scalability and replicability of the Joint Development Agreements
• Complementary set of skills with Partners
• Success-fee based agreements to share the development risk and upside
Strategic approach - Greenfield and co-development

79
Enel Green Powerpresence
• July 2008: acquisition of projects for 70 MW wind
• August 2008: JDA for wind development for 150 MW
• December, 2008: acquisition of 2 wind projects (total of 39 MW) in the area of KamenBryag and Shabla
• October 2008: finalization of Tradewindrefinancing
• Plants put in operation• October 2008: Smoky II (150 MW)• January 2009: Newind (27 MW) in
Newfoundland, Canada• April 2009: Saltwells and Stillwater 65
MW geo
• June 2008: acquisition of a pipeline for 120 MW wind, COD starting from 2009
• July 2008: acquisition of 1,400 MW of wind pipeline
• 43 MW in operation, wind and hydro
• 2008: 79 MW put in operation, wind
• April-July 2008: acquisition of 300 MW wind pipeline
• December 2008: acquisition of 850 MW wind pipeline
• July 2008: acquisition of 1,000 MW wind pipeline
Enel Green Power additional capacityMost recent deals finalized and plants put in operation

80
89% 4% 3% 4%
14.90.6 0.5
0.1 16.70.6
Wind Hydro Geo Solar Other Total
<1% 100%
17%32%13%15%23%
5.3
16.72.8
2.2
2.6
3.8
Italy Iberia Europe NorthAmerica
LatinAmerica
Total
0.61.6
3.8
16.710.7
Underconstruction
(100%)
Highly confident(90%)
Likely (50%) Potential (20%) Total
* Probability of project becoming operational at exp. COD
Weight on total capacity (%)
100%3% 10% 23% 64% 100%
A solid pipeline*…(GW)
…evenly split among geographies…(GW)
…with projects in four technologies(GW)
• 6 GW of solid pipeline plus 10.7 GW of back-up options
• Financial discipline: geographies and technologies compete for capital allocation on the base of profitability
• 6 GW of solid pipeline plus 10.7 GW of back-up options
• Financial discipline: geographies and technologies compete for capital allocation on the base of profitability
6 GW
Note: Proforma data; Endesa not included (accounting for 12.4 GW pipeline)
Enel Green Power Development Pipeline

81
Area Europe - Enel Green Power positioningFocus Italy
Among the highest incentives for Renewables in Europe:
• CIP6: feed-in tariff for plants with COD up to 1999
• Green Certificates: by technology
• “Conto Energia”: feed-in tariff for solar PV plants
• Wind: Synergies with hydro O&M; more than 100 employees dedicated to BD activities and construction
• Hydro: 3 Business units, 24 O&M units; more than 600 employees
• Solar: Enel.si, leader in Italy on PV market; ~ 400 franchisee and ~35 employees dedicated to design and “turn key” projects
The Italian Government has set ambitious targets:
•12 GW of wind•9.5 GW of solar•Approx. 8.5 GW of hydro, biomass and geothermal
Source: Position Paper Italian Government
Market-Resource
Regulatory
Enel Green Power’s strengths
2008 2020
4.6 GW
30 GW
1. South: approx. 1,400 MW wind pipeline and 80 MW PV solar pipeline
2. Islands: approx. 400 MW wind and 150 MW PV solar pipeline
3. Rest of Italy: approx. 250 MW wind, 200 MW geothermal and 50 MW PV solar pipeline
Significant growth due to favorable regulatory framework, with incentives for wind and solar PV
Significant growth due to favorable regulatory framework, with incentives for wind and solar PV
3
1
2
2

82
• Tradable Green Certificates (Romania)• Feed in tariff (France, Greece, Spain, Bulgaria)• Investment incentives (Greece)• Tax incentives (France)
• Spain: since 2003 presence in the market through EUFER• Romania: synergies with Enel’s three Discos• France, Greece, Bulgaria: presence as a growth platform
• EU 20-20-20 Directive• Most Countries are new or developing
wind markets• Spain, France and Greece key markets for
solar development
(1) Including Italy(2) Corresponds to Enel Green Power share (50%)
Market-Resource
Regulatory
Enel Green Power’s strengths
2008 2020
390 GW(1)
1,030 GW(1)
620 GW(1)
max
min
A strong boost by EU to reach ambitious targets makes our markets attractive in terms of growth and profitability
A strong boost by EU to reach ambitious targets makes our markets attractive in terms of growth and profitability
13
2
4
1. ROMANIA and BULGARIA – 75 MW wind farm under construction and 500+ MW wind pipeline
2. GREECE – 1,400 MW wind pipeline
3. FRANCE - 95 MW wind farms under construction and more than 400 MW wind pipeline
4. SPAIN - 122 MW wind under construction and 2,500+ MW pipeline(2) (wind, hydro, biomass, solar, and cogen)
Area Europe - Enel Green Power positioningFocus Rest of Europe

83
Job creation
Reducing oil dependence
Greenhouse gas reduction
Source: HR1; Center for American Progress
Distinct pieces of climate and energy legislation in 2009
Stimulus package
Energy Bill
Climate Bill
• Expected to address: – Federal renewable portfolio
standard (RPS) – New transmission lines– Energy efficiency standards– Federal consumption
• Likely focus on: – Creating a carbon cap-and-trade
system or other carbon reduction system
– Energy efficiency
• Up to ~98 USD billion energy-related funding
• Substantial direct loans, loan guarantees and grants
Implications for renewable players
• Higher regulatory “stability”» Multi-year renewal of PTC/ ITC
• Easier financing conditions» Loan guarantees
• Introduction of “top-line” incentives» Federal RPS» Strong induced demand for green
energy» Renewable certificates to reduce
forced reliance on financial partners
Objectives’ of Obama Administration on renewables
US outlook - New regulation and its implication

84
Large and fast growing market, solid policy support, Enel Green Power positioned to seize significant growth opportunities
Large and fast growing market, solid policy support, Enel Green Power positioned to seize significant growth opportunities
1. US Midwest: Tradewind exclusive developer for Enel with substantial pipeline (4,000+ MW)
2. North-East US and Canada: 600+ MW greenfield Wind and Solar projects
3. Nevada: commissioning 63 MW gross geo plants and approx. 100+ MW geo pipeline
13• Production Tax Credit (PTC): historically main driver in the US; new
incentives in the Stimulus Bill (ITC. Grants)• Radical change in policy support
(PTC already extended, Federal RPS, Carbon legislation)
• Large potential still untapped
• Wind development starting in key markets (Mexico, Brazil and Chile)
• Central American regional market being implemented
Market-Resource
Regulatory
Enel Green Power’s strengths
• Presence in the North American market since 2001• 748 MW installed in four different technologies• Long term experience in the US RE market (20+ years)• Significant pipeline in geo and wind
2
2008 2020
230 GW
550 GW
330 GW
max
min
Area North America - Enel Green Power positioning

85
Focus on three markets: Chile, Brazil and Mexico while pursuing the interesting opportunities in the other markets
Focus on three markets: Chile, Brazil and Mexico while pursuing the interesting opportunities in the other markets
1. BRAZIL - JDA with for wind development (1,000 MW) and 23 MW repowering of existing hydro plants
2. CHILE - JDA (850 MW wind pipeline); 120 MW geo pipeline3. CENTRAL AMERICA
i. 85 MW hydro under constructionii. 600+ MW hydro and geo pipeline
4. MEXICO - JDAs for wind development (2,000 MW) under negotiation
4
1
3
2
• Large potential still untapped
• Wind development starting in key markets (Mexico, Brazil and Chile)
• Central American regional market being implemented
Market-Resource
Regulatory
Enel Green Power’s strengths
max
min
• Tax incentives and Clean Development Mechanism (CDM)
• Chile: New Quota Obligation system or RPS scheme
• Brazil: Subsidies fund; Financing; Auctions
• Mexico: Target by law up 2012: RES 26%; tax incentives; BOT
tenders by CFE; regulation to boost renewables being drafted
• Presence in Latin America since 2001• Leverage on key competences in different technologies
2008 2020
150 GW
330 GW
200 GW
Area Latin America - Enel Green Power positioning

86
Weight on total additional capacity (%)
0.2 1.9
0.3
0.8
0.6
Italy Rest ofEurope
NorthAmerica
Latin America Total
Coverage Ratio (Pipeline/Add. Installed Capacity)
Pipeline covers 9 times additional capacity of Business Plan 2009-2013Pipeline covers 9 times additional capacity of Business Plan 2009-2013
~ 6 x ~ 6 x ~ 20 x ~ 14 x ~ 9 x
34% 41% 14% 11% 100%
Enel Green Power Business Plan 2009-2013Additional Capacity by Geography (GW)

87
Investor DayRome - April 22nd, 2009
• Opening remarks F. Conti
• Enel Green Power: a leading player in renewable energies F. Starace
• Focus on technologies:
• Geothermal T. Volpe
• Hydro V. Vagliasindi
• Focus on technologies:
• Wind M. Bezzeccheri
• Solar Photovoltaic I. Wilhelm
• Business Development Model R. Deambrogio
• Financial highlights A. De Paoli
• Conclusions F. Starace

Financial Highlights:2008 Results and 2009-2013 Business Plan
Alberto De Paoli
Investor DayRome - April 22nd, 2009

89
Proforma 2007 and 2008
Revenues
M€
1,852
2008
1,536
2007
EBIT 772 608 +27%
EBITDA margin 64% 64% n.a.
EBITDA 1,188 989 +20%
+21%
Δ %
Net income 376 n.a. n.a.
Established competencies in
development and O&M

90
Abroad37%
Italy63%
Net Production 2008
Hydro56%
Wind12%Geo
30%
Biomass2%
Net Production (TWh)
14.7
17.2
2007 2008
+17%
(**)
(*) Proforma(**) Including Cogeneration
(*)
+17%

91
Abroad29%
Italy71%
Hydro40%
Wind13%
Geo31%
Biomass1%
Other15%
Revenues 2008
Revenues (€ mln) (**)
(*) Proforma(**) Including Cogeneration
(***)
(***) Including Revenues from PV Modules selling
+21%1,852
1,536
2007 2008
(*)

92
EBITDA 2008
(***) Including Revenues from PV Modules selling
(*)
(*) Proforma(**) Including Cogeneration
Hydro42%
Wind17%
Geo39%
Biomass1%
Other1%(**)
(***)
Abroad28%
Italy72%
1,188
989
2007 2008
64.4% 64.2%
+20%
EBITDA Margin (%)
EBITDA (€ mln)

93
CapEx 2008
Other3%
Biomass1%
Wind62%
Hydro9%
Geo25%
(*)
Total CapEx 2008 = 951 € mln
(***) Including Revenues from PV Modules selling
(*) Proforma(**) Including Cogeneration
(***)(**)
Abroad61%
Italy39%

94
Operating targets 2009-2013
Net production* (TWh)
2008 20132008 2013
Net installed capacity* (GW)
46% 42%Load Load factorfactor
wind
geohydro
other
+42%+31%
1.2
2.5
0.70.05
2.8
2.6
0.8
0.13
4.5
6.3
2.1
9.7
5.2
0.31
6.4
9.9
5.8
0.4317.2
22.7+42% +31%
(*) Other (MW): 2008: Solar 4, Biomass 21, Cogen. 26; 2013: Solar 76, Biomass 26, Cogen. 31(**) Other (GWh): 2008: Solar 2, Biomass 172, Cogen. 136; 2013: Solar 59, Biomass 206, Cogen. 165

95
Operating targets 2009-2013Net Production
Abroad47%
Italy53%
(*) Including Cogeneration
Hydro56%
Wind12%Geo
30%
Biomass2%
Biomass2%
Hydro44%
Geo26%
Wind28%
Abroad37%
Italy63%
(*) (*)
2008 (17.2 TWh) 2013 (22.7 TWh)

96
Financial targets 2009-2013
Revenues (M€)
1,602
1,188
2008 2013
EBITDA (M€)
Cum. EBITDA 09-13 = 6.7 bn €
2,855
1,852
2008 2013
+54% +35%+54% +35%

97
Financial targets 2009-2013EBITDA
2008 (1.2 € bln) 2013 (1.6 € bln)
Abroad35%
Italy65%
Abroad28%
Italy72%
Hydro42%
Geo39%
Wind17%
Biomass1%
Other1%
Wind35%
Geo28%
Hydro35%
Solar1%
Other1%
(**)
(**) Including Biomass, Cogeneration and Other
(*)
(*) Including Cogeneration

98
Financial targets 2009-2013CapEx
Italy46%
Abroad54%
Other3%
Solar6%
Wind59%
Hydro14%
Geo18%
Total CapEx 09-13 = 3.7 bn €
(*)
(*) Including Biomass, Cogeneration and Other
Operating Cash Flow 09-13/CapEx 09-13
(€ bln)
3.7
>5.0
Operating CashFlow
CapEx
>1.4 x

99
Investor DayRome - April 22nd, 2009
• Opening remarks F. Conti
• Enel Green Power: a leading player in renewable energies F. Starace
• Focus on technologies:
• Geothermal T. Volpe
• Hydro V. Vagliasindi
• Focus on technologies:
• Wind M. Bezzeccheri
• Solar Photovoltaic I. Wilhelm
• Business Development Model R. Deambrogio
• Financial highlights A. De Paoli
• Conclusions F. Starace

Conclusions
Francesco Starace
Investor DayRome - April 22nd, 2009

101
Enel Green Power: where we are2008*
EGP presence
4,464 MW
Enel Green Power
17.2 TWh
748 MW
North America
1.8 TWh
399 MW
Iberia
0.8 TWh
2,547 MW
Italy
10.9 TWh
12 MW
France
0.01 TWh Pipeline
Romania, Bulgaria
91 MW
Greece
0.2 TWh
667 MW
Latin America
3.5 TWh
* Proforma dataNote: Endesa capacity not included (1,026 MW: 799 MW in Iberia and 227 MW in Latin America)

102
Enel Green Power: how we want to grow
A new paradigm for renewables: sustainable and profitable growthA new paradigm for renewables: sustainable and profitable growth
The industry so far
• Wind-only portfolioTechnology mixTechnology mix
Geographic presenceGeographic presence
Long-term sustainability
Long-term sustainability
• Balanced portfolioof technologies
• Polarized presence • Diversified presence
• Heavy dependence on incentive schemes
• Limited dependence on incentive schemes
FinancingFinancing• Debt • Operating cash flows
Key Performance
Indicators
Key Performance
Indicators
• Growth • MW (Installed capacity)
• Return on Investment• TWh (Energy production)

103
Enel Green Power: our value proposition
Cash Flow positive since Year 1Cash Flow positive since Year 1
Solid pipeline to capture additional growthSolid pipeline to capture additional growth
Unique portfolio of technologies and geographies Unique portfolio of technologies and geographies

104
Disclaimer
THESE SLIDES HAVE BEEN PREPARED BY THE COMPANY SOLELY FOR THE USE DURING ENEL’S GREEN POWER INVESTOR DAY.
THE INFORMATION CONTAINED HEREIN HAS NOT BEEN INDEPENDENTLY VERIFIED. NONE OF THE COMPANY OR REPRESENTATIVES SHALL HAVE ANY LIABILITY WHATSOEVER IN NEGLIGENCE OR OTHERWISE FOR ANY LOSS HOWSOEVER ARISING FROM ANY USE OF THESE SLIDES OR THEIR CONTENTS OR OTHERWISE ARISING IN CONNECTION WITH THESE SLIDES OR ANY MATERIAL DISCUSSED DURING THE ABOVE MEETINGS.
THIS DOCUMENT IS BEING FURNISHED TO YOU SOLELY FOR YOUR INFORMATION AND MAY NOT BE REPRODUCED OR REDISTRIBUTED TO ANY OTHER PERSON.
THE INFORMATION CONTAINED HEREIN AND OTHER MATERIAL DISCUSSED DURING THE MEETING MAY INCLUDE FORWARD-LOOKING STATEMENTS THAT ARE NOT HISTORICAL FACTS, INCLUDING STATEMENTS ABOUT THE COMPANY’S BELIEFS AND EXPECTATIONS. THESE STATEMENTS ARE BASED ON CURRENT PLANS, ESTIMATES, PROJECTIONS AND PROJECTS, AND THEREFORE YOU SHOULD NOT PLACE UNDUE RELIANCE ON THEM.
FORWARD LOOKING STATEMENTS INVOLVE INHERENT RISKS AND UNCERTAINTIES. WE CAUTION YOU THAT A NUMBER OF IMPORTANT FACTORS COULD CAUSE ACTUAL RESUTLS TO DIFFER MATERIALLY FROM THOSE CONTAINED IN ANY FORWARD-LOOKING STATEMENT. SUCH FACTORS INCLUDE, BUT ARE NOT LIMITED TO: TRENDS IN ENEL’S CORE ENERGY BUSINESS, ITS ABILITY TO IMPLEMENT COST-CUTTING PLANS, CHANGES IN THE REGULATORY ENVIRONMENT AND FUTURE CAPITAL EXPENDITURE.

105
Contact us
Enel Investor Relations Team ([email protected])
Visit our website at:
www.enel.it (Investor Relations)
Visit our website at:
www.enel.it (Investor Relations)
Luca Torchia (Head of IR)
Pedro Cañamero
Elisabetta Ghezzi
Donatella Izzo
Federica Todaro
Angela Tretola
+39 06 83053437
+39 06 83055292
+39 06 83052708
+39 06 83057449
+39 06 83059502
+39 06 83052062
+39 06 83053437
+39 06 83055292
+39 06 83052708
+39 06 83057449
+39 06 83059502
+39 06 83052062
Recommended