Embed Size (px)
Citation preview
Rome – May 7, 2015
Enel Green Power 2015 Investor day

Inve
sto
r R
ela
tio
ns
2015 Investor day
Agenda
1
Introduction Francesco Venturini, CEO
1Q 2015 consolidated results Francesco Venturini, CEO - Giulio Carone, CFO
Strategic outlook Francesco Venturini, CEO
2015 - 2019 financial outlook Giulio Carone, CFO
Closing remarks Francesco Venturini, CEO
Inve
sto
r R
ela
tio
ns
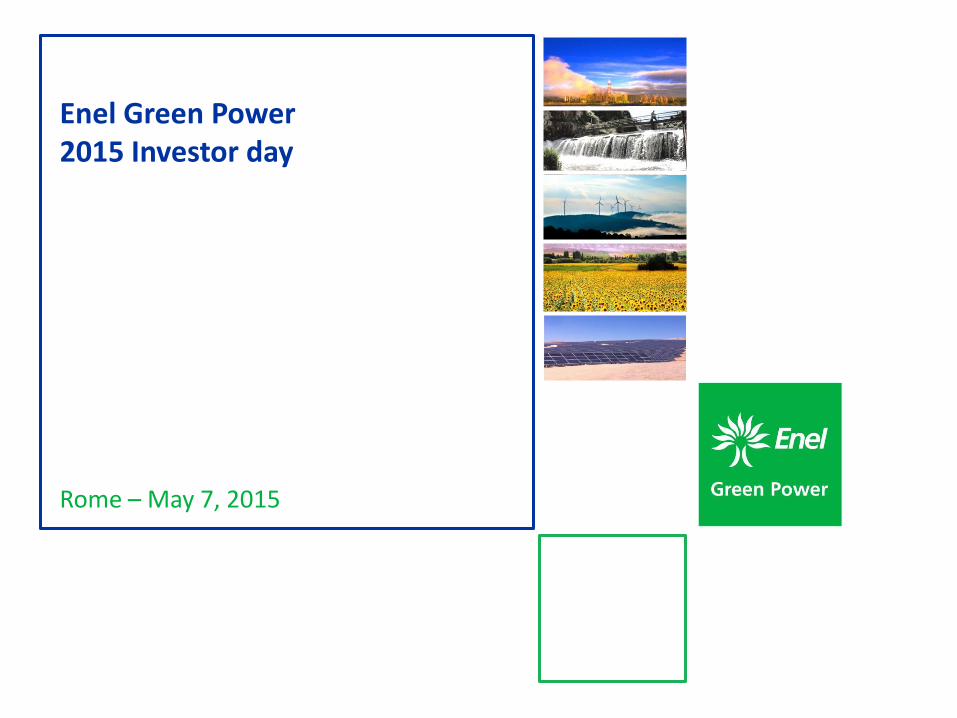
Enel Green Power today
2
Global player with a diversified footprint
2.1 GW in operation 0.4 GW in execution
North America
10 MW in operation 0.5 GW in execution 0.4 GW contracted
Africa
5.8 GW in operation 0.3 GW in execution
Europe
1.9 GW in operation 1.9 GW in execution 0.1 GW contracted
Latin America
Expertise across 5 technologies
Operations across 16 countries
Industry leading load factor at 40%
Highly efficient operations
2015 Investor day
Inve
sto
r R
ela
tio
ns
2015 Investor day
Agenda
3
Introduction Francesco Venturini, CEO
1Q 2015 consolidated results Francesco Venturini, CEO - Giulio Carone, CFO
Strategic outlook Francesco Venturini, CEO
2015 - 2019 financial outlook Giulio Carone, CFO
Closing remarks Francesco Venturini, CEO
Inve
sto
r R
ela
tio
ns
1Q 2015 consolidated results
1Q 2015 highlights (€m)
4
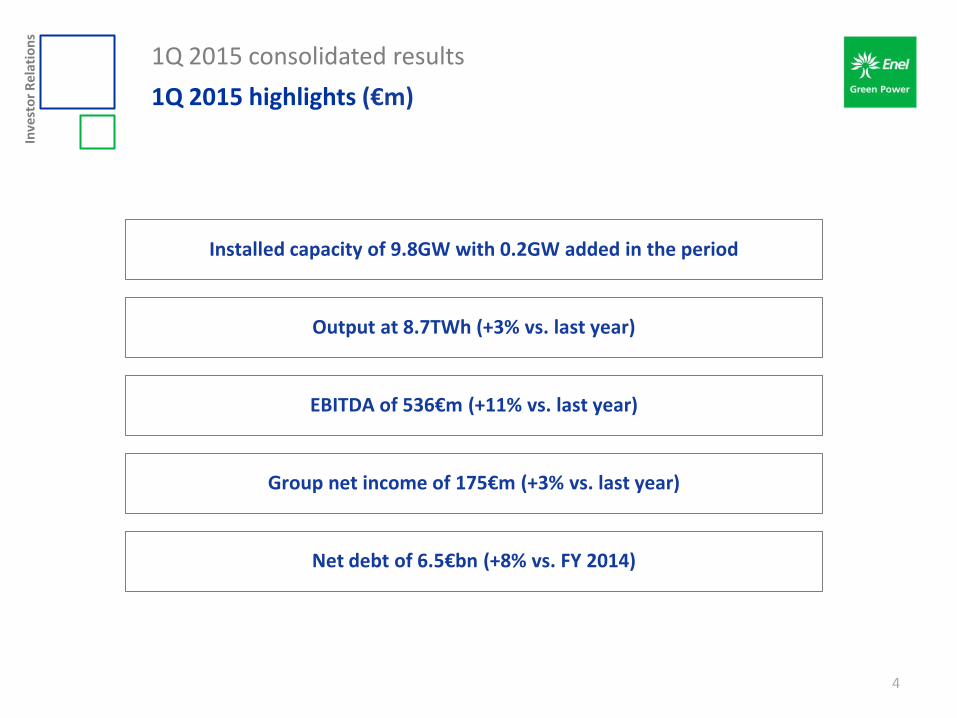
Installed capacity of 9.8GW with 0.2GW added in the period
Output at 8.7TWh (+3% vs. last year)
EBITDA of 536€m (+11% vs. last year)
Net debt of 6.5€bn (+8% vs. FY 2014)
Group net income of 175€m (+3% vs. last year)
Inve
sto
r R
ela
tio
ns
1Q 2015 consolidated results
Capacity additions in the period
5
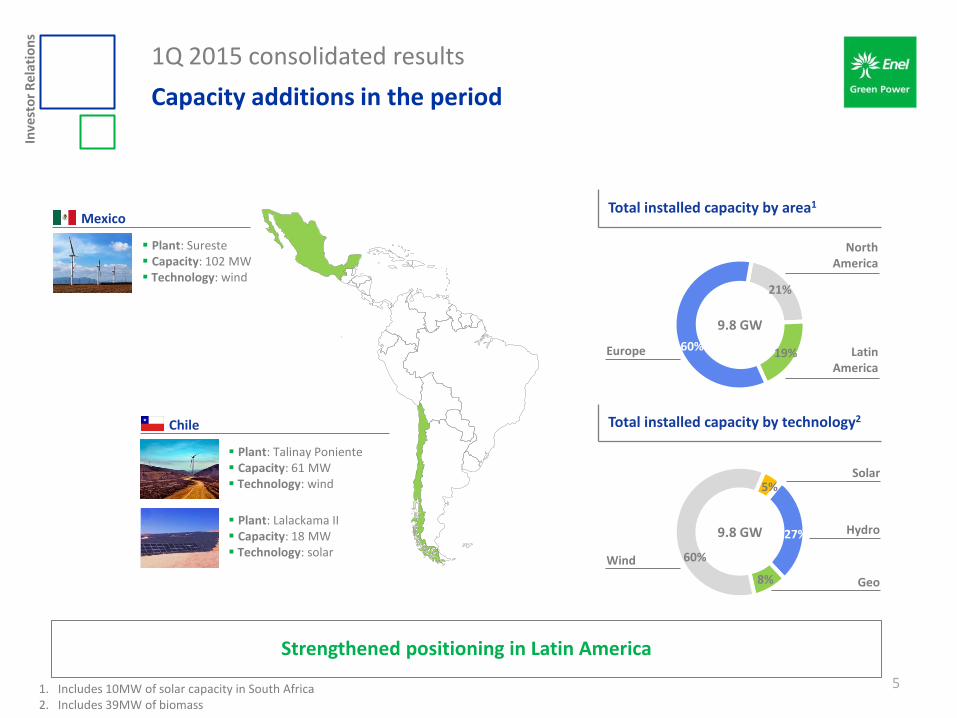
Strengthened positioning in Latin America
Chile
Plant: Talinay Poniente Capacity: 61 MW Technology: wind
Mexico
Plant: Sureste Capacity: 102 MW Technology: wind
21%
19% 60%
9.8 GW
Europe Latin America
North America
27%
8%
60%
5%
9.8 GW
Wind
Hydro
Solar
Geo
Total installed capacity by area1
Total installed capacity by technology2
Plant: Lalackama II Capacity: 18 MW Technology: solar
1. Includes 10MW of solar capacity in South Africa 2. Includes 39MW of biomass
Inve
sto
r R
ela
tio
ns
1Q 2015 consolidated results
Financial highlights
6
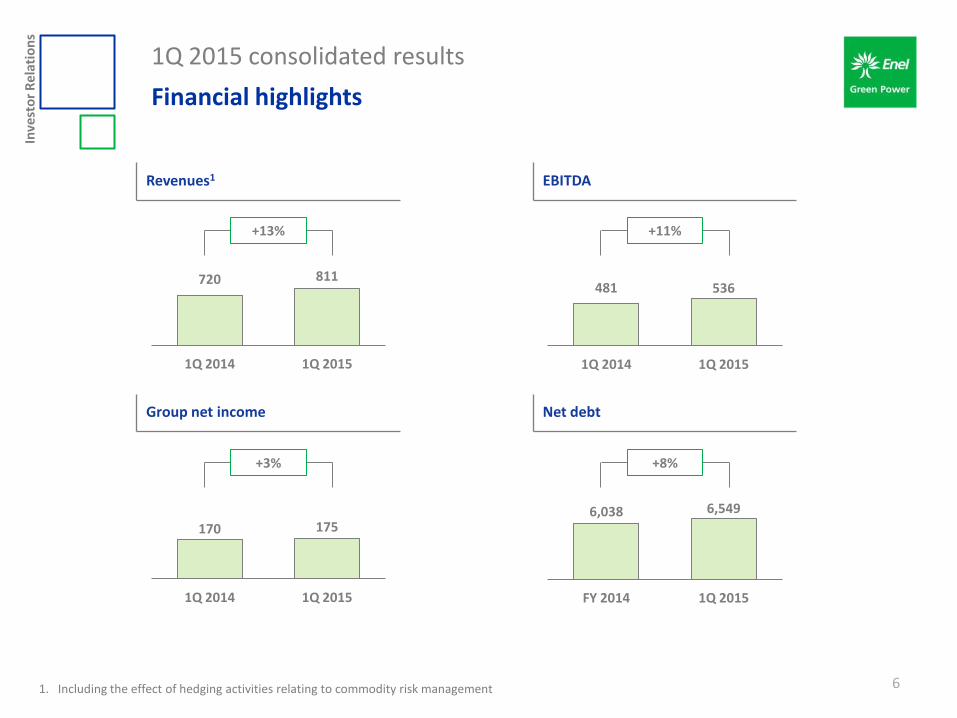
EBITDA Revenues1
Net debt Group net income
6,038 6,549
FY 2014 1Q 2015
720 811
1Q 2014 1Q 2015
481 536
1Q 2014 1Q 2015
170 175
1Q 2014 1Q 2015
1. Including the effect of hedging activities relating to commodity risk management
+13% +11%
+8% +3%
Inve
sto
r R
ela
tio
ns
1Q 2015 consolidated results
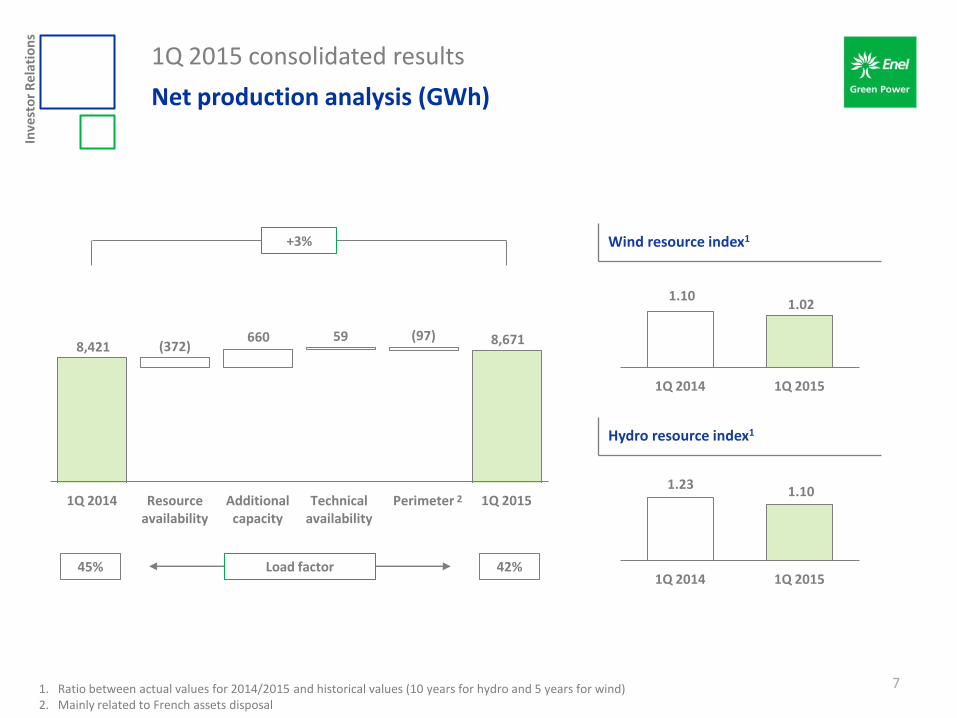
Net production analysis (GWh)
7
8,421 (372) 660 59 (97) 8,671
1Q 2014 Resource availability
Additional capacity
Technical availability
Perimeter 1Q 2015
+3%
Load factor 45% 42%
1. Ratio between actual values for 2014/2015 and historical values (10 years for hydro and 5 years for wind) 2. Mainly related to French assets disposal
1.10 1.02
1Q 2014 1Q 2015
Wind resource index1
1.23 1.10
1Q 2014 1Q 2015
Hydro resource index1
2

Inve
sto
r R
ela
tio
ns
1Q 2015 consolidated results
EBITDA analysis (€m)
8
EBITDA margin 66% 67%
481 1 47 (16) (7)
30 536
1Q 2014 Energy margin
Other revenues
Opex Perimeter Forex 1Q 2015
+11%
+55
1. Mainly related to French assets disposal
1
Inve
sto
r R
ela
tio
ns
1Q 2015 consolidated results
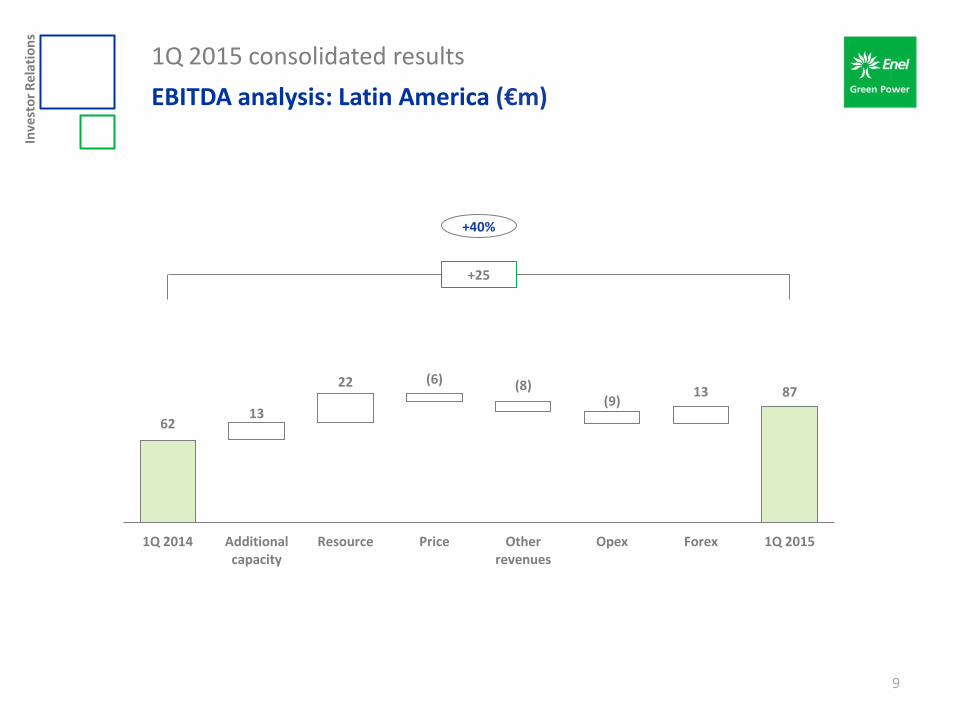
EBITDA analysis: Latin America (€m)
9
62 13
22 (6) (8) (9)
13 87
1Q 2014 Additional capacity
Resource Price Other revenues
Opex Forex 1Q 2015
+40%
+25

Inve
sto
r R
ela
tio
ns
1Q 2015 consolidated results
EBITDA analysis: North America (€m)
10
65
16 (13) 2
8 (1)
17 94
1Q 2014 Additional capacity
Resource Price Other revenues
Opex Forex 1Q 2015
+45%
+29
Inve
sto
r R
ela
tio
ns
1Q 2015 consolidated results
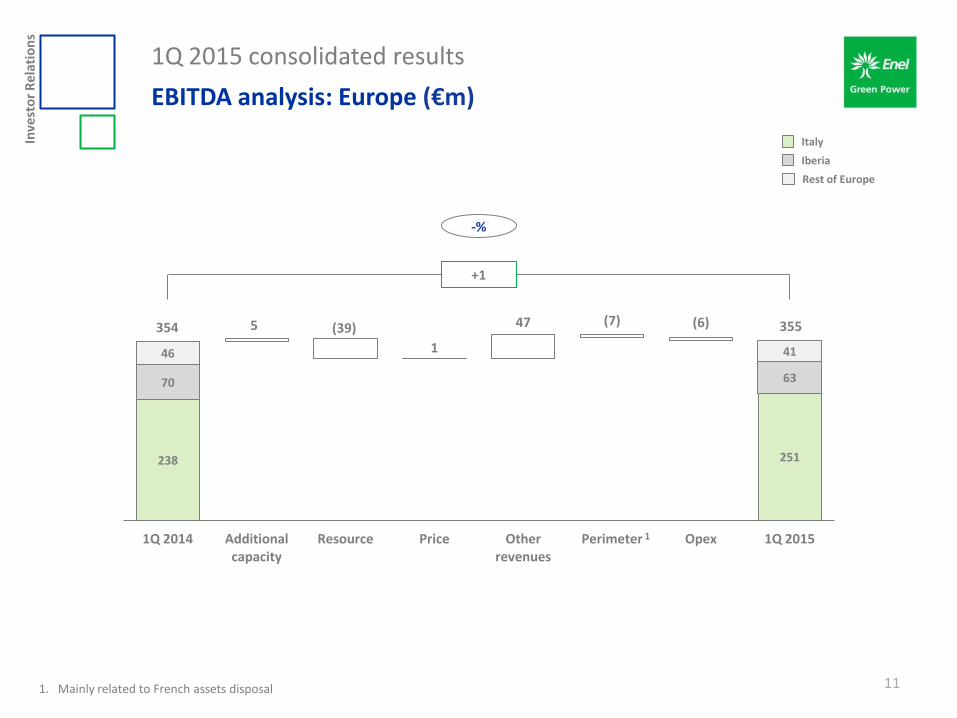
EBITDA analysis: Europe (€m)
11
-%
238 251
70 63
46
5 (39)
1
47 (7) (6)
41
1Q 2014 Additional capacity
Resource Price Other revenues
Perimeter Opex 1Q 2015
Iberia
Italy
Rest of Europe
+1
354 355
1
1. Mainly related to French assets disposal

Inve
sto
r R
ela
tio
ns
1Q 2015 consolidated results
Group net income
12
170
55 (28) 12 (12)
(15) (7) 175
1Q 2014 EBITDA D&A Net financial expense
Equity investment
Taxes Minorites 1Q 2015
+3%
+5
Inve
sto
r R
ela
tio
ns
1Q 2015 consolidated results
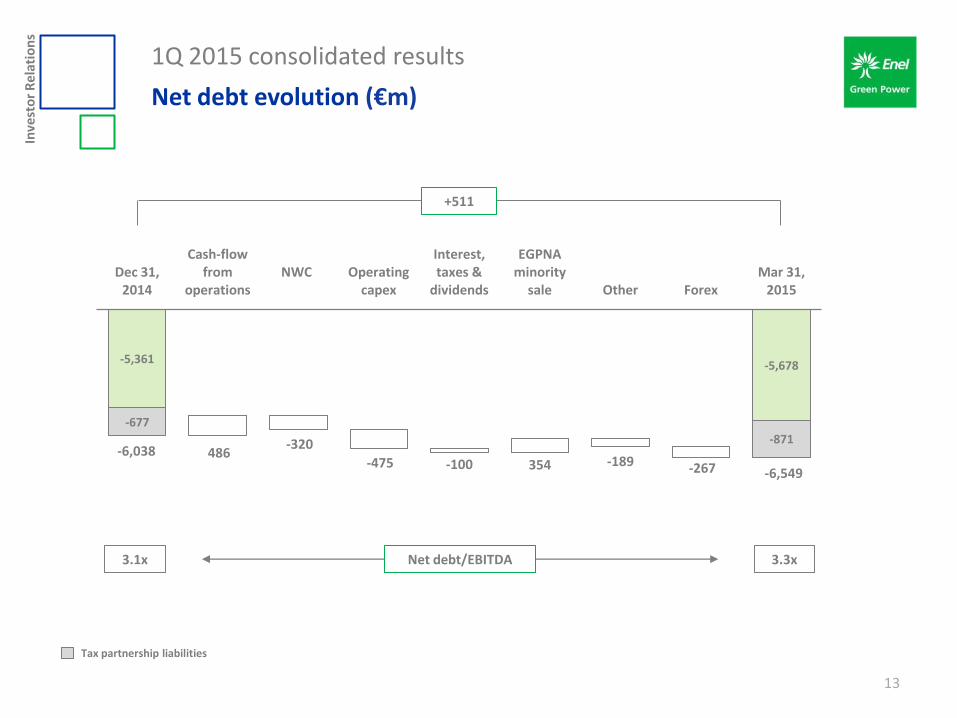
Net debt evolution (€m)
13
-5,361 -5,678
-677
486 -320
-475 -100 354 -189 -267
-871
Dec 31, 2014
Cash-flow from
operations NWC
Operating
capex
Interest, taxes &
dividends
EGPNA minority
sale Other Forex Mar 31,
2015
Tax partnership liabilities
-6,038
-6,549
Net debt/EBITDA 3.1x 3.3x
+511

Inve
sto
r R
ela
tio
ns
2015 Investor day
Agenda
14
Introduction Francesco Venturini, CEO
1Q 2015 consolidated results Francesco Venturini, CEO - Giulio Carone, CFO
Strategic outlook Francesco Venturini, CEO
2015 - 2019 financial outlook Giulio Carone, CFO
Closing remarks Francesco Venturini, CEO
Inve
sto
r R
ela
tio
ns
Strategic outlook
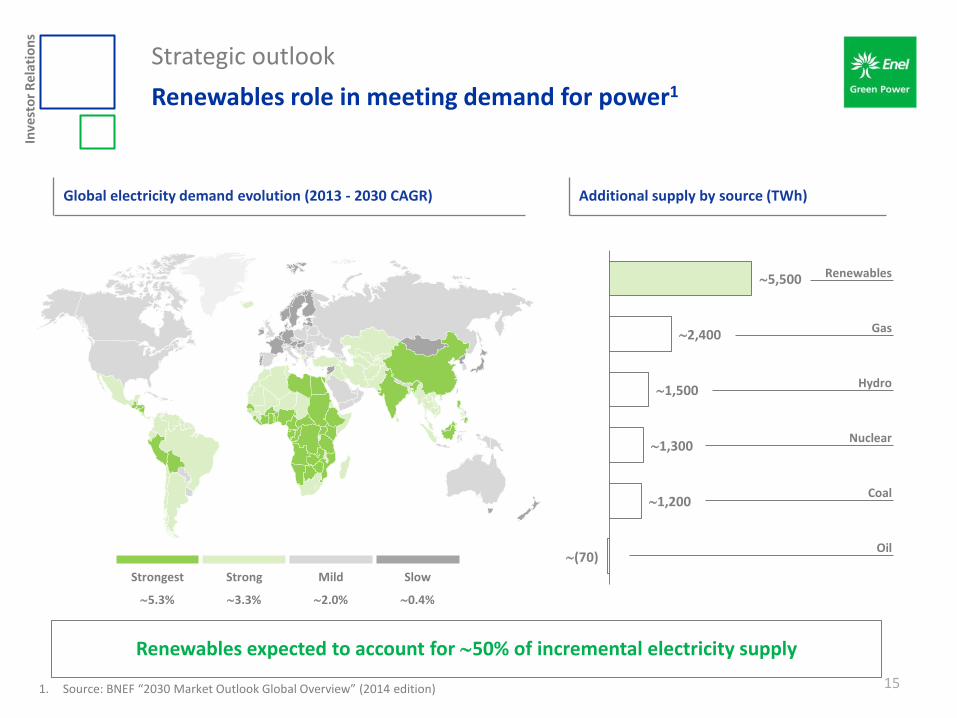
Renewables role in meeting demand for power1
15
Renewables expected to account for 50% of incremental electricity supply
1. Source: BNEF “2030 Market Outlook Global Overview” (2014 edition)
Strongest Strong Mild Slow
5.3% 3.3% 2.0% 0.4%
Additional supply by source (TWh)
(70)
1,200
1,300
1,500
2,400
5,500 Renewables
Gas
Hydro
Oil
Nuclear
Coal
Global electricity demand evolution (2013 - 2030 CAGR)
Inve
sto
r R
ela
tio
ns
Strategic outlook
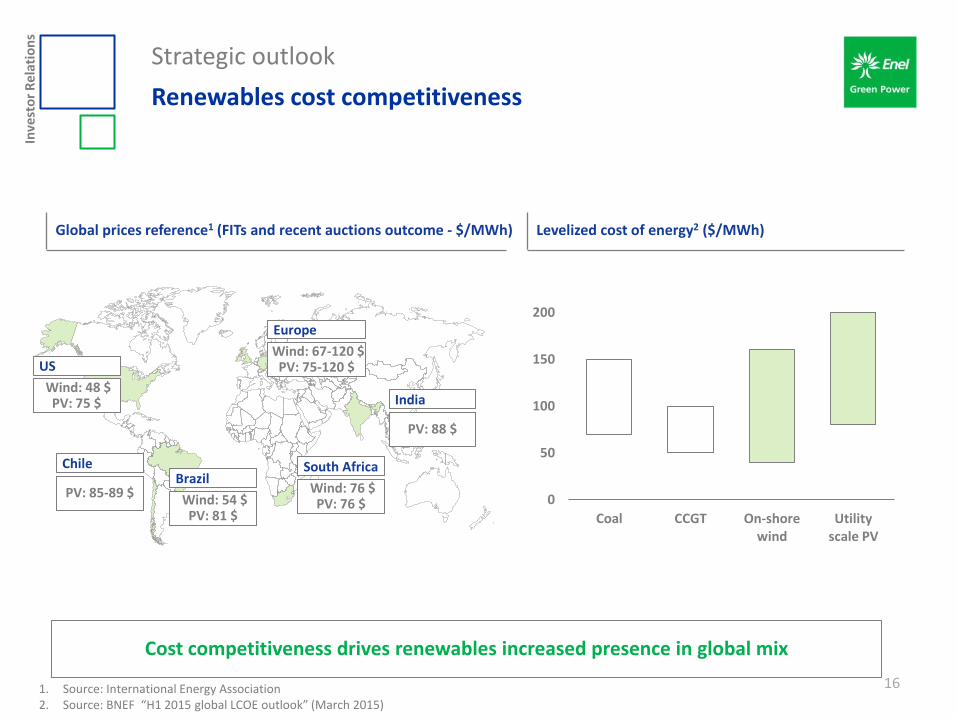
Renewables cost competitiveness
16
Global prices reference1 (FITs and recent auctions outcome - $/MWh) Levelized cost of energy2 ($/MWh)
Cost competitiveness drives renewables increased presence in global mix
0
50
100
150
200
Coal CCGT On-shore wind
Utility scale PV
1. Source: International Energy Association 2. Source: BNEF “H1 2015 global LCOE outlook” (March 2015)
Wind: 67-120 $ PV: 75-120 $
Europe
PV: 85-89 $
Chile
Wind: 48 $ PV: 75 $
US
Wind: 54 $ PV: 81 $
Brazil
Wind: 76 $ PV: 76 $
South Africa
PV: 88 $
India
Inve
sto
r R
ela
tio
ns
Strategic outlook
Renewable sector competitiveness
17
Development increasingly based on competitive tender processes
Increased appeal to financial investors
Emergence of global competitors
More reliable and long-lasting technology
Inve
sto
r R
ela
tio
ns
Strategic outlook
EGP a global player optimally positioned for success
18
Diversified geographical footprint to take advantage of opportunities globally
Maximization of asset value
Rising predictability of cash-flow
Ability to deploy multiple technologies
Proven flexibility in capital allocation
Inve
sto
r R
ela
tio
ns
Strategic outlook
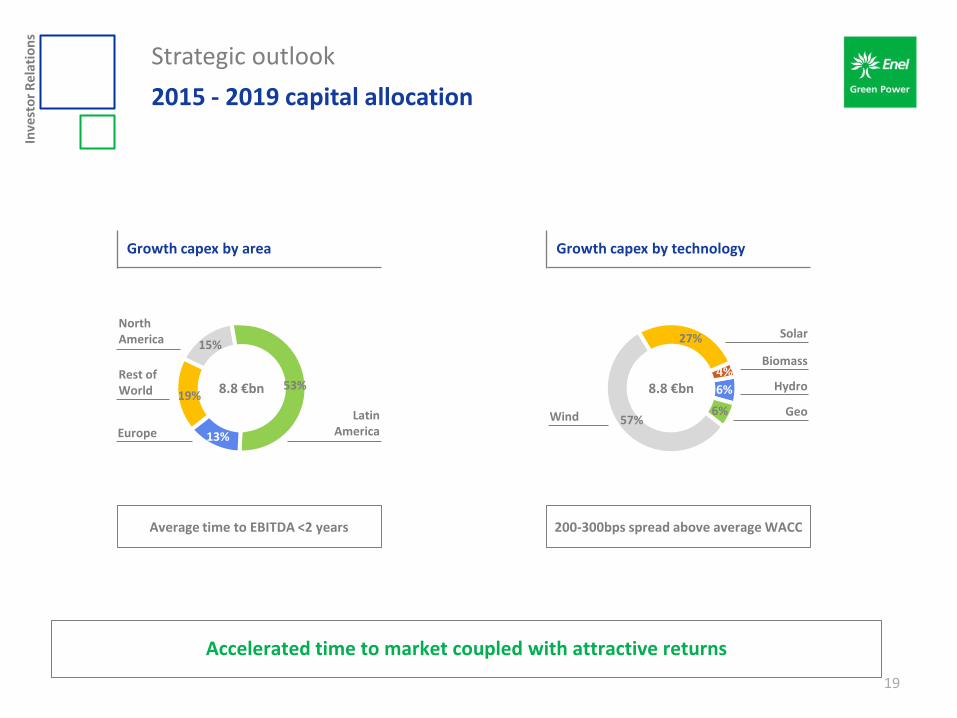
2015 - 2019 capital allocation
19
Accelerated time to market coupled with attractive returns
200-300bps spread above average WACC Average time to EBITDA <2 years
19%
15%
53%
13%
8.8 €bn Rest of World
Europe
Latin America
North America
Growth capex by area Growth capex by technology
6%
6% 57%
27%
8.8 €bn
Wind
Biomass
Solar
Hydro 4%
Geo
Inve
sto
r R
ela
tio
ns
Strategic outlook
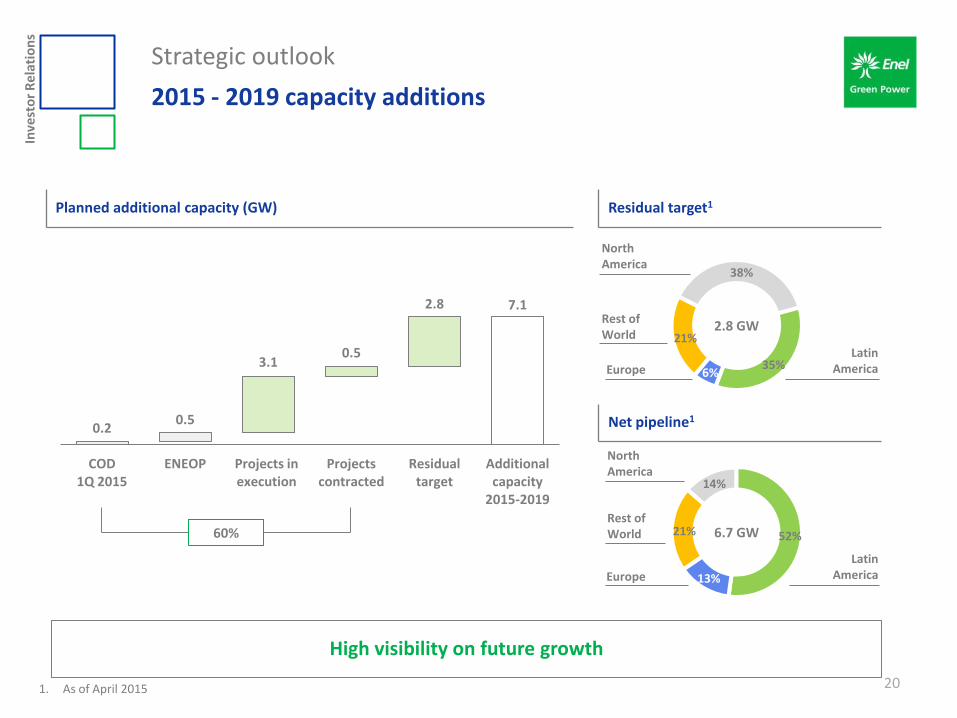
2015 - 2019 capacity additions
20
High visibility on future growth
Planned additional capacity (GW)
60%
0.2 0.5
3.1 0.5
2.8 7.1
COD 1Q 2015
ENEOP Projects in execution
Projects contracted
Residual target
Additional capacity
2015-2019
1. As of April 2015
Residual target1
Net pipeline1
21%
14%
52%
13%
6.7 GW Rest of World
Europe
Latin America
North America
21%
38%
35% 6%
2.8 GW Rest of World
Europe
Latin America
North America
Inve
sto
r R
ela
tio
ns
Strategic outlook
21
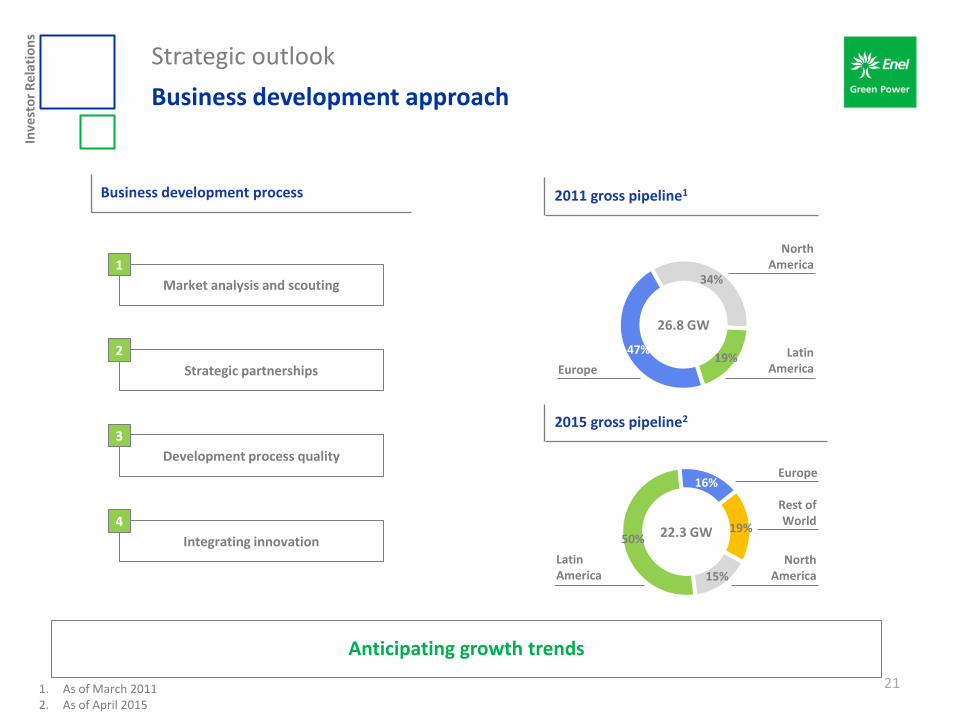
Anticipating growth trends
19%
15%
50%
16%
Latin America
Rest of World
North America
22.3 GW
Europe
34%
19% 47%
Europe
Latin America
North America
26.8 GW
2015 gross pipeline2
Business development approach
2011 gross pipeline1 Business development process
Market analysis and scouting
1
Strategic partnerships
2
Development process quality
3
Integrating innovation
4
1. As of March 2011 2. As of April 2015
Inve
sto
r R
ela
tio
ns
Strategic outlook
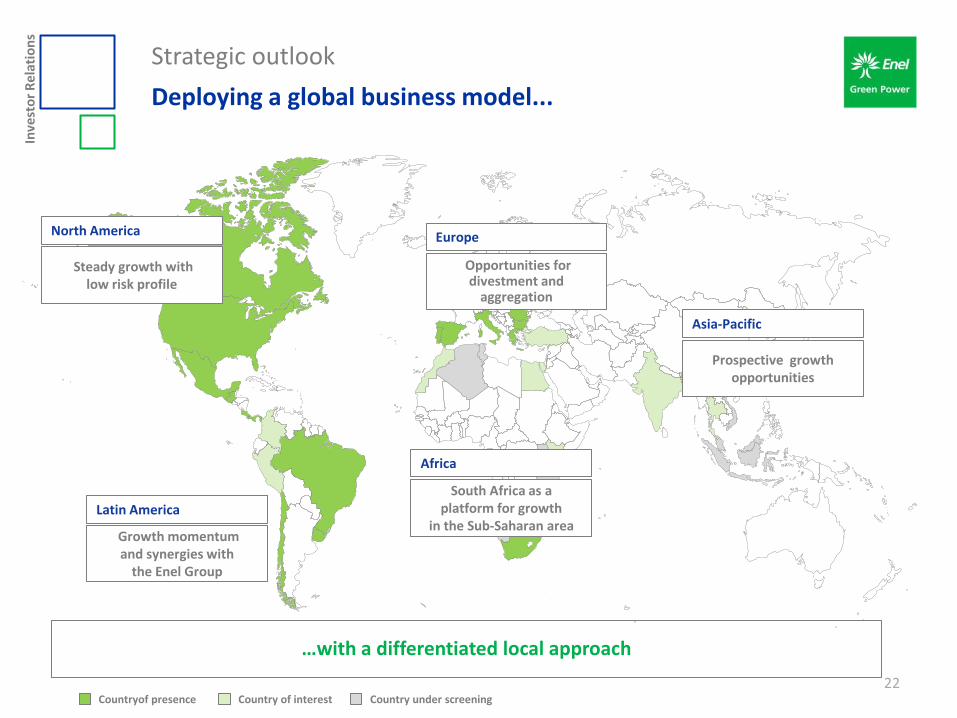
Deploying a global business model...
22
…with a differentiated local approach
Growth momentum and synergies with
the Enel Group
Latin America
Steady growth with low risk profile
North America
Opportunities for divestment and
aggregation
Europe
Prospective growth opportunities
Asia-Pacific
South Africa as a platform for growth
in the Sub-Saharan area
Africa
Country of interest Countryof presence Country under screening
Inve
sto
r R
ela
tio
ns
Strategic outlook
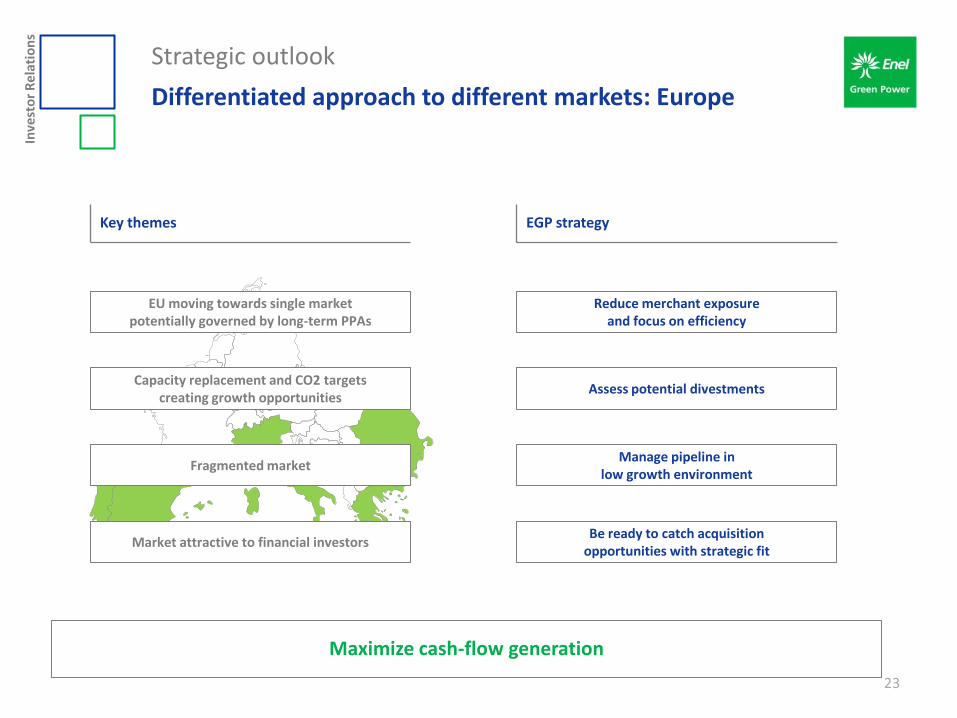
Differentiated approach to different markets: Europe
23
Assess potential divestments
Reduce merchant exposure and focus on efficiency
Manage pipeline in low growth environment
Be ready to catch acquisition opportunities with strategic fit
Key themes EGP strategy
Maximize cash-flow generation
EU moving towards single market potentially governed by long-term PPAs
Fragmented market
Market attractive to financial investors
Capacity replacement and CO2 targets creating growth opportunities
Inve
sto
r R
ela
tio
ns
Strategic outlook
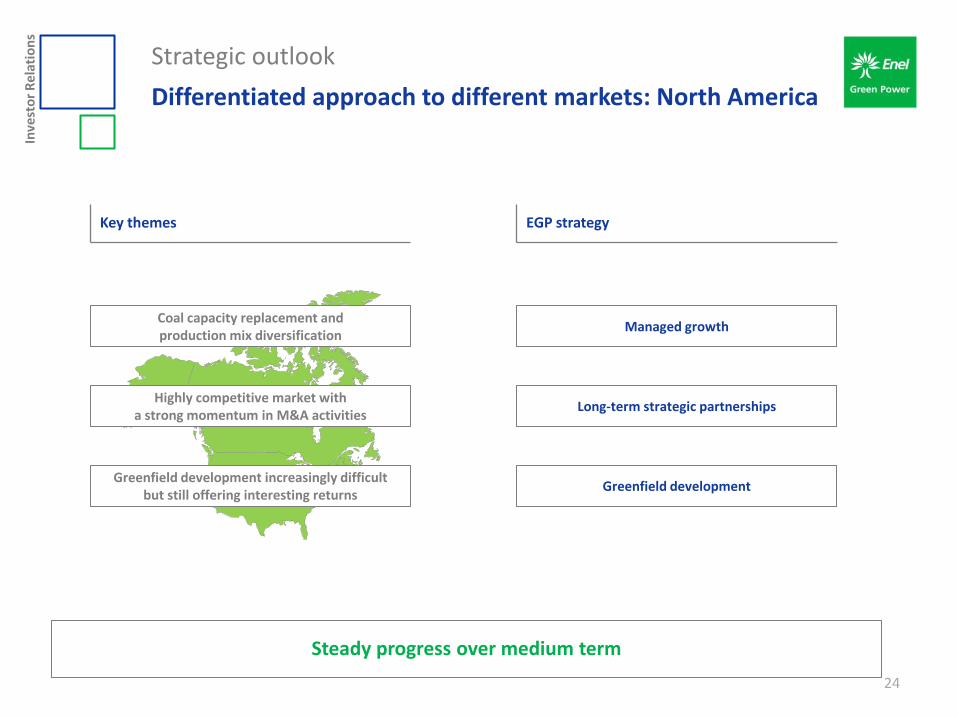
Differentiated approach to different markets: North America
24
Managed growth
Long-term strategic partnerships
Greenfield development
Key themes EGP strategy
Steady progress over medium term
Coal capacity replacement and production mix diversification
Highly competitive market with a strong momentum in M&A activities
Greenfield development increasingly difficult but still offering interesting returns
Inve
sto
r R
ela
tio
ns
Strategic outlook
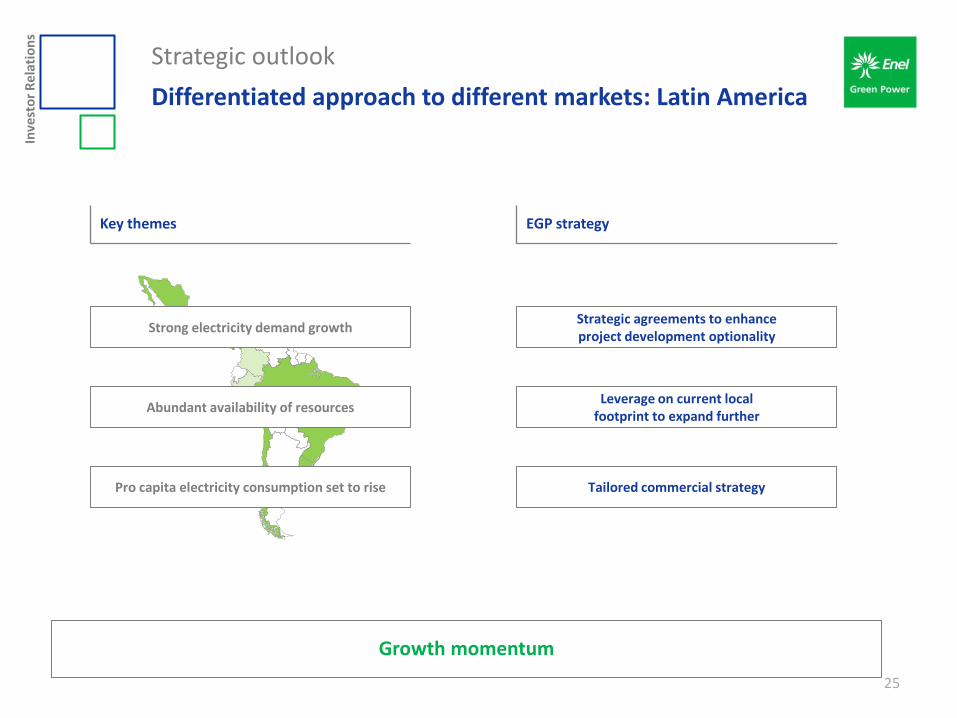
Differentiated approach to different markets: Latin America
25
Leverage on current local footprint to expand further
Strategic agreements to enhance project development optionality
Tailored commercial strategy
Key themes EGP strategy
Growth momentum
Abundant availability of resources
Strong electricity demand growth
Pro capita electricity consumption set to rise
Inve
sto
r R
ela
tio
ns
Strategic outlook
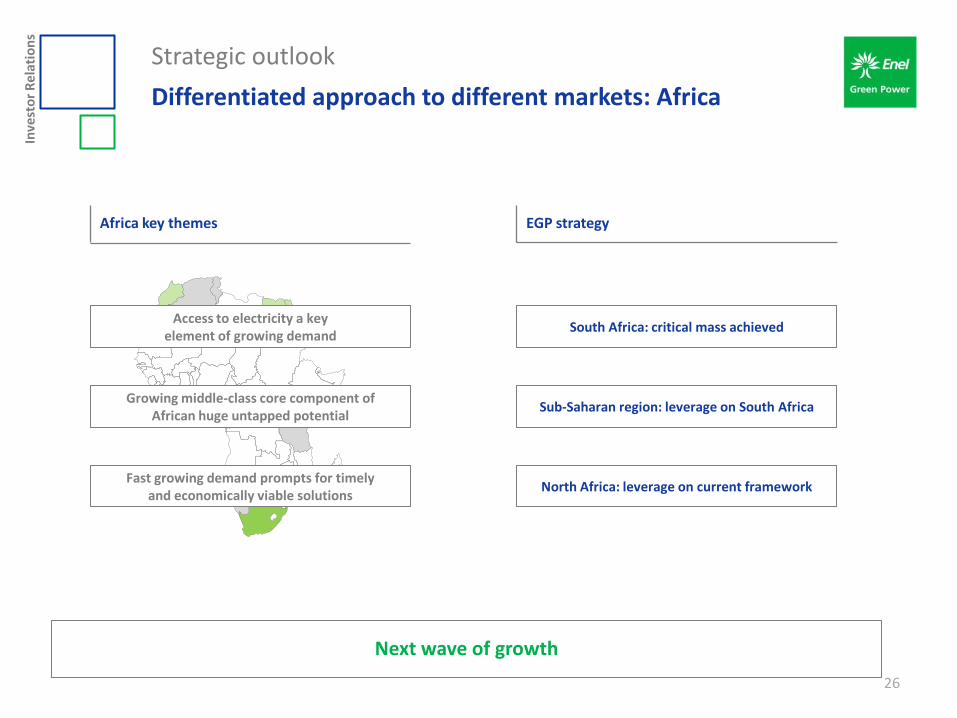
Differentiated approach to different markets: Africa
26
Africa key themes EGP strategy
Next wave of growth
Growing middle-class core component of African huge untapped potential
Access to electricity a key element of growing demand
Fast growing demand prompts for timely and economically viable solutions
Sub-Saharan region: leverage on South Africa
South Africa: critical mass achieved
North Africa: leverage on current framework
Inve
sto
r R
ela
tio
ns
Strategic outlook
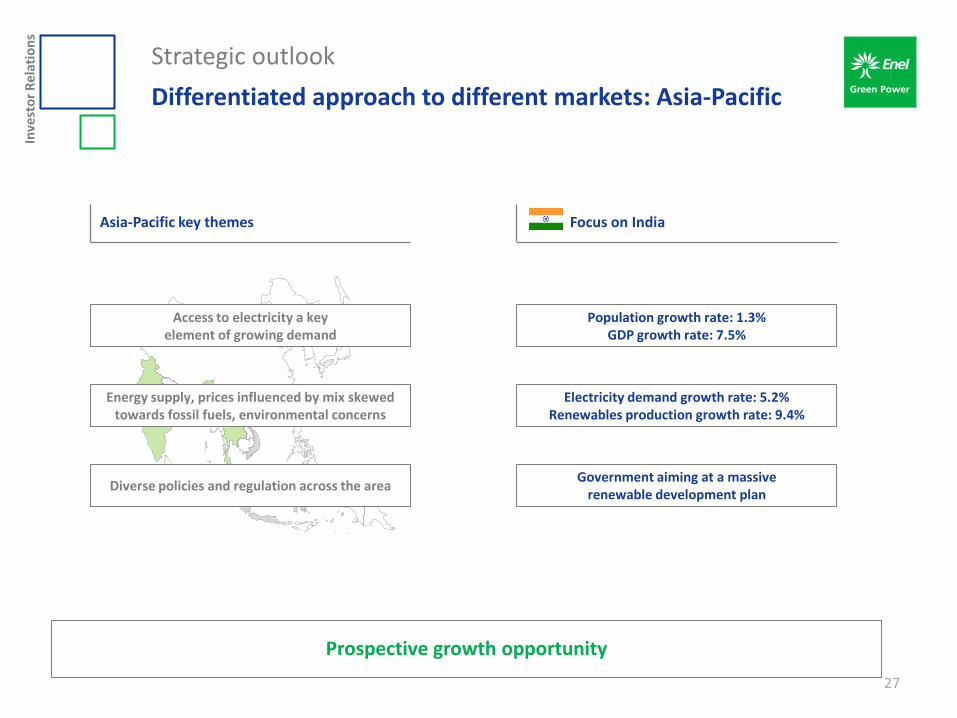
Differentiated approach to different markets: Asia-Pacific
27
Asia-Pacific key themes Focus on India
Prospective growth opportunity
Energy supply, prices influenced by mix skewed towards fossil fuels, environmental concerns
Access to electricity a key element of growing demand
Diverse policies and regulation across the area
Electricity demand growth rate: 5.2% Renewables production growth rate: 9.4%
Population growth rate: 1.3% GDP growth rate: 7.5%
Government aiming at a massive renewable development plan
Inve
sto
r R
ela
tio
ns
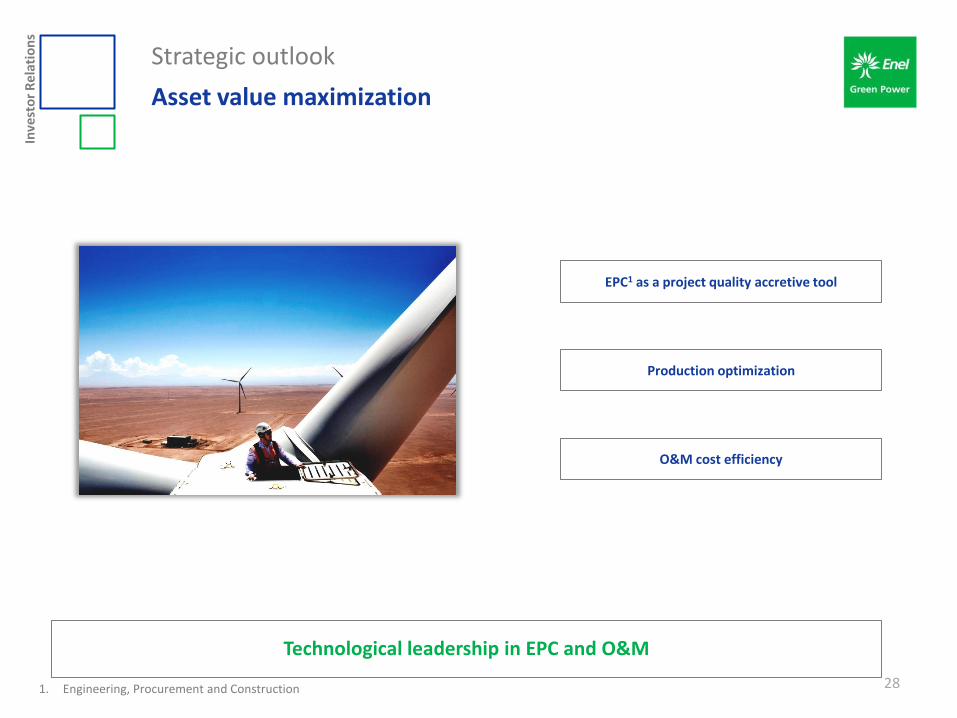
Strategic outlook
Asset value maximization
28
Technological leadership in EPC and O&M
Production optimization
EPC1 as a project quality accretive tool
O&M cost efficiency
1. Engineering, Procurement and Construction
Inve
sto
r R
ela
tio
ns
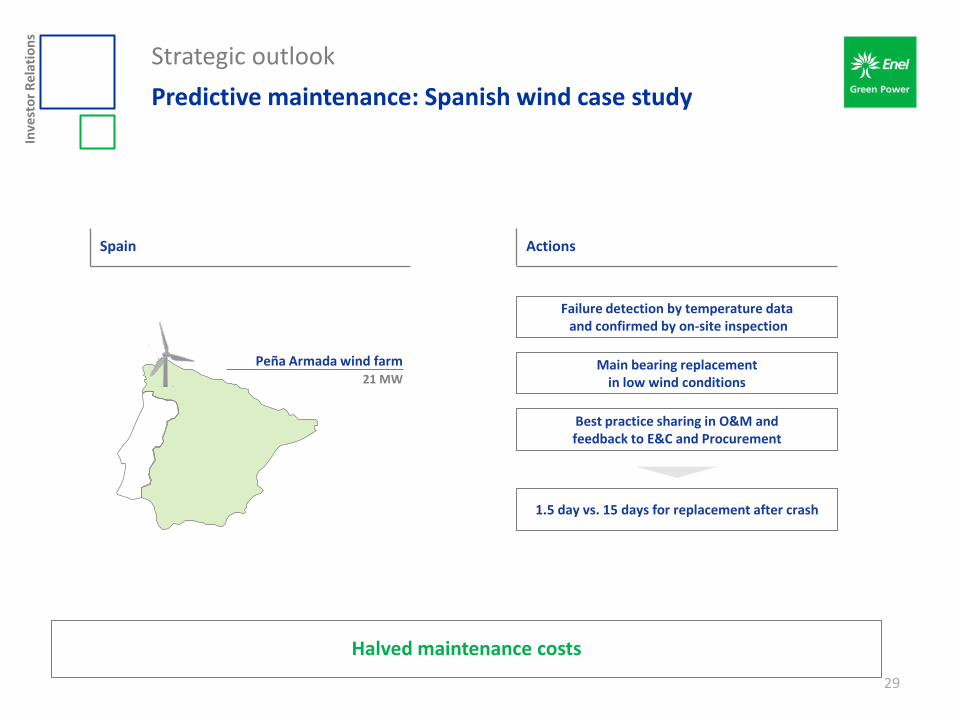
Strategic outlook
Predictive maintenance: Spanish wind case study
29
Spain Actions
Peña Armada wind farm 21 MW
Best practice sharing in O&M and feedback to E&C and Procurement
Failure detection by temperature data and confirmed by on-site inspection
1.5 day vs. 15 days for replacement after crash
Halved maintenance costs
Main bearing replacement in low wind conditions
Inve
sto
r R
ela
tio
ns
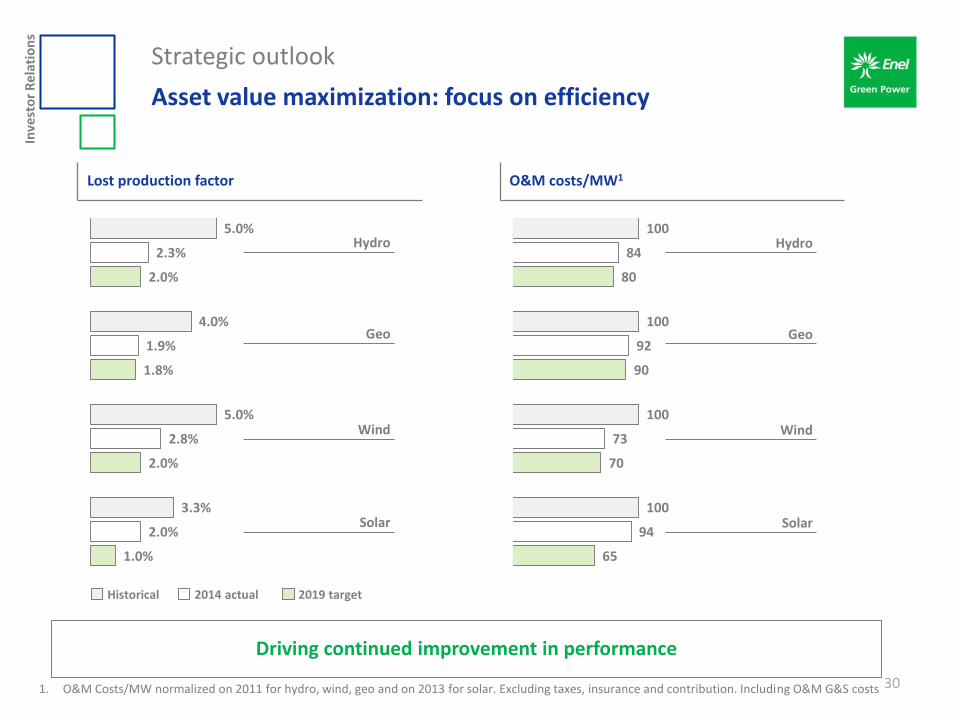
Strategic outlook
Asset value maximization: focus on efficiency
30
Driving continued improvement in performance
Lost production factor O&M costs/MW1
1.0%
2.0%
1.8%
2.0%
2.0%
2.8%
1.9%
2.3%
3.3%
5.0%
4.0%
5.0% Hydro
Geo
Wind
Solar
65
70
90
80
94
73
92
84
100
100
100
100 Hydro
Geo
Wind
Solar
Historical 2014 actual 2019 target
1. O&M Costs/MW normalized on 2011 for hydro, wind, geo and on 2013 for solar. Excluding taxes, insurance and contribution. Including O&M G&S costs
Inve
sto
r R
ela
tio
ns
Strategic outlook
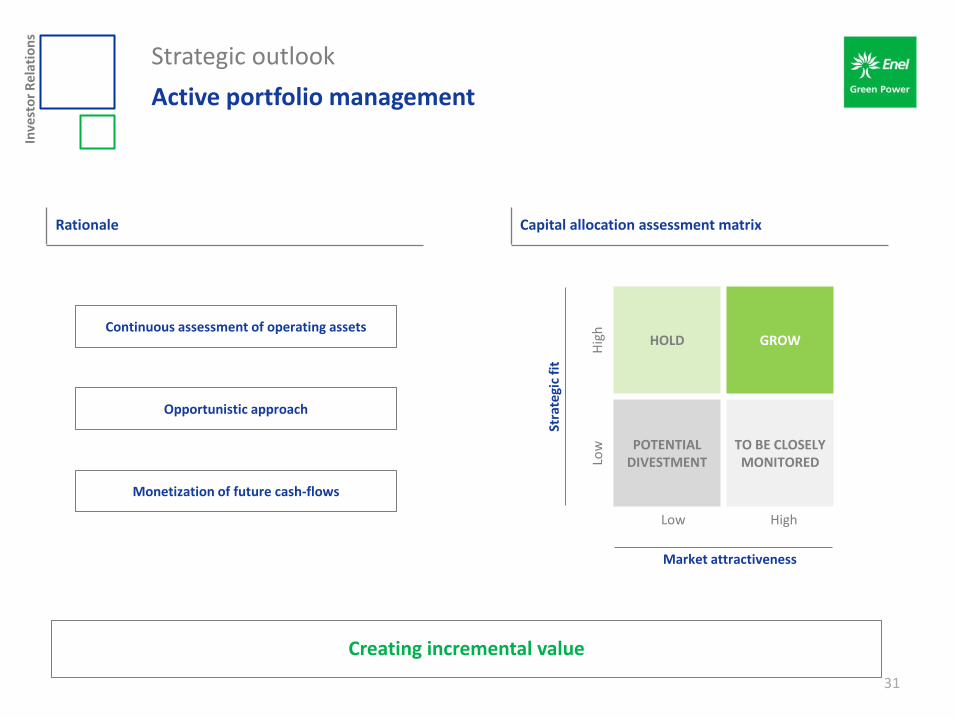
Active portfolio management
31
Creating incremental value
Rationale Capital allocation assessment matrix
Opportunistic approach
Continuous assessment of operating assets
Monetization of future cash-flows
HOLD GROW
POTENTIAL DIVESTMENT
TO BE CLOSELY MONITORED
Stra
tegi
c fi
t
Low
H
igh
Market attractiveness
Low High
Inve
sto
r R
ela
tio
ns
Strategic outlook
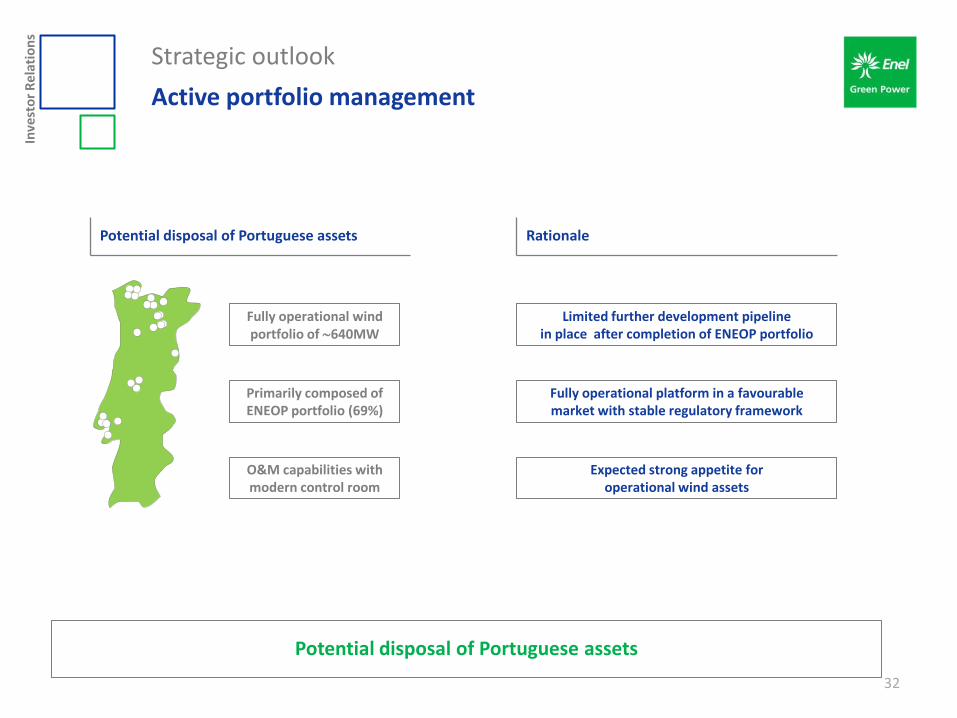
Active portfolio management
32
Potential disposal of Portuguese assets
Fully operational wind portfolio of 640MW
Primarily composed of ENEOP portfolio (69%)
O&M capabilities with modern control room
Fully operational platform in a favourable market with stable regulatory framework
Limited further development pipeline in place after completion of ENEOP portfolio
Expected strong appetite for operational wind assets
Potential disposal of Portuguese assets Rationale
Inve
sto
r R
ela
tio
ns
2015 Investor day
Agenda
33
Introduction Francesco Venturini, CEO
1Q 2015 consolidated results Francesco Venturini, CEO - Giulio Carone, CFO
Strategic outlook Francesco Venturini, CEO
2015 - 2019 financial outlook Giulio Carone, CFO
Closing remarks Francesco Venturini, CEO
Inve
sto
r R
ela
tio
ns
2015 - 2019 financial outlook
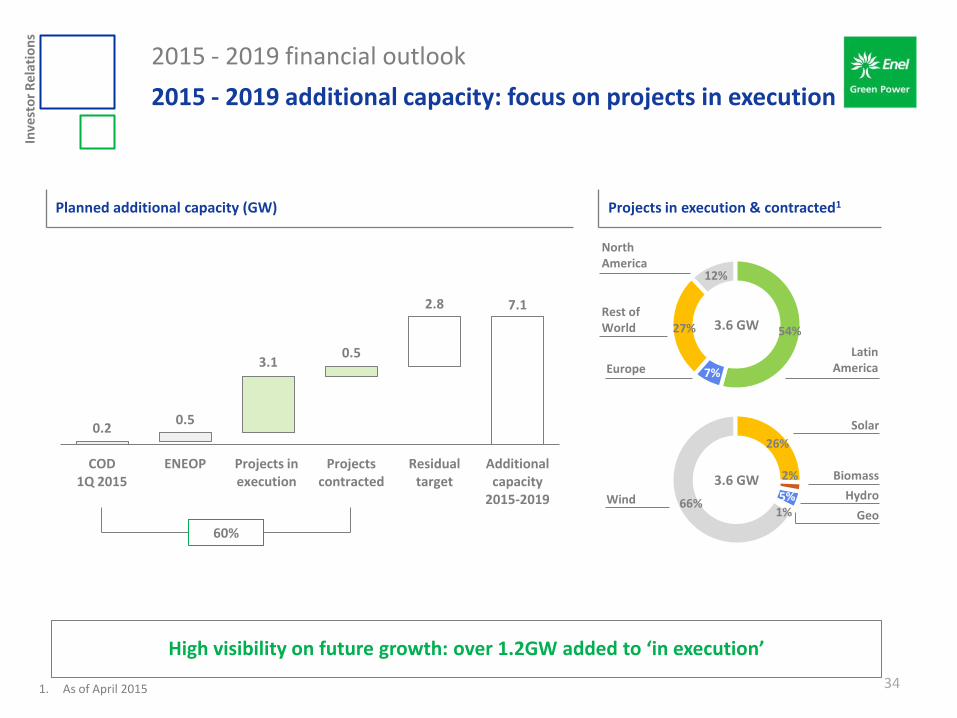
2015 - 2019 additional capacity: focus on projects in execution
34
High visibility on future growth: over 1.2GW added to ‘in execution’
Planned additional capacity (GW) Projects in execution & contracted1
27%
12%
54%
7%
3.6 GW Rest of World
Europe
Latin America
North America
60%
0.2 0.5
3.1 0.5
2.8 7.1
COD 1Q 2015
ENEOP Projects in execution
Projects contracted
Residual target
Additional capacity
2015-2019 Geo
5% 1%
66%
26%
2% 3.6 GW
Wind
Biomass
Solar
Hydro
1. As of April 2015
Inve
sto
r R
ela
tio
ns
2015 - 2019 financial outlook
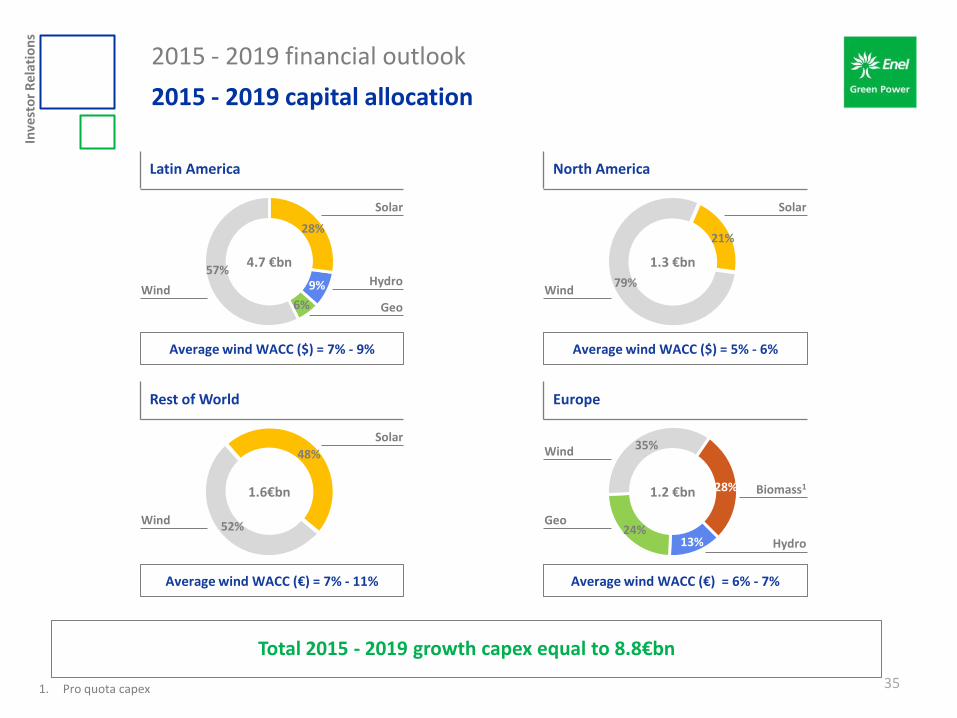
2015 - 2019 capital allocation
35
North America Latin America
Europe Rest of World
Average wind WACC (€) = 7% - 11% Average wind WACC (€) = 6% - 7%
Average wind WACC ($) = 5% - 6% Average wind WACC ($) = 7% - 9%
9%
6%
57%
28%
4.7 €bn
Wind
Geo
Solar
Hydro 79%
21%
1.3 €bn
Wind
Solar
52%
48%
1.6€bn
Wind
Solar
13% 24%
35%
28% 1.2 €bn
Geo
Biomass1
Hydro
Wind
1. Pro quota capex
Total 2015 - 2019 growth capex equal to 8.8€bn
Inve
sto
r R
ela
tio
ns
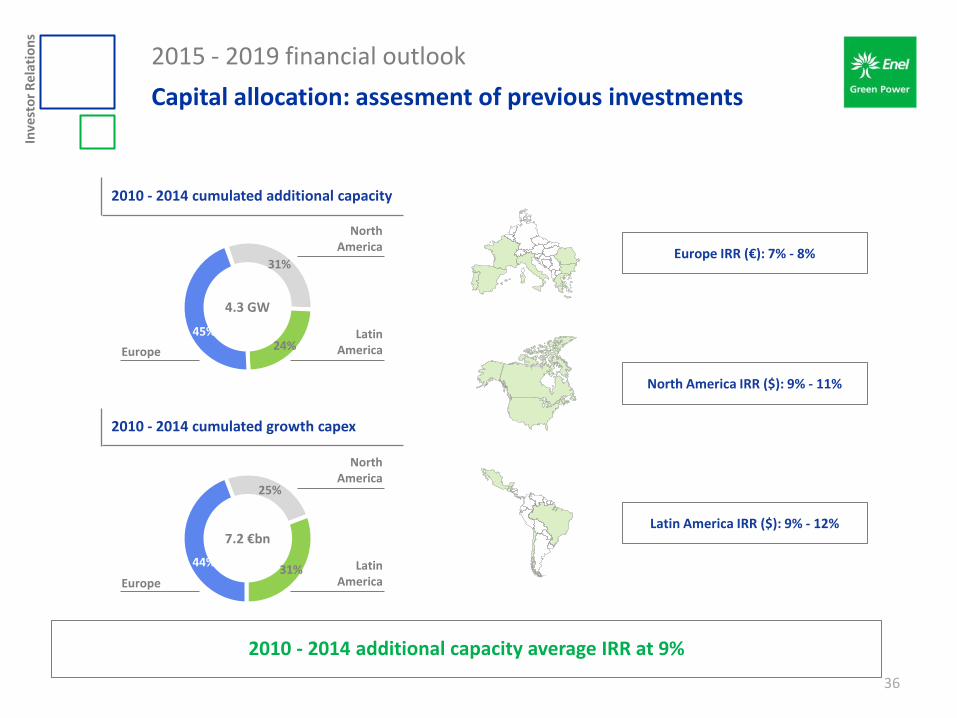
2015 - 2019 financial outlook
Capital allocation: assesment of previous investments
36
2010 - 2014 cumulated additional capacity
2010 - 2014 additional capacity average IRR at 9%
2010 - 2014 cumulated growth capex
North America IRR ($): 9% - 11%
Europe IRR (€): 7% - 8%
Latin America IRR ($): 9% - 12%
31%
24% 45%
4.3 GW
Europe
Latin America
North America
25%
31% 44%
7.2 €bn
Europe
Latin America
North America
Inve
sto
r R
ela
tio
ns
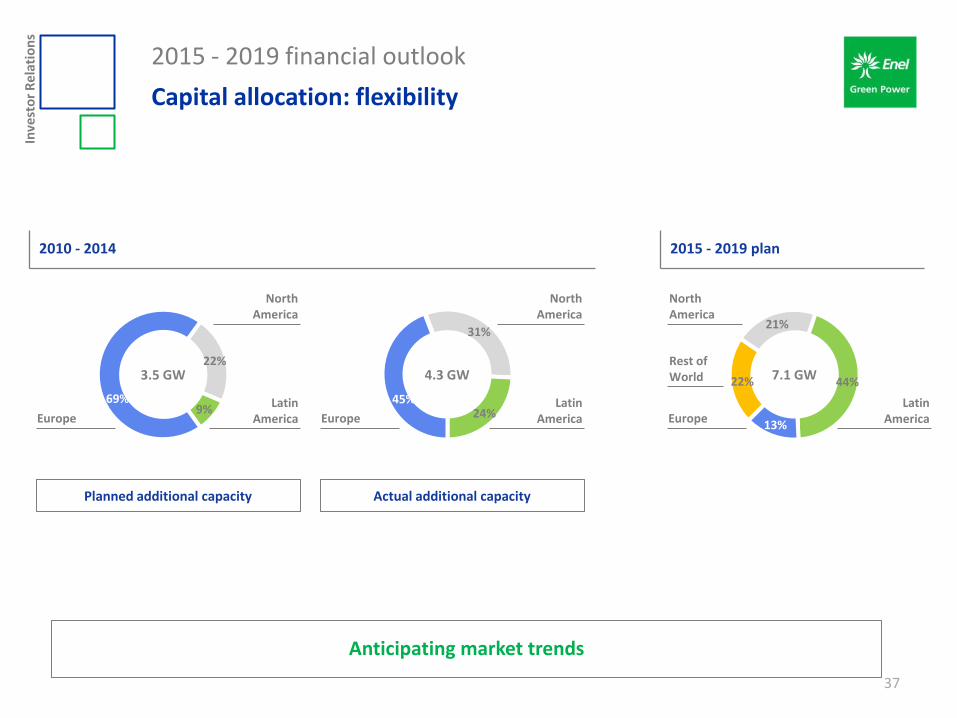
22%
9% 69%
3.5 GW
Europe Latin
America
North America
22%
21%
44%
13%
7.1 GW Rest of World
Europe Latin
America
North America
2015 - 2019 financial outlook
Capital allocation: flexibility
37
2010 - 2014 2015 - 2019 plan
Anticipating market trends
31%
24% 45%
4.3 GW
Europe Latin
America
North America
Planned additional capacity Actual additional capacity
Inve
sto
r R
ela
tio
ns
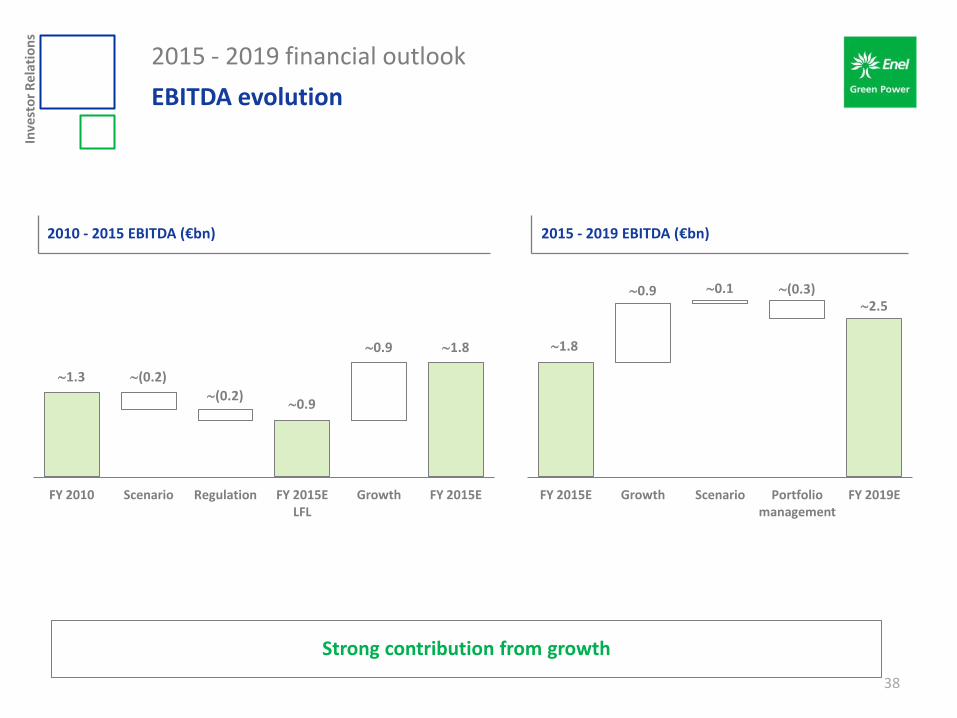
2015 - 2019 financial outlook
EBITDA evolution
38
0.9
1.3 (0.2)
(0.2)
0.9 1.8
FY 2010 Scenario Regulation FY 2015E LFL
Growth FY 2015E
2015 - 2019 EBITDA (€bn) 2010 - 2015 EBITDA (€bn)
1.8
0.9 0.1 (0.3) 2.5
FY 2015E Growth Scenario Portfolio management
FY 2019E
Strong contribution from growth
Inve
sto
r R
ela
tio
ns
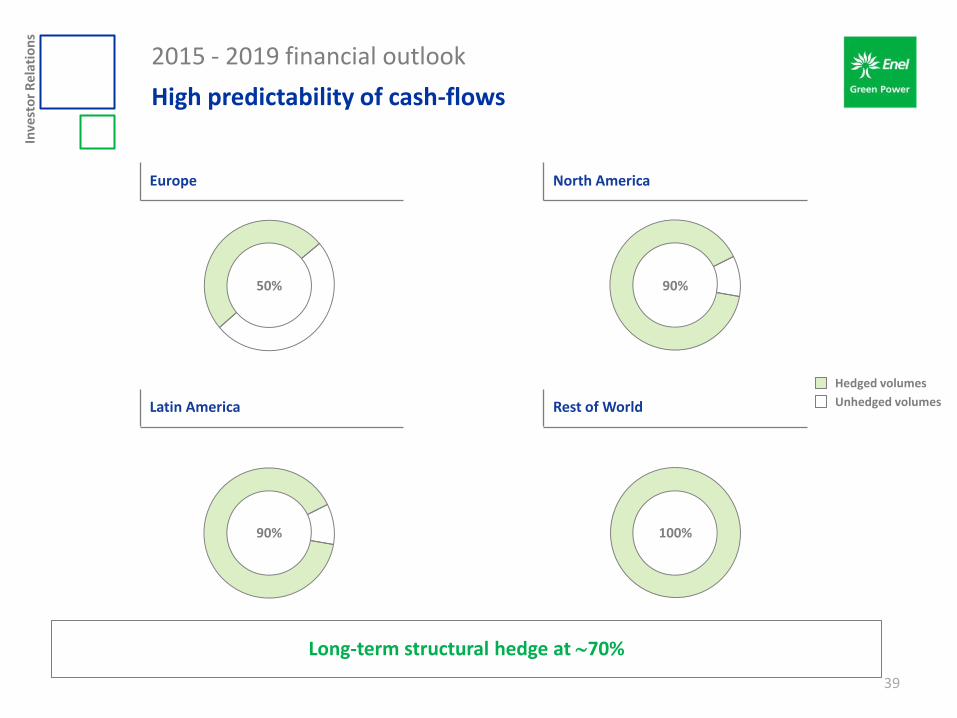
2015 - 2019 financial outlook
High predictability of cash-flows
39
North America Europe
Rest of World Latin America
50%
50%
Long-term structural hedge at 70%
90% 10% 100%
90%
10%
50% 90%
90% 100%
Unhedged volumes
Hedged volumes
Inve
sto
r R
ela
tio
ns
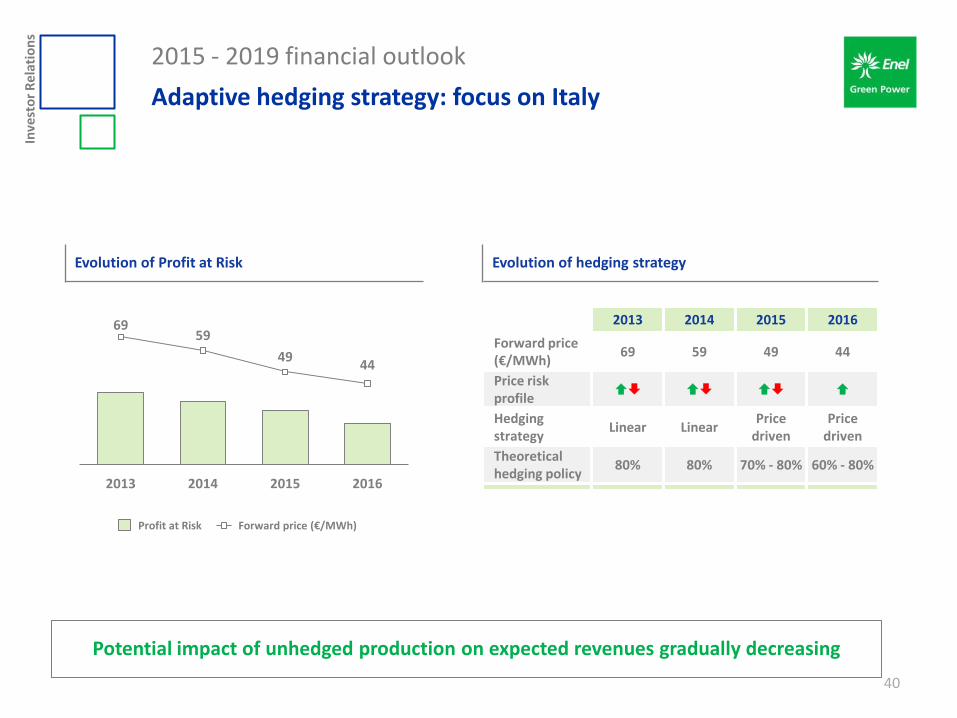
2015 - 2019 financial outlook
Adaptive hedging strategy: focus on Italy
40
Potential impact of unhedged production on expected revenues gradually decreasing
Evolution of Profit at Risk
69 59
49 44
0
50
100
150
200
250
300
2013 2014 2015 2016
Forward price (€/MWh) Profit at Risk
2013 2014 2015 2016
Forward price (€/MWh)
69 59 49 44
Price risk profile
Hedging strategy
Linear Linear Price
driven Price
driven
Theoretical hedging policy
80% 80% 70% - 80% 60% - 80%
Evolution of hedging strategy
Inve
sto
r R
ela
tio
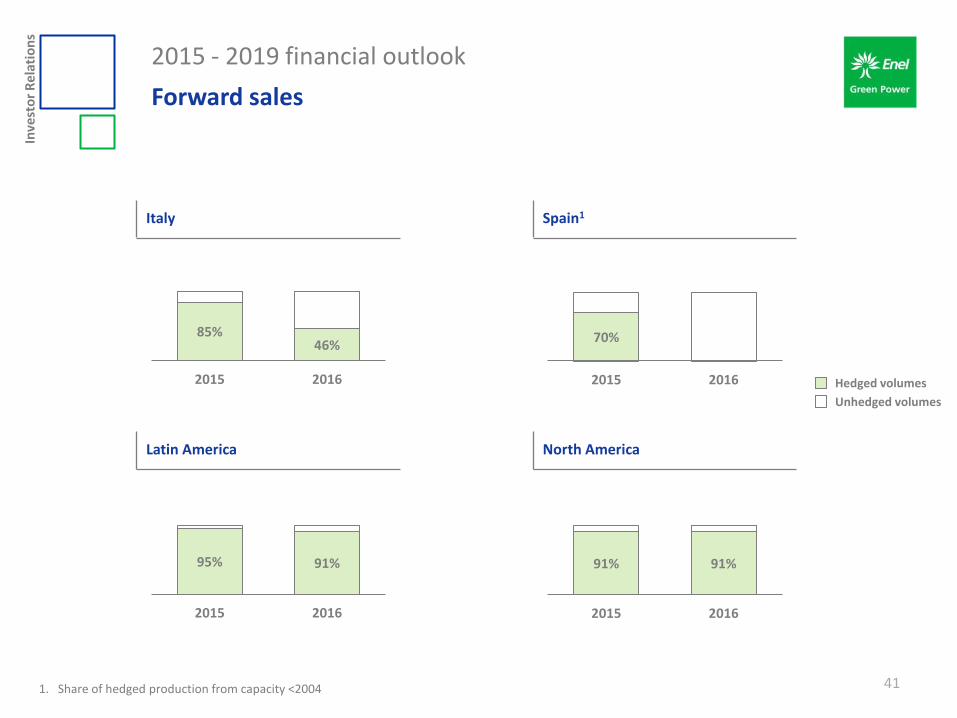
ns
Forward sales
41
Spain1 Italy
North America Latin America
91% 91%
2015 2016
85% 46%
2015 2016
70%
2015 2016
95% 91%
2015 2016
1. Share of hedged production from capacity <2004
Unhedged volumes
Hedged volumes
2015 - 2019 financial outlook
Inve
sto
r R
ela
tio
ns
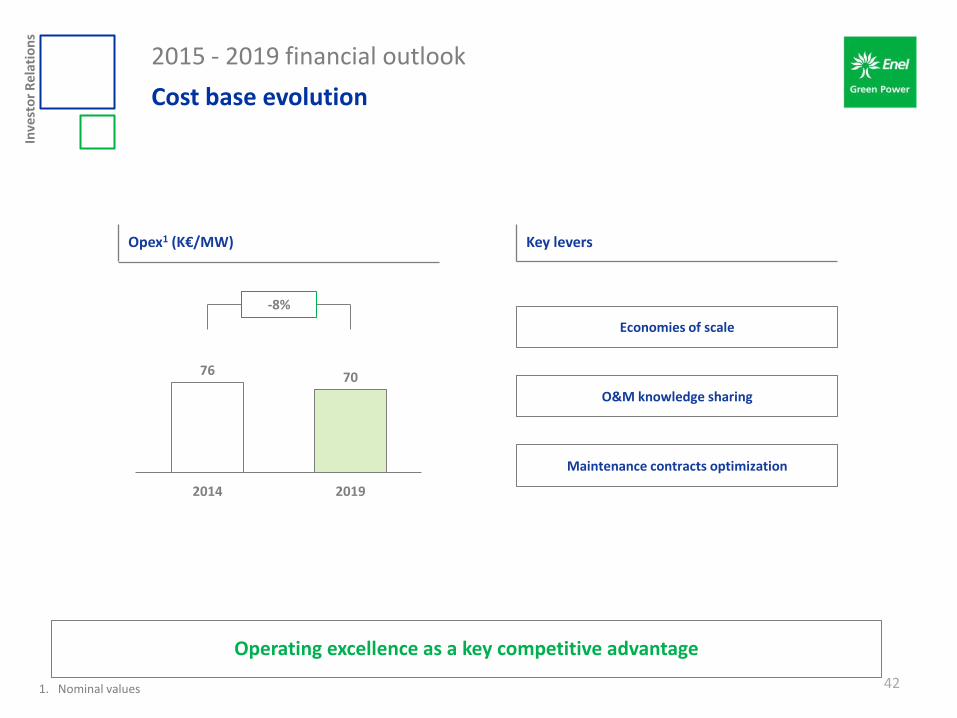
2015 - 2019 financial outlook
Cost base evolution
42
Opex1 (K€/MW)
76 70
2014 2019
-8%
O&M knowledge sharing
Economies of scale
Maintenance contracts optimization
Key levers
Operating excellence as a key competitive advantage
1. Nominal values
Inve
sto
r R
ela
tio
ns
2015 - 2019 financial outlook
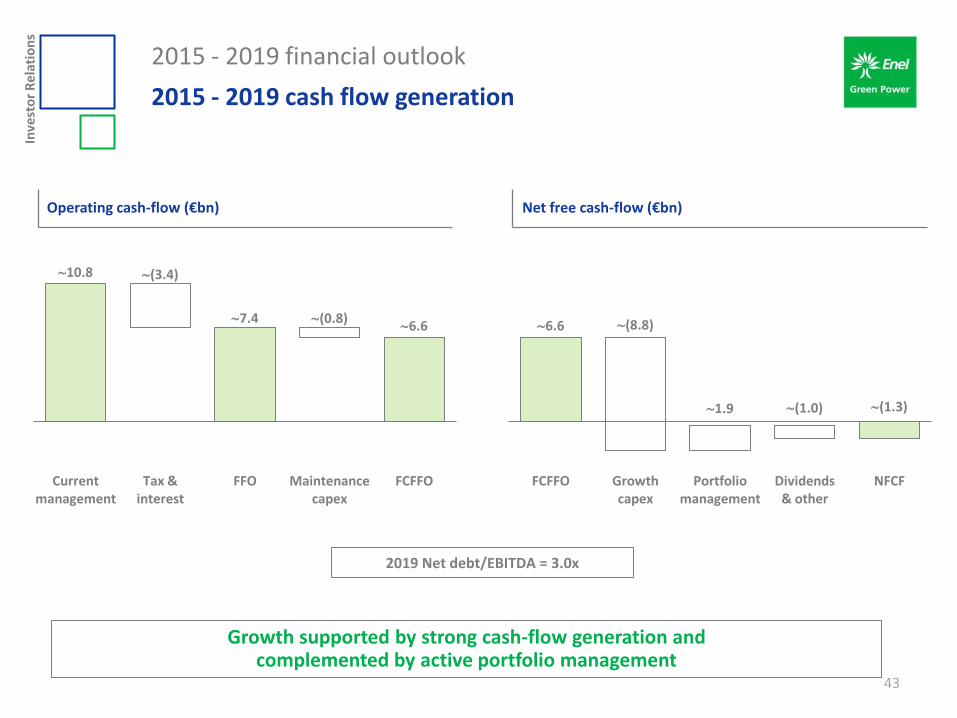
2015 - 2019 cash flow generation
43
Net free cash-flow (€bn) Operating cash-flow (€bn)
Growth supported by strong cash-flow generation and complemented by active portfolio management
2019 Net debt/EBITDA = 3.0x
10.8
7.4 6.6
(3.4)
(0.8)
Current management
Tax & interest
FFO Maintenance capex
FCFFO
6.6 (8.8)
1.9 (1.0) (1.3)
FCFFO Growth capex
Portfolio management
Dividends & other
NFCF
Inve
sto
r R
ela
tio
ns
2015 Investor day
Agenda
44
Introduction Francesco Venturini, CEO
1Q 2015 consolidated results Francesco Venturini, CEO - Giulio Carone, CFO
Strategic outlook Francesco Venturini, CEO
2015 - 2019 financial outlook Giulio Carone, CFO
Closing remarks Francesco Venturini, CEO
Inve
sto
r R
ela
tio
ns
2015 Investor day
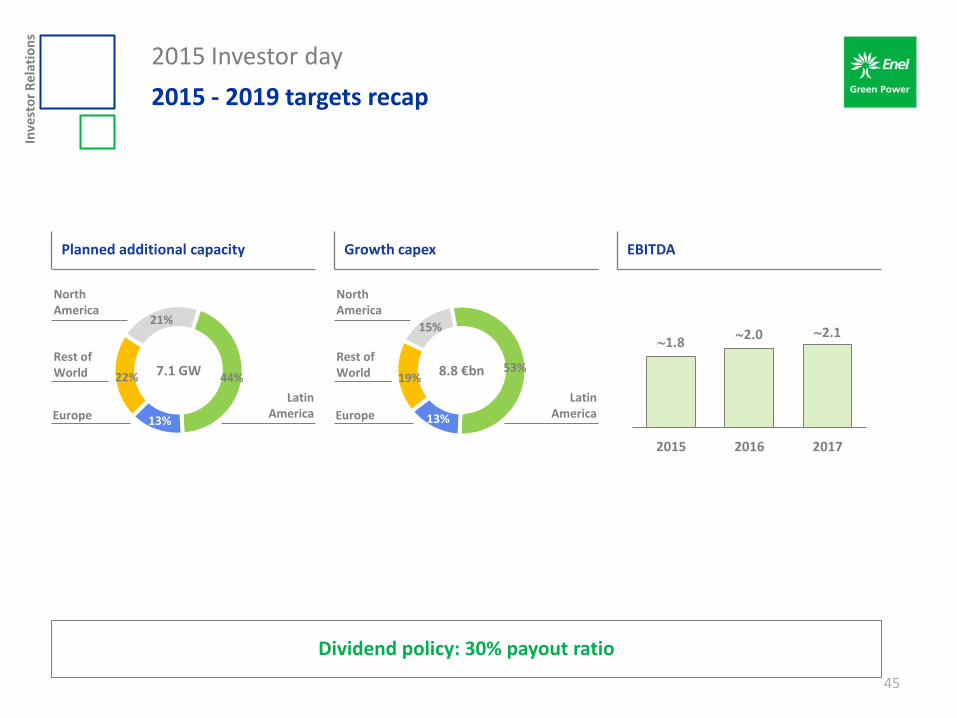
2015 - 2019 targets recap
45
EBITDA
1.8 2.0 2.1
2015 2016 2017
Dividend policy: 30% payout ratio
Growth capex
19%
15%
53%
13%
8.8 €bn Rest of World
Europe
Latin America
North America
Planned additional capacity
22%
21%
44%
13%
7.1 GW Rest of World
Europe
Latin America
North America
Inve
sto
r R
ela
tio
ns
2015 Investor day
Closing remarks
46
Global presence in attractive markets
Accelerating growth
Delivering attractive returns and predictable cash-flows
Actively managing asset portfolio
Maximizing efficiency
Rome – May 7, 2015
Enel Green Power 2015 Investor day Strategic annexes
Inve
sto
r R
ela
tio
ns
2015 Investor day - strategic annexes
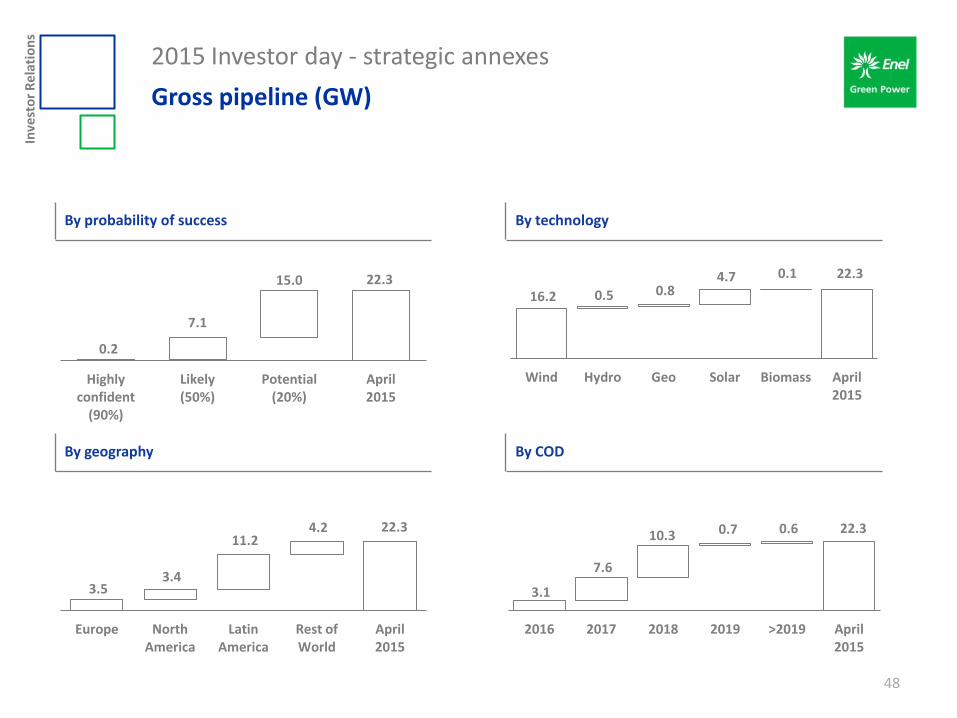
Gross pipeline (GW)
48
0.2
7.1
15.0 22.3
Highly confident
(90%)
Likely (50%)
Potential (20%)
April 2015
16.2 0.5 0.8 4.7 0.1 22.3
Wind Hydro Geo Solar Biomass April 2015
3.5 3.4
11.2 4.2 22.3
Europe North America
Latin America
Rest of World
April 2015
3.1
7.6
10.3 0.7 0.6 22.3
2016 2017 2018 2019 >2019 April 2015
By technology By probability of success
By COD By geography
Inve
sto
r R
ela
tio
ns
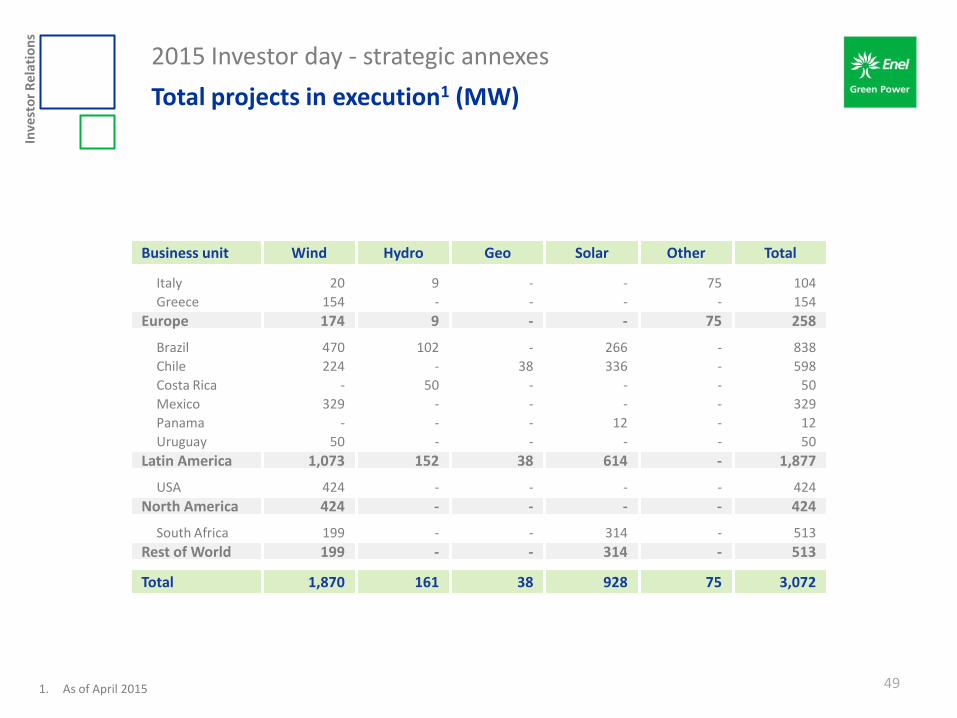
Business unit Wind Hydro Geo Solar Other Total
Italy 20 9 - - 75 104
Greece 154 - - - - 154
Europe 174 9 - - 75 258
Brazil 470 102 - 266 - 838
Chile 224 - 38 336 - 598
Costa Rica - 50 - - - 50
Mexico 329 - - - - 329
Panama - - - 12 - 12
Uruguay 50 - - - - 50
Latin America 1,073 152 38 614 - 1,877
USA 424 - - - - 424
North America 424 - - - - 424
South Africa 199 - - 314 - 513
Rest of World 199 - - 314 - 513
Total 1,870 161 38 928 75 3,072
2015 Investor day - strategic annexes
Total projects in execution1 (MW)
49 1. As of April 2015
Inve
sto
r R
ela
tio
ns
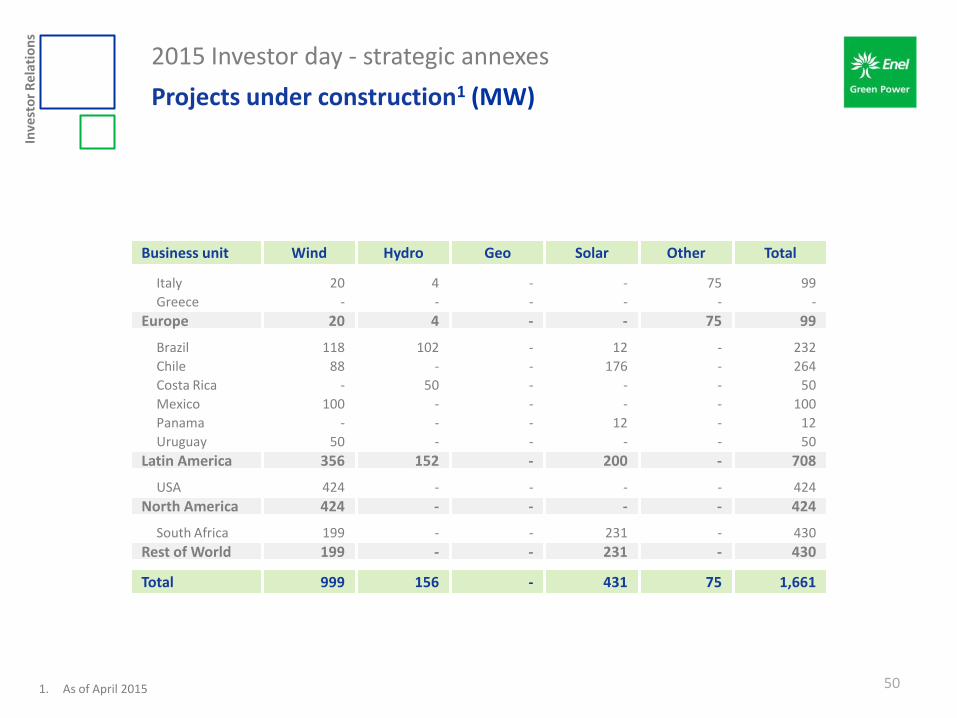
2015 Investor day - strategic annexes
Projects under construction1 (MW)
50
Business unit Wind Hydro Geo Solar Other Total
Italy 20 4 - - 75 99
Greece - - - - - -
Europe 20 4 - - 75 99
Brazil 118 102 - 12 - 232
Chile 88 - - 176 - 264
Costa Rica - 50 - - - 50
Mexico 100 - - - - 100
Panama - - - 12 - 12
Uruguay 50 - - - - 50
Latin America 356 152 - 200 - 708
USA 424 - - - - 424
North America 424 - - - - 424
South Africa 199 - - 231 - 430
Rest of World 199 - - 231 - 430
Total 999 156 - 431 75 1,661
1. As of April 2015
Inve
sto
r R
ela
tio
ns
2015 Investor day - strategic annexes
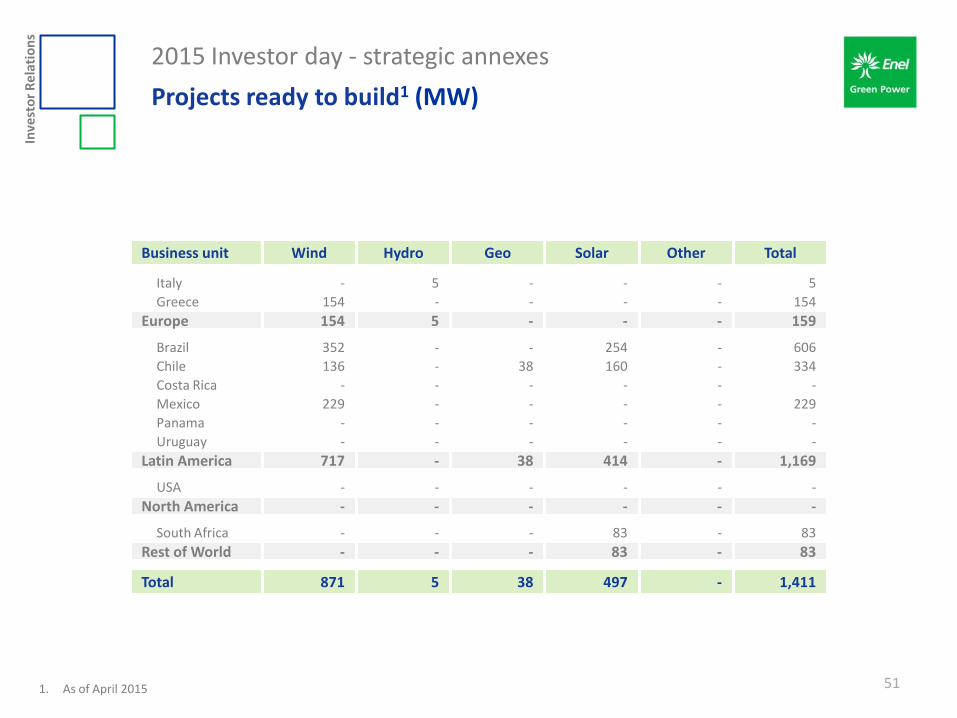
Projects ready to build1 (MW)
51
Business unit Wind Hydro Geo Solar Other Total
Italy - 5 - - - 5
Greece 154 - - - - 154
Europe 154 5 - - - 159
Brazil 352 - - 254 - 606
Chile 136 - 38 160 - 334
Costa Rica - - - - - -
Mexico 229 - - - - 229
Panama - - - - - -
Uruguay - - - - - -
Latin America 717 - 38 414 - 1,169
USA - - - - - -
North America - - - - - -
South Africa - - - 83 - 83
Rest of World - - - 83 - 83
Total 871 5 38 497 - 1,411
1. As of April 2015
Inve
sto
r R
ela
tio
ns
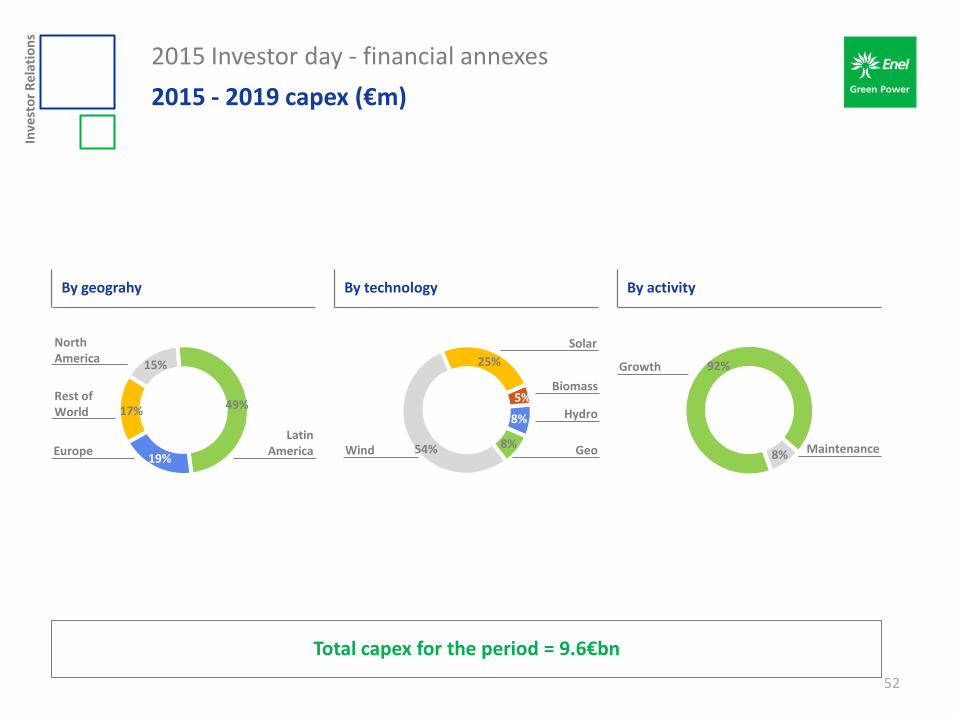
2015 Investor day - financial annexes
2015 - 2019 capex (€m)
52
Total capex for the period = 9.6€bn
By geograhy By technology By activity
92%
8%
Growth
Maintenance
17%
15%
49%
19%
Rest of World
Europe
Latin America
North America
8%
8% 54%
25%
5%
Wind
Biomass
Solar
Hydro
Geo
Inve
sto
r R
ela
tio
ns
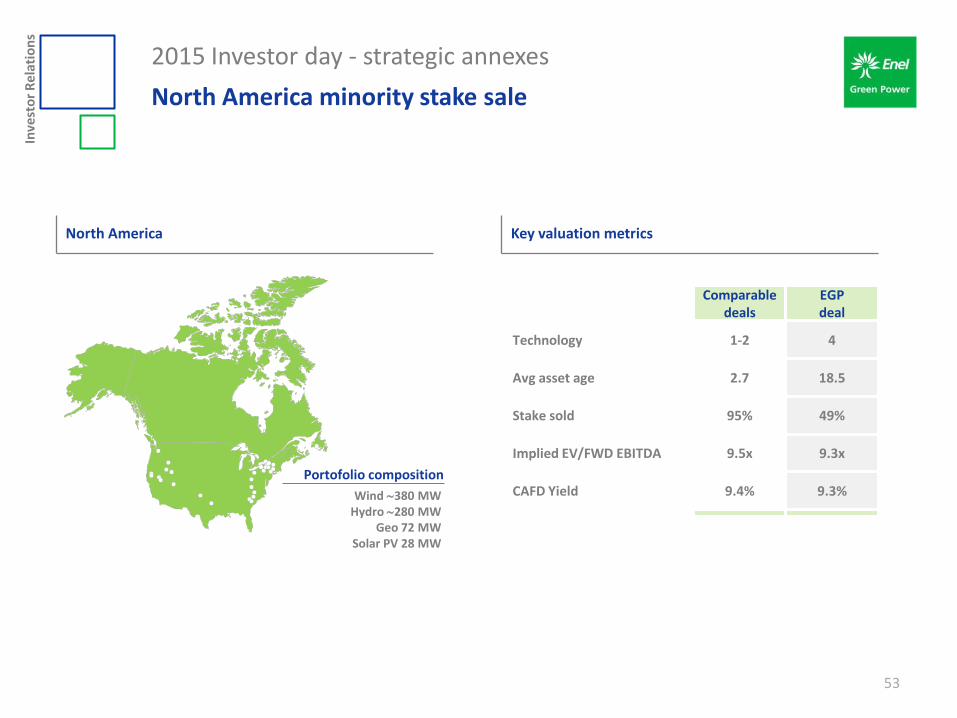
2015 Investor day - strategic annexes
North America minority stake sale
53
Key valuation metrics North America
Portofolio composition
Wind 380 MW Hydro 280 MW
Geo 72 MW Solar PV 28 MW
Comparable deals
EGP deal
Technology 1-2 4
Avg asset age 2.7 18.5
Stake sold 95% 49%
Implied EV/FWD EBITDA 9.5x 9.3x
CAFD Yield 9.4% 9.3%
Inve
sto
r R
ela
tio
ns
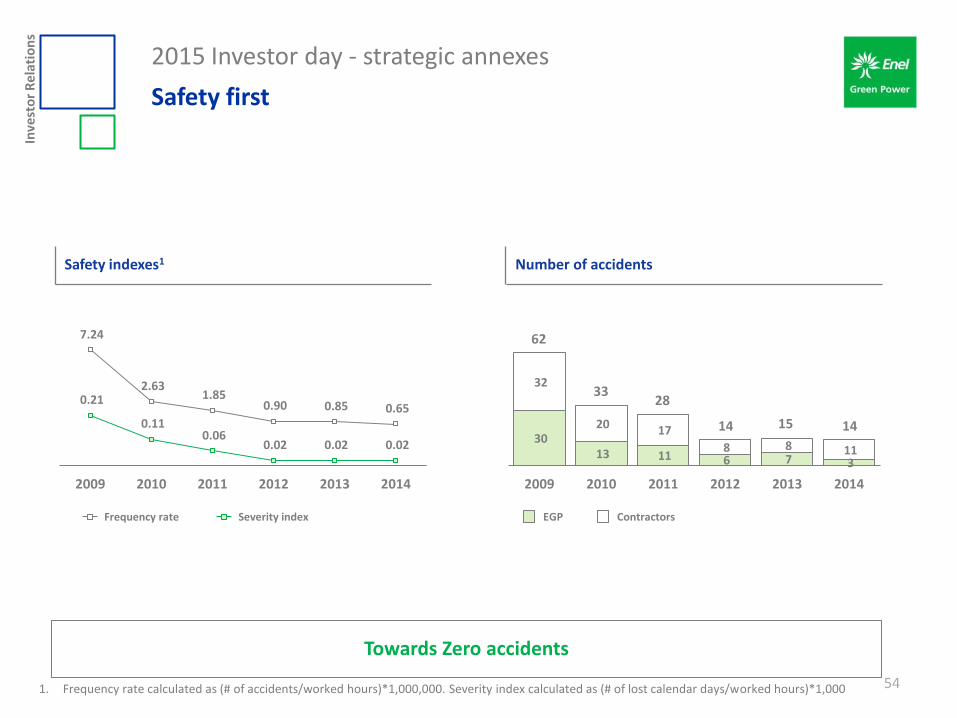
2015 Investor day - strategic annexes
Safety first
54 1. Frequency rate calculated as (# of accidents/worked hours)*1,000,000. Severity index calculated as (# of lost calendar days/worked hours)*1,000
Number of accidents Safety indexes1
Towards Zero accidents
30 13 11 6 7 3
32
20 17
8 8 11
2009 2010 2011 2012 2013 2014
62
33 28
14 15 14
7.24
2.63 1.85
0.90 0.85 0.65 0.21
0.11 0.06
0.02 0.02 0.02
-
0.05
0.10
0.15
0.20
0.25
0.30
0.35
0.40
0.45
0.50
2009 2010 2011 2012 2013 2014
Severity index EGP Contractors Frequency rate

Rome – May 7, 2015
Enel Green Power 2015 Investor day Financial annexes 1Q 2015 results
Inve
sto
r R
ela
tio
ns
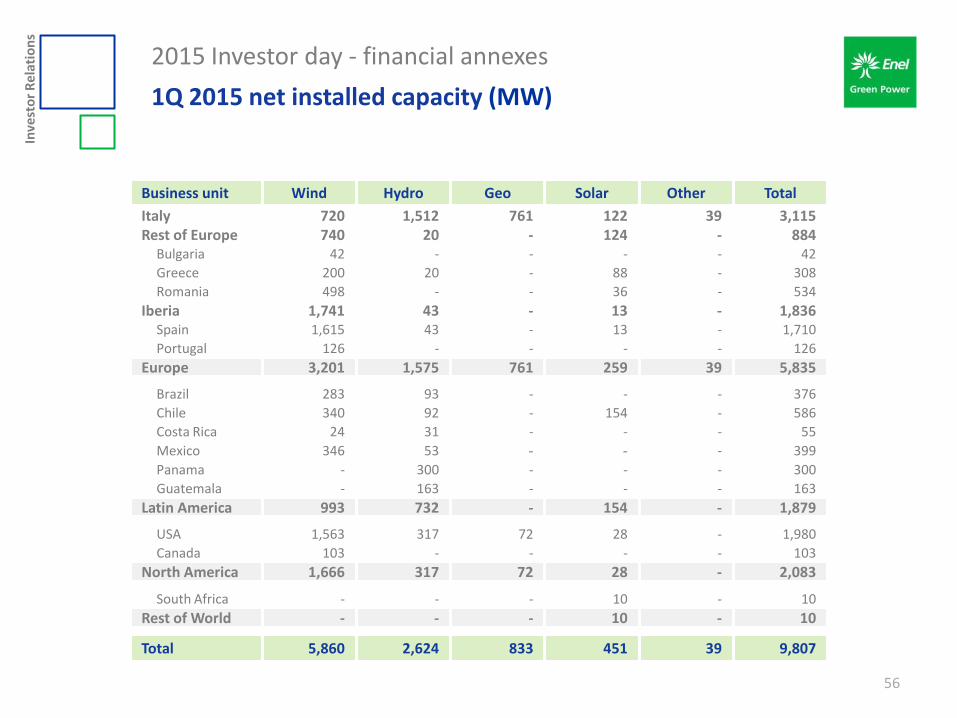
2015 Investor day - financial annexes 1Q 2015 net installed capacity (MW)
56
Business unit Wind Hydro Geo Solar Other Total
Italy 720 1,512 761 122 39 3,115 Rest of Europe 740 20 - 124 - 884
Bulgaria 42 - - - - 42
Greece 200 20 - 88 - 308
Romania 498 - - 36 - 534
Iberia 1,741 43 - 13 - 1,836 Spain 1,615 43 - 13 - 1,710
Portugal 126 - - - - 126
Europe 3,201 1,575 761 259 39 5,835
Brazil 283 93 - - - 376
Chile 340 92 - 154 - 586
Costa Rica 24 31 - - - 55
Mexico 346 53 - - - 399
Panama - 300 - - - 300
Guatemala - 163 - - - 163
Latin America 993 732 - 154 - 1,879
USA 1,563 317 72 28 - 1,980
Canada 103 - - - - 103
North America 1,666 317 72 28 - 2,083
South Africa - - - 10 - 10
Rest of World - - - 10 - 10
Total 5,860 2,624 833 451 39 9,807
Inve
sto
r R
ela
tio
ns
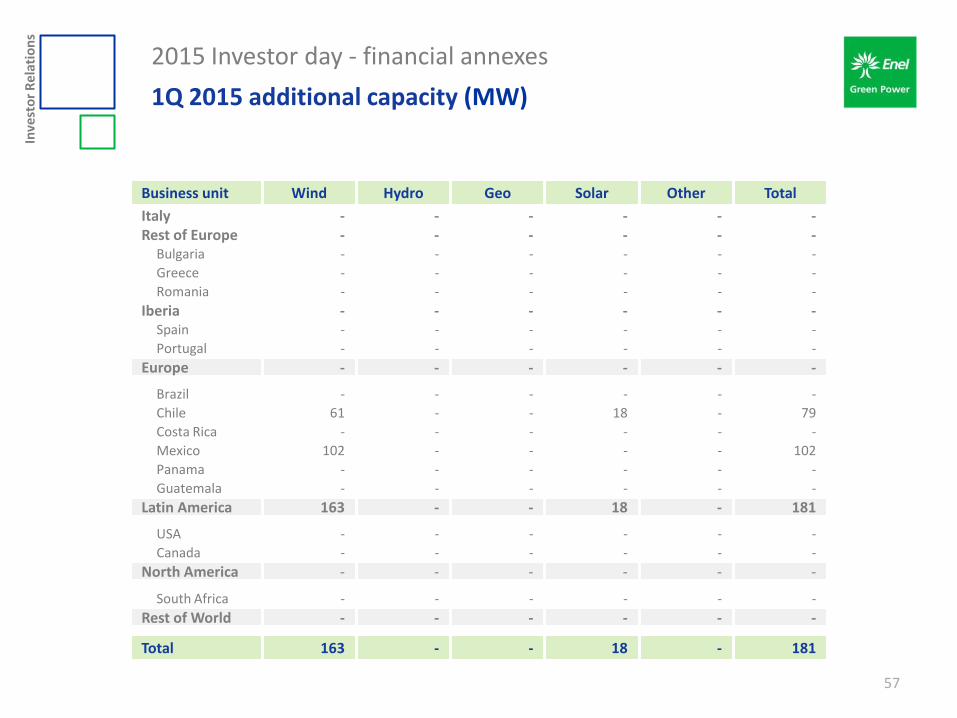
2015 Investor day - financial annexes
1Q 2015 additional capacity (MW)
57
Business unit Wind Hydro Geo Solar Other Total
Italy - - - - - - Rest of Europe - - - - - -
Bulgaria - - - - - -
Greece - - - - - -
Romania - - - - - -
Iberia - - - - - - Spain - - - - - -
Portugal - - - - - -
Europe - - - - - -
Brazil - - - - - -
Chile 61 - - 18 - 79
Costa Rica - - - - - -
Mexico 102 - - - - 102
Panama - - - - - -
Guatemala - - - - - -
Latin America 163 - - 18 - 181
USA - - - - - -
Canada - - - - - -
North America - - - - - -
South Africa - - - - - -
Rest of World - - - - - -
Total 163 - - 18 - 181
Inve
sto
r R
ela
tio
ns
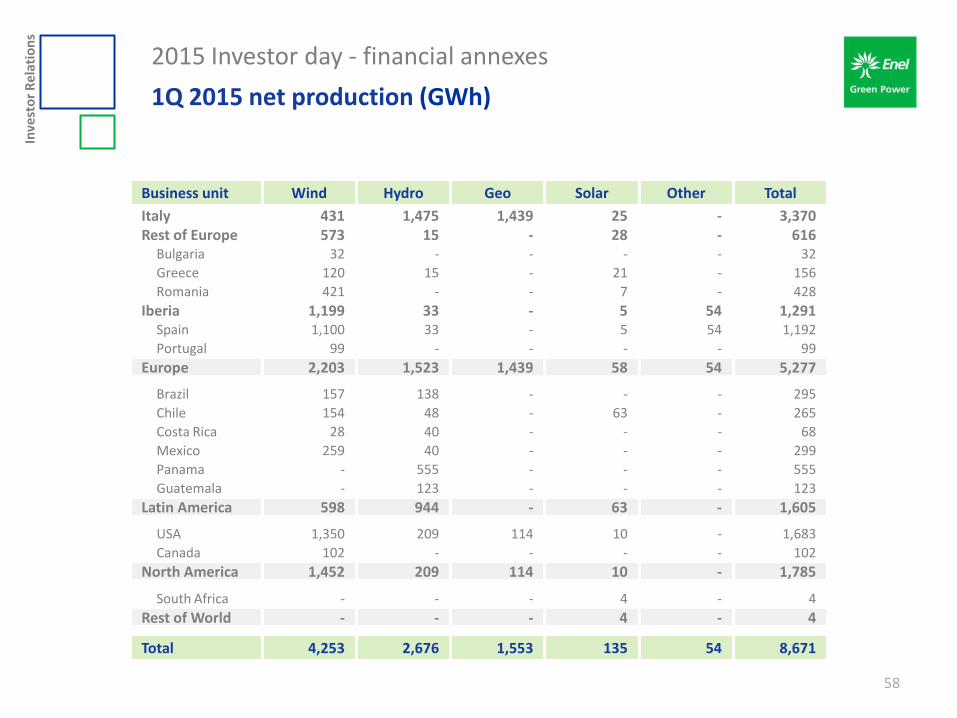
2015 Investor day - financial annexes
1Q 2015 net production (GWh)
58
Business unit Wind Hydro Geo Solar Other Total
Italy 431 1,475 1,439 25 - 3,370 Rest of Europe 573 15 - 28 - 616
Bulgaria 32 - - - - 32
Greece 120 15 - 21 - 156
Romania 421 - - 7 - 428
Iberia 1,199 33 - 5 54 1,291 Spain 1,100 33 - 5 54 1,192
Portugal 99 - - - - 99
Europe 2,203 1,523 1,439 58 54 5,277
Brazil 157 138 - - - 295
Chile 154 48 - 63 - 265
Costa Rica 28 40 - - - 68
Mexico 259 40 - - - 299
Panama - 555 - - - 555
Guatemala - 123 - - - 123
Latin America 598 944 - 63 - 1,605
USA 1,350 209 114 10 - 1,683
Canada 102 - - - - 102
North America 1,452 209 114 10 - 1,785
South Africa - - - 4 - 4
Rest of World - - - 4 - 4
Total 4,253 2,676 1,553 135 54 8,671
Inve
sto
r R
ela
tio
ns
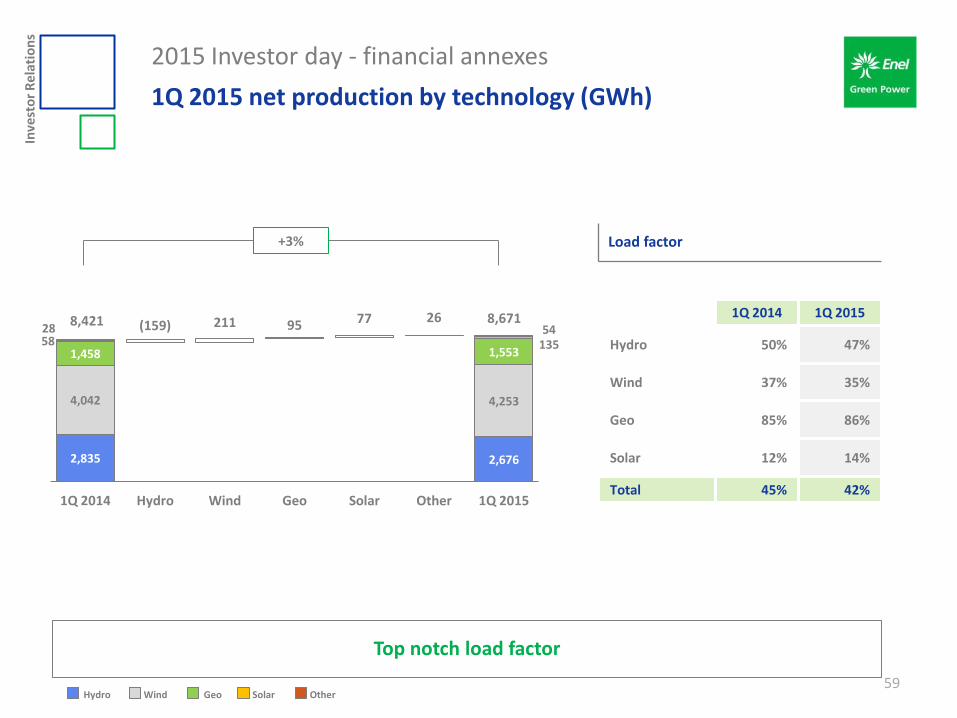
2,835 2,676
4,042
(159) 211 95 77 26
4,253
1,458 1,553 58 135 28 54
1Q 2014 Hydro Wind Geo Solar Other 1Q 2015
2015 Investor day - financial annexes
1Q 2015 net production by technology (GWh)
59
Load factor
Top notch load factor
Hydro Geo Wind Solar Other
1Q 2014 1Q 2015
Hydro 50% 47%
Wind 37% 35%
Geo 85% 86%
Solar 12% 14%
Total 45% 42%
8,421 8,671
+3%

Inve
sto
r R
ela
tio
ns
2015 Investor day - financial annexes
1Q 2015 net production by geography (GWh)
60
+3% Load factor
5,728 5,281
1,009
(447) 596 101
1,605
1,684 1,785
1Q 2014 Europe Latin America
North America
1Q 2015
1Q 2014 1Q 2015
Europe 45% 42%
Latin America 43% 46%
North America 46% 40%
Total 45% 42%
8,421 8,671
1. Includes South Africa
1
Europe Latin America North America
Inve
sto
r R
ela
tio
ns
2015 Investor day - financial annexes
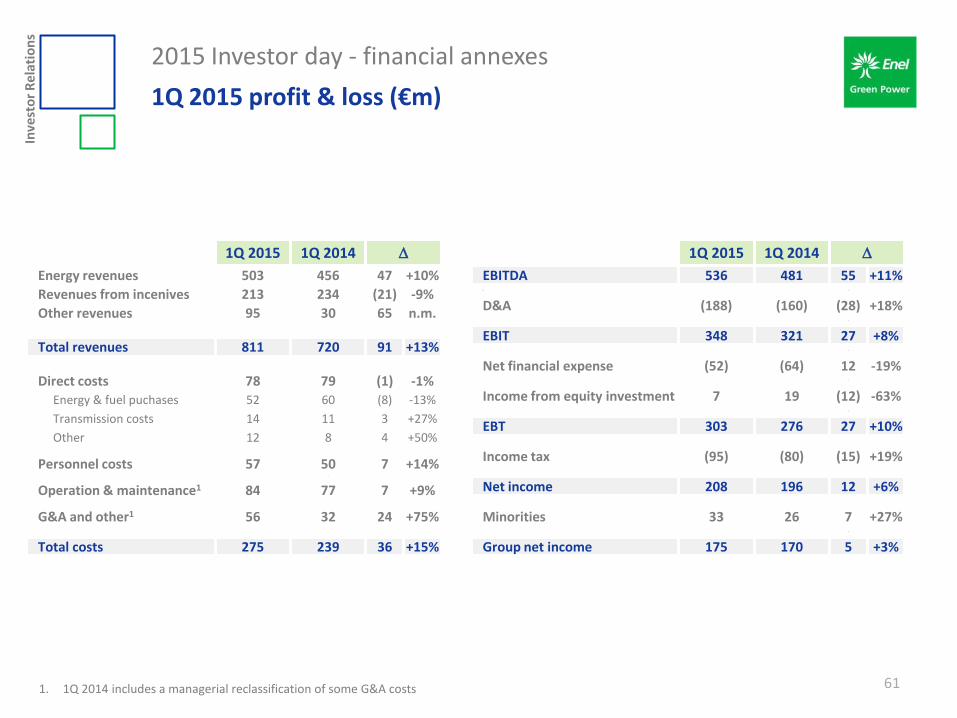
1Q 2015 profit & loss (€m)
61
1Q 2015 1Q 2014
Energy revenues 503 456 47 +10%
Revenues from incenives 213 234 (21) -9%
Other revenues 95 30 65 n.m.
Total revenues 811 720 91 +13%
Direct costs 78 79 (1) -1% Energy & fuel puchases 52 60 (8) -13%
Transmission costs 14 11 3 +27%
Other 12 8 4 +50%
Personnel costs 57 50 7 +14% - 7 -
Operation & maintenance1 84 77 7 +9% - -
G&A and other1 56 32 24 +75% - -
Total costs 275 239 36 +15%
1Q 2015 1Q 2014
EBITDA 536 481 55 +11% 00 0
D&A (188) (160) (28) +18% 0
EBIT 348 321 27 +8% 0
Net financial expense (52) (64) 12 -19% 0
Income from equity investment 7 19 (12) -63% 0
EBT 303 276 27 +10% -
Income tax (95) (80) (15) +19% -
Net income 208 196 12 +6% -
Minorities 33 26 7 +27% 0
Group net income 175 170 5 +3%
1. 1Q 2014 includes a managerial reclassification of some G&A costs
Inve
sto
r R
ela
tio
ns
2015 Investor day - financial annexes
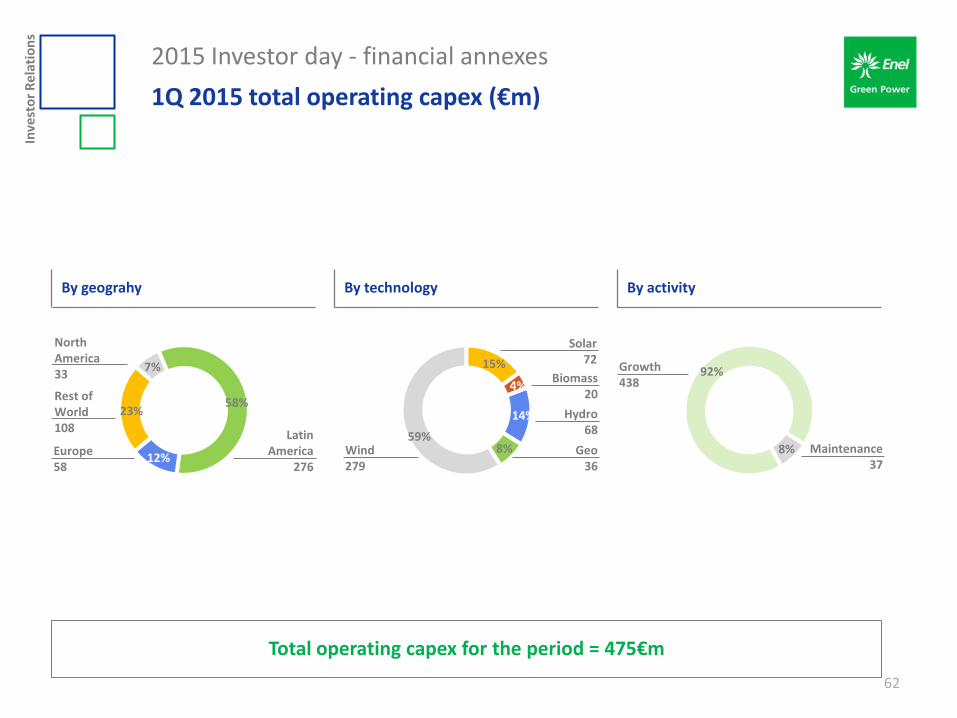
1Q 2015 total operating capex (€m)
62
Total operating capex for the period = 475€m
By geograhy By technology By activity
92%
8%
Growth 438
Maintenance 37
23%
7%
58%
12%
Rest of World 108
Europe 58
Latin America
276
North America 33
14%
8% 59%
15%
4%
Wind 279
Biomass 20
Solar 72
Hydro 68
Geo 36
Inve
sto
r R
ela
tio
ns
2015 Investor day - financial annexes
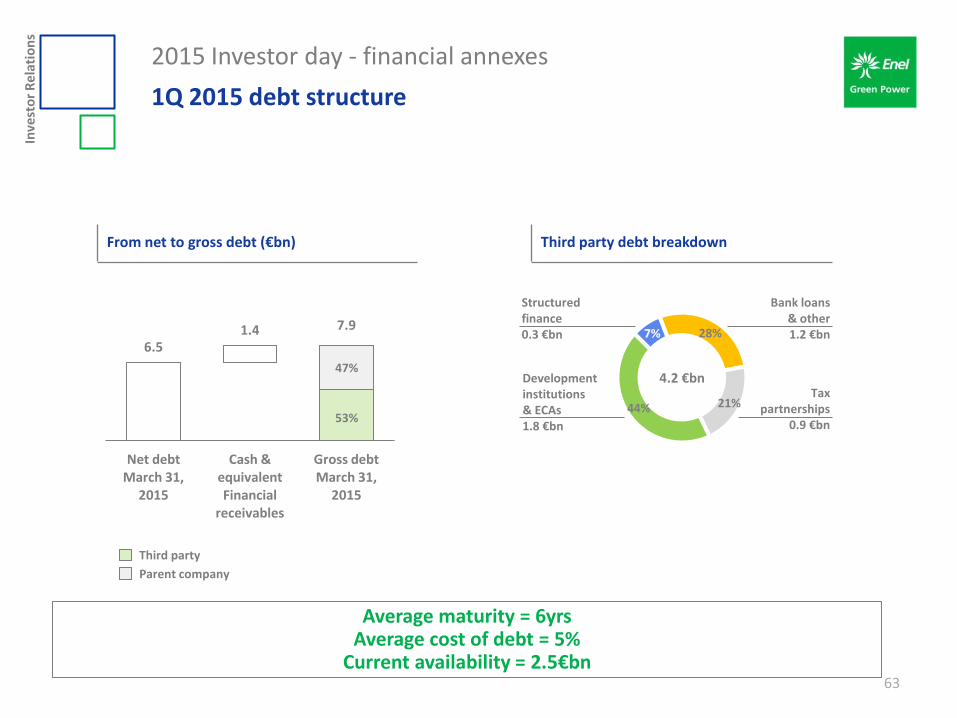
1Q 2015 debt structure
63
Average maturity = 6yrs Average cost of debt = 5%
Current availability = 2.5€bn
From net to gross debt (€bn) Third party debt breakdown
Parent company
Third party
6.5
7.9 1.4
Net debt March 31,
2015
Cash & equivalent Financial
receivables
Gross debt March 31,
2015
53%
47%
28%
21% 44%
7%
Development institutions & ECAs 1.8 €bn
Bank loans & other 1.2 €bn
Tax partnerships
0.9 €bn
Structured finance 0.3 €bn
4.2 €bn
Inve
sto
r R
ela
tio
ns
2015 Investor day - financial annexes
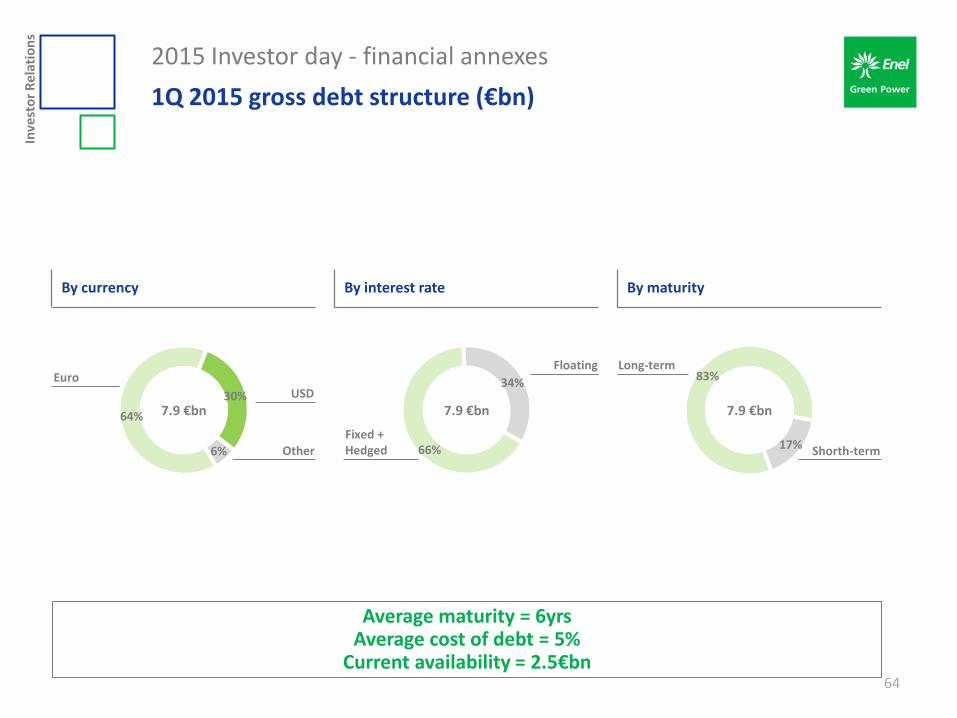
1Q 2015 gross debt structure (€bn)
64
By currency By interest rate By maturity
66%
34%
Fixed + Hedged
Floating 83%
17%
Long-term
Shorth-term
64%
30%
6%
Euro
Other
USD
7.9 €bn 7.9 €bn 7.9 €bn
Average maturity = 6yrs Average cost of debt = 5%
Current availability = 2.5€bn
Inve
sto
r R
ela
tio
ns
2015 Investor day - financial annexes
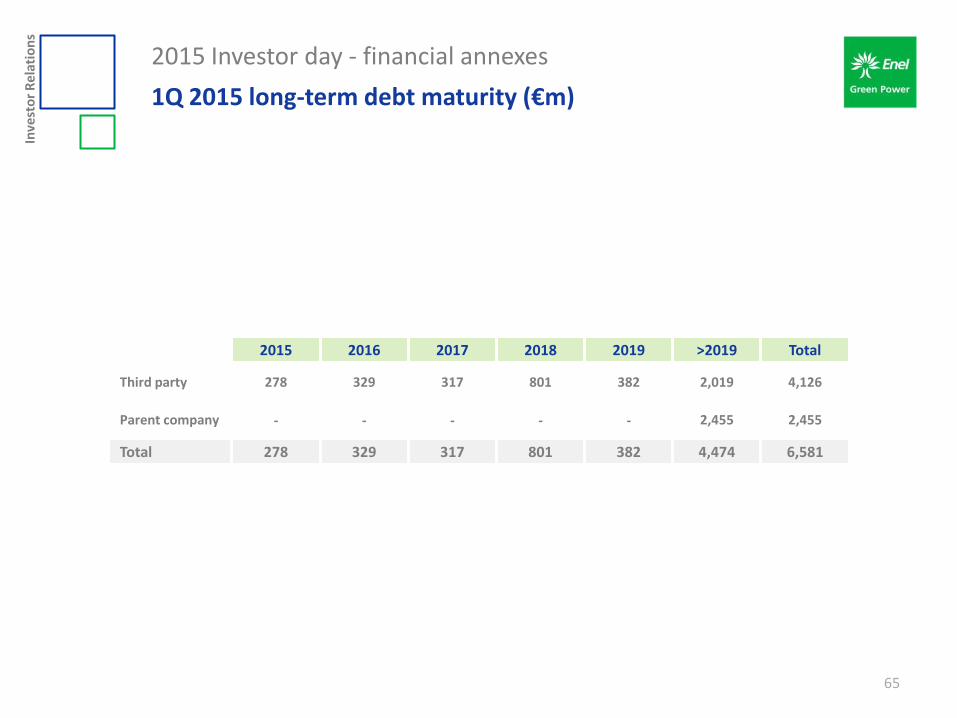
1Q 2015 long-term debt maturity (€m)
65
2015 2016 2017 2018 2019 >2019 Total
Third party 278 329 317 801 382 2,019 4,126
Parent company - - - - - 2,455 2,455
Total 278 329 317 801 382 4,474 6,581
Inve
sto
r R
ela
tio
ns
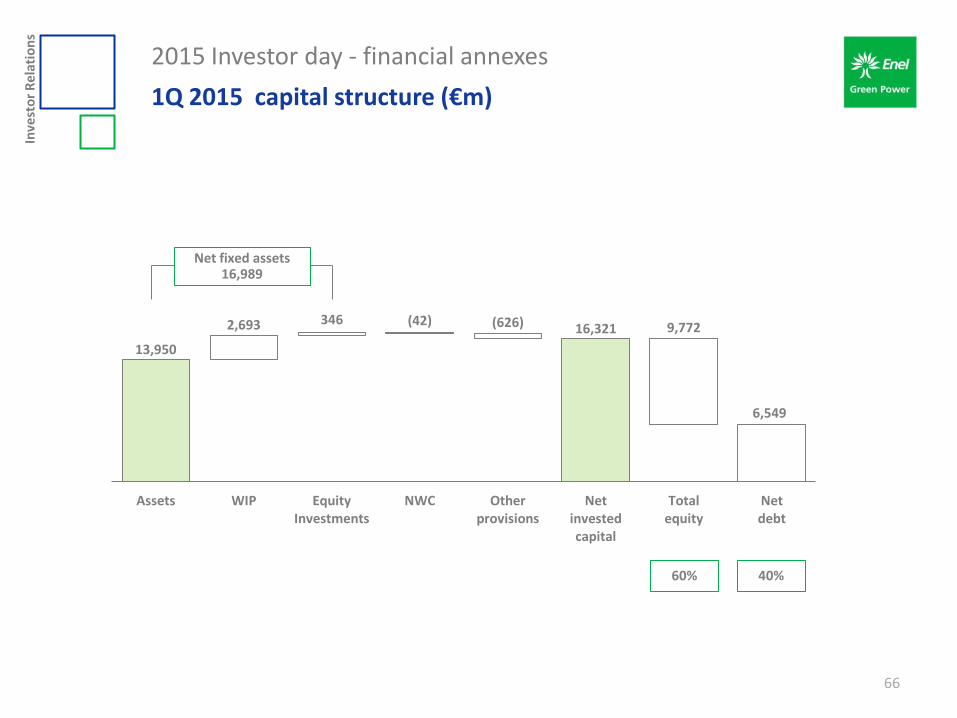
13,950
16,321 2,693 346 (42) (626) 9,772
6,549
Assets WIP Equity Investments
NWC Other provisions
Net invested capital
Total equity
Net debt
2015 Investor day - financial annexes
1Q 2015 capital structure (€m)
66
60% 40%
Net fixed assets 16,989
Inve
sto
r R
ela
tio
ns
2015 Investor day
Disclaimer
67
This presentation contains certain forward-looking statements that reflect the Company’s management’s current views with respect to future events and financial and operational performance of the Company and its subsidiaries. These forward looking statements are based on Enel Green Power S.p.A.’s current expectations and projections about future events. Because these forward-looking statements are subject to risks and uncertainties, actual future results or performance may differ materially from those expressed in or implied by these statements due to any number of different factors, many of which are beyond the ability of Enel Green Power S.p.A. to control or estimate precisely, including changes in the regulatory environment, future market developments, fluctuations in the price and other risks. You are cautioned not to place undue reliance on the forward-looking statements contained herein, which are made only as of the date of this presentation. Enel Green Power S.p.A. does not undertake any obligation to publicly release any updates or revisions to any forward-looking statements to reflect events or circumstances after the date of this presentation. This presentation does not constitute a recommendation regarding the securities of the Company.
Pursuant to article 154-bis, par 2, of the Consolidated Financial Act of February 24, 1998, the executive in charge of preparing the corporate accounting documents at Enel Green Power S.p.A., Giulio Antonio Carone, declares that the accounting information contained herein correspond to document results, books and accounting records.
Inve
sto
r R
ela
tio
ns
2015 Investor day
Contact us
68
Donatella Izzo, IR manager Elena Accorinti Federico Caggia Alessandro Marchi Etienne Martoïa
T: +39 06 8305 9104 F: +39 06 6444 2758
E-mail: [email protected] Web site: www.enelgreenpower.com