Effects of Panel Orientation on Solar Integration into
Electric Gridsby M. Doroshenko
ISS4E Lab, University of Waterloo2015.09.29

Problem Definition
Increasing solar penetration leads to Duck Curve• Curtailment
• caused by over-generation• bad because solar is expensive
• both CAPEX and FIT
• Stability problems• reverse flows and balance loss
• Ramping• evening ramp (sunset)• micro weather variations• macro weather variations
http://insideenergy.org/2014/10/02/ie-questions-why-is-california-trying-to-behead-the-duck

Why is Ramping Bad?
• Ramping leads to increased thermal power plant cycling• “Cycling refers to the operation of electric generating units at varying load levels,
including … load following … in response to changes in system [net] load requirements”[1]
• Estimating impact (WWSIS)• Renewables “increase annual cycling costs by $35-$157 million, or 13%-24%, across
the Western Interconnection” [2]• Negligible in comparison to fuel displaced by renewables ($7 billion)• Emissions associated with cycling are estimated to be negligible as well• Still, there might be some potential for financial improvement
1) N Kumar, P Besuner, S Lefton, D Agan, and D Hilleman. Power plant cycling costs. Contract, 303:275-3000, 2012.2) www.nrel.gov/electricity/transmission/western-wind-2.html

Idea
• What parameters of solar panels can be manipulated to alleviate the aforementioned problems?
• What if changing panel orientation can help?• installation stage only
• Mechanism: East- and West-facing panels may cut the peaks and flatten the ramps
Positioning Parameters
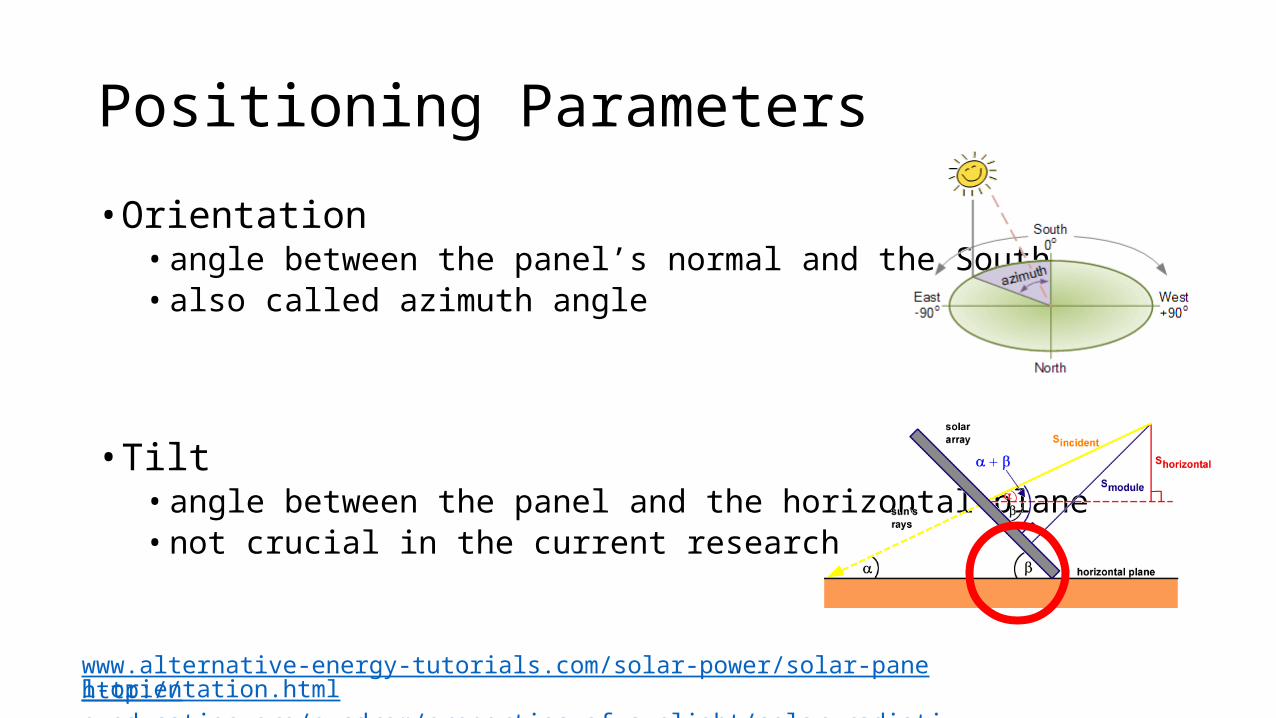
• Orientation• angle between the panel’s normal and the South• also called azimuth angle
• Tilt• angle between the panel and the horizontal plane• not crucial in the current research
http://pveducation.org/pvcdrom/properties-of-sunlight/solar-radiation-on-tilted-surfacewww.alternative-energy-tutorials.com/solar-power/solar-panel-orientation.html

Model Formulation• Single agent• independent system operator (e.g. IESO)
• Linear programming model• objective: minimize expenditures and emissions
• Iterative vs Basic Approach• simulation is repeated several times• solar installed capacity is aggregated over time• Advantages:
• dynamic solar penetration• easy to adjust for multi-agent modeling
• Many simplifying assumptions: to be explored later

Model Formulation: Overview
•Objective:
•Balance constraint:
•Incremental constraint:*non-negativity constraints are not presented

Model Formulation: Objective
Variables:• qj – quantity of panels with orientation j to be installed (J=13)• Gi – aggregate conventional generation at time i (I=8760)
Parameters:• γi,j – solar power production level for time i and orientation j (HOMER)• rj – feed-in tariff imposed for orientation j ( j: r∀ j =25 cents/kWh)• pi – price of thermal power imposed for time i ( i:∀ pi =5 cents/kWh)• λ – carbon tax factor (monetized control knob)

Model Formulation: Constraints
Variables:• qj – quantity of panels with orientation j to be installed (J=13)• Gi – aggregate conventional generation at time i (I=8760)
Parameters:• Hi – aggregate load at time i (22.8 kW max, scaled down from IESO)• ej – existing panels with orientation j at this iteration (aggregated over time)• Q – incremental limit per step (10 panels per year)• γi,j – solar power production level for time i and orientation j (HOMER)

Incremental and Aggregate View
Analysis
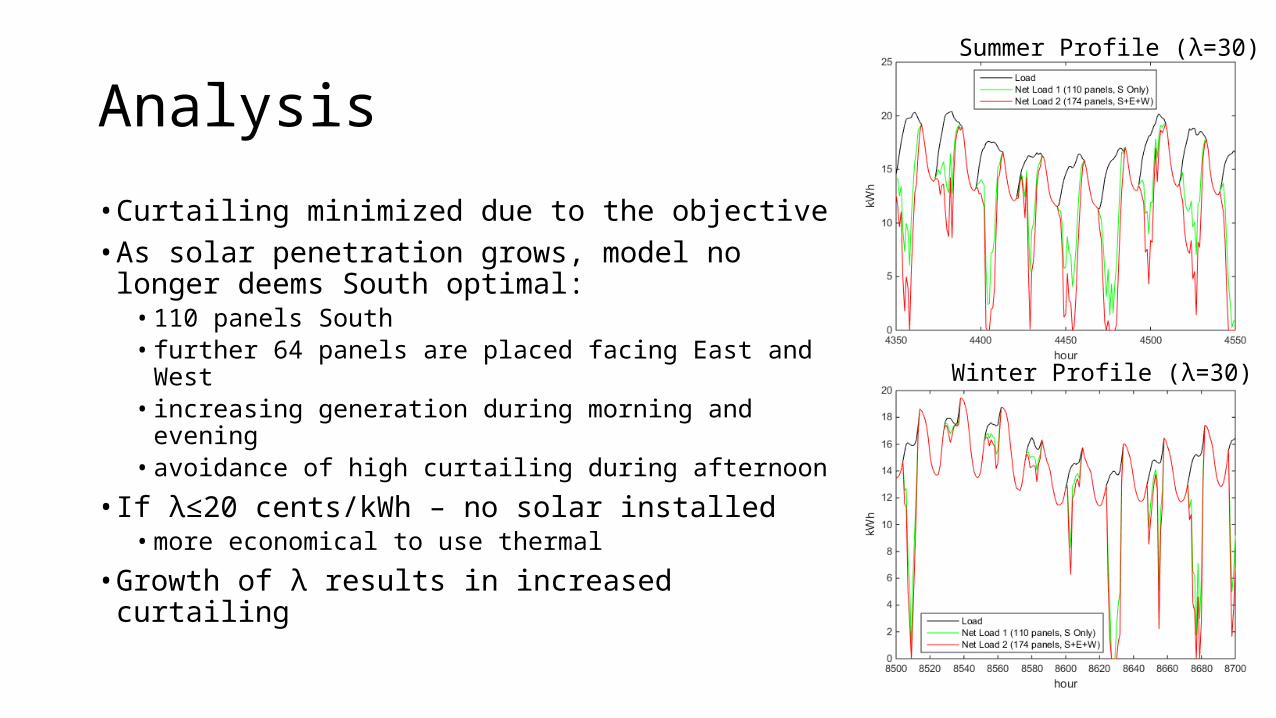
• Curtailing minimized due to the objective• As solar penetration grows, model no longer
deems South optimal:• 110 panels South• further 64 panels are placed facing East and West• increasing generation during morning and evening• avoidance of high curtailing during afternoon
• If λ≤20 cents/kWh – no solar installed• more economical to use thermal
• Growth of λ results in increased curtailing
Summer Profile (λ=30)
Winter Profile (λ=30)

Future Work
• Current limitations• Single-agent model• Stick only – rigid orientation requirement set by ISO• No carrot – no financial incentives for owners to diversify orientation• Did not address ramping/cycling yet
• Plan• Debug the multi-objective model• Introduce variables pertinent to cycling• Collect real data from installation on campus

Conclusion
• The model demonstrates value of orientation diversification• curtailing is minimized even though cycling is not taken into account• diversification occurs once solar penetration reaches the level of load
• Challengers• Sun-following installations (tracking systems)• Storage systems• High capital costs

Q&A
Technical Stuff
• Homer data based on the assumption that all orientations have the same tilt• optimal tilt for given latitude when facing South
• However, this tilt may not be optimal for panels facing East or West• Real data will be collected from panels with tilt of 15°• 5 orientations will be available
Recommended