Global Journal of Management and Business Research: E Marketing Volume 15 Issue 7 Version 1.0 Year 2015 Type: Double Blind Peer Reviewed International Research Journal Publisher: Global Journals Inc. (USA)
Online ISSN: 2249-4588 & Print ISSN: 0975-5853
Effectiveness of Push (SMS) Service: A Study on Grameenphone and Airtel Subscribers of Bangladesh
By Md. Touhidul Islam & Md. Asfaqur Rahman Pabna University of Science & Technology, Bangladesh
Abstract- The rapid increase of the use of mobile phones has created a new channel for marketing. SMS Marketing can be an effective medium of advertising in Bangladesh. The use of Short Messaging Service (SMS) has become more important to access potential customers through their mobile phones. The purpose of this paper is to measure & compare the effectiveness of push (SMS) service between Grameenphone and Airtel Telecommunication Company of Bangladesh. Results show that in most of the dimensions of push service like language of push SMS, degree of customers’ irritation, degree of annoying, social, educational and govt. information, relevancy to customers’ life style, Airtel is lagging behind GP. Being the young company, Airtel is in the good position regarding information about service activation & deactivation, customer satisfaction level, special offer and advance permission. Most of the dimensions do not match with the effectiveness of push services especially customers of both companies are irritated and annoyed about push SMS. So in case of overall evaluation for both companies the effectiveness of push service is not in satisfactory level.
Keywords: push marketing, sms, grameenphone, airtel, medium of advertising.
EffectivenessofPushSMSServiceAStudyonGrameenphoneandAirtelSubscribersofBangladesh
Strictly as per the compliance and regulations of:
© 2015. Md. Touhidul Islam & Md. Asfaqur Rahman. This is a research/review paper, distributed under the terms of the Creative Commons Attribution-Noncommercial 3.0 Unported License http://creativecommons.org/licenses/by-nc/3.0/), permitting all non-commercial use, distribution, and reproduction in any medium, provided the original work is properly cited.
GJMBR - E Classification : JEL Code : M37
Effectiveness of Push (SMS) Service: A Study on Grameenphone and Airtel Subscribers of
Bangladesh
Abstract- The rapid increase of the use of mobile phones has created a new channel for marketing. SMS Marketing can be an effective medium of advertising in Bangladesh. The use of Short Messaging Service (SMS) has become more important to access potential customers through their mobile phones. The purpose of this paper is to measure & compare the effectiveness of push (SMS) service between Grameenphone and Airtel Telecommunication Company of Bangladesh. Results show that in most of the dimensions of push service like language of push SMS, degree of customers’ irritation, degree of annoying, social, educational and govt. information, relevancy to customers’ life style, Airtel is lagging behind GP. Being the young company, Airtel is in the good position regarding information about service activation & deactivation, customer satisfaction level, special offer and advance permission. Most of the dimensions do not match with the effectiveness of push services especially customers of both companies are irritated and annoyed about push SMS. So in case of overall evaluation for both companies the effectiveness of push service is not in satisfactory level. The findings of this study necessitate the ways for Airtel as well as GP to adopt customer-centric strategic approach through competitive offerings & quality services to enhance the customer attractiveness towards push SMS and improve the
effectiveness of push service. The study will contribute significantly regarding the policy making of the business professionals,
advertising professionals as well as
Telecommunications Company (especially GP & Airtel) in selecting, evaluating and establishing the proper SMS marketing and push
service methods.
Keywords: push marketing, sms, grameenphone, airtel,
medium of advertising.
I.
Introduction
ver the last few years, the number of mobile subscribers in Bangladesh has been more than or close to more than doubling on an annual
basis. The subscriber base had reached 119.623 million at the end of November 2014and is continuing to grow at a fast rate. Individually, Bangladesh’s leading mobile operator, Grameenphone, has 51.119 Million customers, Banglalink has 30.681 Million, Robi has 25.251
Million
and Airtel has 7.468 Million subscribers. On the other
side, City cell, Bangladesh oldest mobile operator, has
added 1.306 Million subscribers and finally Government phone company Tele
talk has 3.805 Million subscribers.
Operator Subscriber(in million) 1. GP 51.112 2. Bangla Link 30.681 3. Robi 25.251 4. Airtel 7.468 5. Citycell 1.306 6. Teletalk 3.805
Source: www. Btrc.gov.bd/content/mobile phone_ subscribers (November 2014)
Bangladeshi Mobile Phone Company takes these huge mobile phone subscribers as the source or medium to reach the enormous people to conduct Mobile marketing. Mobile advertisers can deliver timely phone message service (SMS) ads to consumers based on their demographic characteristics and geographic information. Worldwide, wireless advertisers have already integrated SMS into the media mix. As the mobiles are in high use, advertising companies are also running after people who use mobile phones. Mobiles Author α: Student, BBA, MBA from Department of Business Administration, Pabna University of Science & Technology. e-mail: [email protected] Author σ: Lecturer, Department of Business Administration, Pabna University of Science & Technology.
were invented for the purpose of communications only but on the way they have got a new dimension. This dimension is that mobiles are used for advertisement. Most of the companies have started sending promotional messages in the form of SMS to people because of today mobile marketing is one of the cheapest means of advertisements. Mobile marketing can be done through SMS, MMS, Voice call etc. Also, people keep mobiles with them, and hence, as soon as people get messages on their cell phones they instantly check their messages. Moreover, mobile marketing saves much time.
Companies through push marketing can make people to read their promotional messages.
O
17
Globa
l Jo
urna
l of M
anag
emen
t an
d Bu
siness Resea
rch
Volum
e XV Issue
VII
Ver
sion
IYe
ar
20
15
( E
)
© 2015 Global Journals Inc. (US)
Grameenphone is the leading mobile phone company
Md. Touhidul Islam α & Md. Asfaqur Rahman σ
as well as Airtel
is the growing mobile phone company in Bangladesh. Both companies conduct their push marketing activity to their subscribers. Although today pull
marketing is the new concept in the market but both push Marketing &pull marketing are used by those company.
The effectiveness of push
Marketing varies from company to company. This paper will show the comparative effectiveness of push marketing between Grameenphone and Airtel mobile company. Hence, Present study emphasizes and tries to measure the Effectiveness
of push Marketing of GP and Airtel Company towards the customers.
a)
Research Problem
The present study is basically a customer
survey, conducted with the objective of knowing the customer opinion about the effectiveness of push marketing of cellular phone service providers. Today there is a stiff competition prevailing among the cellular phone service providers. Hence under this scenario, it is important to know the factors that impact on the push marketing towards potential customer as well as to know the effectiveness of push (SMS) Marketing of selected mobile phone company(GP and Airtel) which are the leading and growing mobile phone operator of telecom service in Bangladesh.
b)
Significance of the Study
This paper will help the telecom industry to
know the
current scenario of customer opinion about their push service as well as it helps to understand them assess their comparative position in context of push marketing.
c)
Objectives of the Study
The general objective of this research is to
assess the effectiveness of push marketing toward potential customer of GP and Airtel.
Specifically, the study is aimed at the following
objectives:
•
To know about the overview of Grameenphone and Airtel company.
•
To determine and compare the perception of mobile phone users in Bangladesh about push service in respect of selected variables with regard to GP and Airtel.
•
To know about the level of Performance & Effectiveness of GP and Airtel regarding the push service.
•
To make a comparison between Grameenphone and Airtel
in the context of push service by analyzing customer opinion and experience.
•
To evaluate the overall position and measure the effectiveness of push
services for both companies.
•
To provide some recommendations to increase the effectiveness of push service of Grameenphone and Airtel Company in regard to the selected variables.
d)
Scope of the Study
The scope of the research is based on two mobile phone companies and it throws light on the effectiveness of push marketing with respect to Grameenphone and Airtel Company. The report is written from the point of view of Grameenphone
& Airtel users of Pabna city from Bangladesh. This report will represent the overall condition of effectiveness of push service of mobile phone subscribers based on the survey conducted over 100 mobile phone users.
e)
Limitations of the Study
•
The study concentrates only on the customers of GP and Airtel of Pabna city in Bangladesh.
•
Due to time constraints it is not possible to cover vast area. So that survey has limited scope for application
in wide market.
•
Few customers are hesitate to deliver some information’s due to the time wasted in the providing the same.
•
Cost constraints leads to reduction in number of respondents.
II.
Organizational
Overview
Since its inception Grameenphone has built the largest cellular network in the country with over 13,000 base stations in more than 7000 locations. Presently, nearly 98 percent of the country's population is within the coverage area of the It established the first 24-Hour Call Center, introduced value-added services such as VMS, SMS, fax and data transmission services, international roaming service, WAP, SMS-based Push-pull
services, EDGE,3G, personal ring back tone and many other products and services.
Effectiveness of Push (SMS) Service: A Study on Grameenphone and Airtel Subscribers of Bangladesh
© 2015 Global Journals Inc. (US)1
Globa
l Jo
urna
l of M
anag
emen
t an
d Bu
siness Resea
rch
Volum
e XV Issue
VII
Ver
sion
I
( E
)
18
Year
2015
a) Overview of GrameenphoneGrameenphone Ltd., the largest telecommu-
nications service provider in Bangladesh received its operating license in November, 1996 and started its operations from March 26, 1997, the Independence Day of Bangladesh. Grameenphone was also the first operator to introduce the pre-paid service in September 1999. Today, Grameenphone is the leading telecommunications service provider in Bangladesh with more than 51.112 million subscribers as of November 2014 (http://www.btrc.gov.bd). It is a joint venture enterprise between Telenor and Grameen Telecom Corporation, a non-profit sister concern of the internationally acclaimed microfinance organization and community development bank Grameen Bank. Telenor, the largest telecommunications company in Norway, owns 55.8% shares of Grameenphone; Grameen Telecom owns 34.2% and the remaining 10% is publicly held.
Grameenphone at a Glance
The full name:
Grameenphone Ltd Head Office:
Clebration Point, Plot # 3&5,
Rode # 113/A, Gulshan-
2,Dhaka - 1212,Bangladesh Date of incorporation:
November 28, 1996
Service Launched:
March 26, 1997
Product & Services:
More than 50 products, services, promotions and features, Grameenphone customer centers in
6 Divisional cities, 600 Service Desk all over the country.
No of divisions:
11 No of Subscribers:
51.112 millions
Shareholders:
Telenor (62%), Grameen telecom (38%) Vision:
We’re here to help (This vision crystallizes customer focus as the Cornerstone of everything they do: helping customers get the full benefit of communications in their daily life.
Values:
Make it Easy; Keep Promises, Be Inspiring, Be Respectful Website
http://www.Grameenphone.com
Source: (http://www.Grameenphone.com) i.
Grameen Phone’s Value Added Services
SMS (Phone Message Service), SMS Push-Pull Services: By using people can enjoy more than 160 contents (Ex: Sports news, Emergency numbers, Restaurants. Airline and Railway timing, Travel info etc.), Voice Mail Service (VMS), Fax and Data, Wireless Application Protocol (WAP), News Service Event Based sports Update (2002), Iftar and Sehri Timings (1515), Bangla SMS, Apps & Gams, Lifestyle Content, Financial services.
b)
Overview of Airtel Airtel, formerly known as Warid Telecom, is a
GSM and 3G
based cellular operator in Bangladesh. Airtel is the sixth mobile phone carrier to enter the Bangladesh market, and originally launched commercial operations under the brand name Warid on May 10, 2007.
In 2010, Bharti Airtel
bought out majority share of
the company. As of August 2013, Airtel Bangladesh has 7.97 million subscribers with 7.3% of market share. Warid Telecom International, an Abu
Dhabi based
consortium, sold a majority 70% stake in the company to India's Bharti Airtel Limited. Bharti Airtel is making a fresh investment of USD 300 million to rapidly expand the operations of Warid Telecom. This is the largest investment in Bangladesh by an Indian company. This is Bharti Airtel’s second operation outside of India. Dhabi Group continues as a strategic partner retaining 30% shareholding and has its nominees on the Board of the Company. Bharti Airtel Limited took management control of the company and its board, and rebranded the company's services under its own Airtel brand
from December 20, 2010. The Bangladesh Telecommunication Regulatory Commission approved the deal on Jan 4, 2010. The company offers a wide array of innovative mobile services, including voice, value added services, data and m-commerce products and is focused on expanding its state-of-the-art mobile network both for coverage and capacity.
With a customer base of more than 7.468 million (www.btrc.gov.bd), Airtel Bangladesh is the most preferred youth brand of the country that thrives on excellent data service. And data experience with Airtel will only be better when the company will introduce its array of 3G services. To make customers’ lives easier Airtel Bangladesh has Doorstep Service by which customers can enjoy all kinds of service at their preferred place. M-Commerce opened a new Horizon in money transfer that gives Airtel customers the freedom to send money to their dear ones instantly from their mobile.
Through M-health, customers can now reach professional doctors over phone 24/7 and get basic treatment. To enrich the lives of the customers Airtel has 7 Airtel Experience Centers (AEC) and 77 Airtel Relationship Centers (ARC) across the country and our corporate office is situated in Banani (House 34, Road 19/A), Dhaka 1213, Bangladesh.
Airtel Bangladesh Ltd. at a Glance
Type:
Private
Industry:
Telecommunication
Founded: December 1, 2010 (Registration date)
Headquarters:
House 34, Road 19/A, Banani, Dhaka 1213, Bangladesh
Products:
Telephony, mobile telephony
Total subscriber:
7.468 million (November 2014)
Website:
http://www.bd.airtel.com
Source: www. bd. Airtel.com
i.
Airtel’s
Value Added Services
Voice Mail Service (VMS), Short Message Service (SMS), Multimedia Message Service(MMS), Tunes, Data service, Sports, News update, Astrology, Travel, Finance, Information service, Location based service, Research & bill pay service.
Effectiveness of Push (SMS) Service: A Study on Grameenphone and Airtel Subscribers of Bangladesh
19
Globa
l Jo
urna
l of M
anag
emen
t an
d Bu
siness Resea
rch
Volum
e XV Issue
VII
Ver
sion
IYe
ar
20
15
( E
)
© 2015 Global Journals Inc. (US)
III.
Review of Related Literature
and
Origin of Push
Marketing
a)
Mobile Advertising
Traditionally, the purpose of advertising has been to communicate brand messages to consumers in order to understand the communication process behind advertising [Shannon’s (1948)]. Advertising, in today’s business world is the most prioritize filed that a business normally concentrate and put large emphasize on that. During recent years, the popularity of text messaging (SMS) has grown exponentially, which has led to the rise
of the mobile advertising phenomenon [James, 2004]. Chang and Villegas (2008) argue that the mobile phone has tremendous potential for delivering advertisements because of its high penetration rate.
b)
SMS Advertising
In this competitive world, where in each step
you will find competition. In order to have win-win position in this competitive world there should be some strong weapons to be used to have winning edge. One of the strong weapons is advertising through SMS. In the current scenario people are lacking time, there is a very urgent need for quick and effective communication system. Bulk SMS Solutions are considered as the safest and quickest mode of communication. The marketer shave found a new way of advertising to reach the consumers with the growth in the cellular market. Millions of SMS or more are sent in a month. SMS advertising has emerged as the most suitable and
effective medium for advertising due addiction towards SMS and its popularity among youths. According to the GSM association, the cellular phone users send 10 million or more SMS in a month. The addiction towards SMS and its popularity among youths has contributed to SMS advertising to emerge as the most suitable and effective medium for advertising. The SMS has emerged as marketing communication phenomenon for the advertisers to reach their clients anywhere, anytime. One can use SMS gateways to generate the maximum awareness in client’s mind with the minimum possible costs. The SMS gateway can also be used for brand recalling. According to the research the text message advertisements have found to boost the clients’ inclination to purchase by 36% which explains its popularity among marketers. This is perhaps because SMS advertising is the most popular form of mobile advertising [Scharl, 2005].
c)
Origin of Push Marketing
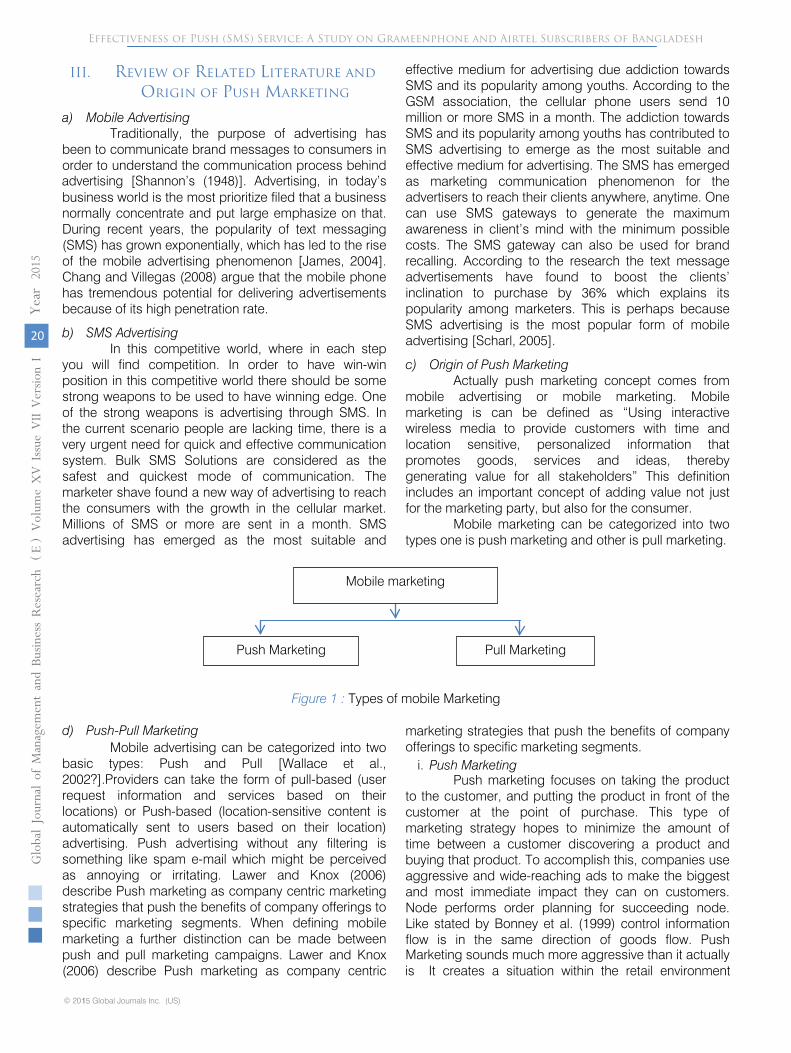
Actually push marketing concept comes from mobile advertising or mobile marketing. Mobile marketing is can be defined as “Using interactive wireless media to provide customers with time and location sensitive, personalized information that promotes goods, services and ideas, thereby generating value for all stakeholders” This definition includes an important concept of adding value not just for the marketing party, but also for the consumer.
Mobile marketing can be categorized into two types one is push marketing and other is pull marketing.
Figure 1 : Types of mobile Marketing
d) Push-Pull Marketing Mobile advertising can be categorized into two
basic types: Push and Pull [Wallace et al., 2002?].Providers can take the form of pull-based (user request information and services based on their locations) or Push-based (location-sensitive content is automatically sent to users based on their location) advertising. Push advertising without any filtering is something like spam e-mail which might be perceived as annoying or irritating. Lawer and Knox (2006) describe Push marketing as company centric marketing strategies that push the benefits of company offerings to specific marketing segments. When defining mobile marketing a further distinction can be made between push and pull marketing campaigns. Lawer and Knox (2006) describe Push marketing as company centric
marketing strategies that push the benefits of company offerings to specific marketing segments.
i. Push Marketing Push marketing focuses on taking the product
to the customer, and putting the product in front of the customer at the point of purchase. This type of marketing strategy hopes to minimize the amount of time between a customer discovering a product and buying that product. To accomplish this, companies use aggressive and wide-reaching ads to make the biggest and most immediate impact they can on customers. Node performs order planning for succeeding node. Like stated by Bonney et al. (1999) control information flow is in the same direction of goods flow. Push Marketing sounds much more aggressive than it actually is It creates a situation within the retail environment
Mobile marketing
Pull Marketing Push Marketing
Effectiveness of Push (SMS) Service: A Study on Grameenphone and Airtel Subscribers of Bangladesh
© 2015 Global Journals Inc. (US)1
Globa
l Jo
urna
l of M
anag
emen
t an
d Bu
siness Resea
rch
Volum
e XV Issue
VII
Ver
sion
I
( E
)
20
Year
2015
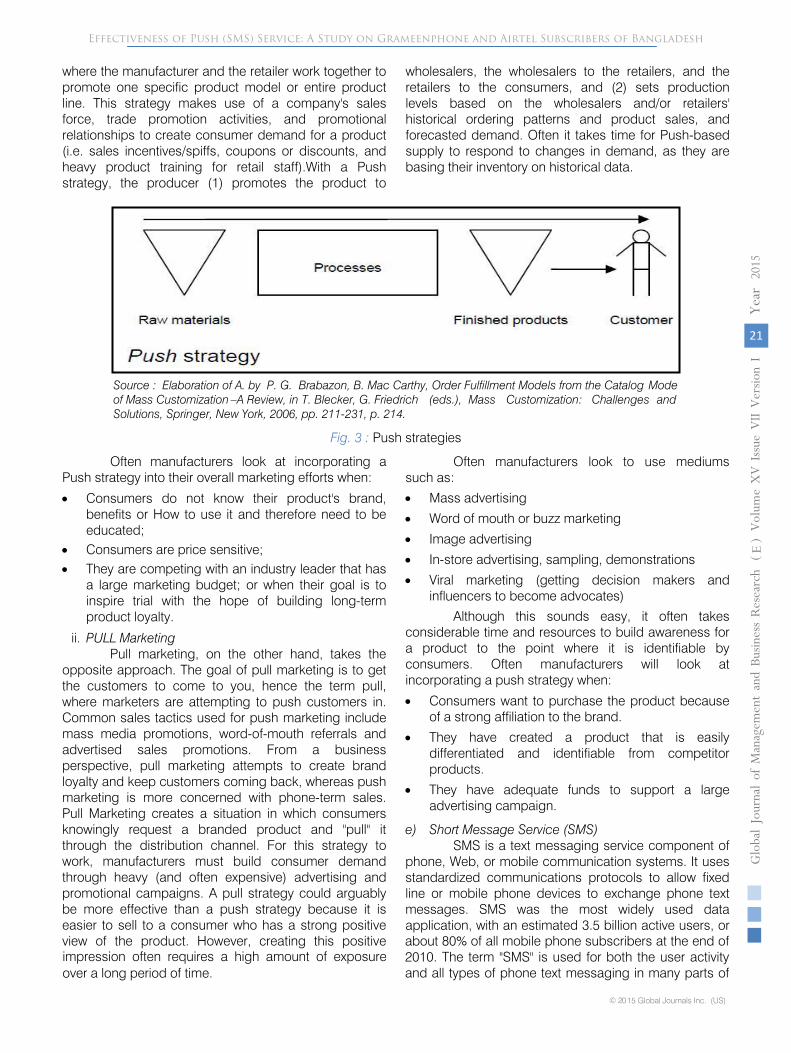
where the manufacturer and the retailer work together to promote one specific product model or entire product line. This strategy makes use of a company's sales force, trade promotion activities, and promotional relationships to create consumer demand for a product (i.e. sales incentives/spiffs, coupons or discounts, and heavy product training for retail staff).With a Push strategy, the producer (1) promotes the product to
wholesalers, the wholesalers to the retailers, and the retailers to the consumers, and (2) sets production levels based on the wholesalers and/or retailers' historical ordering patterns and product sales, and forecasted demand. Often it takes time for Push-based supply to respond to changes in demand, as they are basing their inventory on historical data.
Fig. 3 :
Push strategies
Often manufacturers look at incorporating a Push strategy into their overall marketing efforts when:
•
Consumers do not know their product's brand, benefits or How to use it and therefore need to be educated;
•
Consumers are price sensitive; •
They are competing with an industry leader that has a large marketing budget; or when their goal is to inspire trial with the hope of building long-term product loyalty.
ii.
PULL Marketing
Pull marketing, on the other hand, takes the opposite approach. The goal of pull marketing is to get the customers to come to you, hence the term pull, where marketers are attempting to push customers in. Common sales tactics used for push marketing include mass media promotions, word-of-mouth referrals and advertised sales promotions. From a business perspective, pull marketing attempts to create brand loyalty and keep customers coming back, whereas push marketing is more concerned with phone-term sales. Pull Marketing creates a situation in which consumers knowingly request a branded product and "pull" it through the distribution channel. For this strategy to work, manufacturers must build consumer demand through heavy (and often expensive) advertising and
promotional campaigns. A pull strategy could arguably be more effective than a push strategy because it is easier to sell to a consumer who has a strong positive view of the product. However, creating this positive impression often requires a high amount of exposure over a long period of time.
Often manufacturers look to use mediums
such as:
•
Mass advertising
•
Word of mouth or buzz marketing
•
Image advertising
•
In-store advertising, sampling, demonstrations
•
Viral marketing (getting decision makers
and influencers to become advocates)
Although this sounds easy, it often takes considerable time and resources to build awareness for a product to the point where it is identifiable by consumers. Often manufacturers will look at incorporating a push strategy when:
•
Consumers want to purchase the product because of a strong affiliation to the brand.
•
They have created a product that is easily differentiated and identifiable from competitor products.
•
They have adequate funds to support a large advertising
campaign.
e)
Short Message Service (SMS)
SMS
is a text messaging
service component of phone, Web, or mobile communication systems. It uses standardized communications protocols
to allow fixed line
or mobile phone
devices to exchange phone text messages. SMS was the most widely used data application, with an estimated 3.5 billion active users, or
Effectiveness of Push (SMS) Service: A Study on Grameenphone and Airtel Subscribers of Bangladesh
21
Globa
l Jo
urna
l of M
anag
emen
t an
d Bu
siness Resea
rch
Volum
e XV Issue
VII
Ver
sion
IYe
ar
20
15
( E
)
© 2015 Global Journals Inc. (US)
Source : Elaboration of A. by P. G. Brabazon, B. Mac Carthy, Order Fulfillment Models from the Catalog Modeof Mass Customization –A Review, in T. Blecker, G. Friedrich (eds.), Mass Customization: Challenges andSolutions, Springer, New York, 2006, pp. 211-231, p. 214.
about 80% of all mobile phone subscribers at the end of 2010. The term "SMS" is used for both the user activity and all types of phone text messaging in many parts of
the world. SMS is also employed in direct marketing, known as SMS marketing. SMS in subscriber mobile acts like an advanced pager. Subscriber can send and receive text messages of up to 160 characters. Subscriber can use your mobile phone attached to a computer to send faxes or transfer date, even they need not to be connected with a fixed line.
f)
Voice Mail Service (VMS)
VMS is a unique answering machine. It provides subscriber with a personal electronic mail box in our voice
mail center. When subscriber is not available or outside the coverage area or simply busy even switch off his or her cell phone, the caller can leave a message in subscriber’s voice mailbox, which subscriber may listen or retrieve at subscriber’s convenience. It provides 24- Hour automatic secretarial service makes one available to his calling person anytime. When users are unreachable or unable to answer any call within 20 s, the service will automatically divert the call to voice mail. User will receive a SMS notifying us that we have a message and we may retrieve it at a convenient time.
g)
Multimedia Message Service (MMS)
Multimedia message service (MMS) on the other hand, provides more visual and active messages. Marketers can benefit from use of photos, music, logos and animation, videos in advertising to consumers' mobile phones. SMS and MMS advertising are expected to achieve higher response rates compared to e-mail or television advertising, because all advertisements can be sent personally [Zabadi, Shura & Elsayed, 2012]. MMS mobile marketing can contain a timed slideshow of images, text, audio and video. This mobile content is delivered via MMS
(Multimedia Message Service). Nearly all new phones produced with a color screen are capable of sending and receiving standard MMS message. Brands are able to both send (mobile terminated) and receive (mobile originated) rich content through MMS A2P (application-to-person) mobile networks to mobile subscribers. MMS mobile marketing can contain a timed slideshow of images, text, audio and video. This mobile content is delivered via MMS
(Multimedia Message Service). Nearly all new phones produced with a color screen are capable of sending and receiving standard MMS message. Brands are able to both send (mobile terminated) and receive (mobile originated) rich
content through MMS A2P (application-to-person) mobile networks to mobile subscribers. In some networks, brands are also able to sponsor messages that are sent P2P (person-to-person).
h)
Voice Call
Actually voice call is a service provide by mobile phone operator that enables people to communicate and exchange their voice by using transmission frequency. The 3GPP has defined the Voice Call Continuity (VCC) specifications in order to describe how a voice call can be persisted, as a mobile phone moves
between circuit switched and packet switched radio domains.
i)
Voice SMS
A voice SMS is a text message that people can send that includes a message (usually 30 seconds or less) that the other person can hear in the text message. Save time and personalize subscribes message through a voice SMS. This service provides user the flexibility to record up to 120 s of audio; so even if user desired number is unreachable, message will reach out live!
j)
Service Quality
Service quality was defined differently through the view of many researchers. For example: Bitner, Booms and Mohr (1994) defined service quality as ‘the consumer’s overall impression of the relative inferiority / superiority of the organization and its services’. Therefore, service quality is the key of survival to all servicing companies. Cronin and Taylor (1994) viewed service quality as a form of attitude representing a long-run overall evaluation. Maintaining service quality at certain level and improving
service quality must be life-time efforts to those companies who desire life-time prosperity in customers’ heart. Parasuraman, Zeithaml and Berry (1985) defined service quality as ‘a function of the differences between expectation and performance along the quality dimensions’ [Likewise, Roest and Pieters’ (1997)]. The same definition that service quality is a relativistic and cognitive discrepancy between experiences based norms and performance concerning service benefits. Service quality is a critical element of customer perceptions. Service quality will be the dominant element in customers’ evaluations. Service quality may also be very critical in determining customer satisfaction.
k)
Customers Perception and Evaluation
Customer perception of services refers
how they assess whether they have experienced quality service, and whether they are satisfied. Perceptions are always considered relative to expectations.
IV.
Methodology and
Hypotheses
Development
The business research used in this report is descriptive nature. Through this descriptive research this report seeks to determine the answers the research questions of the GP and Airtel Bangladesh Ltd. The users of GP and Airtel were the population of this study. This study was mainly based on primary data that were collected by
using a structured survey questionnaire and secondary data that were collected from journal, books,
Effectiveness of Push (SMS) Service: A Study on Grameenphone and Airtel Subscribers of Bangladesh
© 2015 Global Journals Inc. (US)1
Globa
l Jo
urna
l of M
anag
emen
t an
d Bu
siness Resea
rch
Volum
e XV Issue
VII
Ver
sion
I
( E
)
22
Year
2015
website etc. Some data and other necessary information were collected by the website of GP and Airtel.
This study included Total 100 respondents as the sample (50 customers of Grameenphone and 50 customers of Airtel) were surveyed through the random
sampling method with structured questionnaire from July to December 2014. After collection of primary data, hypotheses were formulated and T-test, Z test, one-way ANOVA analysis, frequency analysis, and descriptive analysis ware used to test the hypotheses with 0.05 level of statistical significance. The statistical computer package SPSS version 17.0 was used to analyze the data. Out of 100 respondents, 21 were service holders and 79 were students.
a)
Population and Sample
Sampling Size–100 respondents, Convenient Sampling method is used for the study.
b)
Sources of Data
This study is based on both primary and secondary data. Primary data were collected through a structured questionnaire survey. Secondary data were collected from the published official statistics, report documents, laws, ordinance, books, articles, annual reports of concerned cell phone operators, ministry of posts & telecommunications, websites etc.
c)
Data Collection Methods
Primary data has been used by me in the form of Questionnaire & Observation, which are the two basic methods of collecting primary data, which suffices all research objectives. Secondary data sources like website of the company & some articles with reference to web-sites.
d)
Data Analysis Methods
A five-point Likert type scale statements were used to measure the variables where 1 stands for strongly disagreed and 5 stands for strongly agreed effect on the statements [(Luthans, 2002)]. After collection of primary data, hypotheses were formulated and paired samples t-test, Frequency analysis, and regression analysis ware used to test the hypotheses with 0.05 level of
statistical significance. The statistical computer package SPSS version 17.0 was used to analyze the data.
e)
Questionnaire Design
The primary data were collected from relative mobile phone companies’ customers from Pabna city. Total 100 customers (50 customers of Grameenphone and 50 customers of Airtel) were surveyed through the convenience sampling method with questionnaire from July to December 2014.
f)
Hypotheses Formulation
Research hypothesis is an unproven statement, which helps the researcher to draw the
suggestion on his hypothetical assumption whether it is true or false based on some specific statistical test (Alam and Neger, 2009). For the convenience of the study the following hypotheses are developed which are to be tested.
i.
Hypotheses Formulation (For comparing effectiveness
of push service between GP and Airtel)
Hypothesis 1:
Ho: μ
MG = μ
MA
Ha: μ
MG ≠ μ
MA
Where, Ho: There is no significant difference between Mean of GP and Mean of Airtel in terms of Service Charge.
Hypothesis 2:
Ho: μ
MG = μ
MA
Ha: μ
MG ≠ μ
MA
Where, Ho: There is no significant difference between Mean of GP and Mean of Airtel regarding Language of SMS. Hypothesis 3:
Ho: μ
MG = μ
MA
Ha: μ
MG ≠ μ
MA
Where, Ho: There is no significant difference between Mean of GP and Mean of Airtel
on the subject of Contents of SMS. Hypothesis 4:
Ho: μ
MG = μ
MA
Ha: μ
MG ≠ μ
MA
Where, Ho: There is no significant difference between Mean of GP and Mean of Airtel in context of irritation.
Hypothesis 5:
Ho: μ
MG = μ
MA
Ha: μ
MG ≠ μ
MA
Where, Ho: There is no significant difference between Mean of GP and Mean of Airtel with regard to annoying SMS. Hypothesis 6:
Ho: μ
MG = μ
MA
Ha: μ
MG ≠ μ
MA
Where, Ho: There is no significant difference between Mean of GP and Mean of Airtel in terms of Update information about product & service.
Hypothesis 7:
Ho: μ
MG = μ
MA
Ha: μ
MG ≠ μ
MA
Where, Ho: There is no significant difference between Mean of GP and Mean of Airtel regarding Information about service activation & deactivation.
Hypothesis 8:
Ho: μ
MG = μ
MA
Ha: μ
MG ≠ μ
MA
Where, Ho: There is no significant difference between Mean of GP and Mean of Airtel on the subject of Customer satisfaction of Push service.
Effectiveness of Push (SMS) Service: A Study on Grameenphone and Airtel Subscribers of Bangladesh
23
Globa
l Jo
urna
l of M
anag
emen
t an
d Bu
siness Resea
rch
Volum
e XV Issue
VII
Ver
sion
IYe
ar
20
15
( E
)
© 2015 Global Journals Inc. (US)
Hypothesis 9:Ho: μ MG = μ MAHa: μ MG ≠ μ MA
Where, Ho: There is no significant difference between Mean of GP and Mean of Airtel in context of
Hypothesis 10:
Ho: μ
MG = μ
MA
Ha: μ
MG ≠ μ
MA
Where, Ho: There is no significant difference between
Mean of GP and Mean of Airtel with regard to Contents those
relevant to customers’ lifestyle. Hypothesis 11:
Ho: μ
MG = μ
MA
Ha: μ
MG ≠ μ
MA
Where, Ho: There is no significant difference between Mean of GP and Mean of Airtel on the subject of Special offers to customers.
Hypothesis 12:
Ho: μ
MG = μ
MA
Ha: μ
MG ≠ μ
MA
Where, Ho: There is no significant difference between Mean of GP and Mean of Airtel in context of Advance permission to provide SMS.
Hypothesis 13:
Ho: μ
MG = μ
MA
Ha: μ
MG ≠ μ
MA
Where, Ho: There is no significant difference between Mean of GP and Mean of Airtel with regard to Service of customer care center
about Push service.
ii.
Hypotheses Formulation (For overall evaluation and to test the effectiveness of push service for both companies)
Hypothesis 1:
H0: Both companies (GP and Airtel) have satisfactory service charge to the customers.
Ha: Both companies (GP and Airtel) have not satisfactory service charge to the customers.
Hypothesis 2:
H0: Language of push SMS of GP and Airtel
is easily readable to the customers.
Ha: Language of push SMS of GP and Airtel is not easily readable to the customers.
Hypothesis 3:
H0: Contents of push SMS of GP and Airtel are phone and to the point.
Ha: Contents of push SMS of GP and Airtel are not
phone and to the point.
Hypothesis 4:
H0: Respondents of both companies are irritated when they receive push SMS.
Ha: Respondents of both companies are not irritated when they receive push SMS.
Hypothesis 5:
H0: Contents of push SMS of GP and Airtel
are often annoying to the customers.
Ha: Contents of push SMS of GP and Airtel are not often annoying to the customers.
Hypothesis 6:
H0: Both companies provide update information about their products & services to the customers through push SMS.
Ha: Both
companies do not provide update information about their products & services to the customers through push SMS.
Hypothesis 7:
H0: Both companies provide information about activation and deactivation of push service through push SMS.
Ha: Both companies do not provide information about activation and deactivation of push service through push SMS.
Hypothesis 8:
H0: Respondents of both companies are satisfied on getting the push service.
Ha: Respondents of both companies are not satisfied on getting the push service.
Hypothesis 9:
H0: Both companies provide available push SMS to customers about social, educational, govt. info.
Ha: Both companies do not provide available push SMS to customers about social, educational, govt. info.
Hypothesis 10:
H0: Push SMS are relevant to customers’ life style.
Ha: Push SMS are not relevant to customers’ life style.
Hypothesis 11:
H0: Both companies provide special offers to customers through push SMS.
Ha: Both companies do not provide special offers to customers through push SMS.
Hypothesis 12:
H0: Both companies take the permission from respondents in advance to provide push SMS.
Ha: Both companies do not take the permission from respondents in advance to provide push SMS.
Hypothesis 13:
H0: Services of customer care center of GP and Airtel regarding push service are in satisfactory level.
Ha: Services of customer care center of GP and Airtel regarding push service are not in satisfactory level.
V.
Data
Analysis, Hypotheses
Testing and
Findings
An analysis is generated from the questionnaire to achieve the objectives of the study. In order to analyze the collected data a 5-point Likert type scale has been used, where 5 stands for highly satisfied (Strongly Agreed) customers, 4 stands for satisfied
Effectiveness of Push (SMS) Service: A Study on Grameenphone and Airtel Subscribers of Bangladesh
© 2015 Global Journals Inc. (US)1
Globa
l Jo
urna
l of M
anag
emen
t an
d Bu
siness Resea
rch
Volum
e XV Issue
VII
Ver
sion
I
( E
)
24
Year
2015
Push SMS about social, educational and govt. information.
(Agreed) customers, 3 stands for neutral customers, 2 stands for dissatisfied (Disagreed) customers, and 1 stands for highly dissatisfied (Highly Disagreed) customers. Several judgments were made from the responses of customers to validate the objectives of the study. The results of different tests are presented below:
a)
Demographic Characteristics of the Respondents
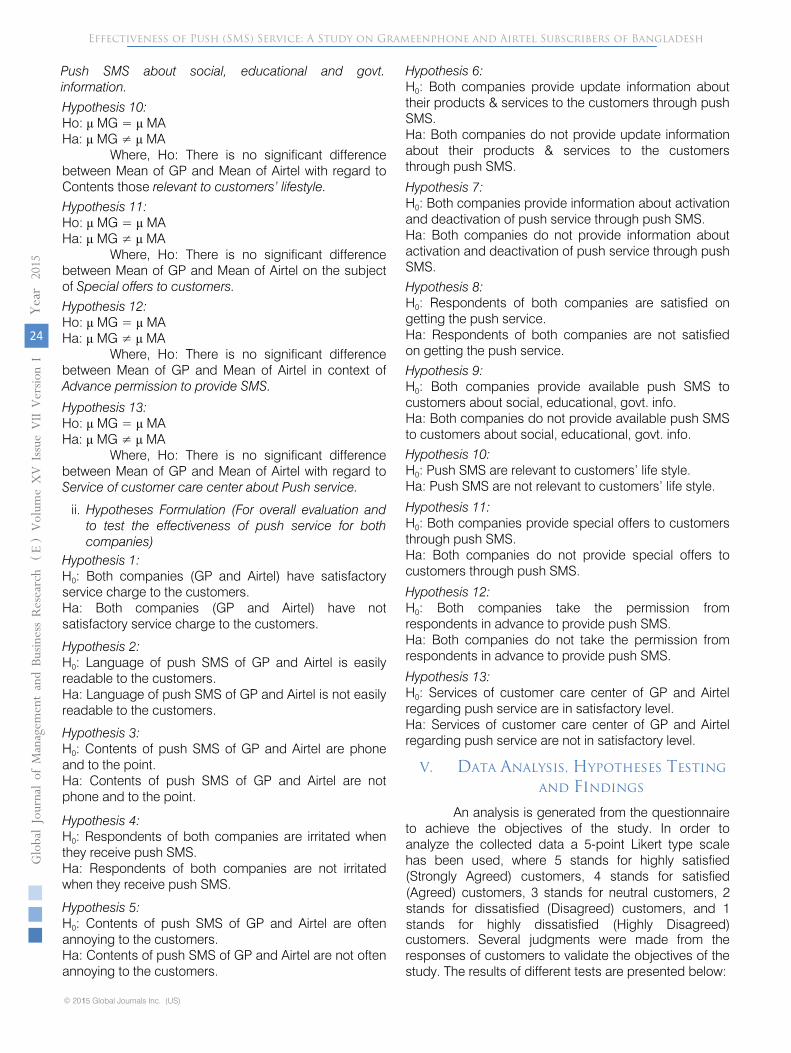
Table 01 :
Respondents Demographics
(N*=100)
Frequency
Percent
Cumulative
Percent
Occupation
Service Holder
21
21.0
21.0
Student
79
79.0
100.0
Total
100
100.0
Education Level
Below SSC
1 1.0
1.0
SSC
3
3.0
4.0
HSC
14
14.0
18.0
Bachelor
76
76.0
94.0
Master
5 5.0
99.0
PhD
1 1.0
100.0
Total
100
100.0
Age
Below 20
19
19.0
19.0
20 to 40
80
80.0
99.0
Above 40
1 1.0
100.0
Total
100
100.0
Gender
Male
75
75.0
75.0
Female
25
25.0
100.0
Total
100
100.0
Operator
GP
50
50.0
50.0
Airtel
50
50.0
100.0
Total
100
100.0
Source: Questionnaire Survey, July to December 2014
Note:*N = Total frequency = 100
Table 1 reveals that respondents involved in this study were Students and Service Holders in Pabna
city. Number of Student respondents is 79% where service Holders are 29%. It reveals that 1% of the respondents are educated below SSC, 3% of the respondents belong to SSC, 14% of the respondents are HSC, 76% of the respondents are Bachelor, 5% of the respondents are Master and 1% of the respondents are PhD.
Most of the respondents came from the age group of 20-40 years (80%), because it is a typical age of most Institutional students in Pabna and this is due to the more acceptability of push (SMS) advertising in the age group of 20 to 40 years. Other respondents were in
the age group of below 20 years (19%), above 40 years (1%).Table 1 reveals that 75% of the respondents are males and 25% of the respondents are females. It is concluded that majority of respondents are males.
It also reveals that 50%of the respondents use GP and 50% of the respondents use Airtel from the total 100 of respondents.
b)
Customer Opinion about SMS, MMS and Voice SMS
Customer opinion about
SMS, MMS, and Voice SMS
is an important factor to the customers. They give more emphasis in this particular point in receiving the PUSH SMS.
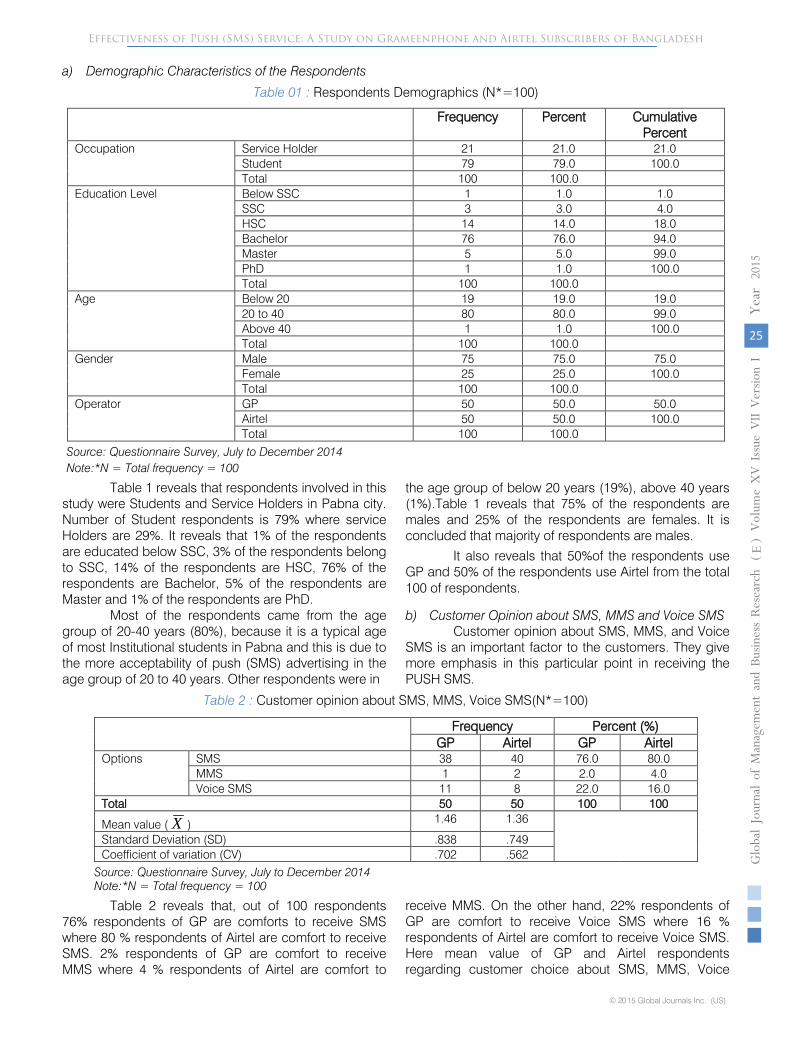
Table 2 :
Customer opinion about SMS, MMS, Voice SMS(N*=100)
Frequency
Percent (%)
GP Airtel
GP Airtel
Options
SMS
38
40
76.0
80.0
MMS
1
2 2.0
4.0
Voice SMS
11
8 22.0
16.0
Total
50
50
100
100
Mean value ( X )
1.46
1.36
Standard Deviation (SD)
.838
.749
Coefficient of variation (CV)
.702
.562
Source: Questionnaire Survey, July to December 2014
Note:*N = Total frequency = 100
Effectiveness of Push (SMS) Service: A Study on Grameenphone and Airtel Subscribers of Bangladesh
25
Globa
l Jo
urna
l of M
anag
emen
t an
d Bu
siness Resea
rch
Volum
e XV Issue
VII
Ver
sion
IYe
ar
20
15
( E
)
© 2015 Global Journals Inc. (US)
Table 2 reveals that, out of 100 respondents 76% respondents of GP are comforts to receive SMS where 80 % respondents of Airtel are comfort to receive SMS. 2% respondents of GP are comfort to receive MMS where 4 % respondents of Airtel are comfort to
receive MMS. On the other hand, 22% respondents of GP are comfort to receive Voice SMS where 16 % respondents of Airtel are comfort to receive Voice SMS. Here mean value of GP and Airtel respondents regarding customer choice about SMS, MMS, Voice
SMS
are respectively 1.46 and 1.36, Standard Deviation are respectively .838 and .749 and the coefficient of variation are respectively .702 and .562, which indicate that GP is in a very strong position than Airtel in context of push Marketing. So, GP need to provide Voice SMS as a way of push
Marketing to increase the effectiveness of push Marketing because 22 % customer are comfort to receive
the Voice SMS. On the other hand Airtel should give more concern about the SMS because 80% respondents prefer to accept SMS as a way of push service.
c)
Attractiveness of push SMS to Customer
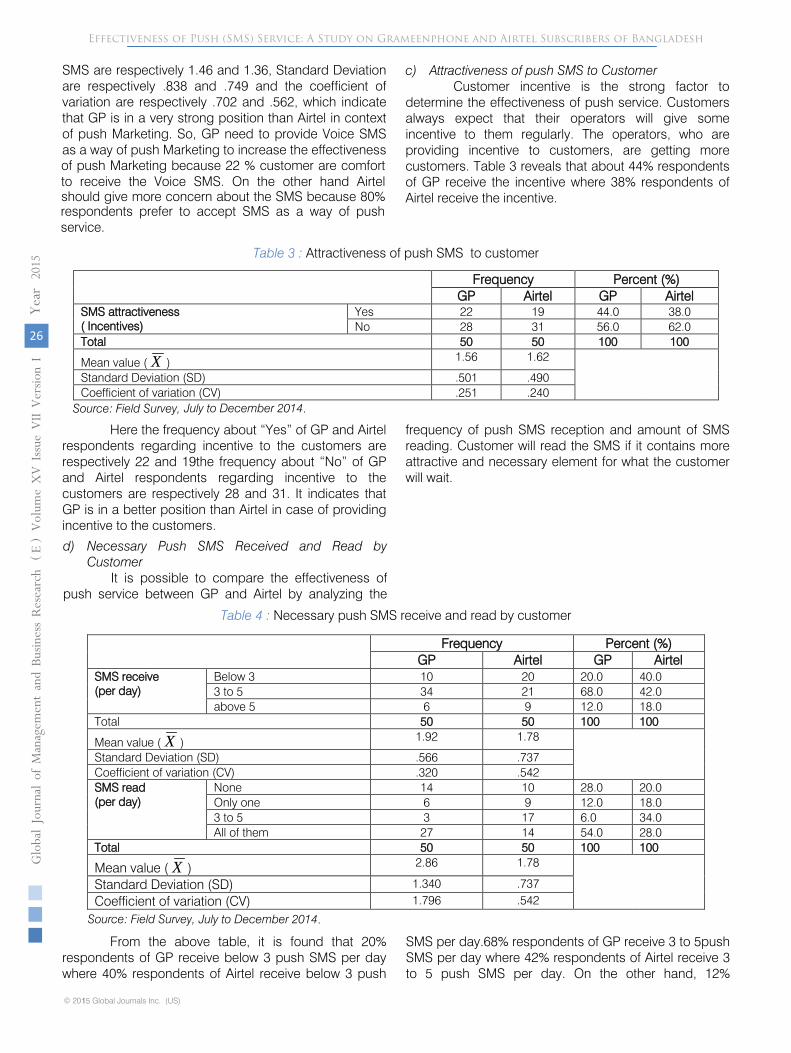
Customer incentive is the strong factor to determine the effectiveness of push service. Customers always expect that their operators will give some incentive to them regularly. The operators, who are providing incentive to customers, are getting more customers. Table 3 reveals that about 44% respondents of GP receive the
incentive where 38% respondents of Airtel receive the incentive.
Table 3 :
Attractiveness of push SMS to customer
Frequency
Percent (%)
GP Airtel
GP Airtel
SMS attractiveness
( Incentives)
Yes
22
19
44.0
38.0
No
28
31
56.0
62.0
Total
50
50
100
100
Mean value ( X )
1.56
1.62
Standard Deviation (SD)
.501
.490
Coefficient of variation (CV)
.251
.240
Source: Field Survey, .
Here the frequency about “Yes” of GP and Airtel respondents regarding incentive to the customers are respectively 22 and 19the frequency about “No” of GP and Airtel respondents regarding incentive to the customers are respectively 28 and 31. It indicates that GP is in a better position than Airtel in case of providing incentive to the customers.
d)
Necessary Push SMS Received and Read by Customer
It is possible to compare the effectiveness of push
service between GP and Airtel by analyzing the
frequency of push
SMS reception and amount of SMS reading. Customer will read the SMS if it contains more attractive and necessary element for what the customer will wait.
Table 4 :
Necessary push SMS receive and read by customer
Frequency
Percent (%)
GP Airtel
GP Airtel
SMS receive
(per day)
Below 3
10
20
20.0
40.0
3 to 5
34
21
68.0
42.0
above 5
6 9 12.0
18.0
Total
50
50
100
100
Mean value ( X )
1.92
1.78
Standard Deviation (SD)
.566
.737
Coefficient of variation (CV)
.320
.542
SMS read
(per day)
None
14
10
28.0
20.0
Only one
6 9 12.0
18.0
3 to 5
3 17
6.0
34.0
All of them
27
14
54.0
28.0
Total
50
50
100
100
Mean value ( X )
2.86
1.78
Standard Deviation (SD)
1.340
.737
Coefficient of variation (CV)
1.796
.542
Source: Field Survey,
Effectiveness of Push (SMS) Service: A Study on Grameenphone and Airtel Subscribers of Bangladesh
© 2015 Global Journals Inc. (US)1
Globa
l Jo
urna
l of M
anag
emen
t an
d Bu
siness Resea
rch
Volum
e XV Issue
VII
Ver
sion
I
( E
)
26
Year
2015
From the above table, it is found that 20% respondents of GP receive below 3 push SMS per day where 40% respondents of Airtel receive below 3 push
SMS per day.68% respondents of GP receive 3 to 5push SMS per day where 42% respondents of Airtel receive 3 to 5 push SMS per day. On the other hand, 12%
July to December 2014
.July to December 2014
respondents of GP receive above 5 push SMS per day where 18% respondents of Airtel receive above 5push SMS per day. On the other side within 50 respondent 28% respondent of GP do not read anyone SMS where 20% respondent among 50 Airtel respondents do not read anyone SMS.12% respondent of GP read only one SMS where 18% respondent of Airtel read only one SMS. 54% respondent of GP read all of them SMS where 28% respondent of Airtel read all of them SMS. Mean value of GP is 2.86 and Airtel is 1.78 which indicate that content of GP’s push SMS is more acceptable and attractive as well as effectiveness of push service of GP is high than Airtel.
e)
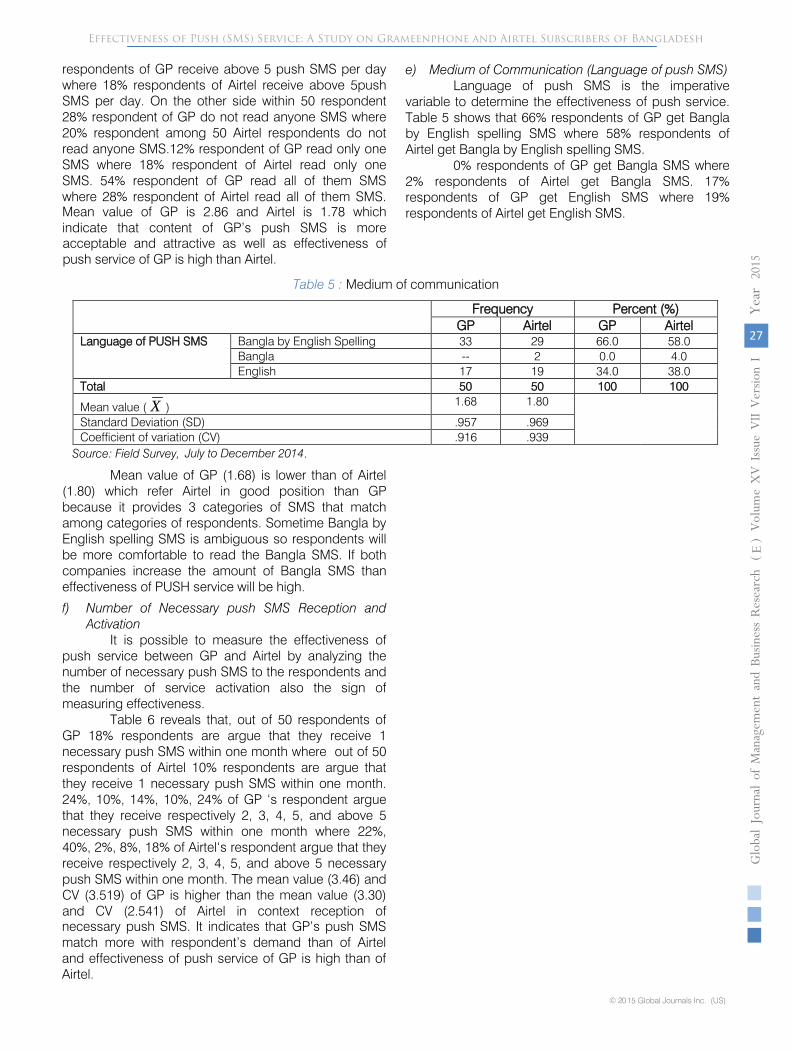
Medium of Communication (Language of push SMS)
Language of push
SMS is the imperative variable to determine the effectiveness of push
service. Table 5 shows that 66% respondents of GP get Bangla by English spelling SMS where 58% respondents of Airtel get Bangla by English spelling SMS.
0% respondents of GP get Bangla SMS where 2% respondents of Airtel get Bangla SMS. 17% respondents of GP get English SMS where 19% respondents of Airtel get English SMS.
Table 5 :
Medium of communication
Frequency
Percent (%)
GP Airtel
GP Airtel
Language of PUSH SMS
Bangla by English Spelling
33
29
66.0
58.0
Bangla
-- 2 0.0
4.0
English
17
19
34.0
38.0
Total
50
50
100
100
Mean value ( X )
1.68
1.80
Standard Deviation (SD)
.957
.969
Coefficient of variation (CV)
.916
.939
Source: Field Survey,
Mean value of GP (1.68) is lower than of Airtel
(1.80) which refer Airtel in good position than GP because it provides 3 categories of SMS that match among categories of respondents. Sometime Bangla by English spelling SMS is ambiguous so respondents will be more comfortable to read the Bangla SMS. If both companies increase the amount of Bangla SMS than effectiveness of PUSH service will be high.
f)
Number of Necessary push SMS Reception and Activation
It is possible to measure the effectiveness of push
service between GP and Airtel
by analyzing the number of necessary push
SMS to the respondents and the number of service activation also the sign of measuring effectiveness.
Table 6 reveals that, out of 50 respondents of GP 18% respondents are argue that they receive 1 necessary push SMS within one month where out of 50 respondents of Airtel 10% respondents are argue that they receive 1 necessary push SMS within one month. 24%, 10%, 14%, 10%, 24% of GP ‘s respondent argue that they receive respectively 2, 3, 4, 5, and above 5 necessary push SMS within one month where 22%, 40%, 2%, 8%, 18% of Airtel‘s respondent argue that they receive respectively 2, 3, 4, 5, and above 5 necessary push SMS within one month. The mean value (3.46) and CV (3.519) of GP is higher than the mean value (3.30)
and CV (2.541) of Airtel in context reception of necessary push SMS. It indicates that GP’s push SMS match more with respondent’s demand than of Airtel and effectiveness of push service of GP is high than of Airtel.
Effectiveness of Push (SMS) Service: A Study on Grameenphone and Airtel Subscribers of Bangladesh
27
Globa
l Jo
urna
l of M
anag
emen
t an
d Bu
siness Resea
rch
Volum
e XV Issue
VII
Ver
sion
IYe
ar
20
15
( E
)
© 2015 Global Journals Inc. (US)
.July to December 2014
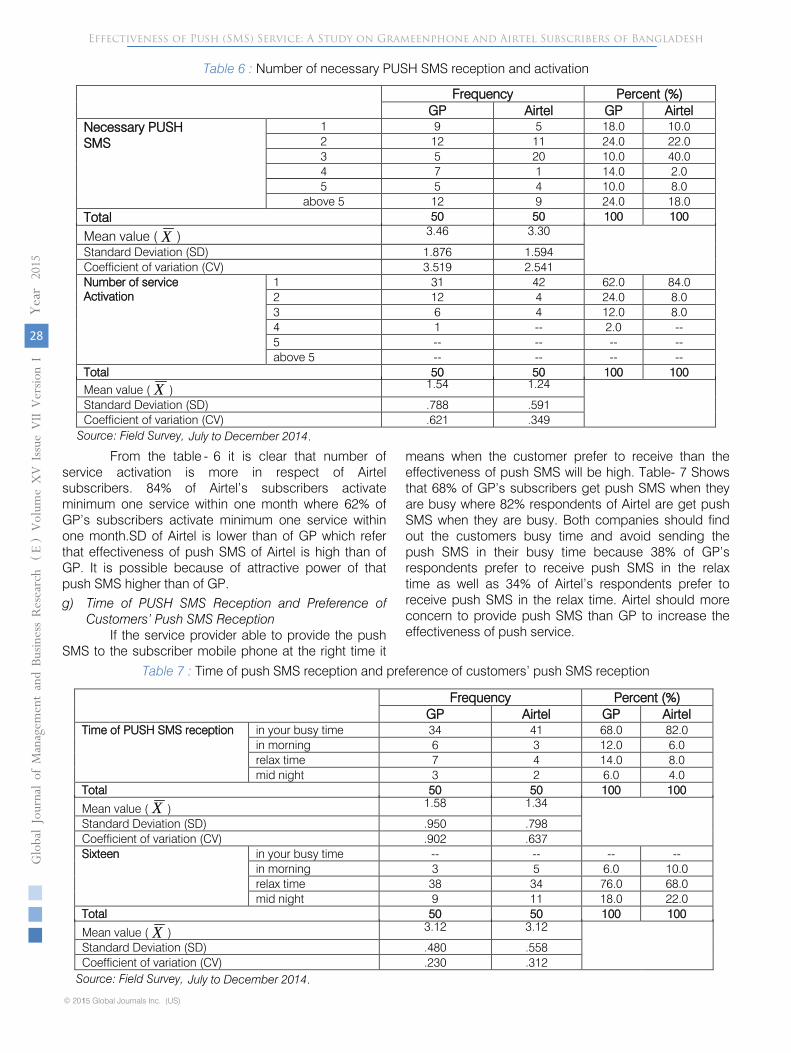
Table 6 : Number of necessary PUSH SMS reception and activation
Frequency
Percent (%)
GP Airtel
GP Airtel Necessary PUSH
SMS
1
9 5 18.0
10.0
2
12
11
24.0
22.0
3
5 20
10.0
40.0
4
7 1 14.0
2.0
5
5 4 10.0
8.0
above 5
12
9 24.0
18.0
Total
50
50
100
100
Mean value ( X )
3.46
3.30
Standard Deviation (SD)
1.876
1.594
Coefficient of variation (CV)
3.519
2.541
Number of service
Activation
1 31
42
62.0
84.0
2
12
4 24.0
8.0
3
6 4 12.0
8.0
4 1 -- 2.0
-- 5
-- -- -- -- above 5
-- -- -- -- Total
50
50
100
100
Mean value ( X )
1.54
1.24
Standard Deviation (SD)
.788
.591
Coefficient of variation (CV)
.621
.349
Source: Field Survey,
From the table - 6 it is clear that number of
service activation is more in respect of Airtel subscribers. 84% of Airtel’s
subscribers activate minimum one service within one month where 62% of GP’s subscribers activate minimum one service within one month.SD of Airtel is lower than of GP which refer that effectiveness of push
SMS of Airtel is high than of GP. It is possible because of attractive power of that push
SMS higher than of GP.
g)
Time of PUSH SMS Reception and Preference of
Customers’ Push SMS Reception
If the service provider able to provide the push
SMS to the subscriber mobile phone at the right time it
means when the customer prefer to receive than the effectiveness of push
SMS will be high. Table- 7 Shows that 68% of GP’s subscribers get push
SMS when they are busy where 82% respondents of Airtel are get push SMS when they are busy. Both companies should find out the customers busy time and avoid sending the push
SMS in their busy time because 38% of GP’s respondents prefer to receive push
SMS in the relax time as well as 34% of Airtel’s respondents prefer to receive push SMS in the relax time. Airtel should more concern to provide push
SMS than GP to increase the effectiveness of push
service.
Table 7 :
Time of push SMS reception and preference of customers’ push SMS reception
Frequency
Percent (%)
GP Airtel
GP Airtel
Time of PUSH SMS reception
in your busy time
34
41
68.0
82.0
in morning
6 3 12.0
6.0
relax time
7 4 14.0
8.0
mid night
3 2 6.0
4.0
Total
50
50
100
100
Mean value ( X )
1.58
1.34
Standard Deviation (SD)
.950
.798
Coefficient of variation (CV)
.902
.637
Sixteen
in your busy time
-- -- -- -- in morning
3 5 6.0
10.0
relax time
38
34
76.0
68.0
mid night
9 11
18.0
22.0
Total
50
50
100
100
Effectiveness of Push (SMS) Service: A Study on Grameenphone and Airtel Subscribers of Bangladesh
© 2015 Global Journals Inc. (US)1
Globa
l Jo
urna
l of M
anag
emen
t an
d Bu
siness Resea
rch
Volum
e XV Issue
VII
Ver
sion
I
( E
)
28
Year
2015
.July to December 2014
Mean value ( X ) 3.12 3.12
Standard Deviation (SD) .480 .558Coefficient of variation (CV) .230 .312
Source: Field Survey, .July to December 2014
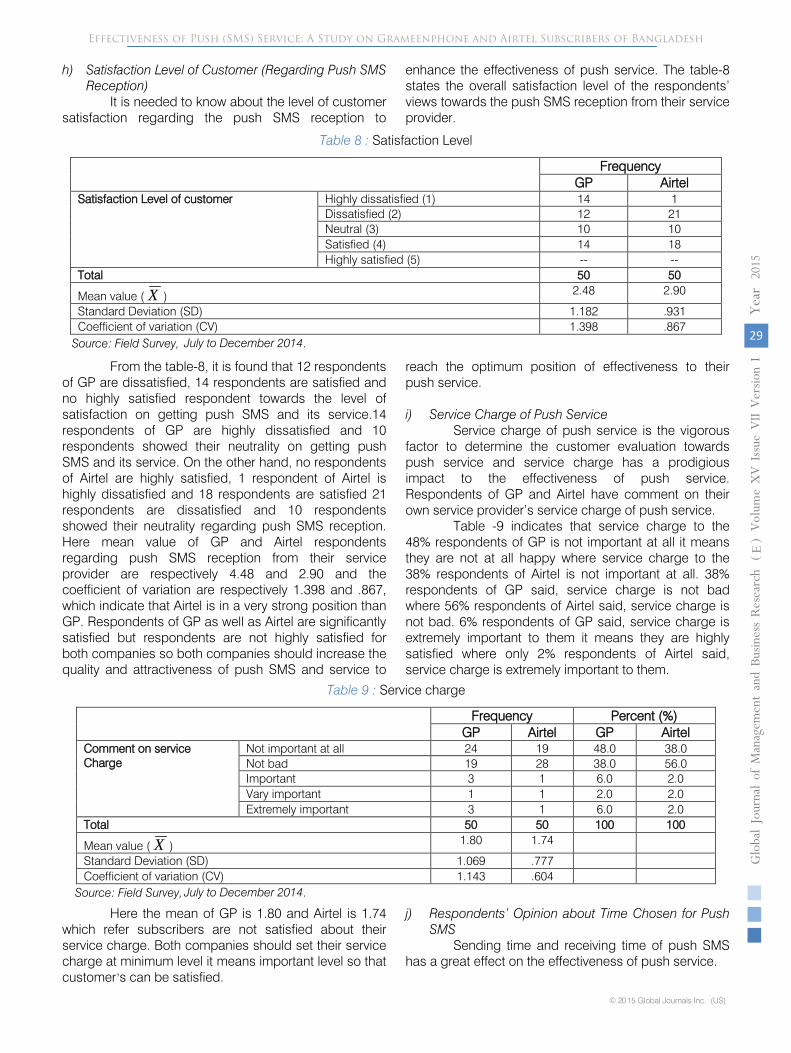
h)
Satisfaction Level of Customer (Regarding Push SMS Reception)
It is needed to know about the level of customer satisfaction regarding the push SMS reception to
enhance the effectiveness of push service. The table-8 states the overall satisfaction level of the respondents’ views towards the push SMS reception from their service provider.
Table 8 :
Satisfaction Level
Source: Field Survey,
From the table-8, it is found that 12 respondents of GP are dissatisfied, 14 respondents are satisfied and no highly satisfied respondent towards the level of satisfaction on getting push SMS and its service.14
respondents of GP are highly dissatisfied and 10 respondents showed their neutrality on getting push SMS and its service. On the other hand, no respondents of Airtel are highly satisfied, 1 respondent of Airtel is highly dissatisfied and 18 respondents are satisfied 21 respondents are dissatisfied and 10 respondents showed their neutrality regarding push SMS reception. Here mean value of GP and Airtel respondents regarding push SMS reception from their service provider are respectively 4.48 and 2.90 and the coefficient of variation are respectively 1.398 and .867, which indicate that Airtel is in a very strong position than GP. Respondents of GP as well as Airtel are significantly satisfied but respondents are not highly satisfied for both companies so both companies should increase the quality and attractiveness of push SMS and service to
reach the optimum position of effectiveness to their push service.
i)
Service Charge of Push Service
Service charge of push
service is the vigorous factor to determine the customer evaluation towards push service and service charge has a prodigious impact to the effectiveness of push
service. Respondents of GP and Airtel have comment on their own service provider’s service charge of push
service.
Table -9 indicates that service charge to the 48% respondents
of GP is not important at all it means they are not at all happy where service charge to the 38% respondents of Airtel is not important at all. 38% respondents of GP said, service charge is not bad where 56% respondents of Airtel said, service charge is not bad. 6% respondents of GP said, service charge is extremely important to them it means they are highly satisfied where only 2% respondents of Airtel said, service charge is extremely important to them.
Table 9 :
Service charge
Source: Field Survey,
Frequency
GP Airtel
Satisfaction Level of customer
Highly dissatisfied (1)
14
1 Dissatisfied (2)
12
21
Neutral (3)
10
10
Satisfied (4)
14
18
Highly satisfied (5)
-- -- Total
50
50
Mean value ( X )
2.48
2.90
Standard Deviation (SD)
1.182
.931
Coefficient of variation (CV)
1.398
.867
Frequency
Percent (%)
GP Airtel
GP Airtel
Comment on service
Charge
Not important at all
24
19
48.0
38.0
Not bad
19
28
38.0
56.0
Important 3 1 6.0
2.0
Vary important
1 1 2.0
2.0
Extremely important
3 1 6.0
2.0
Total
50
50
100
100
Mean value ( X )
1.80
1.74
Standard Deviation (SD)
1.069
.777
Coefficient of variation (CV)
1.143
.604
Effectiveness of Push (SMS) Service: A Study on Grameenphone and Airtel Subscribers of Bangladesh
29
Globa
l Jo
urna
l of M
anag
emen
t an
d Bu
siness Resea
rch
Volum
e XV Issue
VII
Ver
sion
IYe
ar
20
15
( E
)
© 2015 Global Journals Inc. (US)
.July to December 2014
.July to December 2014
Here the mean of GP is 1.80 and Airtel is 1.74 which refer subscribers are not satisfied about their service charge. Both companies should set their service charge at minimum level it means important level so that customer s can be satisfied.
j) Respondents’ Opinion about Time Chosen for Push SMS
Sending time and receiving time of push SMS has a great effect on the effectiveness of push service.
’
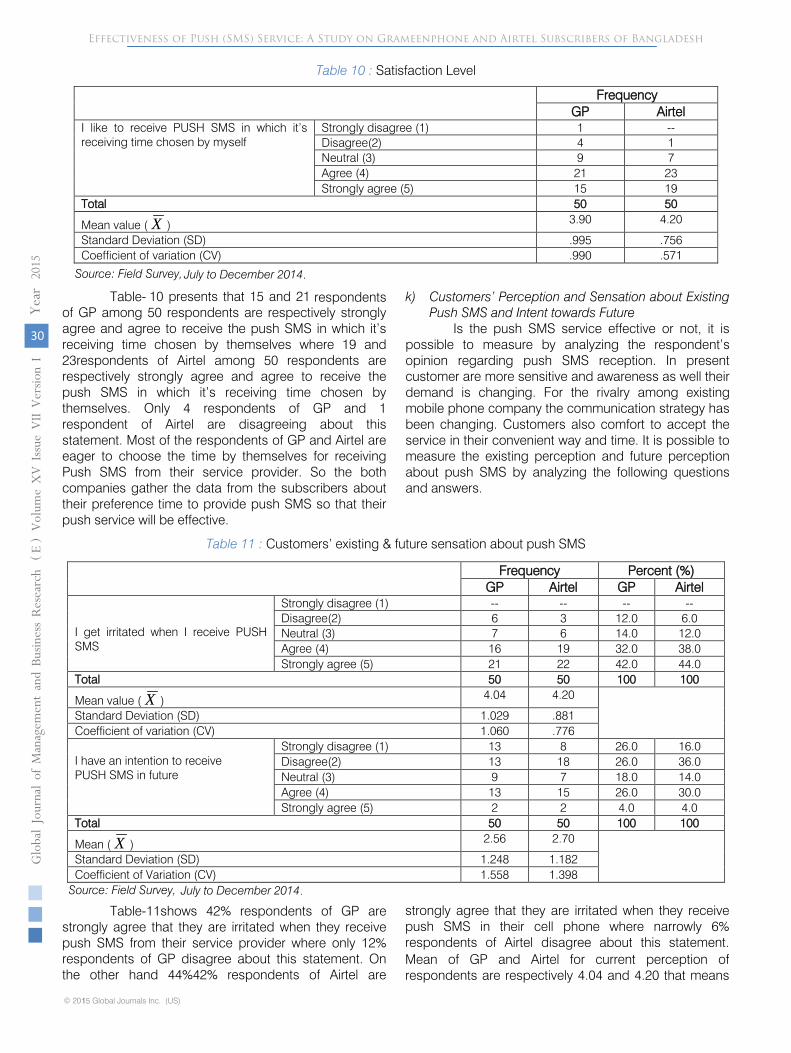
Table 10 :
Satisfaction Level
Source: Field Survey,
Table- 10 presents that 15 and 21 of GP among 50 respondents are respectively strongly agree and agree to receive the push SMS in which it’s receiving time chosen by themselves where 19 and 23respondents of Airtel among 50 respondents are respectively strongly agree and agree to receive the push SMS in which it’s receiving time chosen by themselves. Only 4 respondents of GP and 1 respondent of Airtel are disagreeing about this statement. Most of the respondents of GP and Airtel are eager to choose the time by themselves for receiving Push SMS from their service provider. So the both companies gather the data from the subscribers about their preference time to provide push SMS so that their push service will be effective.
k)
Customers’ Perception and Sensation about Existing Push SMS and Intent towards Future
Is the push SMS service effective or not, it is possible to measure by analyzing the respondent’s opinion regarding push SMS reception. In present customer are more sensitive and awareness as well
their demand is changing. For the rivalry among existing mobile phone company the communication strategy has been changing. Customers also comfort to accept the service in their convenient way and time. It is possible to measure the existing perception and future perception about push SMS by analyzing the following questions and answers.
Table 11 :
Customers’ existing & future sensation about push SMS
Source: Field Survey,
Frequency
GP Airtel
I like to receive PUSH SMS in which it’s receiving time chosen by myself
Strongly disagree (1)
1 -- Disagree(2)
4 1 Neutral (3)
9 7 Agree (4)
21
23
Strongly agree (5)
15
19
Total
50
50
Mean value ( X )
3.90
4.20
Standard Deviation (SD)
.995
.756
Coefficient of variation (CV)
.990
.571
Frequency
Percent (%)
GP Airtel
GP Airtel
I get irritated when I receive PUSH SMS
Strongly disagree (1)
-- -- -- -- Disagree(2)
6 3 12.0
6.0
Neutral (3)
7 6 14.0
12.0
Agree (4)
16
19
32.0
38.0
Strongly agree (5)
21
22
42.0
44.0
Total
50
50
100
100
Mean value ( X )
4.04
4.20
Standard Deviation (SD)
1.029
.881
Coefficient of variation (CV)
1.060
.776
I have an intention to receive
PUSH SMS in future
Strongly disagree (1)
13
8 26.0
16.0
Disagree(2)
13
18
26.0
36.0
Neutral (3)
9 7 18.0
14.0
Agree (4)
13
15
26.0
30.0
Strongly agree (5)
2 2 4.0
4.0
Total
50
50
100
100
Mean ( X )
2.56
2.70
Standard Deviation (SD)
1.248
1.182
Coefficient of Variation (CV)
1.558
1.398
Effectiveness of Push (SMS) Service: A Study on Grameenphone and Airtel Subscribers of Bangladesh
© 2015 Global Journals Inc. (US)1
Globa
l Jo
urna
l of M
anag
emen
t an
d Bu
siness Resea
rch
Volum
e XV Issue
VII
Ver
sion
I
( E
)
30
Year
2015
.July to December 2014
.July to December 2014
Table-11shows 42% respondents of GP are strongly agree that they are irritated when they receive push SMS from their service provider where only 12% respondents of GP disagree about this statement. On the other hand 44%42% respondents of Airtel are
strongly agree that they are irritated when they receive push SMS in their cell phone where narrowly 6% respondents of Airtel disagree about this statement. Mean of GP and Airtel for current perception of respondents are respectively 4.04 and 4.20 that means
respondents
negative effect is high here. In context of future push SMS reception, 26%respondents of GP strongly disagree and also 26% respondents of GP disagree to receive push
SMS in future where only 4% strongly agree and 26% agree to receive push SMS in future. On the other hand 16%respondents of Airtel strongly disagree and 36% respondents of Airtel disagree to receive push
SMS in future. Although 30% respondents of Airtel are agree to receive the push
SMS in future. Mean (2.70) of Airtel is higher than the mean(2.56) of GP. It means the number of respondents of Airtel is more than of GP to receive the push
SMS in future. Although the position of Airtel is good than GP in context of future push
SMS reception but most of the respondents for both companies would not like to receive the push SMS in future.
l)
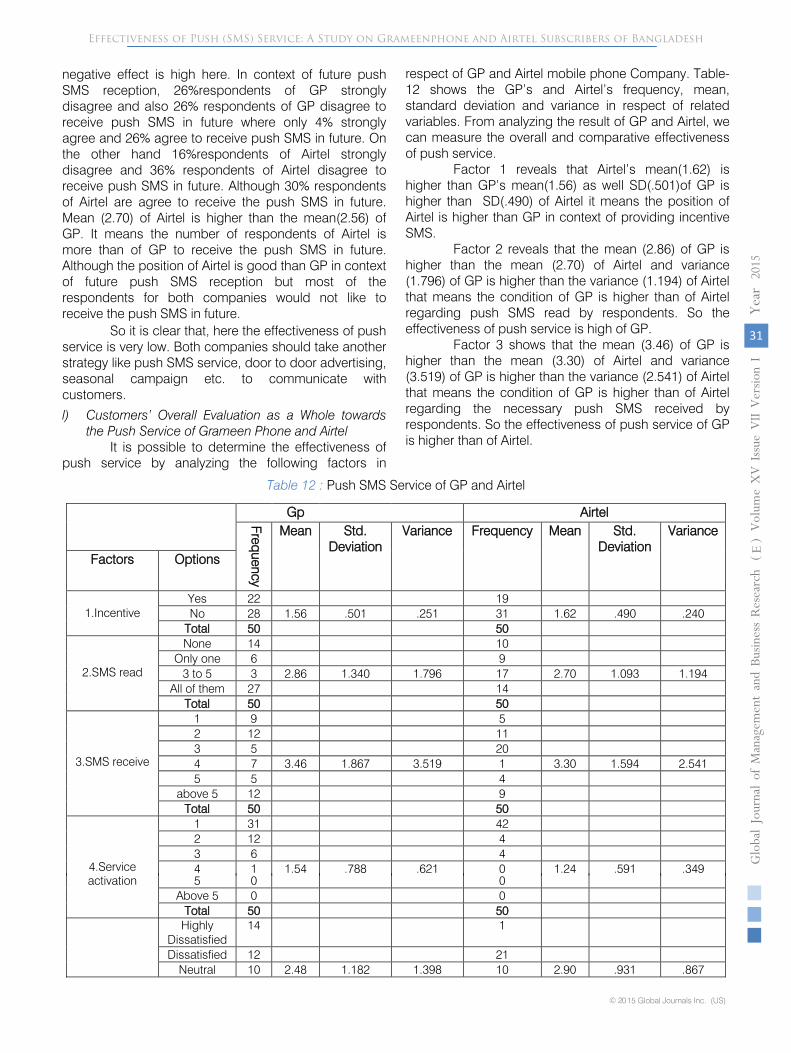
Customers’ Overall Evaluation as a Whole towards the Push Service of Grameen Phone and Airtel
It is possible to determine the effectiveness of push
service by analyzing the following factors in
respect of GP and Airtel
mobile phone Company. Table-12 shows the GP’s and Airtel’s frequency, mean, standard deviation and variance in respect of related variables. From analyzing the result of GP and Airtel, we can measure the overall and comparative effectiveness of push service.
Factor 1
reveals that Airtel’s mean(1.62) is higher than GP’s mean(1.56) as well SD(.501)of GP is higher than SD(.490) of Airtel it means the position of Airtel is higher than GP in context of providing incentive SMS.
Factor 2
reveals that the mean (2.86) of GP is higher than the mean (2.70) of Airtel and variance (1.796) of GP is higher than the variance (1.194) of Airtel that means the condition of GP is higher than of Airtel regarding push SMS read by respondents. So the effectiveness of push service is high of GP.
Factor 3
shows that the mean (3.46) of GP is higher than the mean (3.30) of Airtel and variance (3.519) of GP is higher than the variance (2.541) of Airtel that means the condition of GP is higher than of Airtel regarding the necessary push SMS received by respondents. So the effectiveness of push service of GP is higher than of Airtel.
Table 12 :
Push SMS Service of GP and Airtel
Gp
Airtel
Frequency
Mean
Std. Deviation
Variance
Frequency
Mean
Std. Deviation
Variance
Factors
Options
1.Incentive
Yes
22
19
No
28
1.56
.501
.251
31
1.62
.490
.240
Total
50
50
2.SMS read
None
14
10
Only one
6
9
3 to 5
3 2.86
1.340
1.796
17
2.70
1.093
1.194
All of them
27
14
Total
50
50
3.SMS receive
1 9
5
2
12
11
3
5
20
4
7 3.46
1.867
3.519
1 3.30
1.594
2.541
5
5
4
above 5
12
9
Total
50
50
4.Service
1 31
42
2
12
4
3
6
4
4
1 1.54
.788
.621
0 1.24
.591
.349
Effectiveness of Push (SMS) Service: A Study on Grameenphone and Airtel Subscribers of Bangladesh
31
Globa
l Jo
urna
l of M
anag
emen
t an
d Bu
siness Resea
rch
Volum
e XV Issue
VII
Ver
sion
IYe
ar
20
15
( E
)
© 2015 Global Journals Inc. (US)
activation 5 0 0 Above 5 0 0
Total 50 50Highly
Dissatisfied14 1
Dissatisfied 12 21Neutral 10 2.48 1.182 1.398 10 2.90 .931 .867
So it is clear that, here the effectiveness of pushservice is very low. Both companies should take another strategy like push SMS service, door to door advertising, seasonal campaign etc. to communicate with customers.
5.Satisfaction level
Satisfied
14
18
Highly Satisfied
0
0
Total
50
50
Not important at
all
24
19
Not bad
19
28
Important 3 1.80
1.069
1.143
1 1.74
.777
.604
6.Service charge
Vary important
1
1
Extremely important
3
1
Total
50
50
Strongly Disagree
3
0
Disagree
8
22
7.Language
Neutral
8 3.48
1.111
1.234
10
3.04
1.087
1.182
Agree
24
12
Strongly Agree
7
6
Total
50
50
Strongly Disagree
0
0
Disagree
11
11
8.Contents
Neutral
8 3.54
.994
.988
15
3.40
.990
.980
Agree
24
17
Strongly Agree
7
7
Total
50
50
9.Information
About
product
And
Service
Strongly Disagree
9
2
Disagree
16
10
Neutral
12
2.62
1.141
1.302
15
3.26
1.006
1.013
Agree
11
19
Strongly Agree
2
4
Total
50
50
10.Information
About
Service
activation &
deactivation process
Strongly Disagree
8
8
Disagree
13
14
Neutral
0 3.10
1.344
1.806
1 3.20
1.498
2.245
Agree
24
14
Strongly Agree
5
13
Total
50
50
11.Service
Activation
Deactivation
Method
Strongly Disagree
3
2
Disagree
16
18
Neutral
7 3.20
1.229
1.510
9 3.20
1.262
1.592
Agree
16
10
Strongly Agree
8
11
Effectiveness of Push (SMS) Service: A Study on Grameenphone and Airtel Subscribers of Bangladesh
© 2015 Global Journals Inc. (US)1
Globa
l Jo
urna
l of M
anag
emen
t an
d Bu
siness Resea
rch
Volum
e XV Issue
VII
Ver
sion
I
( E
)
32
Year
2015
Total 50 50
12.Social,Educational,
Govt. infoSMS
Strongly Disagree
1 2
Disagree 5 19Neutral 8 3.86 1.010 1.021 3 3.16 1.167 1.362Agree 22 21
Strongly Agree
14
5
Total
50
50
13.Relevancy to
Customers’
Life style
Strongly Disagree
7
9
Disagree
21
16
Neutral
12
2.56
1.091
1.190
8 2.80
1.340
1.796
Agree
7
10
Strongly Agree
3
7
Total
50
50
14.Special
Offer to
Customers
Strongly Disagree
12
2
Disagree
9
20
Neutral
6 2.86
1.340
1.796
10
2.94
1.058
1.119
Agree
20
15
Strongly Agree
3
3
Total
50
50
Source: Field Survey,
Factor 4 shows that the mean (1.54) of GP is higher than the mean (1.24) of Airtel
and variance (.621) of GP is higher than the variance (.349) of Airtel that means the condition of GP is higher than of Airtel regarding the service activation after reading PUSH SMS by respondents. So the effectiveness of push service of GP is higher than of Airtel.
Factor 5 reveals that, out of 50 respondents of GP 14 respondents are highly dissatisfied and 12 respondents are dissatisfied where out of 50 respondents of Airtel only 1 respondent is highly dissatisfied and 21 respondents are dissatisfied. On the other hand 14 respondents of GP are satisfied where 18 respondents of Airtel are satisfied. The mean (2.90) of Airtel is higher than the mean (2.48) of GP that indicate the customers of Airtel are more satisfy towards Airtel than of GP regarding push
SMS reception from their operator.
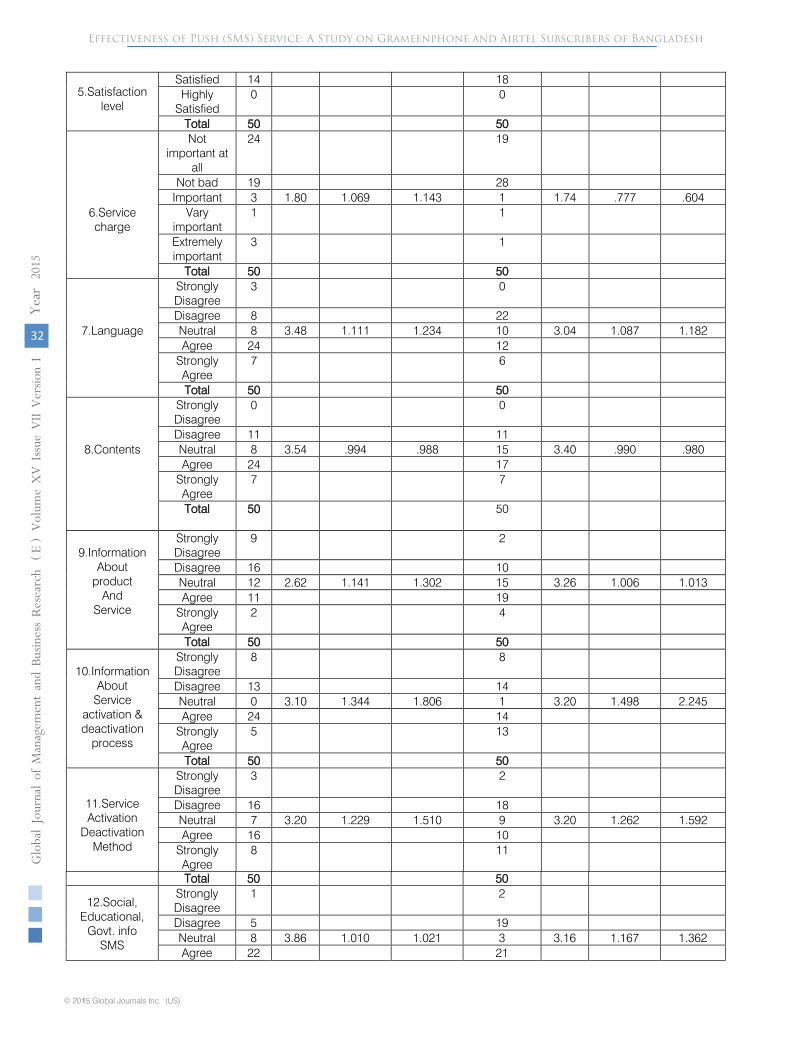
Factor 6indicates that the mean of GP is 1.80 and Airtel is 1.74 which refer subscribers are not satisfied about their service charge. Both companies should set their service charge at minimum level it means important level so that customer s can be satisfied.
Factor 7shows that the mean (3.48) of GP is higher than the mean (3.04) of Airtel and variance (1.234) of GP is higher than the variance (1.182) of Airtel that means the condition of GP is higher than of Airtel regarding the language of Push SMS. So the effectiveness of push service of GP is higher than of Airtel.
Factor 8 exposes that the mean (3.54) of GP is higher than the mean (3.40) of Airtel and variance (.988) of GP is higher than the variance (.980) of Airtel that directs the condition of GP is higher than of Airtel concerning the contents of push SMS. So the effectiveness of push service of GP is higher than of Airtel.
Factor 9
reveals that the mean (3.26) of Airtel is higher than the mean (2.62) of GP and SD (1.006) of Airtel is lower than the SD (1.141) of GP that directs the condition of Airtel is higher than of GP in relation to the information about products and services through push SMS. So the effectiveness of push service of Airtel is higher than of GP.
Factor 10
discloses that the mean (3.20) of Airtel is higher than the mean (3.10) of GP and variance (2.245) of Airtel is higher than the variance (1.141) of GP that directs the condition of Airtel is higher than of GP regarding the information about service activation and deactivation process. Subsequently the effectiveness of push service of Airtel is higher than of GP.
Factor 11unveils that the mean (3.20) of GP is equal the mean (3.20) of Airtel but SD (1.229) of GP is lower than the SD (1.262) of Airtel that leads the condition of GP is higher than of Airtel regarding service activation and deactivation method. Afterward the effectiveness of push service of Airtel is higher than of GP.
Factor 12
exposes that the mean (3.86) of GP is higher than the mean (3.16) of Airtel and SD(1.010) of GP is lower than the SD (1.167) of Airtel that directs the condition of GP is higher than of Airtel regarding the
Effectiveness of Push (SMS) Service: A Study on Grameenphone and Airtel Subscribers of Bangladesh
33
Globa
l Jo
urna
l of M
anag
emen
t an
d Bu
siness Resea
rch
Volum
e XV Issue
VII
Ver
sion
IYe
ar
20
15
( E
)
© 2015 Global Journals Inc. (US)
.July to December 2014
push SMS reception about social awareness, educational and govt. info. So it is clear that effectiveness of push service of GP is higher than of Airtel.
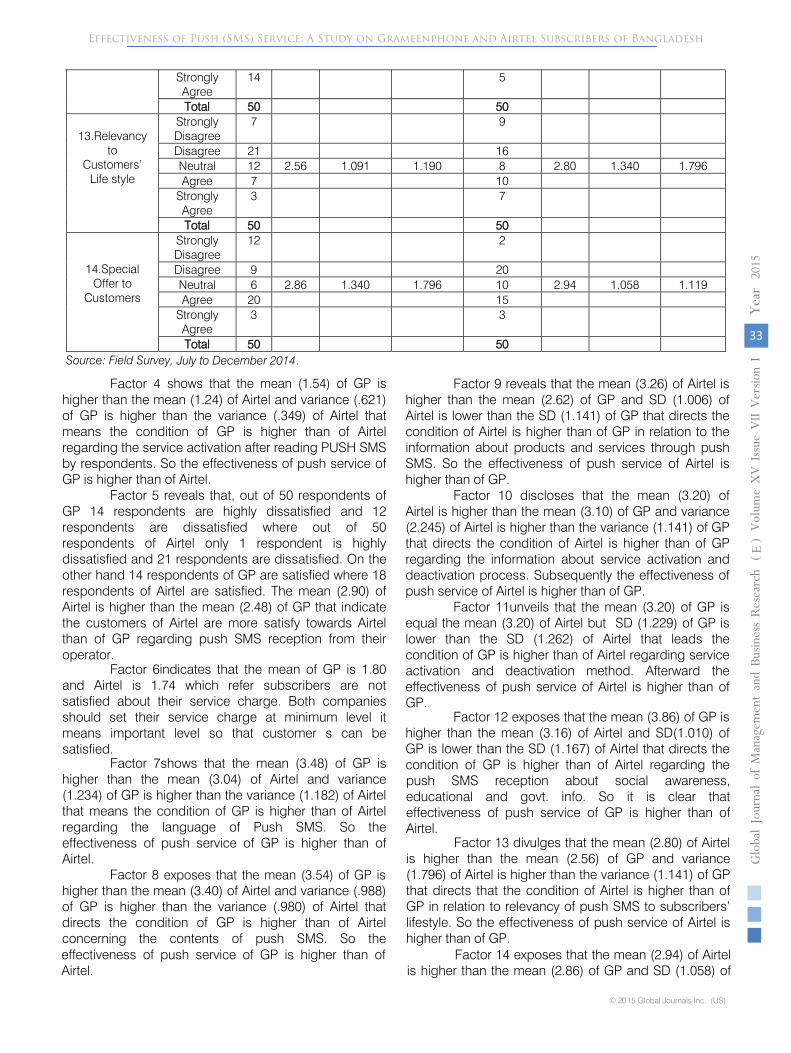
Factor 13 divulges that the mean (2.80) of Airtel is higher than the mean (2.56) of GP and variance (1.796) of Airtel is higher than the variance (1.141) of GP that directs that the condition of Airtel is higher than of GP in relation to relevancy of push SMS to subscribers’ lifestyle. So the effectiveness of push service of Airtel is higher than of GP.
Factor 14 exposes that the mean (2.94) of Airtel is higher than the mean (2.86) of GP and SD (1.058) of
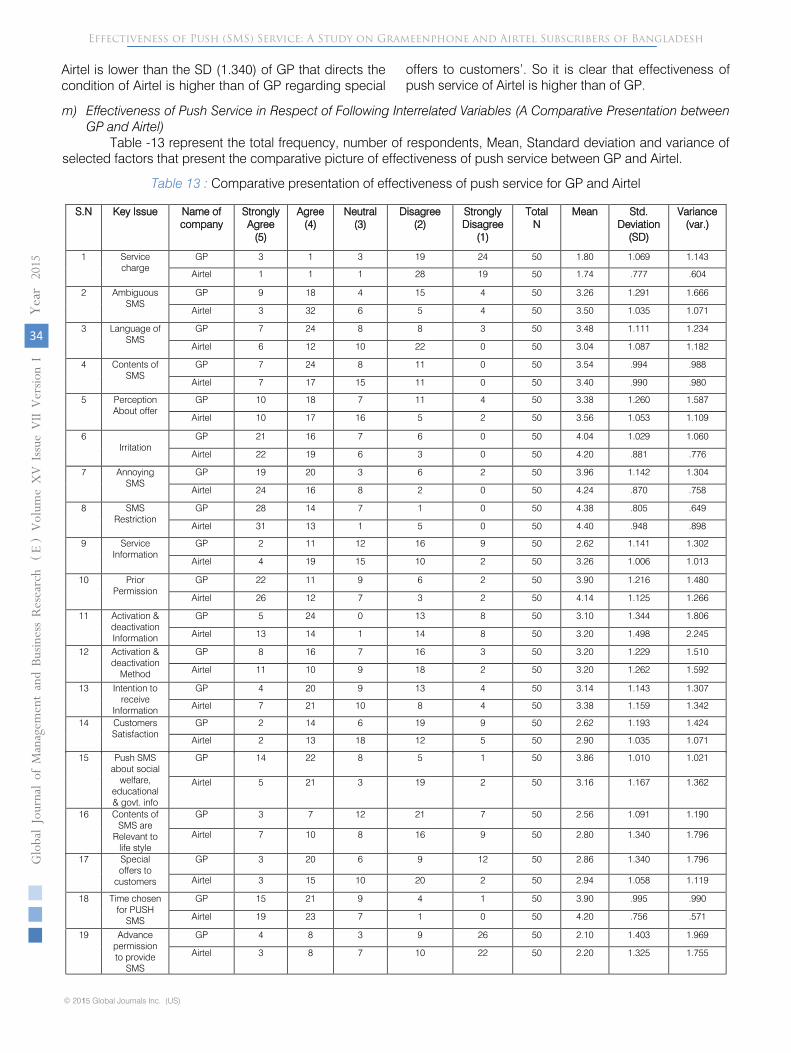
Table 13 :
Comparative presentation of effectiveness of push service for GP and Airtel
S.N
Key Issue
Name of company
Strongly Agree
(5)
Agree (4)
Neutral (3)
Disagree (2)
Strongly Disagree
(1)
Total
N Mean
Std. Deviation
(SD)
Variance
(var.)
1
Service charge
GP
3 1 3 19
24
50
1.80
1.069
1.143
Airtel
1 1 1 28
19
50
1.74
.777
.604
2
Ambiguous
SMS
GP
9 18
4 15
4 50
3.26
1.291
1.666
Airtel
3 32
6 5 4 50
3.50
1.035
1.071
3
Language of
SMS
GP
7 24
8 8 3 50
3.48
1.111
1.234
Airtel
6 12
10
22
0 50
3.04
1.087
1.182
4
Contents of
SMS
GP
7 24
8 11
0 50
3.54
.994
.988
Airtel
7 17
15
11
0 50
3.40
.990
.980
5
Perception
About offer
GP
10
18
7 11
4 50
3.38
1.260
1.587
Airtel
10
17
16
5 2 50
3.56
1.053
1.109
6
Irritation
GP
21
16
7 6 0 50
4.04
1.029
1.060
Airtel
22
19
6 3 0 50
4.20
.881
.776
7
Annoying
SMS
GP
19
20
3 6 2 50
3.96
1.142
1.304
Airtel
24
16
8 2 0 50
4.24
.870
.758
8
SMS
Restriction
GP
28
14
7 1 0 50
4.38
.805
.649
Airtel
31
13
1 5 0 50
4.40
.948
.898
9
Service
Information
GP
2 11
12
16
9 50
2.62
1.141
1.302
Airtel
4 19
15
10
2 50
3.26
1.006
1.013
10
Prior
Permission
GP
22
11
9 6 2 50
3.90
1.216
1.480
Airtel
26
12
7 3 2 50
4.14
1.125
1.266
11
Activation & deactivation
Information
GP
5 24
0 13
8 50
3.10
1.344
1.806
Airtel
13
14
1 14
8 50
3.20
1.498
2.245
12
Activation & deactivation
Method
GP
8 16
7 16
3 50
3.20
1.229
1.510
Airtel
11
10
9 18
2 50
3.20
1.262
1.592
13
Intention to receive
Information
GP
4 20
9 13
4 50
3.14
1.143
1.307
Airtel
7 21
10
8 4 50
3.38
1.159
1.342
14
Customers
Satisfaction
GP
2 14
6 19
9 50
2.62
1.193
1.424
Airtel
2 13
18
12
5 50
2.90
1.035
1.071
15
Push SMS about social
welfare, educational& govt. info
GP
14
22
8 5 1 50
3.86
1.010
1.021
Airtel
5 21
3 19
2 50
3.16
1.167
1.362
16
Contents of SMS are
Relevant to life style
GP
3 7 12
21
7 50
2.56
1.091
1.190
Airtel
7 10
8 16
9 50
2.80
1.340
1.796
Effectiveness of Push (SMS) Service: A Study on Grameenphone and Airtel Subscribers of Bangladesh
© 2015 Global Journals Inc. (US)1
Globa
l Jo
urna
l of M
anag
emen
t an
d Bu
siness Resea
rch
Volum
e XV Issue
VII
Ver
sion
I
( E
)
34
Year
2015
Airtel is lower than the SD (1.340) of GP that directs the condition of Airtel is higher than of GP regarding special
17 Special offers to
customers
GP 3 20 6 9 12 50 2.86 1.340 1.796
Airtel 3 15 10 20 2 50 2.94 1.058 1.119
18 Time chosen for PUSH
SMS
GP 15 21 9 4 1 50 3.90 .995 .990
Airtel 19 23 7 1 0 50 4.20 .756 .571
m) Effectiveness of Push Service in Respect of Following Interrelated Variables (A Comparative Presentation between GP and Airtel)
Table -13 represent the total frequency, number of respondents, Mean, Standard deviation and variance of selected factors that present the comparative picture of effectiveness of push service between GP and Airtel.
offers to customers’. So it is clear that effectiveness of push service of Airtel is higher than of GP.
19 Advance permission to provide
SMS
GP 4 8 3 9 26 50 2.10 1.403 1.969
Airtel 3 8 7 10 22 50 2.20 1.325 1.755
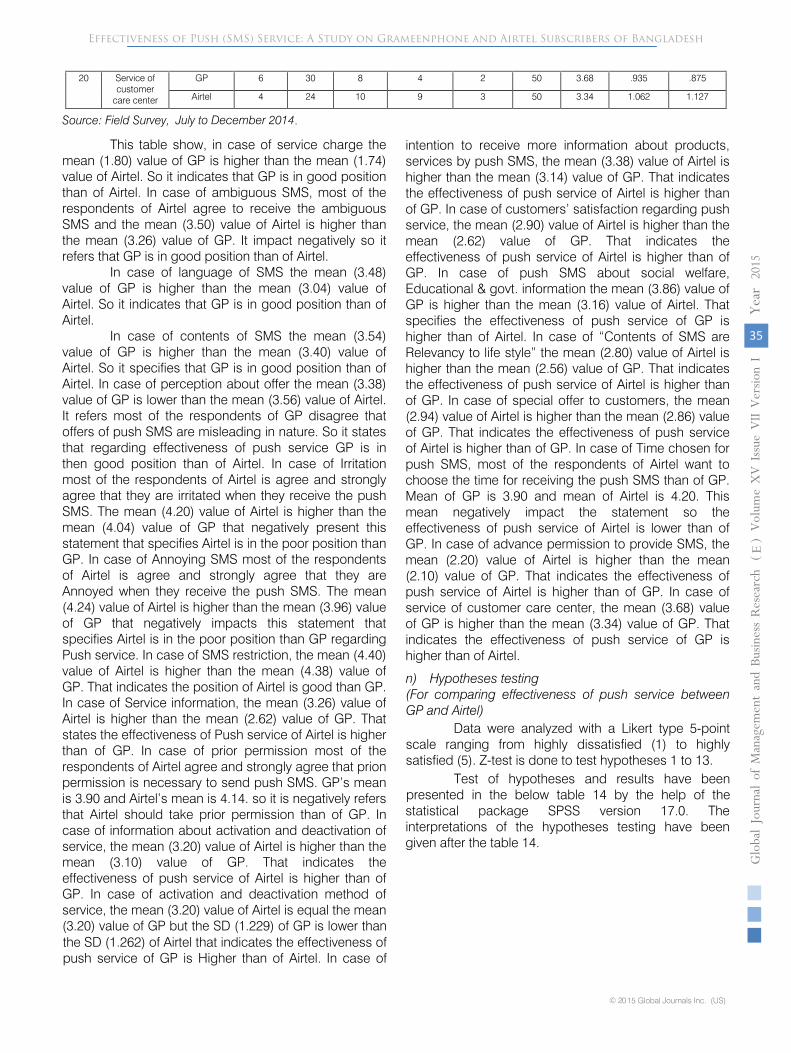
20
Service of customer
care center
GP
6 30
8 4 2 50
3.68
.935
.875
Airtel
4 24
10
9 3 50
3.34
1.062
1.127
Source: Field Survey,
This table show, in case of service charge the mean (1.80) value of GP is higher than the mean (1.74) value of Airtel. So it indicates that GP is in good position than of Airtel. In case of ambiguous SMS, most of the respondents of Airtel agree to receive the ambiguous SMS and the mean (3.50) value of Airtel is higher than the mean (3.26) value of GP. It impact negatively so it refers that GP is in good position than of Airtel.
In case of language of SMS the mean (3.48) value of GP is higher than the mean (3.04) value of Airtel. So it indicates that GP is in good position than of Airtel.
In case of contents of SMS the mean (3.54) value of GP is higher than the mean (3.40) value of Airtel. So it specifies that GP is in good position than of Airtel. In case of perception about offer the mean (3.38) value of GP is lower than the mean (3.56) value of Airtel. It refers most of the respondents of GP disagree that offers of push
SMS are misleading in nature. So it states that regarding effectiveness of push
service GP is in then good position than of Airtel. In case of Irritation most of the respondents of Airtel is agree and strongly agree that they are irritated when they receive the push SMS. The mean (4.20) value of Airtel is higher than the mean (4.04) value of GP that negatively present this statement that specifies Airtel is in the poor position than GP. In case of Annoying SMS most of the respondents of Airtel is agree and strongly agree that they are Annoyed when they receive the push SMS. The mean (4.24) value of Airtel is higher than the mean (3.96) value of GP that negatively impacts this statement that specifies Airtel is in the poor position than GP regarding Push service. In case of SMS restriction, the mean (4.40) value of Airtel is higher than the mean (4.38) value of GP. That indicates the position of Airtel is good than GP. In case of Service information, the mean (3.26) value of Airtel is higher than the mean (2.62) value of GP. That states the effectiveness of Push service of Airtel is higher than of GP. In case of prior permission most of the respondents of Airtel agree and strongly agree that prion permission is
necessary to send push SMS. GP’s mean is 3.90 and Airtel’s mean is 4.14.
so it is negatively refers that Airtel should take prior permission than of GP. In case of information about activation and deactivation of service, the mean (3.20) value of Airtel is higher than the mean (3.10) value of GP. That indicates the effectiveness of push service of Airtel is higher than of GP. In case of activation and deactivation method of service, the mean (3.20) value of Airtel is equal the mean (3.20) value of GP but the SD (1.229) of GP is lower than the SD (1.262) of Airtel that indicates the effectiveness of push service of GP is Higher than of Airtel. In case of
intention to receive more information about products, services by push SMS, the mean (3.38) value of Airtel is higher than the mean (3.14) value of GP. That indicates the effectiveness of push service of Airtel is higher than of GP. In case of customers’ satisfaction regarding push service, the mean (2.90) value of Airtel is higher than the mean (2.62) value of GP. That indicates the effectiveness of push service of Airtel is higher than of GP. In case of push
SMS about social welfare, Educational & govt. information
the mean (3.86) value of GP is higher than the mean (3.16) value of Airtel. That specifies the effectiveness of push service of GP is higher than of Airtel. In case of “Contents of SMS are Relevancy to life style” the mean (2.80) value of Airtel is higher than the mean (2.56) value of GP. That indicates the effectiveness of push service of Airtel is
higher than of GP. In case of special offer to customers, the mean (2.94) value of Airtel is higher than the mean (2.86) value of GP. That indicates the effectiveness of push service of Airtel is higher than of GP. In case of Time chosen for push SMS, most of the respondents of Airtel want to choose the time for receiving the push SMS than of GP. Mean of GP is 3.90 and mean of Airtel is 4.20. This mean negatively impact the statement so the effectiveness of push service of Airtel is lower than of GP. In case of advance permission to provide SMS, the mean (2.20) value of Airtel is higher than the mean (2.10) value of GP. That indicates the effectiveness of push service of Airtel is higher than of GP. In case of service of customer care center, the mean (3.68) value of GP is higher than the mean (3.34) value of GP. That indicates the effectiveness of push service of GP is higher than of Airtel.
Effectiveness of Push (SMS) Service: A Study on Grameenphone and Airtel Subscribers of Bangladesh
35
Globa
l Jo
urna
l of M
anag
emen
t an
d Bu
siness Resea
rch
Volum
e XV Issue
VII
Ver
sion
IYe
ar
20
15
( E
)
© 2015 Global Journals Inc. (US)
.July to December 2014
Data were analyzed with a Likert type 5-point scale ranging from highly dissatisfied (1) to highly satisfied (5). Z-test is done to test hypotheses 1 to 13.
n) Hypotheses testing(For comparing effectiveness of push service between GP and Airtel)
Test of hypotheses and results have been presented in the below table 14 by the help of the statistical package SPSS version 17.0. The interpretations of the hypotheses testing have been given after the table 14.
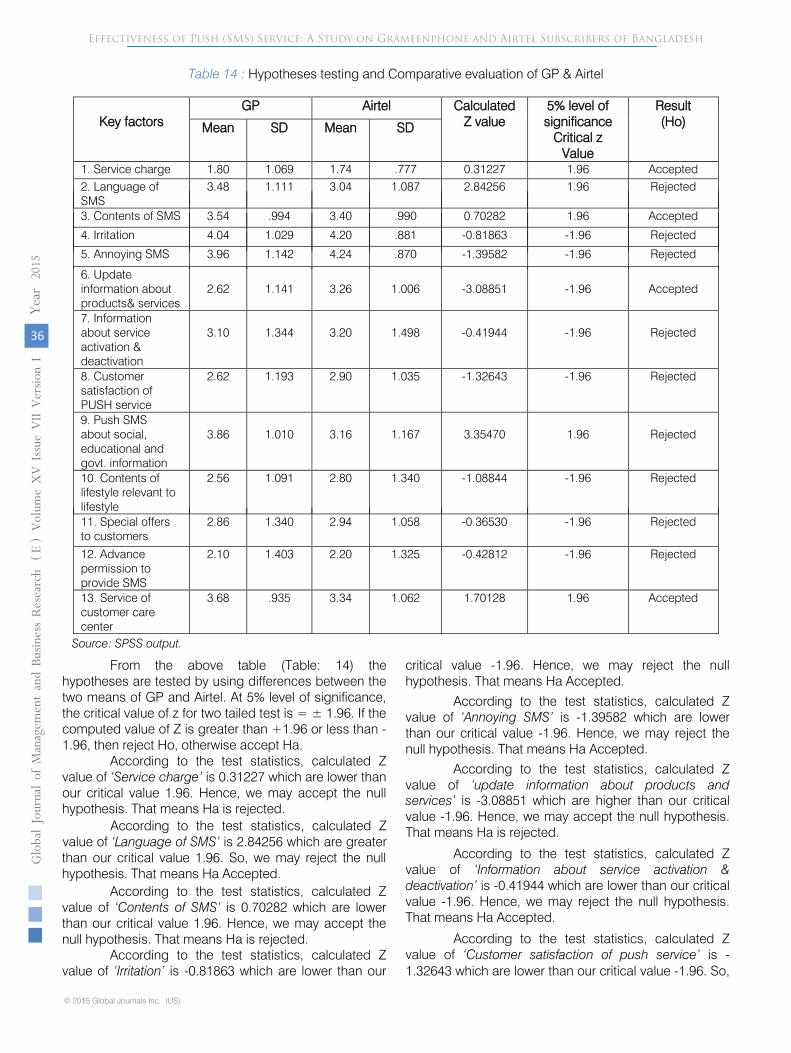
Table 14 :
Hypotheses testing and Comparative evaluation of GP & Airtel
Key factors
GP Airtel
Calculated
Z value
5% level of
significance Critical z
Value
Result (Ho)
Mean
SD
Mean
SD
1. Service charge
1.80
1.069
1.74
.777
0.31227
1.96
Accepted
2. Language of SMS
3.48
1.111
3.04
1.087
2.84256
1.96
Rejected
3. Contents of SMS
3.54
.994
3.40
.990
0.70282
1.96
Accepted
4. Irritation
4.04
1.029
4.20
.881
-0.81863
-1.96
Rejected
5. Annoying SMS
3.96
1.142
4.24
.870
-1.39582
-1.96
Rejected
6. Update information about products& services
2.62
1.141
3.26
1.006
-3.08851
-1.96
Accepted
7. Information about service activation & deactivation
3.10
1.344
3.20
1.498
-0.41944
-1.96
Rejected
8. Customer satisfaction of PUSH service
2.62
1.193
2.90
1.035
-1.32643
-1.96
Rejected
9. Push SMS
about social, educational and govt. information
3.86
1.010
3.16
1.167
3.35470
1.96
Rejected
10. Contents of lifestyle relevant to lifestyle
2.56
1.091
2.80
1.340
-1.08844
-1.96
Rejected
11. Special offers to customers
2.86
1.340
2.94
1.058
-0.36530
-1.96
Rejected
12. Advance permission to provide SMS
2.10
1.403
2.20
1.325
-0.42812
-1.96
Rejected
13. Service of customer care center
3.68
.935
3.34
1.062
1.70128
1.96
Accepted
Source: SPSS output.
From the above table (Table: 14) the hypotheses are tested by using differences between the two means of GP and Airtel. At 5% level of significance, the critical value of z for two tailed test is = ± 1.96. If the computed value of Z is greater than +1.96 or less than -1.96, then reject Ho, otherwise accept Ha.
According to the test statistics, calculated Z value of ‘Service charge’
is 0.31227 which are lower than our critical value 1.96. Hence, we may accept the null hypothesis. That means Ha is rejected.
According to the test statistics, calculated Z value of ‘Language of SMS’ is 2.84256 which are greater than our critical value 1.96. So, we may reject the null hypothesis. That means Ha Accepted.
According to the test statistics, calculated Z value of ‘Contents of SMS’ is 0.70282 which are lower than our critical value 1.96. Hence, we may accept the null hypothesis. That means Ha is rejected.
According to the test statistics, calculated Z value of ‘Irritation’ is -0.81863 which are lower than our
Effectiveness of Push (SMS) Service: A Study on Grameenphone and Airtel Subscribers of Bangladesh
© 2015 Global Journals Inc. (US)1
Globa
l Jo
urna
l of M
anag
emen
t an
d Bu
siness Resea
rch
Volum
e XV Issue
VII
Ver
sion
I
( E
)
36
Year
2015
critical value -1.96. Hence, we may reject the null hypothesis. That means Ha Accepted.
According to the test statistics, calculated Z value of ‘Annoying SMS’ is -1.39582 which are lower than our critical value -1.96. Hence, we may reject the null hypothesis. That means Ha Accepted.
According to the test statistics, calculated Z value of ‘update information about products andservices’ is -3.08851 which are higher than our critical value -1.96. Hence, we may accept the null hypothesis. That means Ha is rejected.
According to the test statistics, calculated Z value of ‘Information about service activation & deactivation’ is -0.41944 which are lower than our critical value -1.96. Hence, we may reject the null hypothesis. That means Ha Accepted.
According to the test statistics, calculated Z value of ‘Customer satisfaction of push service’ is -1.32643 which are lower than our critical value -1.96. So,
we may reject the null hypothesis. That means Ha Accepted.
According to the test statistics, calculated Z value of ‘Push SMS about social, educational and govt. information’
is 3.35470 which are greater than our critical value 1.96. So, we may reject the null hypothesis. That means Ha Accepted.
According to the test statistics, calculated Z value of ‘Contents of lifestyle relevant to lifestyle’
is -1.08844 which are lower than our critical value -1.96. So, we may reject the null hypothesis. That means Ha Accepted.
According to the test statistics, calculated Z value of ‘Special offers to customers’
is -0.36530 which are lower than our critical value -1.96. So, we may reject the null hypothesis. That means Ha Accepted.
According to the test statistics, calculated Z value of ‘Advance permission to provide SMS’
is -0.42812 which are lower than our critical value -1.96. So, we may reject the null hypothesis. That means Ha Accepted.
According to the test statistics, calculated Z value of ‘Service of customer care center’
is 1.70128 which is lower than our critical value 1.96. So, we may accept the null hypothesis. That means Ha is rejected.
o)
Summary of findings
(Comparing effectiveness between GP and Airtel in case of push services)
The above table represents that 4 variables are accepted whereas rest of the 9 variables are rejected i.e. there is a significant difference in terms of the 9 variables whereas, there are no significant differences in terms of the 4 variables (service charge, contents of SMS, update information about products and services, service of customer care center).
•
It leads us to the decision that here is no significant difference between Mean of GP and Mean of Airtel in terms of service charge.
Which refer, subscribers are not satisfied about their service charge.
•
It is found that here is significant difference between Mean of GP and Mean of Airtel regarding language of SMS. So, it is refers that
the opinion of the customers of GP is less scattered than Airtel that
indicates GP is in good position than of Airtel in context of language.
•
It leads us to the decision that there is no significant difference between GP and Airtel regarding contents of SMS.
•
It is observed that GP is in a better position
than Airtel. Customers of Airtel are more irritated than of GP.
•
It is observed that GP is in a better position than Airtel. Customers of Airtel are more annoyed when they get Push SMS than of GP.
•
It leads us to the decision that there is no significant difference between GP and Airtel regarding up to
date information about their products & services through Push SMS.
•
It is observed that Airtel is in a better position than GP in providing information about activation and deactivation of Push services through
Push SMS.
•
Customers of Airtel are more satisfied about of PUSH service than of GP. So in this subject GP is in weak compared to Airtel.
•
Customers of GP receive more Push SMS about social, educational and govt. information than of Airtel. It is observed that GP is in a better position than Airtel.
•
It is observed that GP is in a better position than Airtel in providing push SMS that is relevant to customers’ lifestyle. It is found that the opinion of the customers of GP is less scattered than Airtel.
•
It is observed that Airtel is in a better position than GP in providing special offers to the customers.
•
Although there is a very little significant regarding advance permission to send push SMS therefore Airtel is better position than of GP.
•
It is found that there is no significant difference between GP and Airtel regarding Service of customer care center. The customers of both the operators are satisfied in case Service of customer care center.
p)
Hypotheses Testing
(For overall evaluation and test the effectiveness of push service for both companies)
Data were analyzed with a Likert type 5-point scale ranging from highly dissatisfied (1) to highly satisfied (5). In this study weighted average value of 3.50 (test value) has been considered as the optimum level for every case. One-sample t-test is done to test hypotheses 1to13.
Effectiveness of Push (SMS) Service: A Study on Grameenphone and Airtel Subscribers of Bangladesh
37
Globa
l Jo
urna
l of M
anag
emen
t an
d Bu
siness Resea
rch
Volum
e XV Issue
VII
Ver
sion
IYe
ar
20
15
( E
)
© 2015 Global Journals Inc. (US)
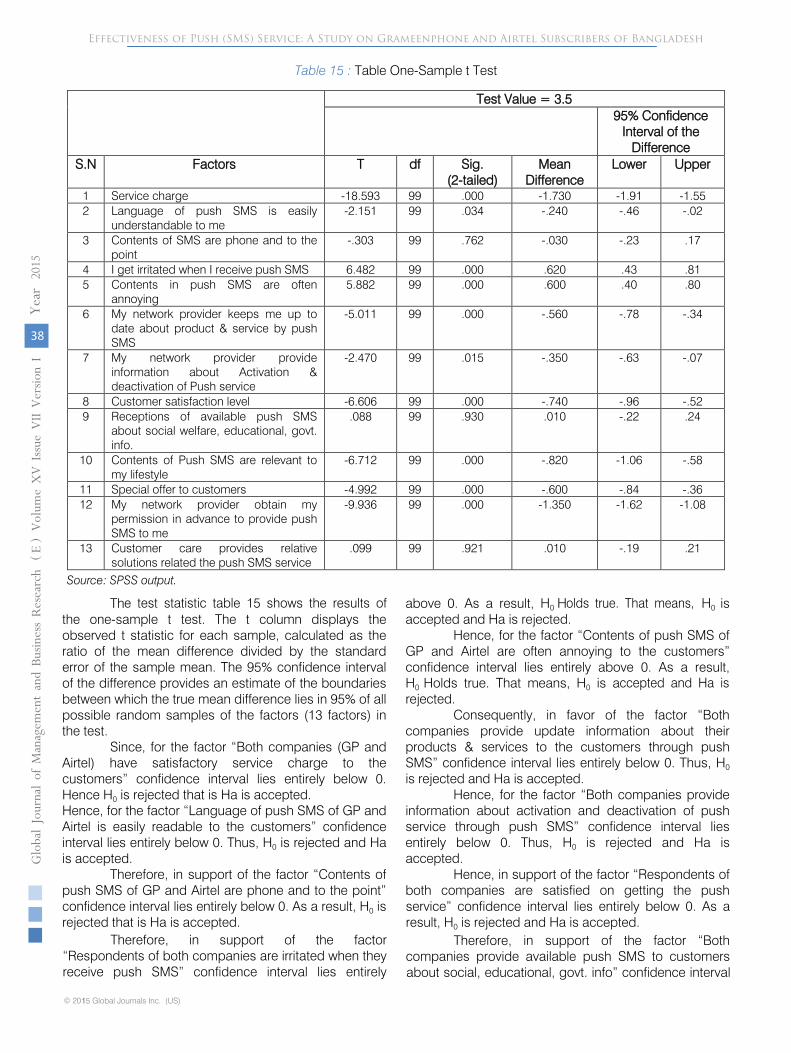
Table 15 : Table One-Sample t Test
Test Value = 3.5
95% Confidence Interval of the
Difference S.N
Factors
T df Sig.
(2-tailed)
Mean Difference
Lower
Upper
1
Service charge
-18.593
99
.000
-1.730
-1.91
-1.55 2
Language of push SMS is easily understandable to me
-2.151
99
.034
-.240
-.46
-.02
3
Contents of SMS are phone and to the point
-.303
99
.762
-.030
-.23
.17
4
I get irritated when I receive push SMS
6.482
99
.000
.620
.43
.81 5
Contents in push SMS are often annoying
5.882
99
.000
.600
.40
.80
6
My network provider keeps me up to date about product & service by push SMS
-5.011
99
.000
-.560
-.78
-.34
7
My network provider provide information about Activation & deactivation of Push service
-2.470
99
.015
-.350
-.63
-.07
8
Customer satisfaction level
-6.606
99
.000
-.740
-.96
-.52 9
Receptions of available push SMS about social welfare, educational, govt. info.
.088
99
.930
.010
-.22
.24
10
Contents of Push SMS are relevant to my lifestyle
-6.712
99
.000
-.820
-1.06
-.58
11
Special offer to customers
-4.992
99
.000
-.600
-.84
-.36 12
My network provider obtain my permission in advance to provide push SMS to me
-9.936
99
.000
-1.350
-1.62
-1.08
13
Customer care provides relative solutions related the push SMS service
.099
99
.921
.010
-.19
.21
Source: SPSS output.
The test statistic table 15 shows the results of
the one-sample t test. The t column displays the observed t statistic for each sample, calculated as the ratio of the mean difference divided by the standard error of the sample mean. The 95% confidence interval of the difference provides an estimate of the boundaries between which the true mean difference lies in 95% of all possible random samples of the factors (13 factors) in the test.
Since, for the factor “Both companies (GP and Airtel) have satisfactory service charge to the customers” confidence interval lies entirely below 0. Hence H0
is rejected that is Ha is accepted.
Hence, for the factor “Language of push SMS of GP and Airtel
is easily readable to the customers” confidence
interval lies entirely below 0. Thus, H0 is rejected and Ha
is accepted. Therefore, in support of the factor “Contents of
push SMS of GP and Airtel are phone and to the point” confidence interval lies entirely below 0. As a result, H0
is
rejected that is Ha is accepted.
Therefore, in support of the factor
“Respondents of both companies are irritated when they receive push SMS” confidence interval lies entirely
above 0. As a result, H0 Holds true. That means, H0 is
accepted and Ha is rejected.
Hence, for the factor “Contents of push SMS of GP and Airtel are often annoying to the customers” confidence interval lies entirely above 0. As a result, H0 Holds true. That means, H0
is accepted and Ha is rejected.
Consequently, in favor of the factor “Both companies provide update information about their products & services to the customers through push SMS” confidence interval lies entirely below 0. Thus, H0
is rejected and Ha is accepted.
Hence, for the factor “Both companies provide information about activation and deactivation of push
service through push SMS” confidence interval lies entirely below 0. Thus, H0
is rejected and Ha is accepted.
Hence, in support of the factor “Respondents of both companies are satisfied on getting the push
Effectiveness of Push (SMS) Service: A Study on Grameenphone and Airtel Subscribers of Bangladesh
© 2015 Global Journals Inc. (US)1
Globa
l Jo
urna
l of M
anag
emen
t an
d Bu
siness Resea
rch
Volum
e XV Issue
VII
Ver
sion
I
( E
)
38
Year
2015
service” confidence interval lies entirely below 0. As a result, H0 is rejected and Ha is accepted.
Therefore, in support of the factor “Both companies provide available push SMS to customers about social, educational, govt. info” confidence interval
lies entirely above 0. As a result, H0 Holds true. That means, H0
is accepted and Ha is rejected.
Consequently, in favor of the factor “push SMS are relevant to customers’ life style” confidence interval lies entirely below 0. As a result, H0
is rejected that is Ha is accepted.
Hence, for the factor “Both companies provide special offers to customers through push SMS” confidence interval lies entirely below 0. As a result, H0
is
rejected that is Ha is accepted.
Consequently, in favor of the factor “Both companies take the permission from respondents in advance to provide push SMS” confidence interval lies entirely below 0. As a result, H0
is rejected that is Ha is accepted.
Consequently, in favor of the factor “Services of customer care center of GP and Airtel regarding push service are in satisfactory level.” confidence interval lies entirely above 0. Thus, H0
is accepted and Ha is rejected.
q)
Summary of Findings
(Overall evaluation for both companies in case of effectiveness of push services)
•
It can be concluded that both companies (GP and Airtel) have not satisfactory service charge to the customers.
•
It can be decided that the Language of push SMS of GP and Airtel is not satisfactory level to read the SMS easily.
•
It can be concluded that Contents of push SMS of GP and Airtel are not phone and to the point.
•
It can be concluded that Respondents of both companies are irritated when they receive push SMS.
•
It can be established that Contents of push SMS of GP and Airtel
are often annoying to the customers.
•
It can be concluded that both companies do not provide update information about their products & services to the customers through push SMS.
•
It can be concluded that both companies do not provide information about activation and deactivation of push service through push SMS.
•
It can be decided that the Respondents of both companies are dissatisfied on getting the push service.
•
It can be concluded that both companies provide available push SMS to customers about social, educational, govt. info.
•
It can be concluded that push SMS are not relevant to customers’ life style.
•
It can be settled that both companies do not provide special offers to customers through push SMS.
•
It can be determined that both companies do not take the
permission from respondents in advance to provide push SMS.
•
Finally, it can be concluded that Services of customer care center of GP and Airtel regarding push service are in satisfactory level.
VI.
Recommendations and Conclusion
a)
Recommendations for Grameenphone
This study suggested some recommendations for improving the effectiveness of push service for Grameenphone are as follows-
i.
The authority of Grameenphone
should reduce its higher Service charge so that the customers can be satisfied to activate their services.
ii.
It should provide push SMS which contents will be phone and to the point.
iii.
The Company should Provide update information about their products and services to increase the effectiveness of push service.
iv.
GP should provide information about activation and deactivation of Push services through Push SMS so that customers can easily activate as well deactivate the push service.
v.
GP should increase their quality and attractiveness of push service to make satisfy their customers.
vi.
The authority of GP should give more concern for providing special offer to customers.
vii.
In case of push service GP should take advance permission to provide push SMS to the phone of customers to increase the effectiveness of push service.
So, if GP takes initiative to remove or reduce these drawbacks as well enhance the effectiveness of push service to customers then it will be more successful in the telecommunications industry of Bangladesh.
b)
Recommendations for Airtel
The following are the provided recommendations by this study to improve the effectiveness of push service of Airtel-
i.
Customers are not more satisfy about the service charge. So, Airtel should set a service charge in affordable level so that customers can activate their services frequently.
ii.
Airtel should ensure that the language of push SMS should be easy and understandable to the customers.
Effectiveness of Push (SMS) Service: A Study on Grameenphone and Airtel Subscribers of Bangladesh
39
Globa
l Jo
urna
l of M
anag
emen
t an
d Bu
siness Resea
rch
Volum
e XV Issue
VII
Ver
sion
IYe
ar
20
15
( E
)
© 2015 Global Journals Inc. (US)
iii. The authority of Airtel should give more concern about the contents of SMS. Content of SMS should be phone and to the point.
iv. Customers are irritated when they get push SMS. So Airtel should enhance the attractiveness of push SMS or take another way to enhance the effectiveness of push service like PULL SMS, door to door to campaign etc.
v.
Customers are more Annoy when they get push SMS. So, Airtel should take another strategy to communicate with customer.
vi.
Airtel should provide up to date information about their products and services to enhance their effectiveness of push service.
vii.
Providing information about activation and deactivation of push services through push SMS.
viii.
Airtel
should provide Push SMS about social, educational and govt. information to enhance their effectiveness of push service.
ix.
Airtel should provide push SMS that is relevant to customers’ life style.
x.
To enhance the effectiveness and acceptance of push SMS, Airtel may take the advance permission from customers to provide push SMS to their mobile phone.
c)
Conclusion
The general objective of this study was to determine the effectiveness of push service and comparing among selected dimensions between Grameen phone and Airtel as well as to evaluate the overall effectiveness of push service of both companies. The research has provided insights like what are positive and negative aspects of both of the operators. In most of the dimensions of push service like language of
push SMS, degree of customers’ irritation, degree of annoying, social, educational and govt. information, relevancy to customer life style, GP seems to be better than Airtel. Being the young company, Airtel is in the good position regarding information about service activation & deactivation, customer satisfaction level, special offer and advance permission. Although Grameenphone is in a better position in comparison to Airtel but it cannot be said that its services are much attractive to the customers. It
has some other problems like lack of providing special offer, advance permission, service activation & deactivation process. It is found that customers are irritated and annoyed when they receive push SMS from their service providers so that it has a negative impact on effectiveness of push service. Irritating SMS are regarded by consumers as unwanted. Also the more frequently consumers are exposed to push SMS the more they become immune and regard these SMS as unwanted. A major finding is that consumers have fairly negative attitudes towards push SMS.
The negative attitude toward push SMS implies that marketers have to take lot of strategy and plan to make push SMS and service more attractive. The results indicate that attitude toward push service via mobile devices strongly depends on language, contents and characteristics of message. The message language, contents and characteristics need to be developed carefully. Marketers may use the findings to design
mobile push SMS and push service that create positive attitudes and avoid possible negative effects. While push SMS and service offer lots of benefits to subscribers, its low acceptance rate will hinder and effectiveness of push Service will be enhanced. Marketers of GP and Airtel can take a new concept of service that is Pull SMS strategy, advertising campaigns, fair, door to door campaigns and media advertising etc. to enhance their services. The manager of Airtel should improve all the factors and the manager of Grameen phones hold reduce service charge
and provide better facilities for the customers of other operator.
References Références Referencias
1.
Akterujjaman, S. M., Md Biswas, and Md Siddique. "Performance of Grameenphone and Robi in Telecom. Sector of Bangladesh: A Comparative Study." Nur-E-Alam, Performance of Grameenphone and Robi in Telecom. Sector of Bangladesh: A Comparative Study (July 20, 2011). ASA University Review
5.2 (2011).
2.
Siddique, Md, S. M. Akterujjaman, and Rumana Perveen. "Customers’ Satisfaction towards the Services of Customer Care Centers of Grameenphone: A Study on Dhaka and Khulna Cities." ASA University Review
6.2 (2012).
3.
Alam, M. J., and M. Neger. "Measuring consumer attitude towards beautification products: A study on some selected brands in Bangladesh." Journal of Business and Technology (Dhaka)
4.2 (2009): 61.
4.
Barnes, Stuart J. "Wireless digital advertising: nature and implications." International journal of advertising
21.3 (2002): 399-420.
5.
Bauer, Hans H., et al. "Driving consumer acceptance of mobile marketing: a theoretical framework and empirical study." Journal of electronic commerce research
6.3 (2005): 181-192.
6.
Sabokwigina, Deo, Gabriel Malima, and Hosea Mpogole. "SMS advertising in Tanzania: Factors affecting consumer attitudes." IST-Africa Conference and Exhibition (IST-Africa), 2013. IEEE, 2013.
7.
Ewen, Stuart. Captains of consciousness: Advertising and the social roots of the consumer culture. Basic Books, 2008.
8.
BOSE, TARUN KANTI, et al. "SMS ADVERTISING AND ITS PROSPECTS IN BANGLADESH." Journal of
Effectiveness of Push (SMS) Service: A Study on Grameenphone and Airtel Subscribers of Bangladesh
© 2015 Global Journals Inc. (US)1
Globa
l Jo
urna
l of M
anag
emen
t an
d Bu
siness Resea
rch
Volum
e XV Issue
VII
Ver
sion
I
( E
)
40
Year
2015
Theoretical & Applied Information Technology 11 (2010).
9. Dickinger, Astrid, et al. "An investigation and conceptual model of SMS marketing." System Sciences, 2004. Proceedings of the 37th Annual Hawaii International Conference on. IEEE, 2004.
10. Barnes, Stuart J., and Eusebio Scornavacca. "Mobile marketing: the role of permission and acceptance." International Journal of Mobile Communications 2.2 (2004): 128-139.
11.
Merisavo, Marko, et al. "The effectiveness of targeted mobile advertising in selling mobile services: an empirical study." International Journal of Mobile Communications
4.2 (2006): 119-127.
12.
Goode, Mark MH, et al. "Determining customer satisfaction from mobile phones: a neural network approach." Journal of Marketing Management
21.7-8 (2005): 755-778.
13.
Lai, Tung Lai. "Service quality and perceived value's impact on satisfaction, intention and usage of short message service (SMS)." Information Systems Frontiers
6.4 (2004): 353-368.
14.
Leung, Felix, and Christy Cheung. "Consumer attitude toward mobile advertising." AMCIS 2004 Proceedings
(2004): 331. 15.
Hossain, M. S., et al. "THE DRIVERS OF CUSTOMERS’SATISFACTION OF AIRTEL BANGLADESH LIMITED."
16.
Islam, Md Zahidul. "Measuring Customer Satisfaction of Mobile Phone Users: A Comparative Study between Grameen Phone and
Teletalk Based on Khulna City, Bangladesh." European Journal of Business and Management
3.6 (2011): 20-29.
17.
Tsang, Melody M., Shu-Chun Ho, and Ting-Peng Liang. "Consumer attitudes toward mobile advertising: An empirical study." International Journal of Electronic Commerce
8.3 (2004): 65-78.
18.
Rahman, Muhammad Sabbir. "Service Quality, Corporate Image and Customer’s Satisfaction Towards Customers Perception: An Exploratory Study on Telecom Customers in Bangladesh." Business Intelligence Journal
5.1 (2012): 56-63.
19.
Hossain, Sahadat, and Farhana Islam. "Comparison of Customer Satisfaction Between Grameen Phone Ltd and Robi."
20.
Turel, Ofir, Alexander Serenko, and Nick Bontis. "User acceptance of wireless short messaging services: Deconstructing perceived value." Information & Management
44.1 (2007): 63-73.
21.
Kim, Gil Son, Se‐Bum Park, and Jungsuk Oh. "An examination of factors influencing consumer adoption of short message service (SMS)." Psychology & Marketing
25.8 (2008): 769-786.
22.
Aalto, Lauri, et al. "Bluetooth and WAP push based location-aware mobile advertising system." Proceedings of the 2nd international conference on Mobile systems, applications, and services. ACM, 2004.
23.
Rahman, Hasebur, et al. "Factors Affecting Customer Satisfaction on Grameenphone Users in Bangladesh." Global Journal of Management And Business Research
14.3 (2014).
24.
Rahman, Hasebur. "Factors aFFecting customer satisFaction in mobile telecommunication industry in bangladesh." Business, Management and Education
1 (2014): 74-93.
25.
George E. Belch & Michael A. Belch. ‘Advertising and Promotion: An Integrated Marketing
Communications Perspective’, 7th
Edition, McGraw Hill.2006.
26.
Kotler, Philip & Keller, Kevin L.; Marketing Management; PP-132-135, 13th Edition; Pearson Education (India); 2010.
27.
Lovelock, C. H., Patterson, P. G., and Walker, R. H. ‘Services Marketing: An Asia-Pacific Perspective’, Australia: prentice Hall (2011).
28.
Malhotra, Naresh K.; Marketing Research: An Applied Orientation; PP-203-235, 5th
Edition; Prentice-Hall of India; 2011.
29.
P. Kotler, G. Amstrong. ‘Principles of Marketing’, 11th Ed., New Jersey, Pearson Prentice Hall 2006.
Web references
1.
BTRC [online] Available: www.btrc.gov.bd
[Cited on: January 18, 2015]
2.
About Grameenphone [online] Available: http://-www.grameenphone.com/personal/customerservice
[Cited on: January 18, 2015]
3.
About Grameenphone [online] Available: http://www.grameenphone.com/personal/vas [Cited on: January 18, 2015]
4.
About Airtel [online] Available: http://www.-bd.airtel.com/
[Cited on: January 18, 2015]
5.
About Airtel [online] Available: http://en.-wikipedia.org/wiki/Airtel_Bangla [Cited on: January 18, 2015]
6.
About Airtel [online] Available: https://www.-facebook.com/airtelbuzz?fref=ts
[Cited on: January 20, 2015]
7.
Telecommunications in Bangladesh [online] Available: http://en.wikipedia.org/wiki/Telecommu-nications_in_Bangladesh [Cited on: January 18, 2015]
8.
About marketing [online] Available: http://www.-marketing-schools.org/[[Cited on: January 19, 2015]
Effectiveness of Push (SMS) Service: A Study on Grameenphone and Airtel Subscribers of Bangladesh
41
Globa
l Jo
urna
l of M
anag
emen
t an
d Bu
siness Resea
rch
Volum
e XV Issue
VII
Ver
sion
IYe
ar
20
15
( E
)
© 2015 Global Journals Inc. (US)
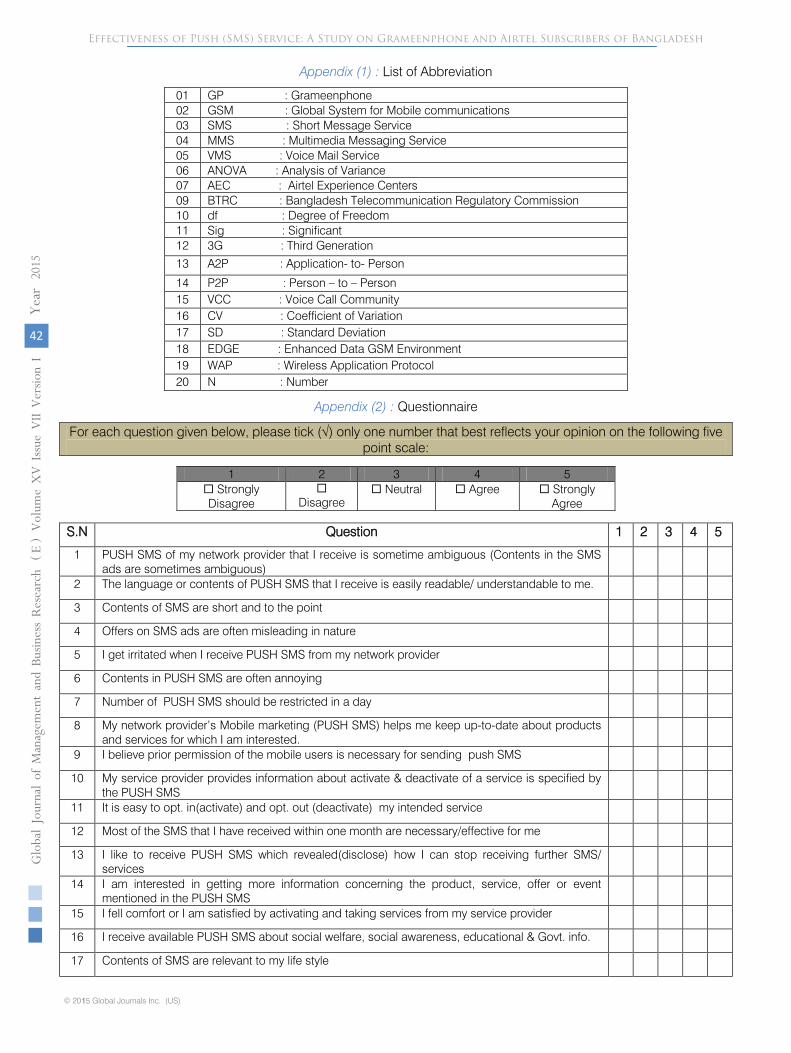
Appendix (1) : List of Abbreviation
01
GP : Grameenphone
02
GSM : Global System for Mobile communications 03
SMS : Short Message Service
04
MMS : Multimedia Messaging Service 05
VMS : Voice Mail Service
06
ANOVA : Analysis of Variance 07
AEC : Airtel Experience Centers
09
BTRC : Bangladesh Telecommunication Regulatory Commission
10
df : Degree of Freedom 11
Sig : Significant
12
3G : Third Generation
13
A2P : Application- to- Person
14
P2P : Person – to – Person
15
VCC : Voice Call Community
16
CV : Coefficient of Variation
17
SD : Standard Deviation
18
EDGE : Enhanced Data GSM Environment
19
WAP : Wireless Application Protocol
20
N : Number
Appendix (2) : Questionnaire
For each question given below, please tick (√) only one number that best reflects your opinion on the following five
point scale:
1 2 3 4 5 Strongly Disagree
Disagree
Neutral Agree Strongly Agree
S.N
Question
1 2 3 4 5
1
PUSH SMS of my network provider that I receive is sometime ambiguous (Contents in the SMS ads are sometimes ambiguous)
2
The language or contents of PUSH SMS that I receive is easily readable/ understandable to me.
3
Contents of SMS are short and to the point
4
Offers on SMS ads are often misleading in nature
5
I get irritated when I receive PUSH SMS from my network provider
6
Contents in PUSH SMS are often annoying
7
Number of PUSH SMS should be restricted in a day
8
My network provider’s Mobile marketing (PUSH SMS) helps me keep up-to-date about products and services for which I am interested.
9
I believe prior permission of the mobile users is necessary for sending push SMS
10
My service provider provides information about activate & deactivate of a service is specified by the PUSH SMS
11
It is easy to opt. in(activate) and opt. out (deactivate) my intended service
12
Most of the SMS that I have received within one month are necessary/effective for me
13
I like to receive PUSH SMS which revealed(disclose) how I can stop receiving further SMS/ services
14
I am interested in getting more information concerning the product, service, offer or event mentioned in the PUSH SMS
15
I fell comfort or I am satisfied by activating and taking services from my service provider
16
I receive available PUSH SMS about social welfare, social awareness, educational & Govt. info.
Effectiveness of Push (SMS) Service: A Study on Grameenphone and Airtel Subscribers of Bangladesh
© 2015 Global Journals Inc. (US)1
Globa
l Jo
urna
l of M
anag
emen
t an
d Bu
siness Resea
rch
Volum
e XV Issue
VII
Ver
sion
I
( E
)
42
Year
2015
17 Contents of SMS are relevant to my life style
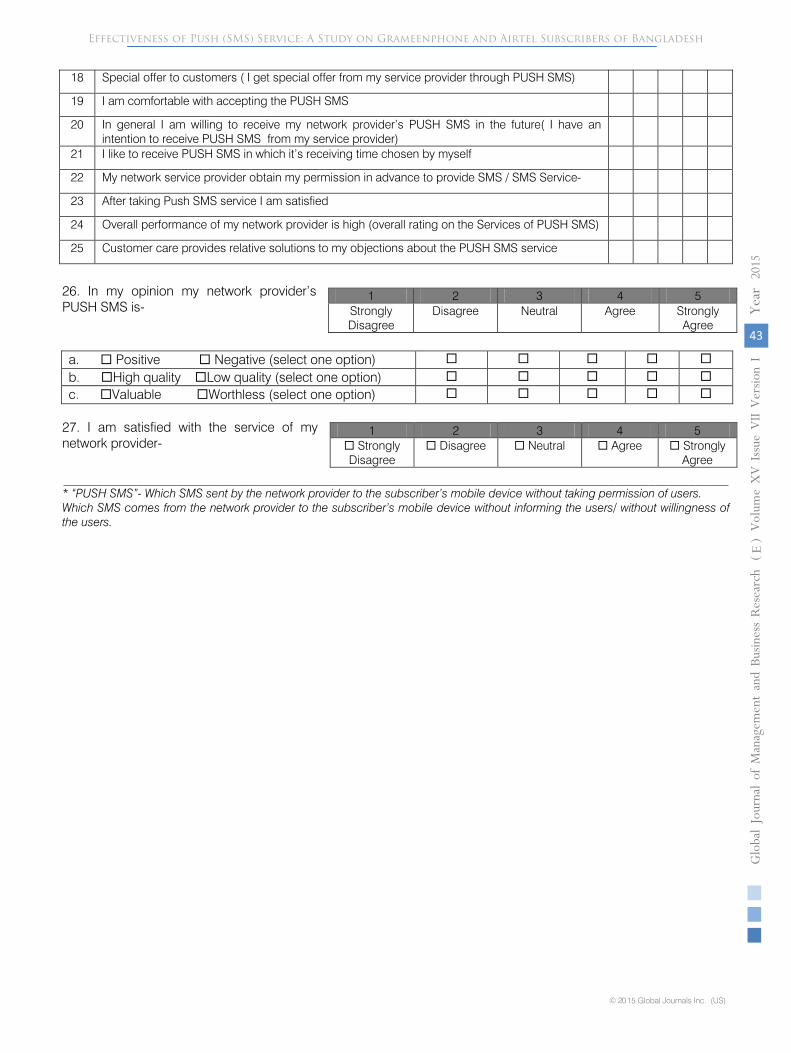
26. In my opinion my network provider’s PUSH SMS is-
a.
Positive
Negative (select one option)
b. High quality Low quality (select one option)
c. Valuable Worthless (select one option)
27.
I am satisfied with the service of my network provider-
____________________________________________________________________________________________________
* “PUSH SMS”- Which SMS sent by the network provider to the subscriber’s mobile device without taking permission of users.
Which SMS comes from the network provider to the subscriber’s mobile device without informing the users/ without willingness of the users.
18
Special offer to customers ( I get special offer from my service provider through PUSH SMS)
19
I am comfortable with accepting the PUSH SMS
20
In general I am willing to receive my network provider’s PUSH SMS in the future( I have an intention to receive PUSH SMS from my service provider)
21
I like to receive PUSH SMS in which it’s receiving time chosen by myself
22
My network service provider obtain my permission in advance to provide SMS / SMS Service-
23
After taking Push SMS service I am satisfied
24
Overall performance of my network provider is high (overall rating on the Services of PUSH SMS)
25
Customer care provides relative solutions to my objections about the PUSH SMS service
1
2
3
4
5
Strongly Disagree
Disagree
Neutral
Agree
Strongly Agree
1
2
3
4
5
Strongly
Disagree
Disagree
Neutral
Agree
Strongly Agree
Effectiveness of Push (SMS) Service: A Study on Grameenphone and Airtel Subscribers of Bangladesh
43
Globa
l Jo
urna
l of M
anag
emen
t an
d Bu
siness Resea
rch
Volum
e XV Issue
VII
Ver
sion
IYe
ar
20
15
( E
)
© 2015 Global Journals Inc. (US)
This page is intentionally left blank
3Effectiveness of Push (SMS) Service: A Study on Grameenphone and Airtel Subscribers of Bangladesh
© 2015 Global Journals Inc. (US)1
Globa
l Jo
urna
l of M
anag
emen
t an
d Bu
siness Resea
rch
Volum
e XV Issue
VII
Ver
sion
I
( E
)
44
Year
2015
Recommended