Confidential Draft
Confidential second draft –September 2007
Report for Immunization, Vaccines and Biologicals, World Health Organization
Effectiveness of pneumococcal polysaccharide vaccine: systematic review and meta-analysis of randomised controlled trials
Pippa Scott, Matthias Egger, Anke Huss
Institute of Social and Preventive Medicine (ISPM)
University of Bern, Switzerland
www.ispm.ch
Contract ID: OD/AP-07-02439
Corresponding author:
Professor Matthias Egger MD MSc FFPH DTM&H
Institute of Social and Preventive Medicine (ISPM)
University of Bern
Finkenhubelweg 11
CH-3012 Bern, Switzerland
Tel: +41 31 631 35 01
Fax: +41 31 631 35 20
Abstract 323 words, main text 4845 words, 3 tables, 39 figures, 1 appendix
1

Confidential Draft
Abstract
Background: Infection with Streptococcus pneumoniae causes substantial morbidity and mortality
worldwide. Polysaccharide pneumococcal vaccines were first developed over 50 years ago, but results
of meta-analyses have given conflicting results with respect to the efficacy of the vaccine.
Objectives: We aimed to conduct a systematic review and meta-analysis of randomised controlled
trials (RCTs) examining the effect of pneumococcal polysaccharide vaccination on clinical outcomes,
taking into account trial quality.
Search strategy: We searched Medline, Embase, the Cochrane CENTRAL database, LILACS (Latin
American and Caribbean Health Sciences Literature), IndMed (Indian Medlars Centre) and AIM
(African Index Medicus) using relevant search terms. Searches were conducted in May 2007
Selection criteria: Studies were scrutinised by two reviewers to identify RCTs which compared
polysaccharide pneumococcal vaccine recipients to a control group (receiving placebo, another
vaccine or no intervention) and which reported clinically relevant outcomes. No language restrictions
were applied.
Data extraction and analysis: Data on interventions, outcomes and quality (concealment of
allocation, blinding) were extracted in duplicate. Results were combined in random-effects meta-
analyses. Stratified analyses and meta-regression was used to examine sources of between-trial
heterogeneity, including trial quality, valency of the vaccine and other variables.
Results: We identified 31 eligible trials, which included a total of 110,676 individuals. Nineteen trials
were performed in developed countries, nine in developing countries and three in Russia. Study
populations included patients with respiratory illness, HIV-infected patients, children, miners or
soldiers, the elderly and patients with chronic illnesses. The 23-valent vaccine was used in eight trials
and the 14-valent vaccine in 13. The combined relative risk (RR) of all-cause pneumonia was 0.74
(95% CI 0.57- 0.94). There was substantial between-trial heterogeneity (test of heterogeneity
p<0.001). In meta-regression analysis, trial quality had an important effect on efficacy estimates, with
trials of higher quality showing less benefit. Amongst seven controlled double-blind trials, there was
little evidence of a protective effect of the vaccine against all-cause pneumonia: RR 1.19 (95% CI
0.97-1.47, heterogeneity p=0.126). Combined RRs were similar for trials of 23-valent vaccine, 14-
valent vaccine and trials of vaccines with lower valencies. There was some evidence, based on seven
double-blind trials, of a protective effect on mortality due to pneumonia, with a combined RR of 0.64
(95% CI 0.39-1.04), but little evidence for an effect on all-cause mortality (RR 0.94; 95% CI 0.80 -
1.10).
Conclusions: The evidence from randomised controlled trials on the efficacy of polysaccharide
pneumococcal vaccines indicates that the vaccine may be less efficacious than previously assumed.
2
Confidential Draft
Background
Infection with Streptococcus pneumoniae causes substantial morbidity and mortality
worldwide. The burden of disease due to S. pneumoniae falls mainly on children and elderly and
extends to persons with underlying conditions such as HIV infection or chronic respiratory diseases.
Patients who have undergone splenectomy or transplantation are also considered to be at increased
risk of pneumococcal disease.1 Concerningly, antibiotic resistance among pneumococcal strains is
increasing.2,3 Polysaccharide pneumococcal vaccines were first developed over 50 years ago and
have progressed from 2-valent vaccines to today’s 23-valent polysaccharide vaccine registered in the
US in 1983.4 There are more than 80 known serotypes of S. pneumoniae and the majority of those
causing disease are included the 23-valent vaccine. It has been shown that between 72% 5 and over
95% 6 of serotypes causing invasive pneumococcal disease are covered by the vaccine, with some
variation by geographical area.
Results of meta-analyses 7-22 of randomised clinical trials (RCTs) have produced conflicting
results. They differ with respect to study populations, for example children, or patients with chronic
obstructive pulmonary disease (COPD) as well as outcomes considered, for example definitive or
presumptive pneumococcal pneumonia, pneumonia from all causes or mortality. Although many of the
meta-analyses examined quality items of the trials, these were rarely considered in their statistical
analyses. The conflicting results are mirrored in variation in vaccination recommendations between
countries. The US Centres for Disease Control and Prevention (CDC), for example, recommend
vaccination for numerous high-risk groups (for example persons over 65 years) and high-risk settings
(for example nursing homes).23 In European countries recommendations generally cover fewer risk
groups. Even among the countries with wide-reaching recommendations there is some disagreement
on the groups included in the recommendations.
We conducted a systematic review and meta-analysis of RCTs examining the effect of
pneumococcal polysaccharide vaccination on clinical outcomes, taking into account the quality of the
RCTs.
3

Confidential Draft
Methods Literature search
Our literature search covered the Medline and Embase databases as well as the Cochrane
CENTRAL database of randomised controlled trials. Key words were “pneumococcal vaccine” or
“pneumococcal immunisation” in combination with “polysaccharide”. In Medline and Embase searches,
study design terms were also included (“randomized controlled trial.pt.”, “clinical trial.pt.”, “controlled
clinical trial.pt.”). We conducted an additional search in the LILACS (South American), IndMed (Indian
Medlars Centre) and AIM (African Index Medicus) databases with the search words “pneumococc*”,
“vac*” as well as “polysac*”, In addition, we screened reference lists for relevant studies, reviews and
meta-analyses. Searches were conducted in May 2007. We also searched the Cochrane library for
meta-analyses and systematic reviews, using the search terms “pneumococc*” and “polysac*”.
Eligibility criteria for studies We included all randomised controlled trials where polysaccharide pneumococcal vaccine was
compared with placebo, other vaccines or no intervention and which reported on clinical outcomes or
death. No language restrictions were applied. Studies examining antibody responses only were
excluded. We did not consider uncontrolled studies, observational intervention studies or animal and
laboratory studies. We also excluded studies where polysaccharide pneumococcal vaccine was used
as a booster after the conjugate pneumococcal vaccine.
Selection of studies and data extraction Eligibility of studies was determined independently by two reviewers (AH and PS). We
extracted data on the study population, intervention types (valency of vaccine and the control
intervention/s), sample size, sample size calculations, loss to follow up, outcomes and source of
funding. We also extracted methodological quality data, including the reporting of randomisation
processes, the method of allocation sequence generation and allocation (concealed or not), whether a
double-blind design was reported and who was blinded. All data were extracted in duplicate, and
discrepancies resolved by consensus, with the senior epidemiologist (ME) acting as the arbiter.
Authors were not contacted for further clarification.
Outcomes We analysed data for the following outcomes:
• Definitive pneumococcal pneumonia (typical clinical/radiological findings and S. pneumoniae
isolated from normally sterile body fluid such as blood),
• Presumptive pneumococcal pneumonia (typical clinical/radiological findings and either S
pneumoniae. isolated from respiratory tract samples, or seroconversion against S.
pneumoniae),
• Invasive pneumococcal disease (S. pneumoniae isolated from a usually sterile body fluid such
as blood),
4
Confidential Draft
• Pneumonia (all causes),
• Bronchitis (all cause),
• Mortality (all cause; due to pneumonia; due to pneumococcal infection),
• Meningitis,
• Bacteraemia.
Data analysis
We used a version of the “metan” command for Stata statistical software (version 9, Stata
Corporation, College Station, TX) adapted for vaccine trials to conduct DerSimonian and Laird
random-effects meta-analyses.25 Results were expressed as relative risks (RRs) with 95% confidence
intervals. In forest plots both RRs and vaccine efficacy estimates are shown. We quantified between-
trial heterogeneity using the I2 statistic, which can be interpreted as the proportion of the total variation
in estimated risk ratios that is due to between-trial heterogeneity,26 and did the standard test of
heterogeneity. Analyses are based on episodes when available, otherwise the number of cases
developing the event were used. We compared results from episode- and case-based analyses for
trials reporting both. The saline placebo group was used in analyses of trials with more than one
control group. In some instances investigators reported data from combined control groups only and
these were then included in analyses. Because some of the publications analyzed data that were
already up to ten years old, we extracted the start year of the trial. If this information was not given by
the authors, we approximated the starting year by subtracting the maximum follow-up time in years of
the publication year.
When the meta-analysis included 10 or more trials, we stratified analyses by trial quality, the
valency of the vaccine, the study setting and study population. For all-cause pneumonia, the extent to
which one or several of these study level variable explained heterogeneity was further explored using
random-effects meta-regression models (using the metareg command in Stata), adjusted and not
adjusted for trial quality. In these models we examined to what extent between-study variance, tau2,
was reduced in models including different sets of variables. We did not use meta-regression for other
outcomes because the number of trials was considered too small. In stratified and meta-regression
analyses, blinding was analysed in three groups: described as double-blind with placebo or other
vaccine used in controls (described as double-blind, controlled), not described as double-blind but
placebo or other vaccine used in controls (not described as double blind, controlled) and no
intervention in controls (unblinded). Concealment of allocation was grouped as adequate or unclear,
the valency of the vaccine as 23-valent versus 14-valent versus other, and the study population as
COPD or other lung disease, HIV-infected patients, children, miners or soldiers, the chronically ill or
elderly, and other. The trial setting was defined following common United Nations practice as
developing country, industrialized country and other (the latter including the countries of Eastern
Europe). Differences in the results between small and large trials were assessed by visual inspection
of funnel plots and by means of a statistical test for small study effects (funnel plot asymmetry), for
outcomes with 10 or more trials.
5

Confidential Draft
Results
Our literature search identified 516 references, 91 were potentially eligible. Thirty-one trials
reported in 27 articles met our inclusion criteria and were included in our meta-analysis (Figure 1).
Trial characteristics An overview of study characteristics is given in Table 1 and Appendix 1. Nineteen trials (61%)
were performed in developed countries, nine (29%) in developing countries and three (10%) in Russia.
There were five studies (16%) in patients with respiratory illness (4 COPD and 1 bronchogenic
carcinoma), one study in HIV-infected patients and nine (29%) in children. Seven studies (23%) were
in miners or soldiers, eight (26%) in the elderly or patients with chronic illnesses and one study in
people over the age of 10 years in Papua New Guinea. The 14-valent vaccine was used in 13 (42%)
trials and the 23-valent vaccine in eight (26%) trials. Eight (26%) studies reported use of another
valency of the vaccine (2-valent to 17-valent) and in two studies the vaccine was changed from 14-
valent to 23-valent vaccine mid-trial. Valencies of vaccines increased over time (Figure 2). Seven
trials (23%) reported intra-muscular administration of the vaccine and 11 (37%) subcutaneous
administration. Thirteen (42%) did not report the administration route.
Control interventions
Eight trials used no intervention in the control group. Nineteen used saline placebo. Six trials
used a vaccine in a control group. Honkanen 1999 and Koivula 1997 used influenza vaccines in both
arms. Austrian 1976 and Smit 1977 (a and b) used meningococcal vaccines in a second control group
(with saline placebo in the first). Austrian 1976 reported results for control groups separately
throughout. Only combined results for control groups were available for all-cause pneumonia and
bronchitis in Smit. Mäkelä 1981 and John 1984 used Haemophilus influenzae B vaccination in
controls.
Trial quality
Eleven of the 31 (35%) trials described the way allocation sequence was generated and in six
we judged this to be adequate. Fourteen (45%) of the trials described the way they concealed
allocation and in nine (29%) this was done in an adequate way. Thirteen trials were described as
double-blind and used placebo or other vaccine used in controls, ten were not described as double-
blind but used placebo or another vaccine in controls and 8 trials were unblinded. Eight of the 31
(26%) trials reported a sample size calculation, with one study reaching the calculated sample size.
Seven trials (23%) reported mean follow-up times. These ranged from 0.5 to 2.9 years with a mean,
over trials, of 2.1 years. Nineteen trials (61%) reported a maximum follow-up time of between 0.5 and
5 years with a mean of 2.5 years. Seven studies (23%) reported no time frame for the follow-up of trial
participants. Ten trials reported values for loss to follow-up, but only 5 (16%) of all 31 trials report loss
6

Confidential Draft
to follow-up by intervention group. Eighteen (58%) trials reported deaths and all of these trials reported
deaths by intervention group.
One trial reported the loss of records for some trial participants and this may affect results for this trial
(Riley 1977, people over 10yo in Papua New Guinea)
Diagnostic criteria for pneumonia
Of the 22 trials reporting on either all-cause, presumptive or definitive pneumococcal
pneumonia, the majority (14) reported only radiographically confirmed cases. Five did not report the
manner of pneumonia case assessment and 2 used radiographic assessment for an unspecified
percentage of cases and clinical assessment only in the remainder. One trial (MacLeod) diagnosed
pneumonia by clinical assessment only. Of the 11 trials reporting presumptive pneumococcal
pneumonia, 7 based this on culture of S. pneumoniae in addition to clinical/radiological diagnosis. Two
of the remaining studies based it on serological findings and 1 on either culture or serology (Appendix
1).
Meta-analyses
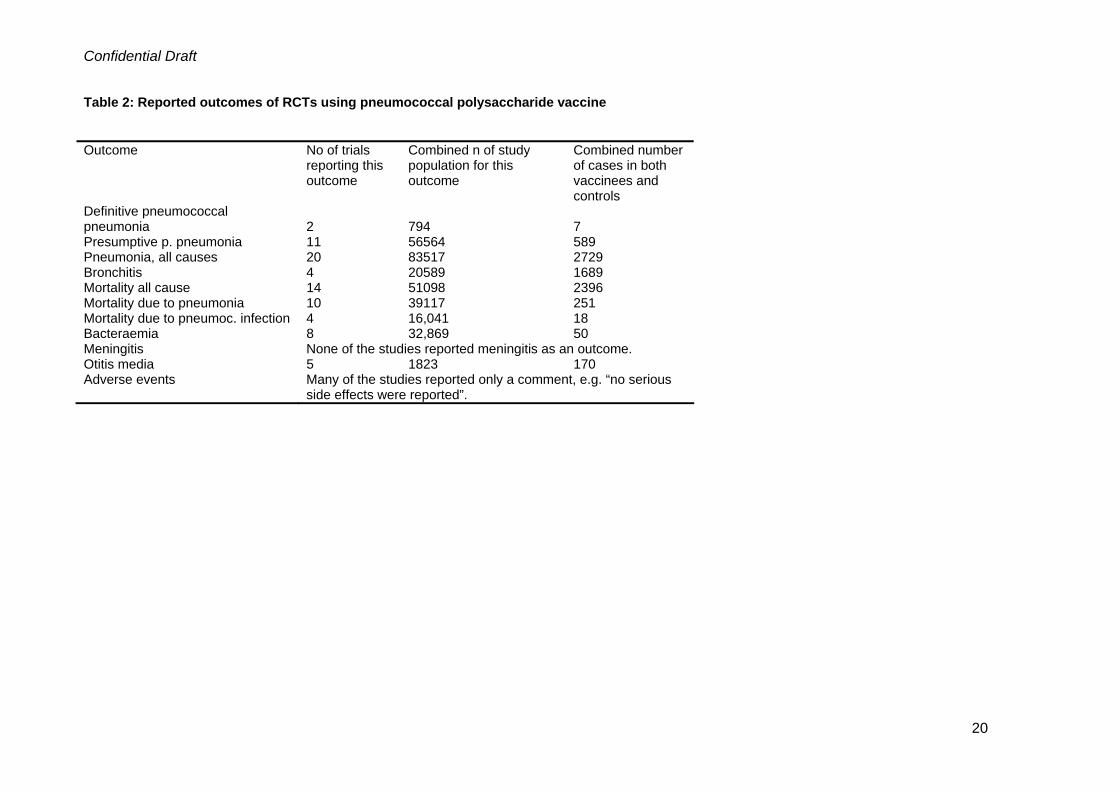
Depending on the outcome, 2 to 20 trials and 794 to 83,517 trial participants could be included
in each analysis (Table 2).
Definitive pneumococcal pneumonia
Only two trials assessed outcomes which met the criteria for definitive pneumococcal
pneumonia (i.e. typical clinical/radiographic signs and the culture of S. pneumoniae from a normally
sterile body fluid). One of these used the 23-valent vaccine and the other the 14 –valent vaccine; both
studies were reported to be double-blind. The combined RR was 0.62 (95% CI 0.05-8.61); the I2
statistic was 48.6%, with a P value for heterogeneity of 0.163 (Figure 3).
Presumptive pneumococcal pneumonia
Eleven studies assessed presumptive pneumococcal pneumonia (typical clinical/radiological
findings and either S. pneumoniae isolated from sputum/other respiratory tract samples, or sero-
conversion against S. pneumoniae). The combined RR was 0.64 (95% CI 0.43-0.96), however there
was substantial heterogeneity with an I2 value of 74.4% (heterogeneity p<0.001, Figure 4).
Three trials were described as double-blind. In these trials the combined RR was 1.20 (95% CI
0.75-1.92), with little evidence of between-trial heterogeneity (I2 =0%, heterogeneity p=0.59). Studies
that were not described as double-blind but were placebo-controlled, were heterogeneous (I2=80%,
p<0.001) and produced a combined RR of 0.54 (95% CI 0.33-0.86). One unblinded and non-placebo-
controlled trial had an RR of 0.09 (0.01-1.64) (Figure 5). Similarly, meta-analysis of the three trials with
adequate allocation concealment resulted in a combined RR of 1.06 (95% CI 0.67-1.67, I2 =0%,
heterogeneity p=0.45). Conversely, for trials with unclear allocation concealment the combined RR
was 0.55 (95% CI 0.33-0.90) with marked heterogeneity (I2=79%, p<0.001) (Figure 6). There was little
7

Confidential Draft
evidence for a protective effect in three trials of the 23-valent vaccine: the combined RR was 1.12
(95% CI 0.66-1.90, I2 =36%, p=0.21) and similar results were obtained for 14-valent vaccines (three
trials): combined RR 0.95 (95% CI 0.63-1.43), I2 =0%, p=0.46). The remaining studies were
heterogeneous (I2 =70%, p=0.010), the combined RR was 0.39 (95% CI 0.23-0.66) (Figure 7). A forest
plot ordered by the incidence of presumptive pneumococcal pneumonia in controls showed no clear
pattern (Figure 8).
The eight trials performed in developed countries gave a combined RR of 0.92 (95% CI 0.69-
1.22, I2 =31%, p=0.18) compared to an RR of 0.28 (95% CI 0.14-0.56) from three trials from
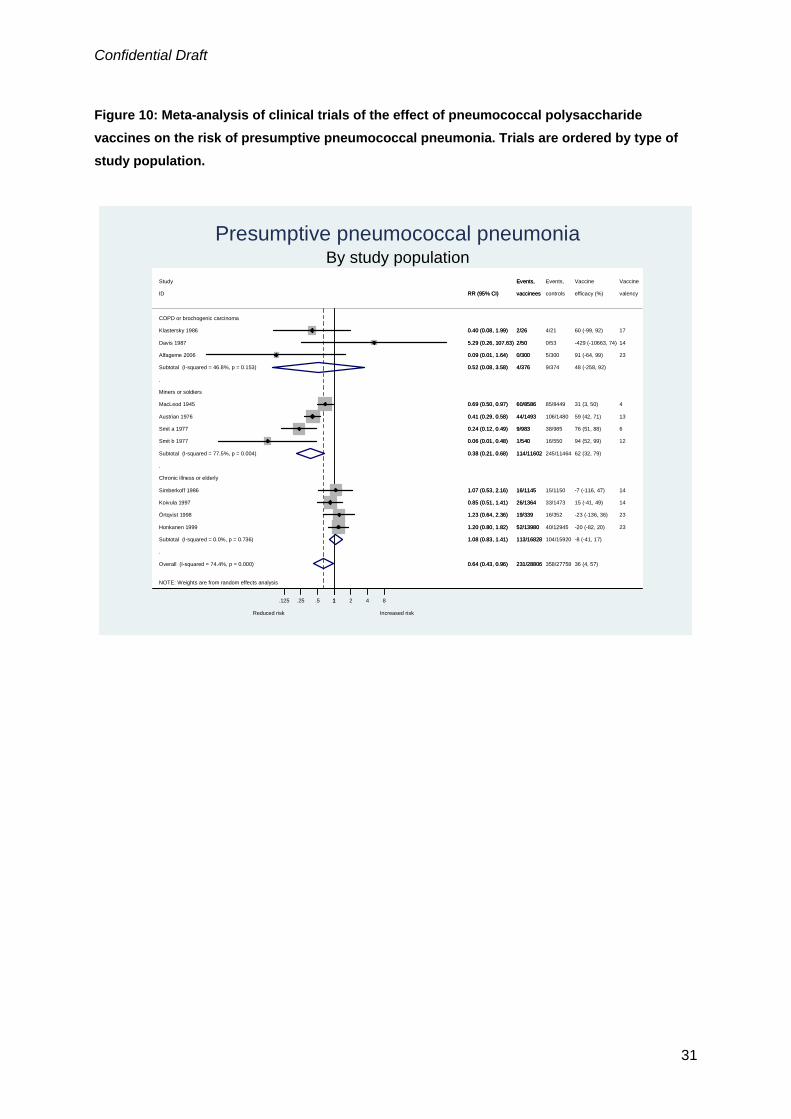
developing countries, I2 =59%, p=0.089 (Figure 9). Trials of patients with respiratory illness showed
some heterogeneity (I2 =47%, p=0.153) with a combined RR of 0.52 (95% CI 0.08-3.58). Studies in
miners or soldiers were heterogeneous (I2 =78%, p=0.004); the combined RR was 0.38 (95% CI 0.21-
0.68). Conversely, trials in the elderly or people with chronic illness were homogeneous (I2 =0%,
p=0.74) and the combined RR was 1.08 (95% CI 0.88-1.41) (Figure 10).
All cause pneumonia
Twenty trials reported on all cause pneumonia. In eight (40%) of the trials the 23-valent
vaccine was used. As shown in Figure 11, trial results were very heterogeneous (I2 =89.1%, p<0.001),
with a combined RR of 0.74 (95% CI 0.57 – 0.94). Results from stratified analyses were similar to
presumptive pneumococcal pneumonia: the double-blind and placebo-controlled trials showed only
moderate heterogeneity (I2 =40%, p=0.126), with little evidence of a protective effect of the vaccine
(RR 1.19; 95% CI 0.97-1.47). Trials that were not described as double-blind but used placebo or
another vaccine in controls and unblinded trials were highly heterogeneous (I2 =88%, p<0.001 and I2
=83%, p<0.001) with combined RRs of 0.81 (95% CI 0.58-1.12) and 0.43 (95% CI 0.27-0.67),
respectively (Figure 12). The same picture emerged for concealment of allocation: the six trials with
adequate concealment of allocation showed little heterogeneity (I2 =9%, p=0.36) with an RR close to
one (RR 1.02; 95% CI 0.88-1.18) whereas the 14 trials with unclear concealment of allocation were
very heterogeneous (I2 =92%, p<0.001) with a combined RR of 0.64 (95% CI 0.46-0.90) (Figure 13).
There were eight trials of 23-valent vaccine, six trials of 14-valent vaccine and six trials of
vaccines with valencies ranging from 3-valent to 13-valent. Between-trial heterogeneity was
substantial in all three groups (I2 between 76% and 92%). Combined RRs were similar: 0.73 (95% CI
0.44-1.24) for 23-valent vaccines, 0.80 (95% CI 0.50-1.29) for 14-valent vaccines and 0.69 (95% CI
0.47-1.02) for vaccines of other valencies (Figure 14). A forest plot ordered by the incidence of
presumptive pneumococcal pneumonia in controls showed no clear pattern (Figure 15). There was
much heterogeneity both among the twelve trials in developed countries and the five trials from
industrialized countries (I2 =83, p<0.001 and I2 =86%, p<0.001), with combined RRs of 0.89 (95% CI
0.70-1.14) and 0.76 (95% CI 0.47-1.25). The combined RR from the three Russian trials was 0.29
(95% CI 0.18 – 0.47) (Figure 16).
8

Confidential Draft
Six population groups were represented in this analysis but for three groups there was only
one trial each (HIV-infected patients, children ,and people older than 10yo in Papua New Guinea).
Trials in patients with respiratory illness showed little heterogeneity (I2 =0%, p=0.67), with a combined
RR of 0.88 (95% CI 0.63-1.23). Studies in miners or soldiers were heterogeneous (I2 =74%, p=0.002);
the combined RR was 0.42 (95% CI 0.29-0.61). The studies in the elderly or patients with chronic
illnesses were also heterogeneous (I2 =89%, p<0.001), with a combined RR of 0.90 (95% CI 0.63-
1.20) (Figure 17). Finally, six trials reported pneumonia cases as well as episodes. A comparison of
these results produced combined RRs of 1.22 (95% CI 1.03-1.46) for episodes and 1.16 (95% CI 0.97-
1.40) for cases (Figure 18).
Bronchitis
Four studies reported on bronchitis from any cause (1 used the 14-valent vaccine, 2 a 12-
valent and 1 a 6-valent). There was only weak evidence of a protective effect of the vaccine (RR
0.92;95% CI 0.76-1.12). Between-trial heterogeneity was moderate (I2 =54%, p=0.090). Only one trial
was reported to be double-blind (Simberkoff 1986), and both this trial and Austrian b 1980 were
considered to have adequate allocation concealment (Figure 19).
All cause mortality
Fourteen studies reported all-cause mortality. The proportion of study participants dying in
control groups ranged from 0% to 28%. The meta-analysis showed little evidence of a protective effect
of the vaccine with a combined RR of 0.94 (95% CI 0.84-1.05) and some between-trial heterogeneity
(I2 =46%, p=0.031) (Figure 20). In contrast to presumptive pneumococcal pneumonia and all-cause
pneumonia, blinding status had little influence on results: The combined RR was 0.94 (95% CI 0.80 -
1.10) for nine double-blind studies using placebo or another vaccine in controls, 0.98 (95% CI 0.82-
1.18) for two trials that were not described as double blind but used a placebo in controls and 0.86
(95% CI 0.60-1.23) for the three unblinded trials (Figure 21). Similarly, there was little difference
between the five adequately concealed trials and the nine trials with unclear concealment of allocation.
Combined RRs were 0.97 (95% CI 0.75-1.24) and 0.93 (95% CI 0.81-1.05), respectively (Figure 22).
Combined RRs in groups defined by the valency of the vaccine used in trials were also fairly similar:
1.00 (95% CI 0.87-1.16) for three trials of 23-valent vaccine, 0.95 (95% CI 0.81-1.11) for eight trials of
14-valent vaccine and 0.79 (95% CI 0.54-1.14) for the three trials of other vaccine valencies (Figure
23). When sorting the trials by mortality in controls there was some evidence to indicate a weak
protective effect of the vaccine in trials with lower mortality (Figure 24).
In developing countries (four trials) there was some evidence of a protective effect of the
vaccine with an RR of 0.84 (95% CI 0.70-1.02) while in developed countries (10 trials) the combined
RR was 1.00 (95% CI 0.87-1.14) (Figure 25). The trials from Russia did not report on mortality. Trials
in patients with respiratory illness showed little heterogeneity (I2 =0%, p=0.49), with a combined RR of
0.96 (95% CI 0.73-1.28). The two studies in children (both from Papua New Guinea) were also
homogeneous (I2 =0%, p=0.84), indicating a reduction in mortality (combined RR 0.70; 95% CI 0.51-
9

Confidential Draft
0.96). Conversely, the trials in the elderly or people with chronic illness were more heterogeneous (I2
=54%, p=0.042), with a combined RR of 0.99 (95% CI 0.85-1.17) (Figure 26).
10

Confidential Draft
Mortality due to pneumonia
Ten trials reported on mortality due to pneumonia. In two trials the 23-valent vaccine was
used, six trials used the 14-valent vaccine and two a vaccine of lower valency. The combined RR over
all trials was 0.77 (95% CI 0.53-0.1.11), with moderate heterogeneity (I2 of 37%, p=0.12) (Figure 27).
There were seven trials which were described as double-blind and used placebo or another vaccine in
controls. Meta-analysis of these trials showed some evidence of a protective effect of the vaccine with
an RR of 0.64 (95% CI 0.39-1.04) (Figure 28). The five trials with adequate concealment of allocation
produced a combined RR of 0.89 (95% CI 0.50-1.61), compared to a combined RR of 0.59 (95% CI
0.37-0.94) in the five trials with unclear concealment (Figure 29). The combined RR was 0.90 (95% CI
0.35-2.33) for the two trials of 23-valent vaccine, 0.69 (95% CI 0.39-1.20) for the six trials of 14-valent
vaccines and 0.88 (95% CI for the two trials of other valencies (Figure 30). No obvious pattern
emerged when ordering trials according to mortality from pneumonia in controls (Figure 31).
Stratifying trials by setting gave a combined RR of 0.50 (95% CI 0.33-0.76) for seven trials
from developing countries, compared to an RR of 1.06 (95% CI 0.76-1.47) for three trials from
industrialized countries (Figure 32). The trials from Russia did not report on mortality from pneumonia.
Four different types of study populations were included in this analysis. Two trials in patients with
respiratory illness gave a combined RR of 0.82 (95% CI 0.32-2.07), two studies of children in Papua
New Guinea an RR of 0.39 (95% CI 0.19-0.80), and the five studies in the elderly or patients with
chronic illness an RR of 1.08 (95% CI 0.72-1.62). The RR from a study in people over the age of 10yo
in Papua New Guinea was 0.57 (95% CI 0.34-0.94) although the authors of this trial report a loss of
records which may have affected results (Figure 33).
Other outcomes
Four trials reported mortality due to pneumococcal infection: Two used the 14-valent vaccine,
1 a 12-valent and 1 a 17 valent. There was little heterogeneity (I2 =14%, p=0.31). The combined RR
was 0.93 (95% CI 0.29-3.05) (Figure 34). Eight trials reported on bacteraemia, septicaemia or invasive
pneumococcal disease. Three used the 23-valent vaccine, 3 used the 14-valent vaccine, 1 a 12-valent
and 1 a 17-valent vaccine. Again, there was little heterogeneity in the results (I2 =0%, p=0.50). The
combined RR was for this outcome was 0.98 (95% CI 0.55-1.75) (Figure 35).
Meta-regression analyses The results from meta-regression analyses of the 20 trials that examined pneumonia of all
causes are shown in Table 3. Results are presented as ratios of relative risks (relative risk with
characteristic divided by relative risk without characteristic). Ratios above 1.0 correspond to a larger
relative risk for trials with characteristic and hence a smaller apparent benefit of the vaccine. In
univariate analyses, the year of publication, the year the study started and vaccine valency had little
influence on the between-trial variance (tau2). In other words, these variables contributed little to
heterogeneity. The degree of blinding was strongly associated with trial results, accounting for about
half of between-trial heterogeneity. The association with concealment of allocation was weak. The type
11

Confidential Draft
of study population and the trial setting also accounted for some heterogeneity. In multivariate
analyses adjusted for trial quality, ratios of relative risks generally moved closer to 1, indicating that
some of the effects observed in univariate analyses were due to differences in trial quality. Trial quality
and the type of study population explained virtually all between-trial heterogeneity. In this analysis, a
beneficial effect of the vaccine continued to be evident in the studies of miners and soldiers and the
study in individuals older than 10 years in Papua New Guinea.
Funnel plots Funnel plots for outcomes with ten or more trials (presumptive pneumococcal pneumonia,
pneumonia from all causes, mortality from all causes, mortality from pneumonia) are shown in Figures
36 to 39. There was some evidence of funnel plot asymmetry for trials of all-cause mortality, but not in
trials of the other outcomes.
12

Confidential Draft
Discussion
Our meta-analysis of the effectiveness of polysaccharide pneumococcal vaccine (PPV) on a
range of clinically relevant outcomes revealed a high degree of heterogeneity between trials, some of
which could be explained by the methodological quality of trials. Trials with higher quality, that is, those
with a double-blind design and adequate concealment of allocation, generally showed little evidence of
a protective effect of the vaccine in preventing presumptive pneumococcal pneumonia, pneumonia
from any cause, and all-cause mortality. There was some evidence, based on seven trials of high
quality, of a protective effect on mortality due to pneumonia, but confidence intervals were wide and
included 1. It nevertheless is possible that PPV has little effect on the risk of pneumonia but improves
outcome. Analyses of definitive pneumococcal pneumonia, bronchitis, mortality due to pneumococcal
infection, and bacteraemia were based on few trials or few events, and the results provide can
therefore neither confirm nor exclude a protective effect of the vaccine.
Strengths and limitations
This is the most comprehensive analysis of trials of PPV to date: our literature search was
thorough (with dedicated database searches covering South America, India and Africa as well as the
industrialized world) and we examined a range of clinically relevant health outcomes in numerous
population groups. Unlike many previous meta-analyses, we assessed sources of heterogeneity
between studies. A detailed analysis by age of the participants was not possible due to missing data in
a number of trials, however, we were able to approximate this in the analyses by population groups
where three broad age groups exist in our sub-groupings (children, young adults (the miner/soldier
group) and older/elderly adults)
Although it seems likely, based on empirical evidence of bias and theoretical considerations,
that trials of higher methodological quality will provide results that are closer to the truth than trials of
low quality, our study cannot prove that this is the case for the trials examined in the present review.
Our stratified analyses and meta-regressions are observational in nature, and other factors associated
both with the quality of the trial and the estimates of vaccine efficacy could have confounded our
results. When restricting analyses to trials of higher quality, between-trial heterogeneity tended to
decrease, which speaks against the presence of important confounding. Increasing the number of
strains included in the vaccine from 2 up to 23 was not associated with improved vaccine efficacy in
any of the outcomes examined. This is an unexpected but important observation, which casts doubt on
the vaccine’s efficacy in general. In fact, there was a trend in the opposite direction, with the older
trials using vaccines of lower valencies showing greater effects of the vaccine. However, the older
trials also tended to be of lower methodological quality.
Our review and meta-analysis included several disease outcomes but did not systematically
assess adverse events. Our protocol stipulated that adverse events would be examined, however, we
found that these were poorly reported: they were often listed only for a sub-group of study participants
13

Confidential Draft
or not reported separately for vaccines and controls. It is nevertheless important to note that no
serious side effects have been reported in any trials of a commercial PPV, which supports the safety
of the vaccine. There is some unavoidable inaccuracy in our results due to poor reporting in some of
the included trials. This was particularly an issue in the assessment of trial quality and of follow-up
time. Our results may therefore underestimate the importance of trial quality, due to imprecision in
measurement resulting in (non-differential) misclassification and residual confounding. For example, in
multivariable meta-regression analysis a beneficial effect of the vaccine on the risk of all-cause
pneumonia continued to be evident in the studies of miners and soldiers. Some of these studies were
done in the 1940s and 1970s, with poor reporting of methodology, and it is possible that their quality
was rated too highly in our study. In particular, assessment of outcomes in these trials may have been
unblinded, despite the use of an intervention in controls.. It is also likely that, due to the fundamental
difficulty in obtaining a definite aetiological cause of pneumonia, only a fraction of pneumonias caused
by S. pneumoniae are included in our definitive pneumococcal pneumonia analysis.
The trials we have included span many decades and there have been changes in the vaccine
and trial quality and reporting over this time. It could also be speculated that changes in the pathogen
may have occurred over this time. However, there is no obvious pattern in the effect of the vaccine
over time. Although widely used all over the world, there are relatively few trials of the 23-valent
vaccine which limits the extent of analyses which can be undertaken within this group. Finally, there
are no randomised controlled trials in splenectomised patients, a group in which the use of PPV is
frequently recommended.
Context
Our findings are at odds with those of several previous meta-analyses. We find that, after
controlling for methodological quality, there is little evidence that vaccination with PPV provides the
beneficial effect seen in previous analyses, which did not consider trial quality. An additional difference
relates to the three trials from Zhogolev 2003, which we included in our analysis. Since 2003, eight
meta-analyses have been done. However, six of these focused on restricted populations (for example
patients with sickle-cell anaemia) and therefore would not include these trials (in military recruits). Of
the remaining two meta-analyses, one only searched Medline, which does not index the Zhogolev
study, and the other lists its most recent amendment at a date before this paper could have appeared
in the Cochrane listings.
Implications and future research
The lack of clear evidence for a protective effect of the pneumococcal polysaccharide vaccine
should inform discussions on its place developing and industrialized countries, and different target
groups. Further high quality trials with appropriately blinded assessment of outcomes would be useful
to confirm or refute the hypothesis that the benefits observed in previous trials were associated with
lower methodological quality. Alternatively, emphasis could be placed on conducting high quality trials
of the conjugate vaccine in adults and increasing availability of this vaccine if found to be effective.
14

Confidential Draft
A systematic review of case-control studies would also be helpful. Such a review should again pay
attention to the quality of studies, and particularly to blinding of interviewers and patients to the study
objective.
15

Confidential Draft
References 1. Obaro, S.K., M.A. Monteil, and D.C. Henderson, The pneumococcal problem. Bmj, 1996.
312(7045): p. 1521-5. 2. Marrie, T.J., Therapeutic implications of macrolide resistance in pneumococcal community-
acquired lower respiratory tract infections. Int J Clin Pract, 2004. 58(8): p. 769-76. 3. Bruinsma, N., K.G. Kristinsson, S. Bronzwaer, P. Schrijnemakers, J. Degener, E. Tiemersma,
W. Hryniewicz, J. Monen, and H. Grundmann, Trends of penicillin and erythromycin resistance among invasive Streptococcus pneumoniae in Europe. J Antimicrob Chemother, 2004. 54(6): p. 1045-50.
4. Lipsky, B.A. and J.V. Hirschmann, Pneumococcal polysaccharide vaccines do not protect the elderly from pneumococcal infections. Neth J Med, 2004. 62(2): p. 33-5.
5. Rohani, M.Y., A. Raudzah, A.J. Ng, P.P. Ng, A.A. Zaidatul, I. Asmah, M. Murtaza, N. Parasakthy, M.Y. Mohd Yasmin, and Y.M. Cheong, Epidemiology of Streptococcus pneumoniae infection in Malaysia. Epidemiol Infect, 1999. 122(1): p. 77-82.
6. Kyaw, M.H., S. Clarke, G.F. Edwards, I.G. Jones, and H. Campbell, Serotypes/groups distribution and antimicrobial resistance of invasive pneumococcal isolates: implications for vaccine strategies. Epidemiol Infect, 2000. 125(3): p. 561-72.
7. Chang, C.C., R.J. Singleton, P.S. Morris, and A.B. Chang, Pneumococcal vaccines for children and adults with bronchiectasis. Cochrane Database Syst Rev, 2007(2): p. CD006316.
8. Granger, R., J. Walters, P.J. Poole, T.J. Lasserson, P. Mangtani, C.J. Cates, and R. Wood-Baker, Injectable vaccines for preventing pneumococcal infection in patients with chronic obstructive pulmonary disease. Cochrane Database Syst Rev, 2006(4): p. CD001390.
9. Chaithongwongwatthana, S., W. Yamasmit, S. Limpongsanurak, P. Lumbiganon, J.A. Desimone, J. Baxter, and J.E. Tolosa, Pneumococcal vaccination during pregnancy for preventing infant infection. Cochrane Database Syst Rev, 2006(1): p. CD004903.
10. Melegaro, A. and W.J. Edmunds, The 23-valent pneumococcal polysaccharide vaccine. Part I. Efficacy of PPV in the elderly: a comparison of meta-analyses. Eur J Epidemiol, 2004. 19(4): p. 353-63.
11. Conaty, S., L. Watson, J. Dinnes, and N. Waugh, The effectiveness of pneumococcal polysaccharide vaccines in adults: a systematic review of observational studies and comparison with results from randomised controlled trials. Vaccine, 2004. 22(23-24): p. 3214-24.
12. Davies, E.G., C. Riddington, R. Lottenberg, and N. Dower, Pneumococcal vaccines for sickle cell disease. Cochrane Database Syst Rev, 2004(1): p. CD003885.
13. Straetemans, M., E.A. Sanders, R.H. Veenhoven, A.G. Schilder, R.A. Damoiseaux, and G.A. Zielhuis, Pneumococcal vaccines for preventing otitis media. Cochrane Database Syst Rev, 2004(1): p. CD001480.
14. Dear, K., J. Holden, R. Andrews, and D. Tatham, Vaccines for preventing pneumococcal infection in adults. Cochrane Database Syst Rev, 2003(4): p. CD000422.
15. Puig-Barbera, J., A. Belenguer Varea, M. Goterris Pinto, and M.J. Brines Benlliure, [Pneumococcal vaccine effectiveness in the elderly. Systematic review and meta-analysis]. Aten Primaria, 2002. 30(5): p. 269-81; discussion 281-3.
16. Watson, L., B.J. Wilson, and N. Waugh, Pneumococcal polysaccharide vaccine: a systematic review of clinical effectiveness in adults. Vaccine, 2002. 20(17-18): p. 2166-73.
17. Cornu, C., D. Yzebe, P. Leophonte, J. Gaillat, J.P. Boissel, and M. Cucherat, Efficacy of pneumococcal polysaccharide vaccine in immunocompetent adults: a meta-analysis of randomized trials. Vaccine, 2001. 19(32): p. 4780-90.
18. Sheikh, A., B. Alves, and S. Dhami, Pneumococcal vaccine for asthma. Cochrane Database Syst Rev, 2002(1): p. CD002165.
19. Moore, R.A., P.J. Wiffen, and B.A. Lipsky, Are the pneumococcal polysaccharide vaccines effective? Meta-analysis of the prospective trials. BMC Fam Pract, 2000. 1: p. 1.
16

Confidential Draft
20. Hutchison, B.G., A.D. Oxman, H.S. Shannon, S. Lloyd, C.A. Altmayer, and K. Thomas, Clinical effectiveness of pneumococcal vaccine. Meta-analysis. Can Fam Physician, 1999. 45: p. 2381-93.
21. Go, E.S. and Z.K. Ballas, Anti-pneumococcal antibody response in normal subjects: a meta-analysis. J Allergy Clin Immunol, 1996. 98(1): p. 205-15.
22. Fine, M.J., M.A. Smith, C.A. Carson, F. Meffe, S.S. Sankey, L.A. Weissfeld, A.S. Detsky, and W.N. Kapoor, Efficacy of pneumococcal vaccination in adults. A meta-analysis of randomized controlled trials. Arch Intern Med, 1994. 154(23): p. 2666-77.
23. CDC, Recommended Adult Immunization Schedule - United States, October 2006-September 2007. MMWR, 2006. 55(40): p. Q1-Q4.
24. Pebody, R.G., T. Leino, H. Nohynek, W. Hellenbrand, S. Salmaso, and P. Ruutu, Pneumococcal vaccination policy in Europe. Euro Surveill, 2005. 10(9): p. 174-8.
25. DerSimonian, R. and N. Laird, Meta-analysis in clinical trials. Control Clin Trials, 1986. 7(3): p. 177-88.
26. Higgins, J.P. and S.G. Thompson, Quantifying heterogeneity in a meta-analysis. Stat Med, 2002. 21(11): p. 1539-58.
27. Alfageme, I., R. Vazquez, N. Reyes, J. Munoz, A. Fernandez, M. Hernandez, M. Merino, J. Perez, and J. Lima, Clinical efficacy of anti-pneumococcal vaccination in patients with COPD. Thorax, 2006. 61(3): p. 189-95.
28. Austrian, R., R.M. Douglas, G. Schiffman, A.M. Coetzee, H.J. Koornhof, S. Hayden-Smith, and R.D. Reid, Prevention of pneumococcal pneumonia by vaccination. Trans Assoc Am Physicians, 1976. 89: p. 184-94.
29. Austrian, R., Surveillance of pneumococcal infection for field trials of polyvalent pneumococcal vaccines, M.N.I.o.H. Bethesda, National Institute of Allergy and Infectious Diseases, Editor. 1980.
30. Davis, A.L., C.P. Aranda, G. Schiffman, and L.C. Christianson, Pneumococcal infection and immunologic response to pneumococcal vaccine in chronic obstructive pulmonary disease. A pilot study. Chest, 1987. 92(2): p. 204-12.
31. Douglas, R.M. and H.B. Miles, Vaccination against Streptococcus pneumoniae in childhood: lack of demonstrable benefit in young Australian children. J Infect Dis, 1984. 149(6): p. 861-9.
32. Douglas, R.M., D. Hansman, B. McDonald, J. Paton, and K. Kirke, Pneumococcal vaccine in aboriginal children--a randomized controlled trial involving 60 children. Community Health Stud, 1986. 10(2): p. 189-96.
33. French, N., C.F. Gilks, A. Mujugira, C. Fasching, J. O'Brien, and E.N. Janoff, Pneumococcal vaccination in HIV-1-infected adults in Uganda: humoral response and two vaccine failures. Aids, 1998. 12(13): p. 1683-9.
34. Gaillat, J., D. Zmirou, M.R. Mallaret, D. Rouhan, J.P. Bru, J.P. Stahl, P. Delormas, and M. Micoud, [Clinical trial of an antipneumococcal vaccine in elderly subjects living in institutions]. Rev Epidemiol Sante Publique, 1985. 33(6): p. 437-44.
35. Honkanen, P.O., T. Keistinen, L. Miettinen, E. Herva, U. Sankilampi, E. Laara, M. Leinonen, S.L. Kivela, and P.H. Makela, Incremental effectiveness of pneumococcal vaccine on simultaneously administered influenza vaccine in preventing pneumonia and pneumococcal pneumonia among persons aged 65 years or older. Vaccine, 1999. 17(20-21): p. 2493-500.
36. John, A.B., A. Ramlal, H. Jackson, G.H. Maude, A.W. Sharma, and G.R. Serjeant, Prevention of pneumococcal infection in children with homozygous sickle cell disease. Br Med J (Clin Res Ed), 1984. 288(6430): p. 1567-70.
37. Karsh, J., N. Pavlidis, G. Schiffman, and H.M. Moutsopoulos, Immunization of patients with Sjogren's syndrome with pneumococcal polysaccharide vaccine: a randomized trial. Arthritis Rheum, 1980. 23(11): p. 1294-8.
38. Kaufman, P., Pneumonia in old age: active immunization against pneumonia with pneumococcus polysaccharide; results of a six year study. Arch Intern Med, 1947. 79: p. 518.
39. Kaufman, P., Studies on old age pneumonia. II. Prophylactic effect of pneumococcus polysaccharide against pneumonia. Archives of Internal Medicine, 1941. 61: p. 304-319.
40. Klastersky, J., P. Mommen, F. Cantraine, and A. Safary, Placebo controlled pneumococcal immunization in patients with bronchogenic carcinoma. Eur J Cancer Clin Oncol, 1986. 22(7): p. 807-13.
41. Koivula, I., M. Sten, M. Leinonen, and P.H. Makela, Clinical efficacy of pneumococcal vaccine in the elderly: a randomized, single-blind population-based trial. Am J Med, 1997. 103(4): p. 281-90.
17

Confidential Draft
18
42. Leech, J.A., A. Gervais, and F.L. Ruben, Efficacy of pneumococcal vaccine in severe chronic obstructive pulmonary disease. Cmaj, 1987. 136(4): p. 361-5.
43. Lehmann, D., T.F. Marshall, I.D. Riley, and M.P. Alpers, Effect of pneumococcal vaccine on morbidity from acute lower respiratory tract infections in Papua New Guinean children. Ann Trop Paediatr, 1991. 11(3): p. 247-57.
44. MacLeod, C.M., R.D. Hodges, M. Heidelberger, and W.G. Bernhard, Prevention of pneumococcal pneumonia by immunization with specific capsular serotypes. J Exp Med, 1945. 82: p. 445-465.
45. Mäkelä, P.H., M. Sibakov, E. Herva, J. Henrichsen, J. Luotonen, M. Timonen, M. Leinonen, M. Koskela, J. Pukander, S. Pontynen, P. Gronroos, and P. Karma, Pneumococcal vaccine and otitis media. Lancet, 1980. 2(8194): p. 547-51.
46. Örtqvist, A., J. Hedlund, L.A. Burman, E. Elbel, M. Hofer, M. Leinonen, I. Lindblad, B. Sundelof, and M. Kalin, Randomised trial of 23-valent pneumococcal capsular polysaccharide vaccine in prevention of pneumonia in middle-aged and elderly people. Swedish Pneumococcal Vaccination Study Group. Lancet, 1998. 351(9100): p. 399-403.
47. Riley, I.D., P.I. Tarr, M. Andrews, M. Pfeiffer, R. Howard, P. Challands, and G. Jennison, Immunisation with a polyvalent pneumococcal vaccine. Reduction of adult respiratory mortality in a New Guinea Highlands community. Lancet, 1977. 1(8026): p. 1338-41.
48. Riley, I.D., F.A. Everingham, D.E. Smith, and R.M. Douglas, Immunisation with a polyvalent pneumococcal vaccine. Effect of respiratory mortality in children living in the New Guinea highlands. Arch Dis Child, 1981. 56(5): p. 354-7.
49. Riley, I.D., D. Lehmann, M.P. Alpers, T.F. Marshall, H. Gratten, and D. Smith, Pneumococcal vaccine prevents death from acute lower-respiratory-tract infections in Papua New Guinean children. Lancet, 1986. 2(8512): p. 877-81.
50. Rosen, C., P. Christensen, J. Henrichsen, B. Hovelius, and K. Prellner, Beneficial effect of pneumococcal vaccination on otitis media in children over two years old. Int J Pediatr Otorhinolaryngol, 1984. 7(3): p. 239-46.
51. Schuller, D.E., Prophylaxis of otitis media in asthmatic children. Pediatr Infect Dis, 1983. 2(4): p. 280-3.
52. Steentoft, J., H.B. Konradsen, J. Hilskov, G. Gislason, and J.R. Andersen, Response to pneumococcal vaccine in chronic obstructive lung disease--the effect of ongoing, systemic steroid treatment. Vaccine, 2006. 24(9): p. 1408-12.
53. Shahid, N.S., M.C. Steinhoff, S.S. Hoque, T. Begum, C. Thompson, and G.R. Siber, Serum, breast milk, and infant antibody after maternal immunisation with pneumococcal vaccine. Lancet, 1995. 346(8985): p. 1252-7.
54. Simberkoff, M.S., A.P. Cross, M. Al-Ibrahim, A.L. Baltch, P.J. Geiseler, J. Nadler, A.S. Richmond, R.P. Smith, G. Schiffman, D.S. Shepard, and et al., Efficacy of pneumococcal vaccine in high-risk patients. Results of a Veterans Administration Cooperative Study. N Engl J Med, 1986. 315(21): p. 1318-27.
55. Smit, P., D. Oberholzer, S. Hayden-Smith, H.J. Koornhof, and M.R. Hilleman, Protective efficacy of pneumococcal polysaccharide vaccines. Jama, 1977. 238(24): p. 2613-6.
56. Zhogolev, S.D., V.D. Mosiagin, V.U. Demidovich, P.I. Mel'nichenko, and P.I. Ogarkov, [Efficacy of pneumococcal vaccine in military units]. Zh Mikrobiol Epidemiol Immunobiol, 2003(2): p. 36-42.

Confidential Draft
Table 1: Characteristics of included studies. Author, year of publication
Trial N
Contributed to outcomes1
Blinding2 Allocation conceal- ment adequate
Study population Country Vaccine valency
% male 3
Age mean (range) 3
Incid. of pneu- monia in controls (%)
Mortality in controls (%)
Max.length follow up (years)
Alfageme (2006) 600 2, 3, 5, 6 3 Unclear COPD patients Spain 23 95 68.5 (61 - 73) 15 19 2.7 Austrian (1976) 4500 2, 3 2 Unclear Miners South Africa 13 100 nr 12 Nr Austrian a (1980) 1300 3, 5, 6, 8, 12 1 Unclear Hospitalised/home USA 12 NR NR (NR - NR) 21 6.2 3.0 Austrian b (1980) 13600 3, 4, 5, 6, 7 2 Adequate Elderly/chronic illness USA 12 NR NR (45 - NR) 4 0.69 2.8 Davis (1987) 103 1, 2, 3, 5, 6 1 Unclear COPD patients USA 14 NR 62.5 (NR - NR) 13 25 Nr Douglas (1986) 39 10 1 Adequate Children Australia 14 NR 3.3 (2 - NR) 1.5 Douglas (1984) 853 3, 10 1 Adequate Children Australia 14 55 NR (2 - 4.5) 0.7 2.0 French (2000) 1323 3, 5, 8 1 Unclear HiV+ Uganda 23 29 31 (15 - NR) 4 28 2.7 Gaillat (1985) 1827 3, 5 3 Unclear Hospitalised/home France 14 34 74 (NR - NR) 4.1 23 2.0 Honkanen (1999) 26925 2, 3, 8 2 Unclear Elderly/chronic illness Finland 23 38 73.5 (65 - NR) 0.9 3.2 John (1984) 242 7, 8 2 Unclear Children Jamaica 14 53 1.2 (0.5 - 2.9) 5.0 Kaufman (1947) 8783 3, 5 3 Unclear Hospitalised/home USA 3 NR 67 (NR - NR) 4.1 1.3 1.5 Klastersky (1986) 50 2, 7, 8 2 Adequate Bronchogenic carcin. Belgium 17 96 61 (42 - 78) Nr Koivula (1997) 2837 2, 3, 5, 6 2 Unclear Elderly/chronic illness Finland 14 37 NR (60 - NR) 4.7 11 3.0 Leech (1987) 189 5, 8, 12 1 Unclear COPD patients Canada 14 71 67 (40 - 89) 11 2.2 Lehmann (1991) 1371 12 1 Unclear Children Papua New Guinea 14/23 NR NR (0.3 - 4.9) Nr MacLeod (1945) 17035 2 2 Uncear Soldiers USA 4 100 23.3 (18 - NR) Nr Mäkelä (1981) 446 10 2 Unclear Children Finland 14 NR NR (2 - 6.9) 0.5 Örtqvist (1998) 691 1, 2, 3, 5, 6, 8 1 Adequate Elderly/chronic illness Sweden 23 48 69.2 (50 - 85) 16 8 Nr Riley (1986) 4862 5, 6 1 Unclear Children Papua New Guinea 14/23 NR NR (0.3 - 5) 2.9 4.0 Riley (1977) 11958 3, 5, 6, 12 1 Adequate People over 10yo Papua New Guinea 14 NR NR (10 - NR) 0.8 2.8 Nr Riley (1981) 871 5, 6, 12 1 Adequate Children Papua New Guinea 14 NR NR (0.5 - 4.9) 3.8 3.0 Rosen (1984) 405 10 1 Unclear Children Sweden 14 54 3.3 (0.5 - 5) 2.0 Schuller (1983) 80 10 3 Unclear Children USA 14 61 3.5 (2 - 6) 1.0 Simberkoff (1986) 2295 2, 3, 4, 5, 6, 7, 8 1 Adequate Elderly/chronic illness USA 14 NR 61.2 (55 - NR) 3.6 15 Nr Smit a (1977) 3019 2, 3, 4 2 Unclear Miners South Africa 6 100 NR (NR - NR) 12 2.3 Smit b (1977) 1675 2, 3, 4 2 Unclear Miners South Africa 12 100 NR (NR - NR) 5.1 1.6 Steentoft (2006) 49 3, 12 3 Adequate COPD patients Denmark 23 55 NR (47 - 86) 42 Nr Zhogolev a (2003) 144 3 3 Unclear Soldiers Russia 23 100 NR (NR - NR) 5.5 Nr Zhogolev b (2003) 827 3 3 Unclear Soldiers Russia 23 100 NR (NR - NR) 21 Nr Zhogolev c (2003) 1777 3 3 Unclear Soldiers Russia 23 100 NR (NR - NR) 11 Nr 1list of outcomes: 1) Definitive pneumococcal pneumonia, 2) Presumptive pneumococcal pneumonia, 3) All-cause pneumonia, 4) Bronchitis, 5) All-cause mortality, 6) Mortality due to pneumonia, 7) Mortality due to pneumococcal infection, 8) Bacteraemia, septicaemia or invasive pneumococcal disease, 10) Otitis media, 12) Other, such as acute lower respiratory tract infection. 2 Trials were grouped into 1) Reported to be double-blind if the wording “double-blind” was used in the publication and the trial was placebo-controlled or another vaccine was used in controls, 2) Not reported to be double-blind, but trial was placebo-controlled or another vaccine was used in controls, or 3) Unblinded if not reported to be double-blind and no intervention used in controls. 3 NR = not reported
19
20
Confidential Draft
Outcome No of trials reporting this outcome
Combined n of study population for this outcome
Combined number of cases in both vaccinees and controls
Definitive pneumococcal pneumonia 2 794 7 Presumptive p. pneumonia 11 56564 589 Pneumonia, all causes 20 83517 2729 Bronchitis 4 20589 1689 Mortality all cause 14 51098 2396 Mortality due to pneumonia 10 39117 251 Mortality due to pneumoc. infection 4 16,041 18 Bacteraemia 8 32,869 50 Meningitis None of the studies reported meningitis as an outcome. Otitis media 5 1823 170 Adverse events Many of the studies reported only a comment, e.g. “no serious
side effects were reported”.
Table 2: Reported outcomes of RCTs using pneumococcal polysaccharide vaccine

Confidential Draft
Table 3: Univariable and multivariable meta-regression analysis of the effect of pneumococcal polysaccharide vaccine on the risk of pneumonia from all causes in 20 trials.
Univariable analysis Multivariable analysisa
Variable Ratio of relative risks*
(95%CI)
Tau2 Ratio of relative risks*
(95%CI)
Tau2
Nil 0.3116 0.3116
Publication year 1.01 (0.99-1.03) 0.3243 1.01 (0.99-1.02) 0.1638
Year study started 1.00 (0.98-1.02) 0.3312 1.00 (0.99-1.02) 0.1731
Vaccine valencyb
- 14 valent
1.07 (0.49-2.33)
0.93 (0.45-1.92)
0.3510
0.70 (0.36-1.34)
0.71(0.38-1.31)
0.1758
- Other valencies
Concealment of allocationc
1.56 (0.83-2.93)
0.2919
1.11 (0.63-1.95)
0.1659
- Adequate
Blindingd
- Not describd as double- blind, controlled
1.91 (1.12-3.26)
2.76 (1.60-4.78)
0.1520
1.88 (1.08-3.30)
2.62 (1.41-4.90)
0.1659
- Described as double blind, controlled Study population e
- Respiratory
- HIV patients
- Children
- Miners/soldiers
0.89 (0.39-2.04)
2.12 (0.67-6.72)
1.49 (0.21-10.68)
0.48 (0.27- 0.87)
0.85 (0.27- 2.65)
0.1929
1.71 (0.97-3.02)
1.56 (0.75-3.25)
1.14 (0.15-0.45)
0.52 (0.38-0.73)
0.64 (0 .32-1.31)
0.0054
- >10 years old in PNG
Trial setting f
- Industrialized countries
1.16 (0.66-2.05)
- Other
0.40 (0.18-0.92)
0.1929
1.46 (0.87-2.45)
0.80 (0.33-1.95)
0.1027
a Adjusted for blinding and concealment of allocation. For these two variables, adjusted results reported are those from the model containing these two variables alone b Compared to 23 valent PPV c Adequate compared to unclear/inadequate group d Compared to unblinded e Compared to elderly/chronically ill f Compared to trials in developing countries * Relative risk with characteristic divided by relative risk without characteristic. Ratios above 1.0 correspond to a larger relative risk for trials with characteristic and hence a smaller apparent benefit of the vaccine. Trials described as double blind and using placebo or another vaccine in the control group show a less beneficial effect than unblended trials, for example.
21

Confidential Draft
Figure 1: Identification of eligible trials
516 studies identified: 269 Embase and Medline 147 Cochrane 63 from references lists 22 LILACS 1 AIM 14 IndMed
excluded: 73 duplicates 73 conjugate vaccine only 202 were not RCT’s 74a did not report clinically relevant outcomes (usually antibody response only) 1 PPV used as booster only 1 conference proceedings 1 only children up to 9 month of age
91 potentially eligible trials identified after screening of title and abstract
Included 27 publications, reporting 31 trials (2 with 2 trials, 1 with 3 trials)
65 Excluded after screening the full text: 40 were not RCT’s 8 were only conference proceedings, editorials or short letters 6 did not report clinically relevant outcomes 5 reported a follow-up of a subpopulation only, or of an earlier trial phase, or an additional data analysis 2 were in children under 2 yrs of age 2 used PPV only as booster vaccination 1 reported only pilot phase of trial
22

Confidential Draft
Figure 2: Year of trial start and valency of polysaccharide pneumococcal vaccine.
26
1423
Val
ency
of v
acci
ne
1935 1945 1955 1965 1975 1985 1995 2005year trial started
23

Confidential Draft
Definitive pneumococcal pneumonia Figure 3: Meta-analysis of clinical trials of the effect of pneumococcal polysaccharide vaccines on the risk of definitive pneumococcal pneumonia.
NOTE: Weights are from random effects analysis
Overall (I-squared = 48.6%, p = 0.163)
ID
Study
Davis 1987
Örtqvist 1998
0.62 (0.05, 8.61)
RR (95% CI)
3.18 (0.13, 76.20)
0.21 (0.02, 1.77)
2/389
vaccinees
Events,
1/50
1/339
5/405
controls
Events,
0/53
5/352
38 (-761, 95)
efficacy (%)
Vaccine
-218 (-7520, 87)
79 (-77, 98)
valency
Vaccine
14
23
0.62 (0.05, 8.61)
RR (95% CI)
3.18 (0.13, 76.20)
0.21 (0.02, 1.77)
2/389
vaccinees
Events,
1/50
1/339
Reduced risk Increased risk 1.125.25 .5 1 2 4 8
Definitive pneumococcal pneumonia
24

Confidential Draft
Presumptive pneumococcal pneumonia Figure 4: Meta-analysis of clinical trials of the effect of pneumococcal polysaccharide vaccines on the risk of presumptive pneumococcal pneumonia. Trials are sorted by start of study.
NOTE: Weights are from random effects analysis
Overall (I-squared = 74.4%, p = 0.000)
Alfageme 2006
Study
Klastersky 1986
Honkanen 1999
Simberkoff 1986
Smit a 1977
Davis 1987
Smit b 1977
ID
Koivula 1997
Austrian 1976
MacLeod 1945
Örtqvist 1998
0.64 (0.43, 0.96)
0.09 (0.01, 1.64)
0.40 (0.08, 1.99)
1.20 (0.80, 1.82)
1.07 (0.53, 2.16)
0.24 (0.12, 0.49)
5.29 (0.26, 107.63)
0.06 (0.01, 0.48)
RR (95% CI)
0.85 (0.51, 1.41)
0.41 (0.29, 0.58)
0.69 (0.50, 0.97)
1.23 (0.64, 2.36)
231/28806
0/300
Events,
2/26
52/13980
16/1145
9/983
2/50
1/540
vaccinees
26/1364
44/1493
60/8586
19/339
358/27758
5/300
Events,
4/21
40/12945
15/1150
38/985
0/53
16/550
controls
33/1473
106/1480
85/8449
16/352
36 (4, 57)
91 (-64, 99)
Vaccine
60 (-99, 92)
-20 (-82, 20)
-7 (-116, 47)
76 (51, 88)
-429 (-10663, 74)
94 (52, 99)
efficacy (%)
15 (-41, 49)
59 (42, 71)
31 (3, 50)
-23 (-136, 36)
23
Vaccine
17
23
14
6
14
12
valency
14
13
4
23
0.64 (0.43, 0.96)
0.09 (0.01, 1.64)
0.40 (0.08, 1.99)
1.20 (0.80, 1.82)
1.07 (0.53, 2.16)
0.24 (0.12, 0.49)
5.29 (0.26, 107.63)
0.06 (0.01, 0.48)
RR (95% CI)
0.85 (0.51, 1.41)
0.41 (0.29, 0.58)
0.69 (0.50, 0.97)
1.23 (0.64, 2.36)
231/28806
0/300
Events,
2/26
52/13980
16/1145
9/983
2/50
1/540
vaccinees
26/1364
44/1493
60/8586
19/339
Reduced risk Increased risk
1.125 .25 .5 1 2 4 8
Sorted by start of studyPresumptive pneumococcal pneumonia
25

Confidential Draft
Figure 5: Meta-analysis of clinical trials of the effect of pneumococcal polysaccharide vaccines on the risk of presumptive pneumococcal pneumonia. Trials are sorted by blinding status.
NOTE: Weights are from random effects analysis
.
.
.
Overall (I-squared = 74.4%, p = 0.000)
Not reported to be double blind, placebo-controlled
Reported to be double blind, placebo-controlled
MacLeod 1945
Smit b 1977
Simberkoff 1986
Örtqvist 1998
Davis 1987
Subtotal (I-squared = 79.8%, p = 0.000)
Klastersky 1986
Koivula 1997
ID
Subtotal (I-squared = .%, p = .)
Alfageme 2006
Smit a 1977
Honkanen 1999
Austrian 1976
Subtotal (I-squared = 0.0%, p = 0.593)
Unblinded, not placebo-controlled
Study
0.64 (0.43, 0.96)
0.69 (0.50, 0.97)
0.06 (0.01, 0.48)
1.07 (0.53, 2.16)
1.23 (0.64, 2.36)
5.29 (0.26, 107.63)
0.54 (0.33, 0.86)
0.40 (0.08, 1.99)
0.85 (0.51, 1.41)
RR (95% CI)
0.09 (0.01, 1.64)
0.09 (0.01, 1.64)
0.24 (0.12, 0.49)
1.20 (0.80, 1.82)
0.41 (0.29, 0.58)
1.20 (0.75, 1.92)
231/28806
60/8586
1/540
16/1145
19/339
2/50
194/26972
2/26
26/1364
vaccinees
0/300
0/300
9/983
52/13980
44/1493
37/1534
Events,
358/27758
85/8449
16/550
15/1150
16/352
0/53
322/25903
4/21
33/1473
controls
5/300
5/300
38/985
40/12945
106/1480
31/1555
Events,
36 (4, 57)
31 (3, 50)
94 (52, 99)
-7 (-116, 47)
-23 (-136, 36)
-429 (-10663, 74)
46 (14, 67)
60 (-99, 92)
15 (-41, 49)
efficacy (%)
91 (-64, 99)
91 (-64, 99)
76 (51, 88)
-20 (-82, 20)
59 (42, 71)
-20 (-92, 25)
Vaccine
4
12
14
23
14
17
14
valency
23
6
23
13
Vaccine
0.64 (0.43, 0.96)
0.69 (0.50, 0.97)
0.06 (0.01, 0.48)
1.07 (0.53, 2.16)
1.23 (0.64, 2.36)
5.29 (0.26, 107.63)
0.54 (0.33, 0.86)
0.40 (0.08, 1.99)
0.85 (0.51, 1.41)
RR (95% CI)
0.09 (0.01, 1.64)
0.09 (0.01, 1.64)
0.24 (0.12, 0.49)
1.20 (0.80, 1.82)
0.41 (0.29, 0.58)
1.20 (0.75, 1.92)
231/28806
60/8586
1/540
16/1145
19/339
2/50
194/26972
2/26
26/1364
vaccinees
0/300
0/300
9/983
52/13980
44/1493
37/1534
Events,
Reduced risk Increased risk
1.125 .25 .5 1 2 4 8
By blindingPresumptive pneumococcal pneumonia
26

Confidential Draft
Figure 6: Meta-analysis of clinical trials of the effect of pneumococcal polysaccharide vaccines on the risk of presumptive pneumococcal pneumonia. Trials are sorted by concealment of allocation.
NOTE: Weights are from random effects analysis
.
.
Overall (I-squared = 74.4%, p = 0.000)
ID
Austrian 1976
Simberkoff 1986
Davis 1987
Smit a 1977
Subtotal (I-squared = 0.0%, p = 0.447)
Honkanen 1999
Unclear
Örtqvist 1998
Adequate
Subtotal (I-squared = 78.8%, p = 0.000)
Smit b 1977
Koivula 1997
Klastersky 1986
Alfageme 2006
MacLeod 1945
Study
0.64 (0.43, 0.96)
RR (95% CI)
0.41 (0.29, 0.58)
1.07 (0.53, 2.16)
5.29 (0.26, 107.63)
0.24 (0.12, 0.49)
1.06 (0.67, 1.67)
1.20 (0.80, 1.82)
1.23 (0.64, 2.36)
0.55 (0.33, 0.90)
0.06 (0.01, 0.48)
0.85 (0.51, 1.41)
0.40 (0.08, 1.99)
0.09 (0.01, 1.64)
0.69 (0.50, 0.97)
231/28806
vaccinees
44/1493
16/1145
2/50
9/983
37/1510
52/13980
19/339
194/27296
1/540
26/1364
2/26
0/300
60/8586
Events,
358/27758
controls
106/1480
15/1150
0/53
38/985
35/1523
40/12945
16/352
323/26235
16/550
33/1473
4/21
5/300
85/8449
Events,
36 (4, 57)
efficacy (%)
59 (42, 71)
-7 (-116, 47)
-429 (-10663, 74)
76 (51, 88)
-6 (-67, 33)
-20 (-82, 20)
-23 (-136, 36)
45 (10, 67)
94 (52, 99)
15 (-41, 49)
60 (-99, 92)
91 (-64, 99)
31 (3, 50)
Vaccine
valency
13
14
14
6
23
23
12
14
17
23
4
Vaccine
0.64 (0.43, 0.96)
RR (95% CI)
0.41 (0.29, 0.58)
1.07 (0.53, 2.16)
5.29 (0.26, 107.63)
0.24 (0.12, 0.49)
1.06 (0.67, 1.67)
1.20 (0.80, 1.82)
1.23 (0.64, 2.36)
0.55 (0.33, 0.90)
0.06 (0.01, 0.48)
0.85 (0.51, 1.41)
0.40 (0.08, 1.99)
0.09 (0.01, 1.64)
0.69 (0.50, 0.97)
231/28806
vaccinees
44/1493
16/1145
2/50
9/983
37/1510
52/13980
19/339
194/27296
1/540
26/1364
2/26
0/300
60/8586
Events,
Reduced risk Increased risk
1.125 .25 .5 1 2 4 8
By concealment of allocationPresumptive pneumococcal pneumonia
27

Confidential Draft
Figure 7: Meta-analysis of clinical trials of the effect of pneumococcal polysaccharide vaccines on the risk of presumptive pneumococcal pneumonia. Trials are sorted by vaccine valency.
NOTE: Weights are from random effects analysis
.
.
.
Overall (I-squared = 74.4%, p = 0.000)
Alfageme 2006
Koivula 1997
Subtotal (I-squared = 35.9%, p = 0.210)
Klastersky 1986
Study
Smit b 1977
23-valent
MacLeod 1945
Subtotal (I-squared = 0.0%, p = 0.461)
14-valent
Örtqvist 1998
other valencies
Honkanen 1999
Davis 1987
Subtotal (I-squared = 70.1%, p = 0.010)
Simberkoff 1986
ID
Smit a 1977
Austrian 1976
0.64 (0.43, 0.96)
0.09 (0.01, 1.64)
0.85 (0.51, 1.41)
1.12 (0.66, 1.90)
0.40 (0.08, 1.99)
0.06 (0.01, 0.48)
0.69 (0.50, 0.97)
0.95 (0.63, 1.43)
1.23 (0.64, 2.36)
1.20 (0.80, 1.82)
5.29 (0.26, 107.63)
0.39 (0.23, 0.66)
1.07 (0.53, 2.16)
RR (95% CI)
0.24 (0.12, 0.49)
0.41 (0.29, 0.58)
231/28806
0/300
26/1364
71/14619
2/26
Events,
1/540
60/8586
44/2559
19/339
52/13980
2/50
116/11628
16/1145
vaccinees
9/983
44/1493
358/27758
5/300
33/1473
61/13597
4/21
Events,
16/550
85/8449
48/2676
16/352
40/12945
0/53
249/11485
15/1150
controls
38/985
106/1480
36 (4, 57)
91 (-64, 99)
15 (-41, 49)
-12 (-90, 34)
60 (-99, 92)
Vaccine
94 (52, 99)
31 (3, 50)
5 (-43, 37)
-23 (-136, 36)
-20 (-82, 20)
-429 (-10663, 74)
61 (34, 77)
-7 (-116, 47)
efficacy (%)
76 (51, 88)
59 (42, 71)
23
14
17
Vaccine
12
4
23
23
14
14
valency
6
13
0.64 (0.43, 0.96)
0.09 (0.01, 1.64)
0.85 (0.51, 1.41)
1.12 (0.66, 1.90)
0.40 (0.08, 1.99)
0.06 (0.01, 0.48)
0.69 (0.50, 0.97)
0.95 (0.63, 1.43)
1.23 (0.64, 2.36)
1.20 (0.80, 1.82)
5.29 (0.26, 107.63)
0.39 (0.23, 0.66)
1.07 (0.53, 2.16)
RR (95% CI)
0.24 (0.12, 0.49)
0.41 (0.29, 0.58)
231/28806
0/300
26/1364
71/14619
2/26
Events,
1/540
60/8586
44/2559
19/339
52/13980
2/50
116/11628
16/1145
vaccinees
9/983
44/1493
Reduced risk Increased risk
1.125 .25 .5 1 2 4 8
By vaccine valencyPresumptive pneumococcal pneumonia
28

Confidential Draft
Figure 8: Meta-analysis of clinical trials of the effect of pneumococcal polysaccharide vaccines on the risk of presumptive pneumococcal pneumonia. Trials are ordered by the incidence of pneumonia in controls.
NOTE: Weights are from random effects analysis
Overall (I-squared = 74.4%, p = 0.000)
ID
Austrian 1976
Klastersky 1986
Smit a 1977
Koivula 1997
MacLeod 1945
Simberkoff 1986
Örtqvist 1998
Davis 1987
Smit b 1977
Alfageme 2006
Honkanen 1999
Study
0.64 (0.43, 0.96)
RR (95% CI)
0.41 (0.29, 0.58)
0.40 (0.08, 1.99)
0.24 (0.12, 0.49)
0.85 (0.51, 1.41)
0.69 (0.50, 0.97)
1.07 (0.53, 2.16)
1.23 (0.64, 2.36)
5.29 (0.26, 107.63)
0.06 (0.01, 0.48)
0.09 (0.01, 1.64)
1.20 (0.80, 1.82)
231/28806
vaccinees
44/1493
2/26
9/983
26/1364
60/8586
16/1145
19/339
2/50
1/540
0/300
52/13980
Events,
358/27758
controls
106/1480
4/21
38/985
33/1473
85/8449
15/1150
16/352
0/53
16/550
5/300
40/12945
Events,
36 (4, 57)
efficacy (%)
59 (42, 71)
60 (-99, 92)
76 (51, 88)
15 (-41, 49)
31 (3, 50)
-7 (-116, 47)
-23 (-136, 36)
-429 (-10663, 74)
94 (52, 99)
91 (-64, 99)
-20 (-82, 20)
Vaccine
valency
13
17
6
14
4
14
23
14
12
23
23
Vaccine
0.64 (0.43, 0.96)
RR (95% CI)
0.41 (0.29, 0.58)
0.40 (0.08, 1.99)
0.24 (0.12, 0.49)
0.85 (0.51, 1.41)
0.69 (0.50, 0.97)
1.07 (0.53, 2.16)
1.23 (0.64, 2.36)
5.29 (0.26, 107.63)
0.06 (0.01, 0.48)
0.09 (0.01, 1.64)
1.20 (0.80, 1.82)
231/28806
vaccinees
44/1493
2/26
9/983
26/1364
60/8586
16/1145
19/339
2/50
1/540
0/300
52/13980
Events,
Reduced risk Increased risk
1.125 .25 .5 1 2 4 8
By incidence of presumptive pneumococcal pneumonia in controlsPresumptive pneumococcal pneumonia
29

Confidential Draft
Figure 9: Meta-analysis of clinical trials of the effect of pneumococcal polysaccharide vaccines on the risk of presumptive pneumococcal pneumonia. Trials are ordered trial setting.
NOTE: Weights are from random effects analysis
.
.
Overall (I-squared = 74.4%, p = 0.000)
Davis 1987
Smit b 1977
Honkanen 1999
Koivula 1997
Subtotal (I-squared = 58.7%, p = 0.089)
ID
MacLeod 1945
Örtqvist 1998
Developing
Simberkoff 1986
Alfageme 2006
Smit a 1977
Klastersky 1986
Subtotal (I-squared = 31.4%, p = 0.177)
Austrian 1976
Developed
Study
0.64 (0.43, 0.96)
5.29 (0.26, 107.63)
0.06 (0.01, 0.48)
1.20 (0.80, 1.82)
0.85 (0.51, 1.41)
0.28 (0.14, 0.56)
RR (95% CI)
0.69 (0.50, 0.97)
1.23 (0.64, 2.36)
1.07 (0.53, 2.16)
0.09 (0.01, 1.64)
0.24 (0.12, 0.49)
0.40 (0.08, 1.99)
0.92 (0.69, 1.22)
0.41 (0.29, 0.58)
231/28806
2/50
1/540
52/13980
26/1364
54/3016
vaccinees
60/8586
19/339
16/1145
0/300
9/983
2/26
177/25790
44/1493
Events,
358/27758
0/53
16/550
40/12945
33/1473
160/3015
controls
85/8449
16/352
15/1150
5/300
38/985
4/21
198/24743
106/1480
Events,
36 (4, 57)
-429 (-10663, 74)
94 (52, 99)
-20 (-82, 20)
15 (-41, 49)
72 (44, 86)
efficacy (%)
31 (3, 50)
-23 (-136, 36)
-7 (-116, 47)
91 (-64, 99)
76 (51, 88)
60 (-99, 92)
8 (-22, 31)
59 (42, 71)
Vaccine
14
12
23
14
valency
4
23
14
23
6
17
13
Vaccine
0.64 (0.43, 0.96)
5.29 (0.26, 107.63)
0.06 (0.01, 0.48)
1.20 (0.80, 1.82)
0.85 (0.51, 1.41)
0.28 (0.14, 0.56)
RR (95% CI)
0.69 (0.50, 0.97)
1.23 (0.64, 2.36)
1.07 (0.53, 2.16)
0.09 (0.01, 1.64)
0.24 (0.12, 0.49)
0.40 (0.08, 1.99)
0.92 (0.69, 1.22)
0.41 (0.29, 0.58)
231/28806
2/50
1/540
52/13980
26/1364
54/3016
vaccinees
60/8586
19/339
16/1145
0/300
9/983
2/26
177/25790
44/1493
Events,
Reduced risk Increased risk
1.125 .25 .5 1 2 4 8
By trial settingPresumptive pneumococcal pneumonia
30
Confidential Draft
Figure 10: Meta-analysis of clinical trials of the effect of pneumococcal polysaccharide vaccines on the risk of presumptive pneumococcal pneumonia. Trials are ordered by type of study population.
NOTE: Weights are from random effects analysis
.
.
.
Overall (I-squared = 74.4%, p = 0.000)
Chronic illness or elderly
Klastersky 1986
Austrian 1976
Subtotal (I-squared = 46.8%, p = 0.153)
Smit b 1977
Simberkoff 1986
ID
Davis 1987
Alfageme 2006
Örtqvist 1998
COPD or brochogenic carcinoma
Subtotal (I-squared = 77.5%, p = 0.004)
Koivula 1997
MacLeod 1945
Miners or soldiers
Honkanen 1999
Smit a 1977
Study
Subtotal (I-squared = 0.0%, p = 0.736)
0.64 (0.43, 0.96)
0.40 (0.08, 1.99)
0.41 (0.29, 0.58)
0.52 (0.08, 3.58)
0.06 (0.01, 0.48)
1.07 (0.53, 2.16)
RR (95% CI)
5.29 (0.26, 107.63)
0.09 (0.01, 1.64)
1.23 (0.64, 2.36)
0.38 (0.21, 0.68)
0.85 (0.51, 1.41)
0.69 (0.50, 0.97)
1.20 (0.80, 1.82)
0.24 (0.12, 0.49)
1.08 (0.83, 1.41)
231/28806
2/26
44/1493
4/376
1/540
16/1145
vaccinees
2/50
0/300
19/339
114/11602
26/1364
60/8586
52/13980
9/983
Events,
113/16828
358/27758
4/21
106/1480
9/374
16/550
15/1150
controls
0/53
5/300
16/352
245/11464
33/1473
85/8449
40/12945
38/985
Events,
104/15920
36 (4, 57)
60 (-99, 92)
59 (42, 71)
48 (-258, 92)
94 (52, 99)
-7 (-116, 47)
efficacy (%)
-429 (-10663, 74)
91 (-64, 99)
-23 (-136, 36)
62 (32, 79)
15 (-41, 49)
31 (3, 50)
-20 (-82, 20)
76 (51, 88)
Vaccine
-8 (-41, 17)
17
13
12
14
valency
14
23
23
14
4
23
6
Vaccine
0.64 (0.43, 0.96)
0.40 (0.08, 1.99)
0.41 (0.29, 0.58)
0.52 (0.08, 3.58)
0.06 (0.01, 0.48)
1.07 (0.53, 2.16)
RR (95% CI)
5.29 (0.26, 107.63)
0.09 (0.01, 1.64)
1.23 (0.64, 2.36)
0.38 (0.21, 0.68)
0.85 (0.51, 1.41)
0.69 (0.50, 0.97)
1.20 (0.80, 1.82)
0.24 (0.12, 0.49)
1.08 (0.83, 1.41)
231/28806
2/26
44/1493
4/376
1/540
16/1145
vaccinees
2/50
0/300
19/339
114/11602
26/1364
60/8586
52/13980
9/983
Events,
113/16828
Reduced risk Increased risk
1.125 .25 .5 1 2 4 8
By study populationPresumptive pneumococcal pneumonia
31
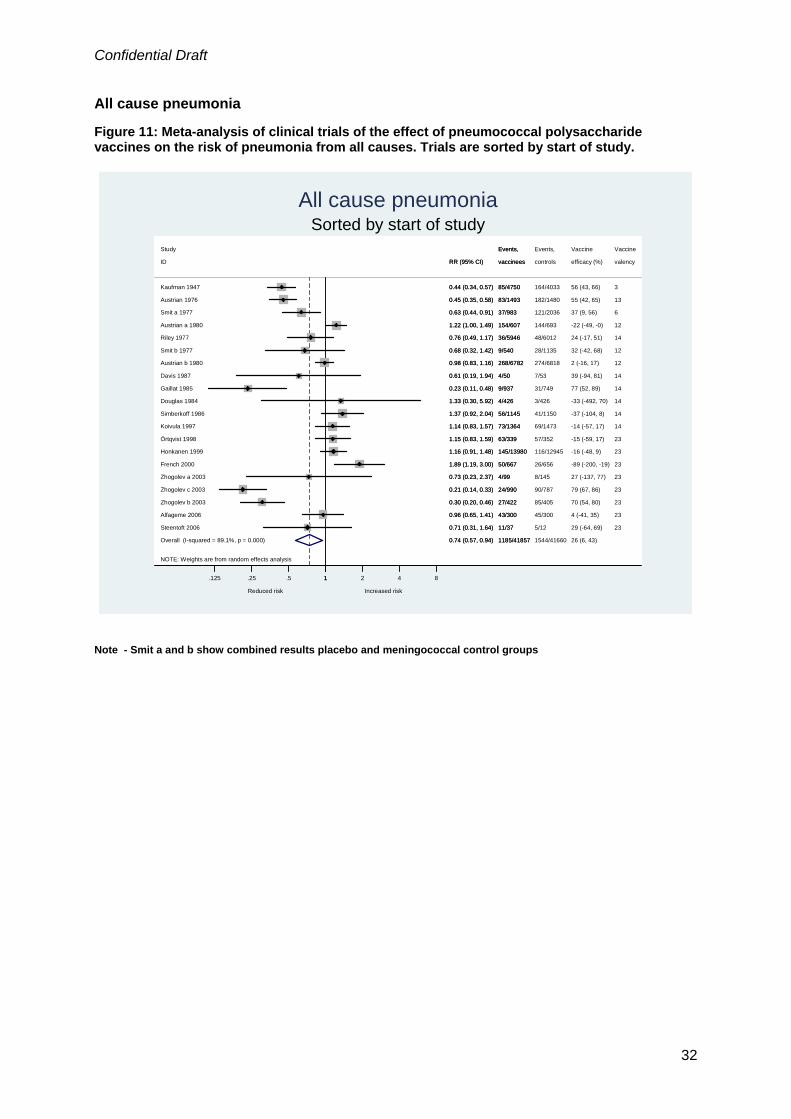
Confidential Draft
All cause pneumonia Figure 11: Meta-analysis of clinical trials of the effect of pneumococcal polysaccharide vaccines on the risk of pneumonia from all causes. Trials are sorted by start of study.
NOTE: Weights are from random effects analysis
Overall (I-squared = 89.1%, p = 0.000)
Honkanen 1999
Kaufman 1947
Zhogolev a 2003
Koivula 1997
Alfageme 2006
Örtqvist 1998
Davis 1987
Douglas 1984
Smit b 1977
Zhogolev c 2003
Austrian 1976
Simberkoff 1986
Austrian a 1980
Steentoft 2006
Austrian b 1980
ID
Riley 1977
Smit a 1977
Zhogolev b 2003
Gaillat 1985
French 2000
Study
0.74 (0.57, 0.94)
1.16 (0.91, 1.48)
0.44 (0.34, 0.57)
0.73 (0.23, 2.37)
1.14 (0.83, 1.57)
0.96 (0.65, 1.41)
1.15 (0.83, 1.59)
0.61 (0.19, 1.94)
1.33 (0.30, 5.92)
0.68 (0.32, 1.42)
0.21 (0.14, 0.33)
0.45 (0.35, 0.58)
1.37 (0.92, 2.04)
1.22 (1.00, 1.49)
0.71 (0.31, 1.64)
0.98 (0.83, 1.16)
RR (95% CI)
0.76 (0.49, 1.17)
0.63 (0.44, 0.91)
0.30 (0.20, 0.46)
0.23 (0.11, 0.48)
1.89 (1.19, 3.00)
1185/41857
145/13980
85/4750
4/99
73/1364
43/300
63/339
4/50
4/426
9/540
24/990
83/1493
56/1145
154/607
11/37
268/6782
vaccinees
36/5946
37/983
27/422
9/937
50/667
Events,
1544/41660
116/12945
164/4033
8/145
69/1473
45/300
57/352
7/53
3/426
28/1135
90/787
182/1480
41/1150
144/693
5/12
274/6818
controls
48/6012
121/2036
85/405
31/749
26/656
Events,
26 (6, 43)
-16 (-48, 9)
56 (43, 66)
27 (-137, 77)
-14 (-57, 17)
4 (-41, 35)
-15 (-59, 17)
39 (-94, 81)
-33 (-492, 70)
32 (-42, 68)
79 (67, 86)
55 (42, 65)
-37 (-104, 8)
-22 (-49, -0)
29 (-64, 69)
2 (-16, 17)
efficacy (%)
24 (-17, 51)
37 (9, 56)
70 (54, 80)
77 (52, 89)
-89 (-200, -19)
Vaccine
23
3
23
14
23
23
14
14
12
23
13
14
12
23
12
valency
14
6
23
14
23
Vaccine
0.74 (0.57, 0.94)
1.16 (0.91, 1.48)
0.44 (0.34, 0.57)
0.73 (0.23, 2.37)
1.14 (0.83, 1.57)
0.96 (0.65, 1.41)
1.15 (0.83, 1.59)
0.61 (0.19, 1.94)
1.33 (0.30, 5.92)
0.68 (0.32, 1.42)
0.21 (0.14, 0.33)
0.45 (0.35, 0.58)
1.37 (0.92, 2.04)
1.22 (1.00, 1.49)
0.71 (0.31, 1.64)
0.98 (0.83, 1.16)
RR (95% CI)
0.76 (0.49, 1.17)
0.63 (0.44, 0.91)
0.30 (0.20, 0.46)
0.23 (0.11, 0.48)
1.89 (1.19, 3.00)
1185/41857
145/13980
85/4750
4/99
73/1364
43/300
63/339
4/50
4/426
9/540
24/990
83/1493
56/1145
154/607
11/37
268/6782
vaccinees
36/5946
37/983
27/422
9/937
50/667
Events,
Reduced risk Increased risk
1.125 .25 .5 1 2 4 8
Sorted by start of studyAll cause pneumonia
Note - Smit a and b show combined results placebo and meningococcal control groups
32

Confidential Draft
Figure 12: Meta-analysis of clinical trials of the effect of pneumococcal polysaccharide vaccines on the risk of pneumonia from all causes. Trials are ordered by blinding status.
NOTE: Weights are from random effects analysis
.
.
.
Overall (I-squared = 89.1%, p = 0.000)
Zhogolev b 2003
French 2000
Gaillat 1985
Honkanen 1999
Subtotal (I-squared = 87.5%, p = 0.000)
Subtotal (I-squared = 82.5%, p = 0.000)
Koivula 1997
Austrian 1976
Zhogolev a 2003
Steentoft 2006
Simberkoff 1986
Kaufman 1947
Riley 1977
Smit b 1977
Örtqvist 1998
Alfageme 2006
Unblinded
Davis 1987
Austrian a 1980
Austrian b 1980
Subtotal (I-squared = 39.9%, p = 0.126)
Zhogolev c 2003
ID
Smit a 1977
Described as double blind;also controlled
Douglas 1984
Not described as double blind;placebo/vaccine controlled
Study
0.74 (0.57, 0.94)
0.30 (0.20, 0.46)
1.89 (1.19, 3.00)
0.23 (0.11, 0.48)
1.16 (0.91, 1.48)
0.81 (0.58, 1.12)
0.43 (0.27, 0.67)
1.14 (0.83, 1.57)
0.45 (0.35, 0.58)
0.73 (0.23, 2.37)
0.71 (0.31, 1.64)
1.37 (0.92, 2.04)
0.44 (0.34, 0.57)
0.76 (0.49, 1.17)
0.68 (0.32, 1.42)
1.15 (0.83, 1.59)
0.96 (0.65, 1.41)
0.61 (0.19, 1.94)
1.22 (1.00, 1.49)
0.98 (0.83, 1.16)
1.19 (0.97, 1.47)
0.21 (0.14, 0.33)
RR (95% CI)
0.63 (0.44, 0.91)
1.33 (0.30, 5.92)
1185/41857
27/422
50/667
9/937
145/13980
615/25142
203/7535
73/1364
83/1493
4/99
11/37
56/1145
85/4750
36/5946
9/540
63/339
43/300
4/50
154/607
268/6782
367/9180
24/990
vaccinees
37/983
4/426
Events,
1544/41660
85/405
26/656
31/749
116/12945
790/25887
428/6431
69/1473
182/1480
8/145
5/12
41/1150
164/4033
48/6012
28/1135
57/352
45/300
7/53
144/693
274/6818
326/9342
90/787
controls
121/2036
3/426
Events,
26 (6, 43)
70 (54, 80)
-89 (-200, -19)
77 (52, 89)
-16 (-48, 9)
19 (-12, 42)
57 (33, 73)
-14 (-57, 17)
55 (42, 65)
27 (-137, 77)
29 (-64, 69)
-37 (-104, 8)
56 (43, 66)
24 (-17, 51)
32 (-42, 68)
-15 (-59, 17)
4 (-41, 35)
39 (-94, 81)
-22 (-49, -0)
2 (-16, 17)
-19 (-47, 3)
79 (67, 86)
efficacy (%)
37 (9, 56)
-33 (-492, 70)
Vaccine
23
23
14
23
14
13
23
23
14
3
14
12
23
23
14
12
12
23
valency
6
14
Vaccine
0.74 (0.57, 0.94)
0.30 (0.20, 0.46)
1.89 (1.19, 3.00)
0.23 (0.11, 0.48)
1.16 (0.91, 1.48)
0.81 (0.58, 1.12)
0.43 (0.27, 0.67)
1.14 (0.83, 1.57)
0.45 (0.35, 0.58)
0.73 (0.23, 2.37)
0.71 (0.31, 1.64)
1.37 (0.92, 2.04)
0.44 (0.34, 0.57)
0.76 (0.49, 1.17)
0.68 (0.32, 1.42)
1.15 (0.83, 1.59)
0.96 (0.65, 1.41)
0.61 (0.19, 1.94)
1.22 (1.00, 1.49)
0.98 (0.83, 1.16)
1.19 (0.97, 1.47)
0.21 (0.14, 0.33)
RR (95% CI)
0.63 (0.44, 0.91)
1.33 (0.30, 5.92)
1185/41857
27/422
50/667
9/937
145/13980
615/25142
203/7535
73/1364
83/1493
4/99
11/37
56/1145
85/4750
36/5946
9/540
63/339
43/300
4/50
154/607
268/6782
367/9180
24/990
vaccinees
37/983
4/426
Events,
Reduced risk Increased risk
1.125 .25 .5 1 2 4 8
By blindingAll cause pneumonia
33

Confidential Draft
Figure 13: Meta-analysis of clinical trials of the effect of pneumococcal polysaccharide vaccines on the risk of pneumonia from all causes. Trials are ordered by by concealment of allocation.
NOTE: Weights are from random effects analysis
.
.
Overall (I-squared = 89.1%, p = 0.000)
Honkanen 1999
Subtotal (I-squared = 9.2%, p = 0.357)
Örtqvist 1998
Smit a 1977
Kaufman 1947
Austrian b 1980
Study
ID
Simberkoff 1986
Austrian a 1980
Adequate
Subtotal (I-squared = 91.5%, p = 0.000)
Davis 1987
Gaillat 1985
Zhogolev c 2003
Austrian 1976
Riley 1977
Koivula 1997
Alfageme 2006
Smit b 1977
Zhogolev a 2003
Douglas 1984
French 2000
Zhogolev b 2003
Unclear
Steentoft 2006
0.74 (0.57, 0.94)
1.16 (0.91, 1.48)
1.02 (0.88, 1.18)
1.15 (0.83, 1.59)
0.63 (0.44, 0.91)
0.44 (0.34, 0.57)
0.98 (0.83, 1.16)
RR (95% CI)
1.37 (0.92, 2.04)
1.22 (1.00, 1.49)
0.64 (0.46, 0.90)
0.61 (0.19, 1.94)
0.23 (0.11, 0.48)
0.21 (0.14, 0.33)
0.45 (0.35, 0.58)
0.76 (0.49, 1.17)
1.14 (0.83, 1.57)
0.96 (0.65, 1.41)
0.68 (0.32, 1.42)
0.73 (0.23, 2.37)
1.33 (0.30, 5.92)
1.89 (1.19, 3.00)
0.30 (0.20, 0.46)
0.71 (0.31, 1.64)
1185/41857
145/13980
438/14675
63/339
37/983
85/4750
268/6782
Events,
vaccinees
56/1145
154/607
747/27182
4/50
9/937
24/990
83/1493
36/5946
73/1364
43/300
9/540
4/99
4/426
50/667
27/422
11/37
1544/41660
116/12945
428/14770
57/352
121/2036
164/4033
274/6818
Events,
controls
41/1150
144/693
1116/26890
7/53
31/749
90/787
182/1480
48/6012
69/1473
45/300
28/1135
8/145
3/426
26/656
85/405
5/12
26 (6, 43)
-16 (-48, 9)
-2 (-18, 12)
-15 (-59, 17)
37 (9, 56)
56 (43, 66)
2 (-16, 17)
Vaccine
efficacy (%)
-37 (-104, 8)
-22 (-49, -0)
36 (10, 54)
39 (-94, 81)
77 (52, 89)
79 (67, 86)
55 (42, 65)
24 (-17, 51)
-14 (-57, 17)
4 (-41, 35)
32 (-42, 68)
27 (-137, 77)
-33 (-492, 70)
-89 (-200, -19)
70 (54, 80)
29 (-64, 69)
23
23
6
3
12
Vaccine
valency
14
12
14
14
23
13
14
14
23
12
23
14
23
23
23
0.74 (0.57, 0.94)
1.16 (0.91, 1.48)
1.02 (0.88, 1.18)
1.15 (0.83, 1.59)
0.63 (0.44, 0.91)
0.44 (0.34, 0.57)
0.98 (0.83, 1.16)
RR (95% CI)
1.37 (0.92, 2.04)
1.22 (1.00, 1.49)
0.64 (0.46, 0.90)
0.61 (0.19, 1.94)
0.23 (0.11, 0.48)
0.21 (0.14, 0.33)
0.45 (0.35, 0.58)
0.76 (0.49, 1.17)
1.14 (0.83, 1.57)
0.96 (0.65, 1.41)
0.68 (0.32, 1.42)
0.73 (0.23, 2.37)
1.33 (0.30, 5.92)
1.89 (1.19, 3.00)
0.30 (0.20, 0.46)
0.71 (0.31, 1.64)
1185/41857
145/13980
438/14675
63/339
37/983
85/4750
268/6782
Events,
vaccinees
56/1145
154/607
747/27182
4/50
9/937
24/990
83/1493
36/5946
73/1364
43/300
9/540
4/99
4/426
50/667
27/422
11/37
Reduced risk Increased risk
1.125 .25 .5 1 2 4 8
By concealment of allocationAll cause pneumonia
34

Confidential Draft
Figure 14: Meta-analysis of clinical trials of the effect of pneumococcal polysaccharide vaccines on the risk of pneumonia from all causes. Trials are ordered by vaccine valency.
NOTE: Weights are from random effects analysis
.
.
.
Overall (I-squared = 89.1%, p = 0.000)
Study
Smit b 1977
Honkanen 1999
ID
Douglas 1984
Riley 1977
Smit a 1977
French 2000
Zhogolev c 2003
Austrian b 1980
Simberkoff 1986
other valencies
Davis 1987
Örtqvist 1998
Koivula 1997
Steentoft 2006
Zhogolev b 2003
14-valent
Austrian 1976
Alfageme 2006
23-valent
Subtotal (I-squared = 92.4%, p = 0.000)
Austrian a 1980
Subtotal (I-squared = 91.7%, p = 0.000)
Zhogolev a 2003
Gaillat 1985
Kaufman 1947
Subtotal (I-squared = 75.8%, p = 0.001)
0.74 (0.57, 0.94)
0.68 (0.32, 1.42)
1.16 (0.91, 1.48)
RR (95% CI)
1.33 (0.30, 5.92)
0.76 (0.49, 1.17)
0.63 (0.44, 0.91)
1.89 (1.19, 3.00)
0.21 (0.14, 0.33)
0.98 (0.83, 1.16)
1.37 (0.92, 2.04)
0.61 (0.19, 1.94)
1.15 (0.83, 1.59)
1.14 (0.83, 1.57)
0.71 (0.31, 1.64)
0.30 (0.20, 0.46)
0.45 (0.35, 0.58)
0.96 (0.65, 1.41)
0.69 (0.47, 1.02)
1.22 (1.00, 1.49)
0.73 (0.44, 1.24)
0.73 (0.23, 2.37)
0.23 (0.11, 0.48)
0.44 (0.34, 0.57)
0.80 (0.50, 1.29)
1185/41857
Events,
9/540
145/13980
vaccinees
4/426
36/5946
37/983
50/667
24/990
268/6782
56/1145
4/50
63/339
73/1364
11/37
27/422
83/1493
43/300
636/15155
154/607
367/16834
4/99
9/937
85/4750
182/9868
1544/41660
Events,
28/1135
116/12945
controls
3/426
48/6012
121/2036
26/656
90/787
274/6818
41/1150
7/53
57/352
69/1473
5/12
85/405
182/1480
45/300
913/16195
144/693
432/15602
8/145
31/749
164/4033
199/9863
26 (6, 43)
Vaccine
32 (-42, 68)
-16 (-48, 9)
efficacy (%)
-33 (-492, 70)
24 (-17, 51)
37 (9, 56)
-89 (-200, -19)
79 (67, 86)
2 (-16, 17)
-37 (-104, 8)
39 (-94, 81)
-15 (-59, 17)
-14 (-57, 17)
29 (-64, 69)
70 (54, 80)
55 (42, 65)
4 (-41, 35)
31 (-2, 53)
-22 (-49, -0)
27 (-24, 56)
27 (-137, 77)
77 (52, 89)
56 (43, 66)
20 (-29, 50)
Vaccine
12
23
valency
14
14
6
23
23
12
14
14
23
14
23
23
13
23
12
23
14
3
0.74 (0.57, 0.94)
0.68 (0.32, 1.42)
1.16 (0.91, 1.48)
RR (95% CI)
1.33 (0.30, 5.92)
0.76 (0.49, 1.17)
0.63 (0.44, 0.91)
1.89 (1.19, 3.00)
0.21 (0.14, 0.33)
0.98 (0.83, 1.16)
1.37 (0.92, 2.04)
0.61 (0.19, 1.94)
1.15 (0.83, 1.59)
1.14 (0.83, 1.57)
0.71 (0.31, 1.64)
0.30 (0.20, 0.46)
0.45 (0.35, 0.58)
0.96 (0.65, 1.41)
0.69 (0.47, 1.02)
1.22 (1.00, 1.49)
0.73 (0.44, 1.24)
0.73 (0.23, 2.37)
0.23 (0.11, 0.48)
0.44 (0.34, 0.57)
0.80 (0.50, 1.29)
1185/41857
Events,
9/540
145/13980
vaccinees
4/426
36/5946
37/983
50/667
24/990
268/6782
56/1145
4/50
63/339
73/1364
11/37
27/422
83/1493
43/300
636/15155
154/607
367/16834
4/99
9/937
85/4750
182/9868
Reduced risk Increased risk
1.125 .25 .5 1 2 4 8
By vaccine valencyAll cause pneumonia
35

Confidential Draft
Figure 15: Meta-analysis of clinical trials of the effect of pneumococcal polysaccharide vaccines on the risk of pneumonia from all causes. Trials are ordered by incidence of pneumonia in controls.
NOTE: Weights are from random effects analysis
Overall (I-squared = 89.1%, p = 0.000)
Riley 1977
Kaufman 1947
Honkanen 1999
Steentoft 2006
Austrian a 1980
ID
Austrian 1976
Zhogolev a 2003
Zhogolev b 2003
Davis 1987
Zhogolev c 2003
Smit a 1977
Örtqvist 1998
Alfageme 2006
Smit b 1977
Koivula 1997
Study
French 2000
Simberkoff 1986
Douglas 1984
Gaillat 1985
Austrian b 1980
0.74 (0.57, 0.94)
0.76 (0.49, 1.17)
0.44 (0.34, 0.57)
1.16 (0.91, 1.48)
0.71 (0.31, 1.64)
1.22 (1.00, 1.49)
RR (95% CI)
0.45 (0.35, 0.58)
0.73 (0.23, 2.37)
0.30 (0.20, 0.46)
0.61 (0.19, 1.94)
0.21 (0.14, 0.33)
0.63 (0.44, 0.91)
1.15 (0.83, 1.59)
0.96 (0.65, 1.41)
0.68 (0.32, 1.42)
1.14 (0.83, 1.57)
1.89 (1.19, 3.00)
1.37 (0.92, 2.04)
1.33 (0.30, 5.92)
0.23 (0.11, 0.48)
0.98 (0.83, 1.16)
1185/41857
36/5946
85/4750
145/13980
11/37
154/607
vaccinees
83/1493
4/99
27/422
4/50
24/990
37/983
63/339
43/300
9/540
73/1364
Events,
50/667
56/1145
4/426
9/937
268/6782
1544/41660
48/6012
164/4033
116/12945
5/12
144/693
controls
182/1480
8/145
85/405
7/53
90/787
121/2036
57/352
45/300
28/1135
69/1473
Events,
26/656
41/1150
3/426
31/749
274/6818
26 (6, 43)
24 (-17, 51)
56 (43, 66)
-16 (-48, 9)
29 (-64, 69)
-22 (-49, -0)
efficacy (%)
55 (42, 65)
27 (-137, 77)
70 (54, 80)
39 (-94, 81)
79 (67, 86)
37 (9, 56)
-15 (-59, 17)
4 (-41, 35)
32 (-42, 68)
-14 (-57, 17)
Vaccine
-89 (-200, -19)
-37 (-104, 8)
-33 (-492, 70)
77 (52, 89)
2 (-16, 17)
14
3
23
23
12
valency
13
23
23
14
23
6
23
23
12
14
Vaccine
23
14
14
14
12
0.74 (0.57, 0.94)
0.76 (0.49, 1.17)
0.44 (0.34, 0.57)
1.16 (0.91, 1.48)
0.71 (0.31, 1.64)
1.22 (1.00, 1.49)
RR (95% CI)
0.45 (0.35, 0.58)
0.73 (0.23, 2.37)
0.30 (0.20, 0.46)
0.61 (0.19, 1.94)
0.21 (0.14, 0.33)
0.63 (0.44, 0.91)
1.15 (0.83, 1.59)
0.96 (0.65, 1.41)
0.68 (0.32, 1.42)
1.14 (0.83, 1.57)
1.89 (1.19, 3.00)
1.37 (0.92, 2.04)
1.33 (0.30, 5.92)
0.23 (0.11, 0.48)
0.98 (0.83, 1.16)
1185/41857
36/5946
85/4750
145/13980
11/37
154/607
vaccinees
83/1493
4/99
27/422
4/50
24/990
37/983
63/339
43/300
9/540
73/1364
Events,
50/667
56/1145
4/426
9/937
268/6782
Reduced risk Increased risk
1.125 .25 .5 1 2 4 8
Sorted by incidence of pneumonia in controls over study periodAll cause pneumonia
36

Confidential Draft
Figure 16: Meta-analysis of clinical trials of the effect of pneumococcal polysaccharide vaccines on the risk of pneumonia from all causes. Trials are ordered by trial setting.
NOTE: Weights are from random effects analysis
.
.
.
Overall (I-squared = 89.1%, p = 0.000)
Subtotal (I-squared = 86.3%, p = 0.000)
Örtqvist 1998
Subtotal (I-squared = 82.9%, p = 0.000)
Kaufman 1947
Smit a 1977
Zhogolev b 2003
Developing
Zhogolev c 2003
French 2000
Douglas 1984
Simberkoff 1986
Undefined
Zhogolev a 2003
Subtotal (I-squared = 53.2%, p = 0.118)
Smit b 1977
ID
Steentoft 2006
Study
Honkanen 1999
Gaillat 1985
Koivula 1997
Austrian 1976
Austrian a 1980
Riley 1977
Austrian b 1980
Davis 1987
Developed
Alfageme 2006
0.74 (0.57, 0.94)
0.76 (0.47, 1.25)
1.15 (0.83, 1.59)
0.89 (0.70, 1.14)
0.44 (0.34, 0.57)
0.63 (0.44, 0.91)
0.30 (0.20, 0.46)
0.21 (0.14, 0.33)
1.89 (1.19, 3.00)
1.33 (0.30, 5.92)
1.37 (0.92, 2.04)
0.73 (0.23, 2.37)
0.29 (0.18, 0.47)
0.68 (0.32, 1.42)
RR (95% CI)
0.71 (0.31, 1.64)
1.16 (0.91, 1.48)
0.23 (0.11, 0.48)
1.14 (0.83, 1.57)
0.45 (0.35, 0.58)
1.22 (1.00, 1.49)
0.76 (0.49, 1.17)
0.98 (0.83, 1.16)
0.61 (0.19, 1.94)
0.96 (0.65, 1.41)
1185/41857
215/9629
63/339
915/30717
85/4750
37/983
27/422
24/990
50/667
4/426
56/1145
4/99
55/1511
9/540
vaccinees
11/37
Events,
145/13980
9/937
73/1364
83/1493
154/607
36/5946
268/6782
4/50
43/300
1544/41660
405/11319
57/352
956/29004
164/4033
121/2036
85/405
90/787
26/656
3/426
41/1150
8/145
183/1337
28/1135
controls
5/12
Events,
116/12945
31/749
69/1473
182/1480
144/693
48/6012
274/6818
7/53
45/300
26 (6, 43)
24 (-25, 53)
-15 (-59, 17)
11 (-14, 30)
56 (43, 66)
37 (9, 56)
70 (54, 80)
79 (67, 86)
-89 (-200, -19)
-33 (-492, 70)
-37 (-104, 8)
27 (-137, 77)
71 (53, 82)
32 (-42, 68)
efficacy (%)
29 (-64, 69)
Vaccine
-16 (-48, 9)
77 (52, 89)
-14 (-57, 17)
55 (42, 65)
-22 (-49, -0)
24 (-17, 51)
2 (-16, 17)
39 (-94, 81)
4 (-41, 35)
23
3
6
23
23
23
14
14
23
12
valency
23
Vaccine
23
14
14
13
12
14
12
14
23
0.74 (0.57, 0.94)
0.76 (0.47, 1.25)
1.15 (0.83, 1.59)
0.89 (0.70, 1.14)
0.44 (0.34, 0.57)
0.63 (0.44, 0.91)
0.30 (0.20, 0.46)
0.21 (0.14, 0.33)
1.89 (1.19, 3.00)
1.33 (0.30, 5.92)
1.37 (0.92, 2.04)
0.73 (0.23, 2.37)
0.29 (0.18, 0.47)
0.68 (0.32, 1.42)
RR (95% CI)
0.71 (0.31, 1.64)
1.16 (0.91, 1.48)
0.23 (0.11, 0.48)
1.14 (0.83, 1.57)
0.45 (0.35, 0.58)
1.22 (1.00, 1.49)
0.76 (0.49, 1.17)
0.98 (0.83, 1.16)
0.61 (0.19, 1.94)
0.96 (0.65, 1.41)
1185/41857
215/9629
63/339
915/30717
85/4750
37/983
27/422
24/990
50/667
4/426
56/1145
4/99
55/1511
9/540
vaccinees
11/37
Events,
145/13980
9/937
73/1364
83/1493
154/607
36/5946
268/6782
4/50
43/300
Reduced risk Increased risk
1.125 .25 .5 1 2 4 8
By trial settingAll cause pneumonia
37

Confidential Draft
Figure 17: Meta-analysis of clinical trials of the effect of pneumococcal polysaccharide vaccines on the risk of pneumonia from all causes. Trials are ordered by type of study population.
NOTE: Weights are from random effects analysis
.
.
.
.
.
.
Overall (I-squared = 89.1%, p = 0.000)
Honkanen 1999
Miners or soldiers
Simberkoff 1986
Zhogolev c 2003
>10yo in Papua New Guinea
HIV positive
Kaufman 1947
COPD or brochogenic carcinoma
Subtotal (I-squared = 88.9%, p = 0.000)
French 2000
Austrian b 1980
Davis 1987
Children
Austrian 1976
Subtotal (I-squared = .%, p = .)
Gaillat 1985
Zhogolev a 2003
Douglas 1984
Smit a 1977
Austrian a 1980
Örtqvist 1998
Riley 1977
Subtotal (I-squared = .%, p = .)
Alfageme 2006
Chronic illness or elderly
Subtotal (I-squared = 0.0%, p = 0.665)
Steentoft 2006
Subtotal (I-squared = 74.2%, p = 0.002)
Zhogolev b 2003
ID
Smit b 1977
Study
Subtotal (I-squared = .%, p = .)
Koivula 1997
0.74 (0.57, 0.94)
1.16 (0.91, 1.48)
1.37 (0.92, 2.04)
0.21 (0.14, 0.33)
0.44 (0.34, 0.57)
0.90 (0.67, 1.20)
1.89 (1.19, 3.00)
0.98 (0.83, 1.16)
0.61 (0.19, 1.94)
0.45 (0.35, 0.58)
0.76 (0.49, 1.17)
0.23 (0.11, 0.48)
0.73 (0.23, 2.37)
1.33 (0.30, 5.92)
0.63 (0.44, 0.91)
1.22 (1.00, 1.49)
1.15 (0.83, 1.59)
0.76 (0.49, 1.17)
1.33 (0.30, 5.92)
0.96 (0.65, 1.41)0.88 (0.63, 1.23)
0.71 (0.31, 1.64)
0.42 (0.29, 0.61)
0.30 (0.20, 0.46)
RR (95% CI)
0.68 (0.32, 1.42)
1.89 (1.19, 3.00)
1.14 (0.83, 1.57)
1185/41857
145/13980
56/1145
24/990
85/4750
853/29904
50/667
268/6782
4/50
83/1493
36/5946
9/937
4/99
4/426
37/983
154/607
63/339
36/5946
4/426
43/30058/387
11/37
184/4527
27/422
vaccinees
9/540
Events,
50/667
73/1364
1544/41660
116/12945
41/1150
90/787
164/4033
896/28213
26/656
274/6818
7/53
182/1480
48/6012
31/749
8/145
3/426
121/2036
144/693
57/352
48/6012
3/426
45/30057/365
5/12
514/5988
85/405
controls
28/1135
Events,
26/656
69/1473
26 (6, 43)
-16 (-48, 9)
-37 (-104, 8)
79 (67, 86)
56 (43, 66)
10 (-20, 33)
-89 (-200, -19)
2 (-16, 17)
39 (-94, 81)
55 (42, 65)
24 (-17, 51)
77 (52, 89)
27 (-137, 77)
-33 (-492, 70)
37 (9, 56)
-22 (-49, -0)
-15 (-59, 17)
24 (-17, 51)
-33 (-492, 70)
4 (-41, 35)12 (-23, 37)
29 (-64, 69)
58 (39, 71)
70 (54, 80)
efficacy (%)
32 (-42, 68)
Vaccine
-89 (-200, -19)
-14 (-57, 17)
23
14
23
3
23
12
14
13
14
23
14
6
12
23
14
23
23
23
valency
12
Vaccine
14
0.74 (0.57, 0.94)
1.16 (0.91, 1.48)
1.37 (0.92, 2.04)
0.21 (0.14, 0.33)
0.44 (0.34, 0.57)
0.90 (0.67, 1.20)
1.89 (1.19, 3.00)
0.98 (0.83, 1.16)
0.61 (0.19, 1.94)
0.45 (0.35, 0.58)
0.76 (0.49, 1.17)
0.23 (0.11, 0.48)
0.73 (0.23, 2.37)
1.33 (0.30, 5.92)
0.63 (0.44, 0.91)
1.22 (1.00, 1.49)
1.15 (0.83, 1.59)
0.76 (0.49, 1.17)
1.33 (0.30, 5.92)
0.96 (0.65, 1.41)0.88 (0.63, 1.23)
0.71 (0.31, 1.64)
0.42 (0.29, 0.61)
0.30 (0.20, 0.46)
RR (95% CI)
0.68 (0.32, 1.42)
1.89 (1.19, 3.00)
1.14 (0.83, 1.57)
1185/41857
145/13980
56/1145
24/990
85/4750
853/29904
50/667
268/6782
4/50
83/1493
36/5946
9/937
4/99
4/426
37/983
154/607
63/339
36/5946
4/426
43/30058/387
11/37
184/4527
27/422
vaccinees
9/540
Events,
50/667
73/1364
Reduced risk Increased risk
1.125 .25 .5 1 2 4 8
By study populationAll cause pneumonia
38

Confidential Draft
Figure 18: Meta-analysis of clinical trials of the effect of pneumococcal polysaccharide vaccines on the risk of pneumonia from all causes. Comparison of results from analyses based on cases (first pneumonias only) and pneumonia episodes in six trials reporting both outcomes.
NOTE: Weights are from random effects analysis
Overall (I-squared = 27.5%, p = 0.228)
Austrian a 1980
Koivula 1997
Davis 1987
French 2000
Study
ID
Simberkoff 1986
Alfageme 2006
1.22 (1.03, 1.46)
1.22 (1.00, 1.49)
1.14 (0.83, 1.57)
0.61 (0.19, 1.94)
1.89 (1.19, 3.00)
RR (95% CI)
1.37 (0.92, 2.04)
0.96 (0.65, 1.41)
380/4133
154/607
73/1364
4/50
50/667
Events,
vaccinees
56/1145
43/300
332/4325
144/693
69/1473
7/53
26/656
Events,
controls
41/1150
45/300
-22 (-46, -3)
-22 (-49, -0)
-14 (-57, 17)
39 (-94, 81)
-89 (-200, -19)
Vaccine
efficacy (%)
-37 (-104, 8)
4 (-41, 35)
12
14
14
23
Vaccine
valency
14
23
1.22 (1.03, 1.46)
1.22 (1.00, 1.49)
1.14 (0.83, 1.57)
0.61 (0.19, 1.94)
1.89 (1.19, 3.00)
RR (95% CI)
1.37 (0.92, 2.04)
0.96 (0.65, 1.41)
380/4133
154/607
73/1364
4/50
50/667
Events,
vaccinees
56/1145
43/300
Reduced risk Increased risk
1.25 .5 1 2 4
Sorted by publication yearAll cause pneumonia episodes
NOTE: Weights are from random effects analysis
Overall (I-squared = 17.9%, p = 0.297)
Davis 1987
Simberkoff 1986
Alfageme 2006
Koivula 1997
ID
French 2000
Austrian a 1980
Study
1.16 (0.97, 1.40)
0.45 (0.12, 1.66)
1.27 (0.84, 1.93)
1.03 (0.67, 1.57)
1.13 (0.81, 1.58)
RR (95% CI)
1.87 (1.12, 3.14)
1.08 (0.84, 1.41)
290/4133
3/50
48/1145
38/300
67/1364
vaccinees
40/667
94/607
Events,
266/4325
7/53
38/1150
37/300
64/1473
controls
21/656
99/693
Events,
-16 (-40, 3)
55 (-66, 88)
-27 (-93, 16)
-3 (-57, 33)
-13 (-58, 19)
efficacy (%)
-87 (-214, -12)
-8 (-41, 16)
Vaccine
14
14
23
14
valency
23
12
Vaccine
1.16 (0.97, 1.40)
0.45 (0.12, 1.66)
1.27 (0.84, 1.93)
1.03 (0.67, 1.57)
1.13 (0.81, 1.58)
RR (95% CI)
1.87 (1.12, 3.14)
1.08 (0.84, 1.41)
290/4133
3/50
48/1145
38/300
67/1364
vaccinees
40/667
94/607
Events,
Reduced risk Increased risk
1.25 .5 1 2 4
Sorted by publication yearAll cause pneumonia cases
39

Confidential Draft
Bronchitis Figure 19: Meta-analysis of clinical trials of the effect of pneumococcal polysaccharide vaccines on the risk of bronchitis from any cause.
NOTE: Weights are from random effects analysis
Overall (I-squared = 53.7%, p = 0.090)
Smit a 1977
Simberkoff 1986
ID
Austrian b 1980
Smit b 1977
Study
0.92 (0.76, 1.12)
0.91 (0.71, 1.16)
0.82 (0.58, 1.15)
RR (95% CI)
1.07 (0.96, 1.19)
0.58 (0.32, 1.07)
791/9450
84/983
56/1145
vaccinees
638/6782
13/540
Events,
907/11139
191/2036
69/1150
controls
600/6818
47/1135
Events,
8 (-12, 24)
9 (-16, 29)
18 (-15, 42)
efficacy (%)
-7 (-19, 4)
42 (-7, 68)
Vaccine
6
14
valency
12
12
Vaccine
0.92 (0.76, 1.12)
0.91 (0.71, 1.16)
0.82 (0.58, 1.15)
RR (95% CI)
1.07 (0.96, 1.19)
0.58 (0.32, 1.07)
791/9450
84/983
56/1145
vaccinees
638/6782
13/540
Events,
Reduced risk Increased risk 1.5 .67 1 1.5 2
Bronchitis
Note - Smit a and b show reported results placebo and meningococcal control groups
40

Confidential Draft
Mortality from all causes Figure 20: Meta-analysis of clinical trials of the effect of pneumococcal polysaccharide vaccines on the risk of death from all causes. Trials are sorted by start of study.
NOTE: Weights are from random effects analysis
Overall (I-squared = 45.8%, p = 0.031)
Study
Davis 1987
Riley 1977
Simberkoff 1986
Örtqvist 1998
Austrian b 1980
Leech 1987
French 2000
ID
Riley 1986
Alfageme 2006
Riley 1981
Kaufman 1947
Austrian a 1980
Gaillat 1985
Koivula 1997
0.94 (0.84, 1.05)
1.14 (0.60, 2.18)
0.79 (0.63, 0.99)
1.24 (1.03, 1.49)
1.08 (0.65, 1.77)
0.96 (0.64, 1.45)
0.58 (0.22, 1.49)
1.00 (0.84, 1.19)
RR (95% CI)
0.71 (0.50, 1.01)
0.98 (0.71, 1.37)
0.65 (0.30, 1.39)
0.53 (0.34, 0.83)
0.93 (0.60, 1.43)
1.06 (0.89, 1.26)
0.99 (0.80, 1.22)
1192/25825
Events,
14/50
133/5946
211/1145
29/339
45/6782
6/92
185/667
vaccinees
51/2445
57/300
10/401
32/4750
35/607
232/937
152/1364
1204/25273
Events,
13/53
170/6012
171/1150
28/352
47/6818
11/97
182/656
controls
71/2417
58/300
18/470
51/4033
43/693
175/749
166/1473
6 (-5, 16)
Vaccine
-14 (-118, 40)
21 (1, 37)
-24 (-49, -3)
-8 (-77, 35)
4 (-45, 36)
42 (-49, 78)
0 (-19, 16)
efficacy (%)
29 (-1, 50)
2 (-37, 29)
35 (-39, 70)
47 (17, 66)
7 (-43, 40)
-6 (-26, 11)
1 (-22, 20)
Vaccine
14
14
14
23
12
14
23
valency
23
14
3
12
14
14
0.94 (0.84, 1.05)
1.14 (0.60, 2.18)
0.79 (0.63, 0.99)
1.24 (1.03, 1.49)
1.08 (0.65, 1.77)
0.96 (0.64, 1.45)
0.58 (0.22, 1.49)
1.00 (0.84, 1.19)
RR (95% CI)
0.71 (0.50, 1.01)
0.98 (0.71, 1.37)
0.65 (0.30, 1.39)
0.53 (0.34, 0.83)
0.93 (0.60, 1.43)
1.06 (0.89, 1.26)
0.99 (0.80, 1.22)
1192/25825
Events,
14/50
133/5946
211/1145
29/339
45/6782
6/92
185/667
vaccinees
51/2445
57/300
10/401
32/4750
35/607
232/937
152/1364
Reduced risk Increased risk
1.125 .25 .5 1 2 4 8
Sorted by start of studyAll cause mortality
41

Confidential Draft
Figure 21: Meta-analysis of clinical trials of the effect of pneumococcal polysaccharide vaccines on the risk of death from all causes. Trials are ordered by blinding status.
NOTE: Weights are from random effects analysis
.
.
.
Overall (I-squared = 45.8%, p = 0.031)
Leech 1987
Gaillat 1985
French 2000
Reported to be double blind, placebo-controlled
Not reported to be double blind, placebo-controlled
Koivula 1997
Subtotal (I-squared = 0.0%, p = 0.908)
Austrian b 1980
Riley 1986
Subtotal (I-squared = 49.2%, p = 0.046)
Subtotal (I-squared = 75.7%, p = 0.016)
Örtqvist 1998
Riley 1977
Riley 1981
Simberkoff 1986
Unblinded, not placebo-controlled
Davis 1987
Alfageme 2006
ID
Study
Kaufman 1947
Austrian a 1980
0.94 (0.84, 1.05)
0.58 (0.22, 1.49)
1.06 (0.89, 1.26)
1.00 (0.84, 1.19)
0.99 (0.80, 1.22)
0.98 (0.82, 1.18)
0.96 (0.64, 1.45)
0.71 (0.50, 1.01)
0.94 (0.80, 1.10)
0.86 (0.60, 1.23)
1.08 (0.65, 1.77)
0.79 (0.63, 0.99)
0.65 (0.30, 1.39)
1.24 (1.03, 1.49)
1.14 (0.60, 2.18)
0.98 (0.71, 1.37)
RR (95% CI)
0.53 (0.34, 0.83)
0.93 (0.60, 1.43)
1192/25825
6/92
232/937
185/667
152/1364
197/8146
45/6782
51/2445
674/11692
321/5987
29/339
133/5946
10/401
211/1145
14/50
57/300
vaccinees
Events,
32/4750
35/607
1204/25273
11/97
175/749
182/656
166/1473
213/8291
47/6818
71/2417
707/11900
284/5082
28/352
170/6012
18/470
171/1150
13/53
58/300
controls
Events,
51/4033
43/693
6 (-5, 16)
42 (-49, 78)
-6 (-26, 11)
0 (-19, 16)
1 (-22, 20)
2 (-18, 18)
4 (-45, 36)
29 (-1, 50)
6 (-10, 20)
14 (-23, 40)
-8 (-77, 35)
21 (1, 37)
35 (-39, 70)
-24 (-49, -3)
-14 (-118, 40)
2 (-37, 29)
efficacy (%)
Vaccine
47 (17, 66)
7 (-43, 40)
14
14
23
14
12
23
14
14
14
14
23
valency
Vaccine
3
12
0.94 (0.84, 1.05)
0.58 (0.22, 1.49)
1.06 (0.89, 1.26)
1.00 (0.84, 1.19)
0.99 (0.80, 1.22)
0.98 (0.82, 1.18)
0.96 (0.64, 1.45)
0.71 (0.50, 1.01)
0.94 (0.80, 1.10)
0.86 (0.60, 1.23)
1.08 (0.65, 1.77)
0.79 (0.63, 0.99)
0.65 (0.30, 1.39)
1.24 (1.03, 1.49)
1.14 (0.60, 2.18)
0.98 (0.71, 1.37)
RR (95% CI)
0.53 (0.34, 0.83)
0.93 (0.60, 1.43)
1192/25825
6/92
232/937
185/667
152/1364
197/8146
45/6782
51/2445
674/11692
321/5987
29/339
133/5946
10/401
211/1145
14/50
57/300
vaccinees
Events,
32/4750
35/607
Reduced risk Increased risk
1.125 .25 .5 1 2 4 8
By blindingAll cause mortality
42

Confidential Draft
Figure 22: Meta-analysis of clinical trials of the effect of pneumococcal polysaccharide vaccines on the risk of death from all causes. Trials are ordered by concealment of allocation.
NOTE: Weights are from random effects analysis
.
.
Overall (I-squared = 45.8%, p = 0.031)
Subtotal (I-squared = 37.2%, p = 0.121)
Leech 1987
Adequate
Subtotal (I-squared = 62.8%, p = 0.030)
Koivula 1997
Riley 1981
Austrian b 1980
French 2000
Riley 1986
Austrian a 1980
Alfageme 2006
Gaillat 1985
Davis 1987
ID
Riley 1977
Örtqvist 1998
Study
Kaufman 1947
Unclear
Simberkoff 1986
0.94 (0.84, 1.05)
0.93 (0.81, 1.05)
0.58 (0.22, 1.49)
0.97 (0.75, 1.24)
0.99 (0.80, 1.22)
0.65 (0.30, 1.39)
0.96 (0.64, 1.45)
1.00 (0.84, 1.19)
0.71 (0.50, 1.01)
0.93 (0.60, 1.43)
0.98 (0.71, 1.37)
1.06 (0.89, 1.26)
1.14 (0.60, 2.18)
RR (95% CI)
0.79 (0.63, 0.99)
1.08 (0.65, 1.77)
0.53 (0.34, 0.83)
1.24 (1.03, 1.49)
1192/25825
764/11212
6/92
428/14613
152/1364
10/401
45/6782
185/667
51/2445
35/607
57/300
232/937
14/50
vaccinees
133/5946
29/339
Events,
32/4750
211/1145
1204/25273
770/10471
11/97
434/14802
166/1473
18/470
47/6818
182/656
71/2417
43/693
58/300
175/749
13/53
controls
170/6012
28/352
Events,
51/4033
171/1150
6 (-5, 16)
7 (-5, 19)
42 (-49, 78)
3 (-24, 25)
1 (-22, 20)
35 (-39, 70)
4 (-45, 36)
0 (-19, 16)
29 (-1, 50)
7 (-43, 40)
2 (-37, 29)
-6 (-26, 11)
-14 (-118, 40)
efficacy (%)
21 (1, 37)
-8 (-77, 35)
Vaccine
47 (17, 66)
-24 (-49, -3)
14
14
14
12
23
12
23
14
14
valency
14
23
Vaccine
3
14
0.94 (0.84, 1.05)
0.93 (0.81, 1.05)
0.58 (0.22, 1.49)
0.97 (0.75, 1.24)
0.99 (0.80, 1.22)
0.65 (0.30, 1.39)
0.96 (0.64, 1.45)
1.00 (0.84, 1.19)
0.71 (0.50, 1.01)
0.93 (0.60, 1.43)
0.98 (0.71, 1.37)
1.06 (0.89, 1.26)
1.14 (0.60, 2.18)
RR (95% CI)
0.79 (0.63, 0.99)
1.08 (0.65, 1.77)
0.53 (0.34, 0.83)
1.24 (1.03, 1.49)
1192/25825
764/11212
6/92
428/14613
152/1364
10/401
45/6782
185/667
51/2445
35/607
57/300
232/937
14/50
vaccinees
133/5946
29/339
Events,
32/4750
211/1145
Reduced risk Increased risk
1.125 .25 .5 1 2 4 8
By concealment of allocationAll cause mortality
43

Confidential Draft
Figure 23: Meta-analysis of clinical trials of the effect of pneumococcal polysaccharide vaccines on the risk of death from all causes. Trials are ordered by the valency of the vaccine used.
NOTE: Weights are from random effects analysis
.
.
.
Overall (I-squared = 45.8%, p = 0.031)
Austrian b 1980
ID
Austrian a 1980
Subtotal (I-squared = 55.8%, p = 0.104)
Subtotal (I-squared = 56.8%, p = 0.023)
other valencies
14-valent
Kaufman 1947
Riley 1986
Koivula 1997
French 2000
23-valent
Simberkoff 1986
Riley 1981
Örtqvist 1998
Leech 1987
Davis 1987
Riley 1977
Subtotal (I-squared = 0.0%, p = 0.955)
Gaillat 1985
Study
Alfageme 2006
0.94 (0.84, 1.05)
0.96 (0.64, 1.45)
RR (95% CI)
0.93 (0.60, 1.43)
0.79 (0.54, 1.14)
0.95 (0.81, 1.11)
0.53 (0.34, 0.83)
0.71 (0.50, 1.01)
0.99 (0.80, 1.22)
1.00 (0.84, 1.19)
1.24 (1.03, 1.49)
0.65 (0.30, 1.39)
1.08 (0.65, 1.77)
0.58 (0.22, 1.49)
1.14 (0.60, 2.18)
0.79 (0.63, 0.99)
1.00 (0.87, 1.16)
1.06 (0.89, 1.26)
0.98 (0.71, 1.37)
1192/25825
45/6782
vaccinees
35/607
112/12139
809/12380
32/4750
51/2445
152/1364
185/667
211/1145
10/401
29/339
6/92
14/50
133/5946
271/1306
232/937
Events,
57/300
1204/25273
47/6818
controls
43/693
141/11544
795/12421
51/4033
71/2417
166/1473
182/656
171/1150
18/470
28/352
11/97
13/53
170/6012
268/1308
175/749
Events,
58/300
6 (-5, 16)
4 (-45, 36)
efficacy (%)
7 (-43, 40)
21 (-14, 46)
5 (-11, 19)
47 (17, 66)
29 (-1, 50)
1 (-22, 20)
0 (-19, 16)
-24 (-49, -3)
35 (-39, 70)
-8 (-77, 35)
42 (-49, 78)
-14 (-118, 40)
21 (1, 37)
-0 (-16, 13)
-6 (-26, 11)
Vaccine
2 (-37, 29)
12
valency
12
3
14
23
14
14
23
14
14
14
14
Vaccine
23
0.94 (0.84, 1.05)
0.96 (0.64, 1.45)
RR (95% CI)
0.93 (0.60, 1.43)
0.79 (0.54, 1.14)
0.95 (0.81, 1.11)
0.53 (0.34, 0.83)
0.71 (0.50, 1.01)
0.99 (0.80, 1.22)
1.00 (0.84, 1.19)
1.24 (1.03, 1.49)
0.65 (0.30, 1.39)
1.08 (0.65, 1.77)
0.58 (0.22, 1.49)
1.14 (0.60, 2.18)
0.79 (0.63, 0.99)
1.00 (0.87, 1.16)
1.06 (0.89, 1.26)
0.98 (0.71, 1.37)
1192/25825
45/6782
vaccinees
35/607
112/12139
809/12380
32/4750
51/2445
152/1364
185/667
211/1145
10/401
29/339
6/92
14/50
133/5946
271/1306
232/937
Events,
57/300
Reduced risk Increased risk
1.125 .25 .5 1 2 4 8
By vaccine valencyAll cause mortality
44
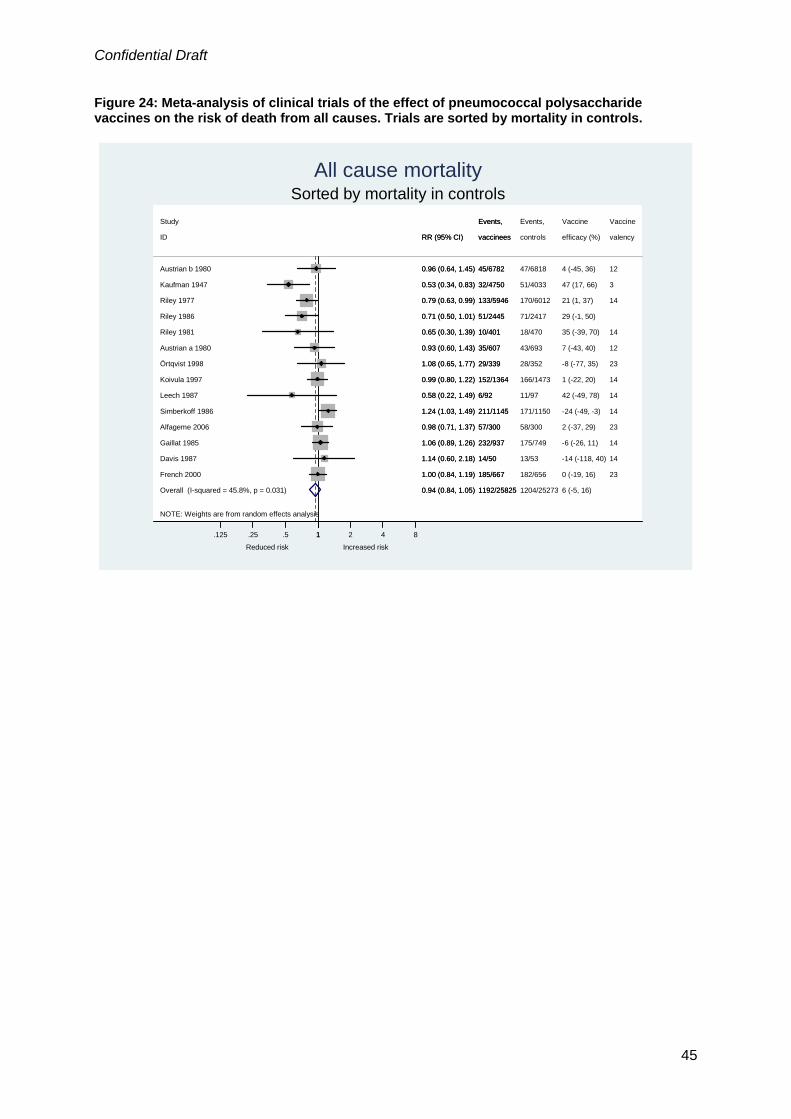
Confidential Draft
Figure 24: Meta-analysis of clinical trials of the effect of pneumococcal polysaccharide vaccines on the risk of death from all causes. Trials are sorted by mortality in controls.
NOTE: Weights are from random effects analysis
Overall (I-squared = 45.8%, p = 0.031)
Koivula 1997
Riley 1986
Austrian b 1980
Simberkoff 1986
French 2000
ID
Riley 1981
Leech 1987
Gaillat 1985
Örtqvist 1998
Austrian a 1980
Study
Davis 1987
Riley 1977
Kaufman 1947
Alfageme 2006
0.94 (0.84, 1.05)
0.99 (0.80, 1.22)
0.71 (0.50, 1.01)
0.96 (0.64, 1.45)
1.24 (1.03, 1.49)
1.00 (0.84, 1.19)
RR (95% CI)
0.65 (0.30, 1.39)
0.58 (0.22, 1.49)
1.06 (0.89, 1.26)
1.08 (0.65, 1.77)
0.93 (0.60, 1.43)
1.14 (0.60, 2.18)
0.79 (0.63, 0.99)
0.53 (0.34, 0.83)
0.98 (0.71, 1.37)
1192/25825
152/1364
51/2445
45/6782
211/1145
185/667
vaccinees
10/401
6/92
232/937
29/339
35/607
Events,
14/50
133/5946
32/4750
57/300
1204/25273
166/1473
71/2417
47/6818
171/1150
182/656
controls
18/470
11/97
175/749
28/352
43/693
Events,
13/53
170/6012
51/4033
58/300
6 (-5, 16)
1 (-22, 20)
29 (-1, 50)
4 (-45, 36)
-24 (-49, -3)
0 (-19, 16)
efficacy (%)
35 (-39, 70)
42 (-49, 78)
-6 (-26, 11)
-8 (-77, 35)
7 (-43, 40)
Vaccine
-14 (-118, 40)
21 (1, 37)
47 (17, 66)
2 (-37, 29)
14
12
14
23
valency
14
14
14
23
12
Vaccine
14
14
3
23
0.94 (0.84, 1.05)
0.99 (0.80, 1.22)
0.71 (0.50, 1.01)
0.96 (0.64, 1.45)
1.24 (1.03, 1.49)
1.00 (0.84, 1.19)
RR (95% CI)
0.65 (0.30, 1.39)
0.58 (0.22, 1.49)
1.06 (0.89, 1.26)
1.08 (0.65, 1.77)
0.93 (0.60, 1.43)
1.14 (0.60, 2.18)
0.79 (0.63, 0.99)
0.53 (0.34, 0.83)
0.98 (0.71, 1.37)
1192/25825
152/1364
51/2445
45/6782
211/1145
185/667
vaccinees
10/401
6/92
232/937
29/339
35/607
Events,
14/50
133/5946
32/4750
57/300
Reduced risk Increased risk
1.125 .25 .5 1 2 4 8
Sorted by mortality in controlsAll cause mortality
45

Confidential Draft
Figure 25: Meta-analysis of clinical trials of the effect of pneumococcal polysaccharide vaccines on the risk of death from all causes. Trials are ordered by trial setting.
NOTE: Weights are from random effects analysis
.
.
Overall (I-squared = 45.8%, p = 0.031)
Davis 1987
Subtotal (I-squared = 39.0%, p = 0.098)
Riley 1986
Austrian a 1980
French 2000
Subtotal (I-squared = 40.5%, p = 0.168)
Koivula 1997
Developing
Leech 1987
Developed
Riley 1977
Alfageme 2006
Austrian b 1980
Riley 1981
Kaufman 1947
Örtqvist 1998
ID
Simberkoff 1986
Gaillat 1985
Study
0.94 (0.84, 1.05)
1.14 (0.60, 2.18)
1.00 (0.87, 1.14)
0.71 (0.50, 1.01)
0.93 (0.60, 1.43)
1.00 (0.84, 1.19)
0.84 (0.70, 1.02)
0.99 (0.80, 1.22)
0.58 (0.22, 1.49)
0.79 (0.63, 0.99)
0.98 (0.71, 1.37)
0.96 (0.64, 1.45)
0.65 (0.30, 1.39)
0.53 (0.34, 0.83)
1.08 (0.65, 1.77)
RR (95% CI)
1.24 (1.03, 1.49)
1.06 (0.89, 1.26)
1192/25825
14/50
813/16366
51/2445
35/607
185/667
379/9459
152/1364
6/92
133/5946
57/300
45/6782
10/401
32/4750
29/339
vaccinees
211/1145
232/937
Events,
1204/25273
13/53
763/15718
71/2417
43/693
182/656
441/9555
166/1473
11/97
170/6012
58/300
47/6818
18/470
51/4033
28/352
controls
171/1150
175/749
Events,
6 (-5, 16)
-14 (-118, 40)
0 (-14, 13)
29 (-1, 50)
7 (-43, 40)
0 (-19, 16)
16 (-2, 30)
1 (-22, 20)
42 (-49, 78)
21 (1, 37)
2 (-37, 29)
4 (-45, 36)
35 (-39, 70)
47 (17, 66)
-8 (-77, 35)
efficacy (%)
-24 (-49, -3)
-6 (-26, 11)
Vaccine
14
12
23
14
14
14
23
12
14
3
23
valency
14
14
Vaccine
0.94 (0.84, 1.05)
1.14 (0.60, 2.18)
1.00 (0.87, 1.14)
0.71 (0.50, 1.01)
0.93 (0.60, 1.43)
1.00 (0.84, 1.19)
0.84 (0.70, 1.02)
0.99 (0.80, 1.22)
0.58 (0.22, 1.49)
0.79 (0.63, 0.99)
0.98 (0.71, 1.37)
0.96 (0.64, 1.45)
0.65 (0.30, 1.39)
0.53 (0.34, 0.83)
1.08 (0.65, 1.77)
RR (95% CI)
1.24 (1.03, 1.49)
1.06 (0.89, 1.26)
1192/25825
14/50
813/16366
51/2445
35/607
185/667
379/9459
152/1364
6/92
133/5946
57/300
45/6782
10/401
32/4750
29/339
vaccinees
211/1145
232/937
Events,
Reduced risk Increased risk
1.125 .25 .5 1 2 4 8
By trial settingAll cause mortality
46

Confidential Draft
Figure 26: Meta-analysis of clinical trials of the effect of pneumococcal polysaccharide vaccines on the risk of death from all causes. Trials are ordered by the type of study population.
NOTE: Weights are from random effects analysis
.
.
.
.
.
Overall (I-squared = 45.8%, p = 0.031)
ID
COPD or brochogenic carcinoma
Chronic illness or elderly
Riley 1977
Study
Leech 1987
Örtqvist 1998
Koivula 1997
Subtotal (I-squared = 0.0%, p = 0.840)
Gaillat 1985
Kaufman 1947
Austrian b 1980
Riley 1981
Subtotal (I-squared = 54.1%, p = 0.042)
Riley 1986
French 2000
HIV positive
Subtotal (I-squared = .%, p = .)
Austrian a 1980
>10yo in Papua New Guinea
Davis 1987
Alfageme 2006
Subtotal (I-squared = 0.0%, p = 0.494)
Simberkoff 1986
Subtotal (I-squared = .%, p = .)
Children
0.94 (0.84, 1.05)
RR (95% CI)
0.79 (0.63, 0.99)
0.58 (0.22, 1.49)
1.08 (0.65, 1.77)
0.99 (0.80, 1.22)
0.70 (0.51, 0.96)
1.06 (0.89, 1.26)
0.53 (0.34, 0.83)
0.96 (0.64, 1.45)
0.65 (0.30, 1.39)
0.99 (0.85, 1.17)
0.71 (0.50, 1.01)
1.00 (0.84, 1.19)
1.00 (0.84, 1.19)
0.93 (0.60, 1.43)
1.14 (0.60, 2.18)
0.98 (0.71, 1.37)
0.96 (0.73, 1.28)
1.24 (1.03, 1.49)
0.79 (0.63, 0.99)
1192/25825
vaccinees
133/5946
Events,
6/92
29/339
152/1364
61/2846
232/937
32/4750
45/6782
10/401
736/15924
51/2445
185/667
185/667
35/607
14/50
57/300
77/442
211/1145
133/5946
1204/25273
controls
170/6012
Events,
11/97
28/352
166/1473
89/2887
175/749
51/4033
47/6818
18/470
681/15268
71/2417
182/656
182/656
43/693
13/53
58/300
82/450
171/1150
170/6012
6 (-5, 16)
efficacy (%)
21 (1, 37)
Vaccine
42 (-49, 78)
-8 (-77, 35)
1 (-22, 20)
30 (4, 49)
-6 (-26, 11)
47 (17, 66)
4 (-45, 36)
35 (-39, 70)
1 (-17, 15)
29 (-1, 50)
0 (-19, 16)
0 (-19, 16)
7 (-43, 40)
-14 (-118, 40)
2 (-37, 29)
4 (-28, 27)
-24 (-49, -3)
21 (1, 37)
valency
14
Vaccine
14
23
14
14
3
12
14
23
12
14
23
14
0.94 (0.84, 1.05)
RR (95% CI)
0.79 (0.63, 0.99)
0.58 (0.22, 1.49)
1.08 (0.65, 1.77)
0.99 (0.80, 1.22)
0.70 (0.51, 0.96)
1.06 (0.89, 1.26)
0.53 (0.34, 0.83)
0.96 (0.64, 1.45)
0.65 (0.30, 1.39)
0.99 (0.85, 1.17)
0.71 (0.50, 1.01)
1.00 (0.84, 1.19)
1.00 (0.84, 1.19)
0.93 (0.60, 1.43)
1.14 (0.60, 2.18)
0.98 (0.71, 1.37)
0.96 (0.73, 1.28)
1.24 (1.03, 1.49)
0.79 (0.63, 0.99)
1192/25825
vaccinees
133/5946
Events,
6/92
29/339
152/1364
61/2846
232/937
32/4750
45/6782
10/401
736/15924
51/2445
185/667
185/667
35/607
14/50
57/300
77/442
211/1145
133/5946
Reduced risk Increased risk
1.125 .25 .5 1 2 4 8
By study populationAll cause mortality
47
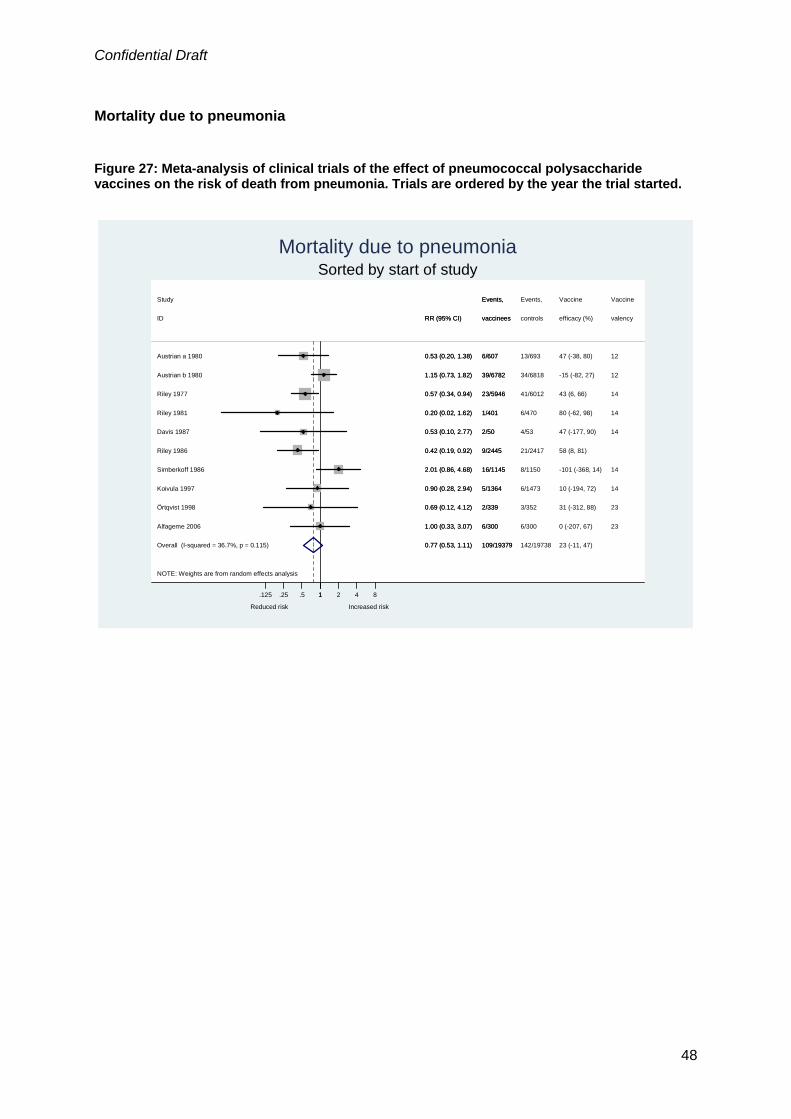
Confidential Draft
Mortality due to pneumonia Figure 27: Meta-analysis of clinical trials of the effect of pneumococcal polysaccharide vaccines on the risk of death from pneumonia. Trials are ordered by the year the trial started.
NOTE: Weights are from random effects analysis
Overall (I-squared = 36.7%, p = 0.115)
Austrian b 1980
Riley 1986
Koivula 1997
Study
Riley 1981
Simberkoff 1986
Riley 1977
Davis 1987
Alfageme 2006
Örtqvist 1998
Austrian a 1980
ID
0.77 (0.53, 1.11)
1.15 (0.73, 1.82)
0.42 (0.19, 0.92)
0.90 (0.28, 2.94)
0.20 (0.02, 1.62)
2.01 (0.86, 4.68)
0.57 (0.34, 0.94)
0.53 (0.10, 2.77)
1.00 (0.33, 3.07)
0.69 (0.12, 4.12)
0.53 (0.20, 1.38)
RR (95% CI)
109/19379
39/6782
9/2445
5/1364
Events,
1/401
16/1145
23/5946
2/50
6/300
2/339
6/607
vaccinees
142/19738
34/6818
21/2417
6/1473
Events,
6/470
8/1150
41/6012
4/53
6/300
3/352
13/693
controls
23 (-11, 47)
-15 (-82, 27)
58 (8, 81)
10 (-194, 72)
Vaccine
80 (-62, 98)
-101 (-368, 14)
43 (6, 66)
47 (-177, 90)
0 (-207, 67)
31 (-312, 88)
47 (-38, 80)
efficacy (%)
12
14
Vaccine
14
14
14
14
23
23
12
valency
0.77 (0.53, 1.11)
1.15 (0.73, 1.82)
0.42 (0.19, 0.92)
0.90 (0.28, 2.94)
0.20 (0.02, 1.62)
2.01 (0.86, 4.68)
0.57 (0.34, 0.94)
0.53 (0.10, 2.77)
1.00 (0.33, 3.07)
0.69 (0.12, 4.12)
0.53 (0.20, 1.38)
RR (95% CI)
109/19379
39/6782
9/2445
5/1364
Events,
1/401
16/1145
23/5946
2/50
6/300
2/339
6/607
vaccinees
Reduced risk Increased risk
1.125 .25 .5 1 2 4 8
Sorted by start of studyMortality due to pneumonia
48

Confidential Draft
Figure 28: Meta-analysis of clinical trials of the effect of pneumococcal polysaccharide vaccines on the risk of death from pneumonia. Trials are ordered by blinding status.
NOTE: Weights are from random effects analysis
.
.
.
Overall (I-squared = 36.7%, p = 0.115)
Subtotal (I-squared = .%, p = .)
Subtotal (I-squared = 38.5%, p = 0.135)
ID
Simberkoff 1986
Subtotal (I-squared = 0.0%, p = 0.702)
Riley 1981
Not reported to be double blind, placebo-controlled
Austrian b 1980
Örtqvist 1998
Riley 1986
Koivula 1997
Reported to be double blind, placebo-controlled
Riley 1977
Davis 1987
Austrian a 1980
Alfageme 2006
Unblinded, not placebo-controlled
Study
0.77 (0.53, 1.11)
1.00 (0.33, 3.07)
0.64 (0.39, 1.04)
RR (95% CI)
2.01 (0.86, 4.68)
1.12 (0.73, 1.71)
0.20 (0.02, 1.62)
1.15 (0.73, 1.82)
0.69 (0.12, 4.12)
0.42 (0.19, 0.92)
0.90 (0.28, 2.94)
0.57 (0.34, 0.94)
0.53 (0.10, 2.77)
0.53 (0.20, 1.38)
1.00 (0.33, 3.07)
109/19379
6/300
59/10933
vaccinees
16/1145
44/8146
1/401
39/6782
2/339
9/2445
5/1364
23/5946
2/50
6/607
6/300
Events,
142/19738
6/300
96/11147
controls
8/1150
40/8291
6/470
34/6818
3/352
21/2417
6/1473
41/6012
4/53
13/693
6/300
Events,
23 (-11, 47)
0 (-207, 67)
36 (-4, 61)
efficacy (%)
-101 (-368, 14)
-12 (-71, 27)
80 (-62, 98)
-15 (-82, 27)
31 (-312, 88)
58 (8, 81)
10 (-194, 72)
43 (6, 66)
47 (-177, 90)
47 (-38, 80)
0 (-207, 67)
Vaccine
valency
14
14
12
23
14
14
14
12
23
Vaccine
0.77 (0.53, 1.11)
1.00 (0.33, 3.07)
0.64 (0.39, 1.04)
RR (95% CI)
2.01 (0.86, 4.68)
1.12 (0.73, 1.71)
0.20 (0.02, 1.62)
1.15 (0.73, 1.82)
0.69 (0.12, 4.12)
0.42 (0.19, 0.92)
0.90 (0.28, 2.94)
0.57 (0.34, 0.94)
0.53 (0.10, 2.77)
0.53 (0.20, 1.38)
1.00 (0.33, 3.07)
109/19379
6/300
59/10933
vaccinees
16/1145
44/8146
1/401
39/6782
2/339
9/2445
5/1364
23/5946
2/50
6/607
6/300
Events,
Reduced risk Increased risk
1.125 .25 .5 1 2 4 8
By blindingMortality due to pneumonia
49

Confidential Draft
Figure 29: Meta-analysis of clinical trials of the effect of pneumococcal polysaccharide vaccines on the risk of death from pneumonia. Trials are ordered by concealment of allocation.
NOTE: Weights are from random effects analysis
.
.
Overall (I-squared = 36.7%, p = 0.115)
Alfageme 2006
Subtotal (I-squared = 0.0%, p = 0.716)
Riley 1986
Austrian b 1980
Austrian a 1980
Subtotal (I-squared = 59.4%, p = 0.043)
Örtqvist 1998
Adequate
Study
ID
Riley 1977
Simberkoff 1986
Davis 1987
Koivula 1997
Unclear
Riley 1981
0.77 (0.53, 1.11)
1.00 (0.33, 3.07)
0.59 (0.37, 0.94)
0.42 (0.19, 0.92)
1.15 (0.73, 1.82)
0.53 (0.20, 1.38)
0.89 (0.50, 1.61)
0.69 (0.12, 4.12)
RR (95% CI)
0.57 (0.34, 0.94)
2.01 (0.86, 4.68)
0.53 (0.10, 2.77)
0.90 (0.28, 2.94)
0.20 (0.02, 1.62)
109/19379
6/300
28/4766
9/2445
39/6782
6/607
81/14613
2/339
Events,
vaccinees
23/5946
16/1145
2/50
5/1364
1/401
142/19738
6/300
50/4936
21/2417
34/6818
13/693
92/14802
3/352
Events,
controls
41/6012
8/1150
4/53
6/1473
6/470
23 (-11, 47)
0 (-207, 67)
41 (6, 63)
58 (8, 81)
-15 (-82, 27)
47 (-38, 80)
11 (-61, 50)
31 (-312, 88)
Vaccine
efficacy (%)
43 (6, 66)
-101 (-368, 14)
47 (-177, 90)
10 (-194, 72)
80 (-62, 98)
23
12
12
23
Vaccine
valency
14
14
14
14
14
0.77 (0.53, 1.11)
1.00 (0.33, 3.07)
0.59 (0.37, 0.94)
0.42 (0.19, 0.92)
1.15 (0.73, 1.82)
0.53 (0.20, 1.38)
0.89 (0.50, 1.61)
0.69 (0.12, 4.12)
RR (95% CI)
0.57 (0.34, 0.94)
2.01 (0.86, 4.68)
0.53 (0.10, 2.77)
0.90 (0.28, 2.94)
0.20 (0.02, 1.62)
109/19379
6/300
28/4766
9/2445
39/6782
6/607
81/14613
2/339
Events,
vaccinees
23/5946
16/1145
2/50
5/1364
1/401
Reduced risk Increased risk
1.125 .25 .5 1 2 4 8
By concealment of allocationMortality due to pneumonia
50

Confidential Draft
Figure 30: Meta-analysis of clinical trials of the effect of pneumococcal polysaccharide vaccines on the risk of death from pneumonia. Trials are ordered by vaccine valency.
NOTE: Weights are from random effects analysis
.
.
.
Overall (I-squared = 36.7%, p = 0.115)
Simberkoff 1986
Subtotal (I-squared = 51.9%, p = 0.149)
Riley 1986
Austrian b 1980
Subtotal (I-squared = 0.0%, p = 0.732)
Austrian a 1980
other valencies
Riley 1977
Davis 1987
Koivula 1997
Örtqvist 1998
23-valent
ID
Subtotal (I-squared = 49.3%, p = 0.079)
Alfageme 2006
14-valent
Riley 1981
Study
0.77 (0.53, 1.11)
2.01 (0.86, 4.68)
0.88 (0.42, 1.82)
0.42 (0.19, 0.92)
1.15 (0.73, 1.82)
0.90 (0.35, 2.33)
0.53 (0.20, 1.38)
0.57 (0.34, 0.94)
0.53 (0.10, 2.77)
0.90 (0.28, 2.94)
0.69 (0.12, 4.12)
RR (95% CI)
0.69 (0.39, 1.20)
1.00 (0.33, 3.07)
0.20 (0.02, 1.62)
109/19379
16/1145
45/7389
9/2445
39/6782
8/639
6/607
23/5946
2/50
5/1364
2/339
vaccinees
56/11351
6/300
1/401
Events,
142/19738
8/1150
47/7511
21/2417
34/6818
9/652
13/693
41/6012
4/53
6/1473
3/352
controls
86/11575
6/300
6/470
Events,
23 (-11, 47)
-101 (-368, 14)
12 (-82, 58)
58 (8, 81)
-15 (-82, 27)
10 (-133, 65)
47 (-38, 80)
43 (6, 66)
47 (-177, 90)
10 (-194, 72)
31 (-312, 88)
efficacy (%)
31 (-20, 61)
0 (-207, 67)
80 (-62, 98)
Vaccine
14
12
12
14
14
14
23
valency
23
14
Vaccine
0.77 (0.53, 1.11)
2.01 (0.86, 4.68)
0.88 (0.42, 1.82)
0.42 (0.19, 0.92)
1.15 (0.73, 1.82)
0.90 (0.35, 2.33)
0.53 (0.20, 1.38)
0.57 (0.34, 0.94)
0.53 (0.10, 2.77)
0.90 (0.28, 2.94)
0.69 (0.12, 4.12)
RR (95% CI)
0.69 (0.39, 1.20)
1.00 (0.33, 3.07)
0.20 (0.02, 1.62)
109/19379
16/1145
45/7389
9/2445
39/6782
8/639
6/607
23/5946
2/50
5/1364
2/339
vaccinees
56/11351
6/300
1/401
Events,
Reduced risk Increased risk
1.125 .25 .5 1 2 4 8
By vaccine valencyMortality due to pneumonia
51

Confidential Draft
Figure 31: Meta-analysis of clinical trials of the effect of pneumococcal polysaccharide vaccines on the risk of death from pneumonia. Trials are ordered by mortality from all-cause pneumonia in controls.
NOTE: Weights are from random effects analysis
Overall (I-squared = 36.7%, p = 0.115)
Koivula 1997
Alfageme 2006
Riley 1981
ID
Riley 1986
Simberkoff 1986
Austrian b 1980
Riley 1977
Austrian a 1980
Örtqvist 1998
Davis 1987
Study
0.77 (0.53, 1.11)
0.90 (0.28, 2.94)
1.00 (0.33, 3.07)
0.20 (0.02, 1.62)
RR (95% CI)
0.42 (0.19, 0.92)
2.01 (0.86, 4.68)
1.15 (0.73, 1.82)
0.57 (0.34, 0.94)
0.53 (0.20, 1.38)
0.69 (0.12, 4.12)
0.53 (0.10, 2.77)
109/19379
5/1364
6/300
1/401
vaccinees
9/2445
16/1145
39/6782
23/5946
6/607
2/339
2/50
Events,
142/19738
6/1473
6/300
6/470
controls
21/2417
8/1150
34/6818
41/6012
13/693
3/352
4/53
Events,
23 (-11, 47)
10 (-194, 72)
0 (-207, 67)
80 (-62, 98)
efficacy (%)
58 (8, 81)
-101 (-368, 14)
-15 (-82, 27)
43 (6, 66)
47 (-38, 80)
31 (-312, 88)
47 (-177, 90)
Vaccine
14
23
14
valency
14
12
14
12
23
14
Vaccine
0.77 (0.53, 1.11)
0.90 (0.28, 2.94)
1.00 (0.33, 3.07)
0.20 (0.02, 1.62)
RR (95% CI)
0.42 (0.19, 0.92)
2.01 (0.86, 4.68)
1.15 (0.73, 1.82)
0.57 (0.34, 0.94)
0.53 (0.20, 1.38)
0.69 (0.12, 4.12)
0.53 (0.10, 2.77)
109/19379
5/1364
6/300
1/401
vaccinees
9/2445
16/1145
39/6782
23/5946
6/607
2/339
2/50
Events,
Reduced risk Increased risk
1.125 .25 .5 1 2 4 8
By mortality in controlsMortality due to pneumonia
52

Confidential Draft
Figure 32: Meta-analysis of clinical trials of the effect of pneumococcal polysaccharide vaccines on the risk of death from pneumonia. Trials are ordered by trial setting.
NOTE: Weights are from random effects analysis
.
.
Overall (I-squared = 36.7%, p = 0.115)
Developing
Simberkoff 1986
Davis 1987
Austrian a 1980
Koivula 1997
Örtqvist 1998
Riley 1981
Riley 1977
Austrian b 1980
Subtotal (I-squared = 0.0%, p = 0.555)
ID
Developed
Riley 1986
Study
Alfageme 2006
Subtotal (I-squared = 0.0%, p = 0.501)
0.77 (0.53, 1.11)
2.01 (0.86, 4.68)
0.53 (0.10, 2.77)
0.53 (0.20, 1.38)
0.90 (0.28, 2.94)
0.69 (0.12, 4.12)
0.20 (0.02, 1.62)
0.57 (0.34, 0.94)
1.15 (0.73, 1.82)
0.50 (0.33, 0.76)
RR (95% CI)
0.42 (0.19, 0.92)
1.00 (0.33, 3.07)
1.06 (0.76, 1.47)
109/19379
16/1145
2/50
6/607
5/1364
2/339
1/401
23/5946
39/6782
33/8792
vaccinees
9/2445
Events,
6/300
76/10587
142/19738
8/1150
4/53
13/693
6/1473
3/352
6/470
41/6012
34/6818
68/8899
controls
21/2417
Events,
6/300
74/10839
23 (-11, 47)
-101 (-368, 14)
47 (-177, 90)
47 (-38, 80)
10 (-194, 72)
31 (-312, 88)
80 (-62, 98)
43 (6, 66)
-15 (-82, 27)
50 (24, 67)
efficacy (%)
58 (8, 81)
Vaccine
0 (-207, 67)
-6 (-47, 24)
14
14
12
14
23
14
14
12
valency
Vaccine
23
0.77 (0.53, 1.11)
2.01 (0.86, 4.68)
0.53 (0.10, 2.77)
0.53 (0.20, 1.38)
0.90 (0.28, 2.94)
0.69 (0.12, 4.12)
0.20 (0.02, 1.62)
0.57 (0.34, 0.94)
1.15 (0.73, 1.82)
0.50 (0.33, 0.76)
RR (95% CI)
0.42 (0.19, 0.92)
1.00 (0.33, 3.07)
1.06 (0.76, 1.47)
109/19379
16/1145
2/50
6/607
5/1364
2/339
1/401
23/5946
39/6782
33/8792
vaccinees
9/2445
Events,
6/300
76/10587
Reduced risk Increased risk
1.125 .25 .5 1 2 4 8
By trial settingMortality due to pneumonia
53
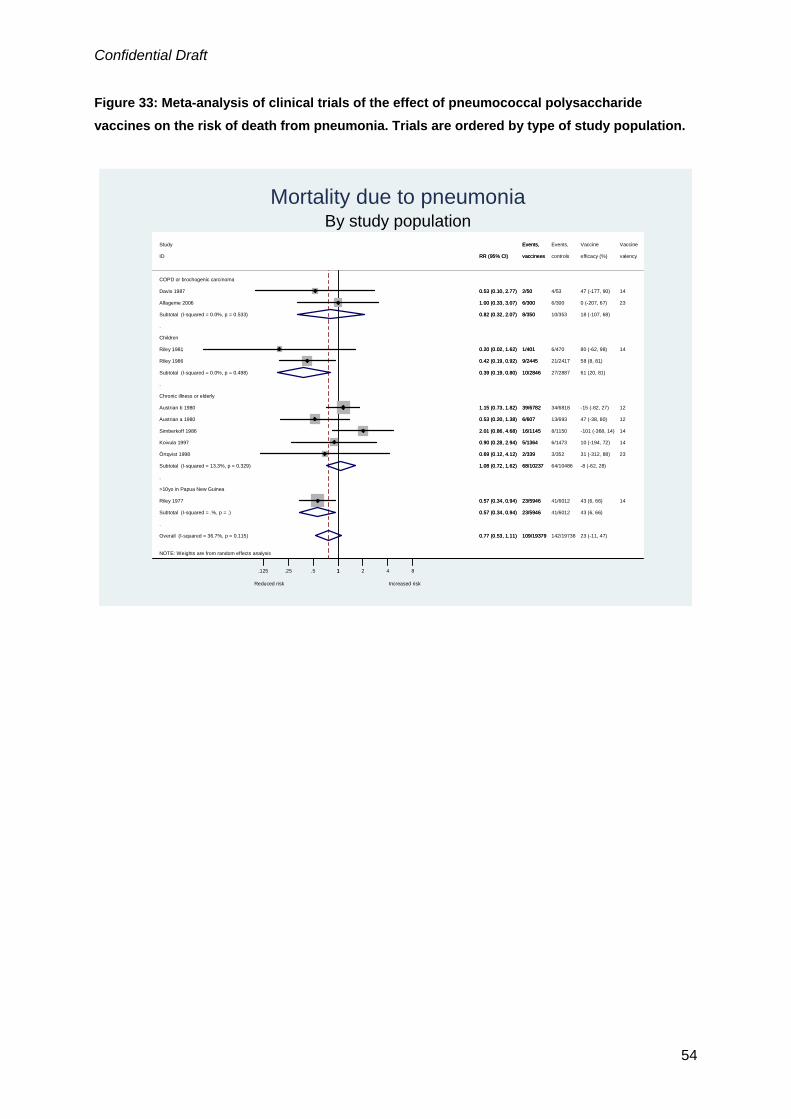
Confidential Draft
Figure 33: Meta-analysis of clinical trials of the effect of pneumococcal polysaccharide vaccines on the risk of death from pneumonia. Trials are ordered by type of study population.
NOTE: Weights are from random effects analysis
.
.
.
.
Overall (I-squared = 36.7%, p = 0.115)
Riley 1977
Koivula 1997
Subtotal (I-squared = 0.0%, p = 0.533)
Subtotal (I-squared = 0.0%, p = 0.498)
Chronic illness or elderly
Austrian b 1980
>10yo in Papua New Guinea
Riley 1981
Riley 1986
Subtotal (I-squared = 13.3%, p = 0.329)
Örtqvist 1998
ID
Subtotal (I-squared = .%, p = .)
Children
Davis 1987
COPD or brochogenic carcinoma
Alfageme 2006
Austrian a 1980
Simberkoff 1986
Study
0.77 (0.53, 1.11)
0.57 (0.34, 0.94)
0.90 (0.28, 2.94)
0.82 (0.32, 2.07)
0.39 (0.19, 0.80)
1.15 (0.73, 1.82)
0.20 (0.02, 1.62)
0.42 (0.19, 0.92)
1.08 (0.72, 1.62)
0.69 (0.12, 4.12)
RR (95% CI)
0.57 (0.34, 0.94)
0.53 (0.10, 2.77)
1.00 (0.33, 3.07)
0.53 (0.20, 1.38)
2.01 (0.86, 4.68)
109/19379
23/5946
5/1364
8/350
10/2846
39/6782
1/401
9/2445
68/10237
2/339
vaccinees
23/5946
2/50
6/300
6/607
16/1145
Events,
142/19738
41/6012
6/1473
10/353
27/2887
34/6818
6/470
21/2417
64/10486
3/352
controls
41/6012
4/53
6/300
13/693
8/1150
Events,
23 (-11, 47)
43 (6, 66)
10 (-194, 72)
18 (-107, 68)
61 (20, 81)
-15 (-82, 27)
80 (-62, 98)
58 (8, 81)
-8 (-62, 28)
31 (-312, 88)
efficacy (%)
43 (6, 66)
47 (-177, 90)
0 (-207, 67)
47 (-38, 80)
-101 (-368, 14)
Vaccine
14
14
12
14
23
valency
14
23
12
14
Vaccine
0.77 (0.53, 1.11)
0.57 (0.34, 0.94)
0.90 (0.28, 2.94)
0.82 (0.32, 2.07)
0.39 (0.19, 0.80)
1.15 (0.73, 1.82)
0.20 (0.02, 1.62)
0.42 (0.19, 0.92)
1.08 (0.72, 1.62)
0.69 (0.12, 4.12)
RR (95% CI)
0.57 (0.34, 0.94)
0.53 (0.10, 2.77)
1.00 (0.33, 3.07)
0.53 (0.20, 1.38)
2.01 (0.86, 4.68)
109/19379
23/5946
5/1364
8/350
10/2846
39/6782
1/401
9/2445
68/10237
2/339
vaccinees
23/5946
2/50
6/300
6/607
16/1145
Events,
Reduced risk Increased risk
1.125 .25 .5 1 2 4 8
By study populationMortality due to pneumonia
54

Confidential Draft
Other outcomes Figure 34: Meta-analysis of clinical trials of the effect of pneumococcal polysaccharide vaccines on the risk of death from pneumococcal infection.
NOTE: Weights are from random effects analysis
Overall (I-squared = 14.2%, p = 0.312)
Klastersky 1986
John 1984
ID
Study
Austrian b 1980
Simberkoff 1986
0.93 (0.29, 3.05)
0.81 (0.05, 12.16)
(Excluded)
RR (95% CI)
0.63 (0.21, 1.92)
7.03 (0.36, 135.95)
9/8015
1/26
0/62
vaccinees
Events,
5/6782
3/1145
9/8026
1/21
0/37
controls
Events,
8/6818
0/1150
7 (-205, 71)
19 (-1116, 95)
efficacy (%)
Vaccine
37 (-92, 79)
-603 (-13495, 64)
17
14
valency
Vaccine
12
14
0.93 (0.29, 3.05)
0.81 (0.05, 12.16)
(Excluded)
RR (95% CI)
0.63 (0.21, 1.92)
7.03 (0.36, 135.95)
9/8015
1/26
0/62
vaccinees
Events,
5/6782
3/1145
Reduced risk Increased risk 1.125 .25 .5 1 2 4 8
Mortality due to pneumococcal infection
55

Confidential Draft
Figure 35: Meta-analysis of clinical trials of the effect of pneumococcal polysaccharide vaccines on the risk of bacteraemia, septicaemia or invasive pneumococcal disease, sorted by start of study.
NOTE: Weights are from random effects analysis
Overall (I-squared = 0.0%, p = 0.503)
Klastersky 1986
Leech 1987
Simberkoff 1986
ID
Örtqvist 1998
Austrian a 1980
Honkanen 1999
Study
French 2000
John 1984
0.98 (0.55, 1.75)
0.81 (0.05, 12.16)
3.16 (0.13, 76.63)
0.50 (0.05, 5.53)
RR (95% CI)
0.21 (0.02, 1.77)
(Excluded)
0.37 (0.07, 1.91)
1.48 (0.67, 3.26)
1.19 (0.23, 6.20)
25/16918
1/26
1/92
1/1145
vaccinees
1/339
0/607
2/13980
Events,
15/667
4/62
25/15951
1/21
0/97
2/1150
controls
5/352
0/693
5/12945
Events,
10/656
2/37
2 (-75, 45)
19 (-1116, 95)
-216 (-7563, 87)
50 (-453, 95)
efficacy (%)
79 (-77, 98)
63 (-91, 93)
Vaccine
-48 (-226, 33)
-19 (-520, 77)
17
14
14
valency
23
12
23
Vaccine
23
14
0.98 (0.55, 1.75)
0.81 (0.05, 12.16)
3.16 (0.13, 76.63)
0.50 (0.05, 5.53)
RR (95% CI)
0.21 (0.02, 1.77)
(Excluded)
0.37 (0.07, 1.91)
1.48 (0.67, 3.26)
1.19 (0.23, 6.20)
25/16918
1/26
1/92
1/1145
vaccinees
1/339
0/607
2/13980
Events,
15/667
4/62
Reduced risk Increased risk 1.125 .25 .5 1 2 4 8
Sorted by start of studyBacteraemia, septicaemia or invasive pneumococcal disease
NB “john 1984” uses HiB vaccine as a control
56

Confidential Draft
Funnel plots Figure 36: Funnel plot for outcome presumptive pneumococcal pneumonia.
se(lo
gRR
)
Funnel plot presumptive pneumococcal pneumoniaRR (log scale)
.125 .25 .5 1 2 4 8
0
1
2
Asymmetry p= 0.66 Figure 37: Funnel plot for outcome all-cause pneumonia.
se(lo
gRR
)
Funnel plot all cause pneumonia, cases/episodes combinedRR (log scale)
.125 .25 .5 1 2 4 8
0
.5
1
Asymmetry p=0.33 Figure 38: Funnel plot for outcome all-cause mortality.
se(lo
gRR
)
Funnel plot all cause mortalityRR (log scale)
.125 .25 .5 1 2 4 8
0
.25
.5
.75
Asymmetry p= 0.072
57

Confidential Draft
Figure 39: Funnel plot for outcome mortality due to pneumonia.
se(lo
gRR
)
Funnel plot mortality due to pneumoniaRR (log scale)
.125 .25 .5 1 2 4 8
0
.5
1
1.5
Asymmetry p= 0.47
58
Confidential Draft
Appendix 1: Study characteristics
Author Alfageme 200627 Approximate year of trial start
2003
Study population Spanish COPD patients, excluding those with specified co-morbidities. 95% male. Mean 68.5 years old, range 61-73 years
Interventions 23-valent PPV. No intervention in control group. Follow up checks only, as in vaccine group
Quality Described as randomised. Generation of allocation sequence described and adequate but concealment of allocation not described Not described as double-blind but outcome assessors are blinded
Outcomes Presumptive pneumococcal pneumonia (radiographic and bacteriologic) All-cause pneumonia (radiographic) All-cause mortality Mortality due to pneumonia
Author Austrian 197628 Approximate year of trial start
1972
Study population Young gold-miners in South Africa 100% male. Age not well defined
Interventions 13 valent PPV. 2 control groups : saline placebo and Meningococcal A vaccine Quality Described as randomised. Generation of allocation sequence described and
adequate but concealment of allocation not described Not reported as double-blind and no description of who, if anyone, was blinded
Outcomes Presumptive pneumococcal pneumonia (radiographic and is suggestive that culture performed but not explicitly stated) All-cause pneumonia (radiographic) Bacteraemia/septicaemia
Author Austrian 198029 Approximate year of trial start
1973
Study population a) US psychiatric hospital patients (resident for over 3m) b) clients (>45yo) of a health insurance plan Sex and age distribution not well defined for either trial
Interventions 12v PPV with saline placebo in controls Quality a) Not described as randomised. Neither generation of allocation sequence nor
concealment of allocation described. Described as double-blind but not possible to determine who is truly blinded b) Described as randomised. Generation of allocation sequence and concealment of allocation described and adequate Not described as double-blind. Some trial staff blinded but unclear regarding outcome assessors
Outcomes a) All-cause pneumonia (radiographic) All-cause mortality Mortality due to pneumonia Bacteraemia/septicaemia b) All-cause pneumonia (radiographic) All-cause bronchitis All-cause mortality Mortality due to pneumonia Mortality due to pneumococcal infection
59

Confidential Draft
Author Davis 198730 Approximate year of trial start
1978
Study population US COPD patients Mean age 62.5 years. Sex distribution not defined
Interventions 14-valent PPV. Control group given saline placebo Quality Described as randomised. Generation of allocation sequence described and
adequate but concealment of allocation not described Described as double-blind. Participants are blinded. Outcome assessors are blinded.
Outcomes Definitive pneumococcal pneumonia (radiographic and bacteriologic) Presumptive pneumococcal pneumonia (radiographic and bacteriologic) All-cause pneumonia (radiographic) All-cause mortality Mortality due to pneumonia
Author Douglas 198431 Approximate year of trial start
1980
Study population Australian children recruited from GP lists, seen for any reason in previous 12m 55% male, age range reported 2-4.5 years
Interventions 14-valent PPV. Saline placebo in controls Quality Described as randomised. Generation of allocation sequence described but not
clear if adequate. Concealment of allocation described and adequate Described as double-blind. Participants are blinded. Outcome assessors are blinded.
Outcomes All-cause pneumonia (unclear diagnostic procedure, report those hospitalised for pneumonia) Otitis media
Author Douglas 198632 Approximate year of trial start
1982
Study population Australian Aboriginal children Mean age 3.3 years. Minimum age 2 years. Sex distribution not reported.
Interventions 14-valent PPV .Placebo in control group (not stated which substance but prepared by Merck, Sharp and Dohme – likely to be saline)
Quality Described as randomised. Generation of allocation sequence not described. Concealment of allocation described and adequate Described as double-blind. Participants are blinded. Outcome assessors are blinded.
Outcomes Otitis media Notes Data only extracted for children over 2yo Author French 199833 Approximate year of trial start
1995
Study population Ugandan HIV+ 15-55yo, not pregnant, not on rifampicin, not stage 4, no acute febrile illnesses 29% male. Mean age 31 years. Minimum age 15 years.
Interventions 23-valent PPV. Controls received sodium phosphate carrier (placebo) Quality Described as randomised but neither generation of allocation sequence nor
allocation concealment described. Described as double-blind. Participants are blinded. Some trial staff blinded but unclear if outcome assessors are blinded.
Outcomes All-cause pneumonia (radiographic) All-cause mortality Invasive pneumococcal disease
60

Confidential Draft
Author Gaillat 198534 Approximate year of trial start
1980
Study population French elderly in hospitals or nursing homes 34% male. Mean age 74 years
Interventions 14-valent PPV. No intervention in control group Quality Described as randomised. Generation of allocation sequence not described.
Concealment of randomisation described but not adequate. Not apparently blinded
Outcomes All-cause pneumonia (appears not all cases had radiographic confirmation but percentage unclear) All-cause mortality
Author Honkanen 199935 Approximate year of trial start
1992
Study population Finnish older than 65yo Mean age 73.5 years
Interventions 23-valent PPV and influenza vaccine in pneumococcal vaccine group. Influenza vaccine in control group.
Quality Not described as randomised. Method of allocation described (by odd or even year of birth) but not adequate Not described as double-blind. Unclear if outcome assessors blind
Outcomes Presumptive pneumococcal pneumonia (radiographic and presence of circulating pneumolysin specific immune complexes) All-cause pneumonia (radiographic) Bacteraemia/septicaemia
Author John 198436 Approximate year of trial start
1978
Study population Jamaican children with sickle cell disease 53% male. Mean age 1.2 years, range 0.5-2.9 years
Interventions 14 valent PPV. Haemophilus influenzae type B vaccine in control group Quality Described as randomised but neither generation of allocation sequence nor
allocation concealment described. Not reported as double-blind and blinding not discussed
Outcomes Mortality due to pneumococcal infection Bacteraemia/septicaemia
Notes Factorial trial including penicillin use in one level. Result extracted only for those not receiving penicillin. Protocol revised by authors moving some from penicillin groups to vaccine-only groups maintaining vaccine-type allocation. Not possible to extract outcomes on original allocations
Author Kaufman 194738 Approximate year of trial start
1937
Study population Elderly in New York City Home Mean 67 years. Sex distribution not defined
Interventions 3v PPV. No intervention in control group Quality Described as randomised. Randomisation not adequate.
Not described as double-blind and no further description of any blinding in paper Outcomes All-cause pneumonia (unclear diagnostic criteria)
All-cause mortality Notes Results from Kaufman 194139 are summarised in Kaufman 1947 – only these data
were extracted. A randomisation process is reported starting in the trial’s second year (alternation; volunteers taken in first year), results were extracted from second year on.
61

Confidential Draft
Author Klastersky 198640 Approximate year of trial start
1987
Study population Belgian bronchogenic carcinoma patients, most with no radiotherapy or chemotherapy prior to vaccination 96% male. Mean age 61 years, range 42-78 years
Interventions 17v PPV. Saline placebo in control group Quality Described as randomised. No description of generation of allocation sequence but
concealment described and adequate Not reported as double-blind but participants blind and at least some trial staff. Unclear if outcome assessors blind
Outcomes Presumptive pneumococcal pneumonia (radiographic and bacteriologic) Mortality due to pneumococcal infection Bacteraemia/septicaemia
Author Koivula 199741 Approximate year of trial start
1982
Study population Finnish elderly (over 60yo) Interventions 14-valent PPV and influenza vaccine in intervention group. Influenza vaccine in
control group 37% male.
Quality Described as randomised. Generation of allocation sequence described and adequate. Concealment described and but difficult to determine if adequate. Not reported as double-blind but outcome assessors blinded.
Outcomes Presumptive pneumococcal pneumonia (radiographic and two-fold rise of pneumolysin antibodies ) All-cause pneumonia (radiographic) All-cause mortality Mortality due to pneumonia
Notes Database of elderly residents randomised prior to recruitment. Outcomes also reported for non-responders
Author Leech 198742 Approximate year of trial start
1981
Study population Canadian COPD patients 71% male. Mean age 67 years, range 40-89 years
Interventions 14-valent PPV. Saline placebo in control group. Both groups given influenza vaccine at 0, 1 and 2 years
Quality Described as randomised but neither generation of allocation sequence nor allocation concealment described. Described as double-blind. At least some trial staff blinded but unclear if outcome assessors blind
Outcomes All-cause mortality Bacteraemia/septicaemia Emergency department visits for pneumonia
Author Lehmann 199143 Approximate year of trial start
1981
Study population Children under 5yo in Papua New Guinea Interventions 14-valent and 23-valent used in trial. Unclear which used when. Control group
received saline placebo 0.3-4.9 years old. Sex distribution not defined
Quality Described as randomised but neither generation of allocation sequence nor allocation concealment described. Described as double-blind but unclear who is blinded
Outcomes Acute lower respiratory tract infections Notes Same trial as Riley 1986 but reports different outcomes
62

Confidential Draft
Author MacLeod 194544 Approximate year of trial start
1944
Study population US trainees at the Army Airforce Technical School Interventions 4V PPV. Saline placebo in control group
100% male. Mean age 23.3 years. Minimum age 18 years Quality Described as randomised. Both generation of allocation sequence and allocation
concealment described but neither are adequate. Not described as double-blind and no further description of any blinding in paper
Outcomes Presumptive pneumococcal pneumonia (clinical and bacteriologic) Author Mäkelä 198045 Approximate year of trial start
1977
Study population Finnish children with prior otitis media Age range 2-6.9 years.
Interventions 14-valent PPV. Haemophilus influenzae B vaccination in control group Quality Described as randomised. Both generation of allocation sequence and allocation
concealment described but neither are adequate. Not reported as double-blind but outcome assessors blinded.
Outcomes Otitis media Author Örtqvist 199846 Approximate year of trial start
1991
Study population Swedish non-immunocompromised middle aged and elderly (50yo and over) who had previously been hospitalised for community aquired pneumonia 48% male. Mean age 69.2 years, range 50-85 years
Interventions 23-valent PPV. Control group received saline placebo Quality Described as randomised and both generation of allocation sequence and
allocation concealment are adequate. Described as double-blind and both participants and outcome assessors are blinded
Outcomes Definitive pneumococcal pneumonia Presumptive pneumococcal pneumonia (radiographic and bacteriologic/two-fold rise of pneumolysin antibodies) All-cause pneumonia (radiographic) All-cause mortality Mortality due to pneumonia Bacteraemia/septicaemia
Author Riley 197747 Approximate year of trial start
1974
Study population Highlanders over 10yo in Papua New Guinea Sex distribution not defined
Interventions 14-valent PPV. Control received placebo Quality Described as randomised. Generation of allocation sequence not described.
Concealment of allocation described and adequate Described as double-blind. Participants are blinded. Outcome assessors are blinded.
Outcomes All-cause pneumonia (radiographic where possible, percentage unclear) All-cause mortality Mortality due to pneumonia Acute lower respiratory tract infections
63

Confidential Draft
Author Riley 198148 Approximate year of trial start
1974
Study population 6m-5yo highland children in Papua New Guinea Sex distribution not defined
Interventions 14-valent PPV. Control group received saline placebo Quality Described as randomised. Generation of allocation sequence not described.
Concealment of allocation described and adequate. Described as double-blind. Participants are blinded. Outcome assessors are blinded.
Outcomes All-cause mortality Mortality due to pneumonia Acute lower respiratory tract infections
Author Riley 198649 Approximate year of trial start
1981
Study population 4m-5yo highland children in Papua New Guinea Sex distribution not defined
Interventions 14-valent and 23-valent used in trial. Unclear which used when. Control group received saline placebo
Quality Described as randomised but neither generation of allocation sequence nor allocation concealment described. Described as double-blind but unclear who is blinded
Outcomes All-cause mortality Mortality due to pneumonia
Notes Same trial as Lehmann but reports different outcomes Author Rosen 198450 Approximate year of trial start
1982
Study population Swedish children under 5yo 54% male. Mean age 3.3 years, range 0.5-5 years
Interventions 14-valent PPV. Saline placebo in control group Quality Not described as randomised and no clear description of randomisation method.
Reported to be double-blind by no description of who is blinded Outcomes Otitis media Notes 2 publications of this study. 1984 publication divides under 2yo and over 2yo Author Schuller 198351 Approximate year of trial start
1981
Study population US asthmatic children with a minimum of 4 prior episodes of otitis media 61% male. Mean age 3.5 years, range 2-6 years
Interventions 14-valent PPV. Control group received only “normal treatment” for otitis media (i.e. antibiotics when otitis media occurs)
Quality Described as randomised but neither generation of allocation sequence nor allocation concealment described. Not described as double-blind and no description of any blinding
Outcomes Otitis media Notes Multiple interventions. Data only extracted for vaccine only and baseline control
group (no active interventions)
64

Confidential Draft
Author Simberkoff 198654 Study population US “high-risk”patients i.e. those 55yo or older, or with chronic disease Interventions 14-valent PPV. Saline placebo in control group Quality Described as randomised. No description of generation of allocation sequence but
concealment described and adequate Described as double-blind but no description of who is blinded
Outcomes Presumptive pneumococcal pneumonia (radiographic and bacteriologic) All-cause pneumonia (radiographic) All-cause bronchitis All-cause mortality Mortality due to pneumonia Mortality due to pneumococcal infection Bacteraemia/septicaemia
Author Smit 197755 Approximate year of trial start
a)1973 b) 1974
Study population Young gold-miners in South Africa 100% male. Age distribution not well defined
Interventions a)6v PPV. Two control groups: saline placebo and Meningococcal A and C vaccine b)12v PPV.Two control groups: saline placebo and Meningococcal A and C vaccine
Quality a and b) Described as randomised but neither generation of allocation sequence nor allocation concealment described. Not described as double-blind but outcome assessors appear to be blinded
Outcomes a and b) Presumptive pneumococcal pneumonia (radiographic and bacteriologic) All-cause pneumonia (radiographic), results only available for both control groups combined All-cause bronchitis), results only available for both control groups combined
Author Steentoft 200652 Approximate year of trial start
2005
Study population Danish COPD patients 55% male. Age range 47-86 years
Interventions 23-valent PPV and combinations of steroid treatments in vaccine groups (3). Control group only has the steroid combinations
Quality Described as randomised. No description of generation of allocation sequence but concealment described and adequate No blinding reported
Outcomes All-cause pneumonia (radiographic) Exacerbation of COPD
Notes Three vaccine groups combined as this reflects the steroid treatment patterns in the control group
Author Zhogolev 200356 Approximate year of trial start
2001
Study population Russian soldiers in a) North-west Russia, b) Central Russia, c) East Russia, d) also in East Russia, but the last trial compared 23PPV plus influenza vaccination to no intervention. 100% male. Age range not defined
Interventions 23-valent polysaccharide, control group received no intervention Quality No description of generation of allocation sequence, concealment of allocation or
blinding Outcomes All cause pneumonia (diagnostic criteria unclear) Notes 4 trials are reported in three Russian regions with differing risk settings. Incidence
of pneumonia in controls was much higher in the “central” region, compared to the others. One trial (d) excluded as compares PPV and influenza vaccination to no
65
Confidential Draft
intervention
66
Recommended