Economic Impacts of Termination Timing for Irrigation and Plant Bug Control
Juan Monge* Diana M. Danforth* Tina Gray Teague**
Mark J. Cochran* J. L. Lund**
T. J. Sangepogudavid**
*Department of Agricultural Economics and Agribusiness, University of Arkansas, Fayetteville
**Department of Entomology, University of Arkansas at Arkansas State University

Introduction

Problem Statement
Circumstances Pest pressure: Bugs – 535,326 cotton bales Constant draught: Worst in 20 years Rising energy prices Achieve appropriate earliness
Consequences Frequent irrigation and insecticide application Higher production costs
Objectives
Determining if longer periods of irrigation and insecticide control reward producers through: Higher yields Fiber attribute values Profits
Establishing economically profitable termination guidelines based on crop maturity

Data Sources and
Methods
Experimental Design
Yield and fiber quality data Three-year experiment at U of A Lon Mann
Cotton Research Station Designed as a split plot
Main plot: Irrigation termination (5 levels) Rainfall in 2005 and 2006
Sub plot: Insect control termination (4 levels)
Experimental Design
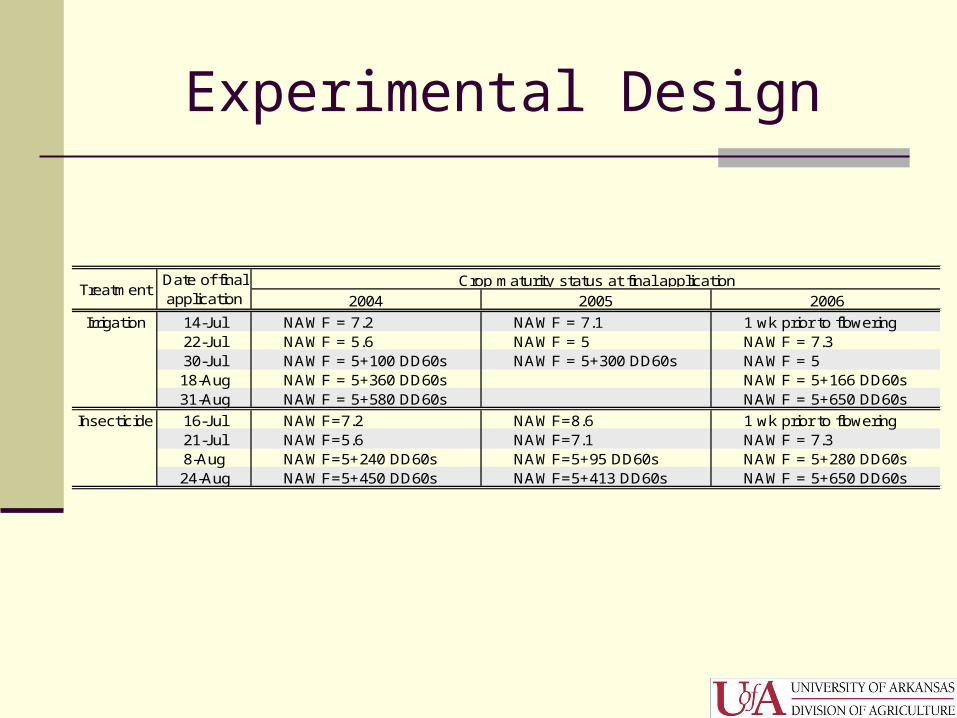
2004 2005 2006
Irrigation 14-Jul NAWF = 7.2 NAWF = 7.1 1 wk prior to flowering22-Jul NAWF = 5.6 NAWF = 5 NAWF = 7.330-Jul NAWF = 5+100 DD60s NAWF = 5+300 DD60s NAWF = 518-Aug NAWF = 5+360 DD60s NAWF = 5+166 DD60s31-Aug NAWF = 5+580 DD60s NAWF = 5+650 DD60s
Insecticide 16-Jul NAWF=7.2 NAWF=8.6 1 wk prior to flowering21-Jul NAWF=5.6 NAWF=7.1 NAWF = 7.38-Aug NAWF=5+240 DD60s NAWF=5+95 DD60s NAWF = 5+280 DD60s24-Aug NAWF=5+450 DD60s NAWF=5+413 DD60s NAWF = 5+650 DD60s
TreatmentDate of final application
Crop maturity status at final application
Experimental Design
Nodes Above White Flower (NAWF) Monitored using COTMAN
HVI fiber quality determinations International Textile Center at Texas Tech
University More technical information:
Teague et al. (2005) Danforth et al. (2006)

Lint Values
Market adjust the price of cotton 2004, 2005 and 2006 CCC loan schedules Micronaire, color/leaf grade, fiber length,
uniformity and strength Base loan rate:
52.00 cents per pound
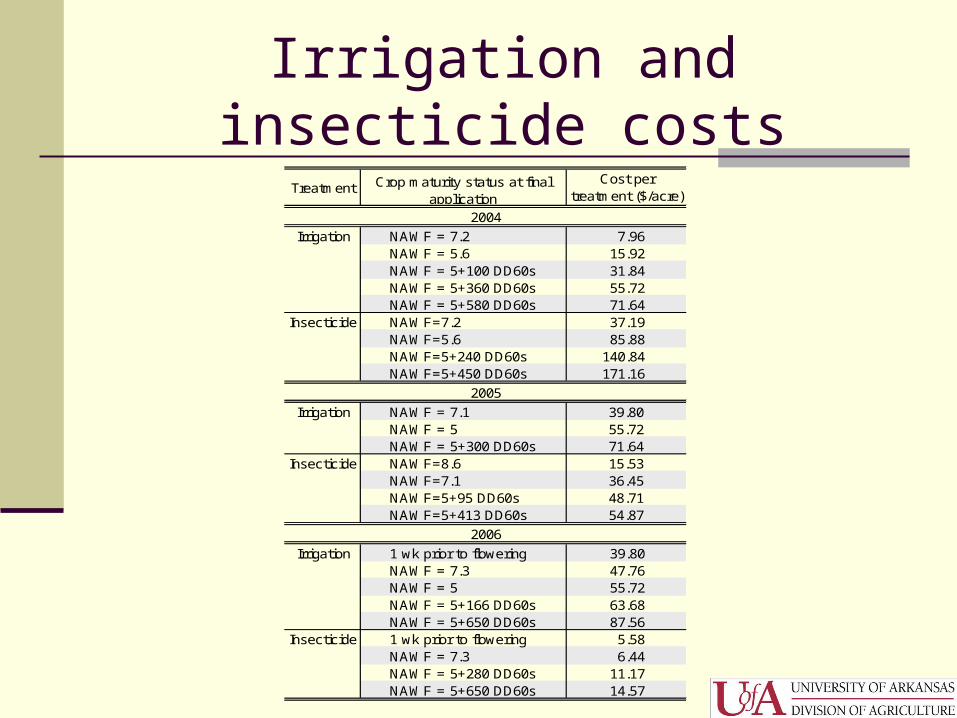
Irrigation and insecticide costs
Irrigation costs Furrow irrigation $7.96 per acre per application
Insecticide costs Applied with a 60-foot John Deer Hi-Boy
$1.04 per acre Insecticide prices are constant
Irrigation and insecticide costs
Irrigation NAWF = 7.2 7.96NAWF = 5.6 15.92NAWF = 5+100 DD60s 31.84NAWF = 5+360 DD60s 55.72NAWF = 5+580 DD60s 71.64
Insecticide NAWF=7.2 37.19NAWF=5.6 85.88NAWF=5+240 DD60s 140.84NAWF=5+450 DD60s 171.16
Irrigation NAWF = 7.1 39.80NAWF = 5 55.72NAWF = 5+300 DD60s 71.64
Insecticide NAWF=8.6 15.53NAWF=7.1 36.45NAWF=5+95 DD60s 48.71NAWF=5+413 DD60s 54.87
Irrigation 1 wk prior to flowering 39.80NAWF = 7.3 47.76NAWF = 5 55.72NAWF = 5+166 DD60s 63.68NAWF = 5+650 DD60s 87.56
Insecticide 1 wk prior to flowering 5.58NAWF = 7.3 6.44NAWF = 5+280 DD60s 11.17NAWF = 5+650 DD60s 14.57
2005
2006
Treatment Crop maturity status at final application
2004
Cost per treatment ($/acre)
Statistical analysis
Variables analyzed using ANOVA for the different irrigation and insect control treatments Yields (lbs/acre) Lint values ($/lb) Profits ($/acre)
Mean separation – Fisher’s Least Significant Difference

Results

2004 experiment
TreatmentDate of final application
Crop maturity status at final application
Yields (lbs/acre)*Lint values
($/lb)*Profits ($/acre)*
Irrigation 14-Jul NAWF = 7.2 1,357.77 a 0.47 516.77 a
22-Jul NAWF = 5.6 1,353.56 a 0.46 481.55 b
30-Jul NAWF = 5+100 DD60s 1,437.60 a 0.46 522.02 a
18-Aug NAWF = 5+360 DD60s 1,642.79 b 0.48 627.64 c
31-Aug NAWF = 5+580 DD60s 1,679.44 b 0.46 597.21 d
LSD05 = 121.31 p>0.05 LSD05 = 25.80
Insecticide 16-Jul NAWF = 7.2 1,388.26 a 0.45 b 532.04
21-Jul NAWF = 5.6 1,391.34 a 0.45 b 506.56
8-Aug NAWF = 5+240 DD60s 1,561.65 b 0.48 a 577.87
24-Aug NAWF = 5+450 DD60s 1,635.68 b 0.48 a 583.06LSD05 = 153.78 LSD05 = 0.02 p>0.05
* Amounts with different letters are significantly different at the 5% significance level.
Yields, lint values and profits for each irrigation main plot and insecticide termination sub-plot effect in 2004 trial
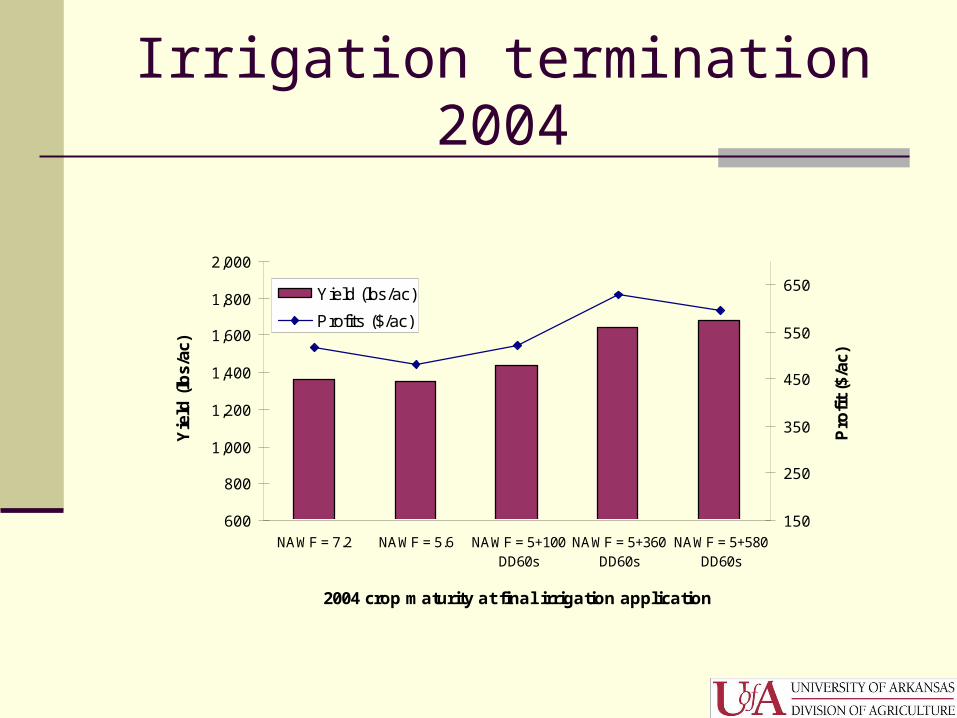
Irrigation termination 2004
600
800
1,000
1,200
1,400
1,600
1,800
2,000
NAWF = 7.2 NAWF = 5.6 NAWF = 5+100DD60s
NAWF = 5+360DD60s
NAWF = 5+580DD60s
2004 crop maturity at final irrigation application
Yie
ld (
lbs/
ac)
150
250
350
450
550
650
Pro
fit
($/a
c)
Yield (lbs/ac)
Profits ($/ac)

Insect control termination 2004
600
800
1,000
1,200
1,400
1,600
1,800
2,000
NAWF=7.2 NAWF=5.6 NAWF=5+240DD60s
NAWF=5+450DD60s
2004 crop maturity at final insecticide application
Yie
ld (
lbs/
ac)
150
250
350
450
550
650
Pro
fit
($/a
c)
Yield (lbs/ac)
Profit ($/acre)
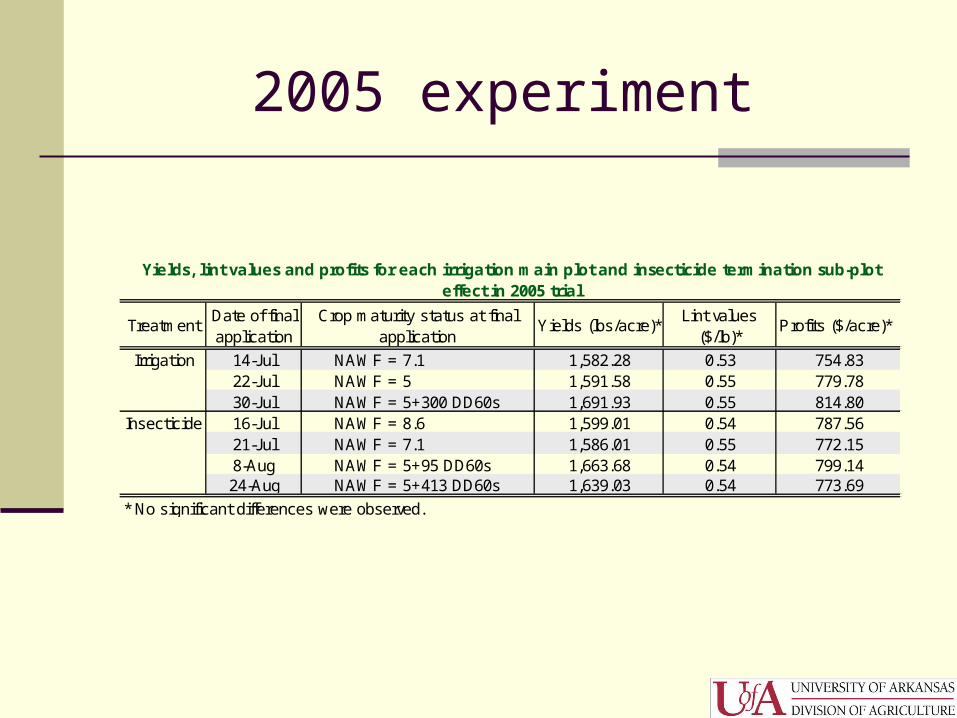
2005 experiment
TreatmentDate of final application
Crop maturity status at final application
Yields (lbs/acre)*Lint values
($/lb)*Profits ($/acre)*
Irrigation 14-Jul NAWF = 7.1 1,582.28 0.53 754.8322-Jul NAWF = 5 1,591.58 0.55 779.7830-Jul NAWF = 5+300 DD60s 1,691.93 0.55 814.80
Insecticide 16-Jul NAWF = 8.6 1,599.01 0.54 787.5621-Jul NAWF = 7.1 1,586.01 0.55 772.158-Aug NAWF = 5+95 DD60s 1,663.68 0.54 799.1424-Aug NAWF = 5+413 DD60s 1,639.03 0.54 773.69
* No significant differences were observed.
Yields, lint values and profits for each irrigation main plot and insecticide termination sub-plot effect in 2005 trial

2006 experiment
TreatmentDate of final application
Crop maturity status at final application
Irrigation 14-Jul 1 week prior to flowering 865.96 a 0.45 a 333.82 a
22-Jul NAWF = 7.3 944.01 ab 0.47 a 377.60 ab
30-Jul NAWF = 5 1,103.71 b 0.48 a 451.72 b
18-Aug NAWF = 5+166 DD60s 1,307.57 c 0.52 b 594.79 c
31-Aug NAWF = 5+650 DD60s 1,452.58 c 0.54 b 674.70 c
Insecticide 16-Jul 1 week prior to flowering 1,035.53 a 439.48 a
21-Jul NAWF = 7.3 1,042.62 a 442.12 a
8-Aug NAWF = 5+280 DD60s 1,238.71 b 542.25 b
24-Aug NAWF = 5+650 DD60s 1,222.19 b 522.24 b
* Amounts with different letters are significantly different at the 5% significance level.
Yields, lint values and profits for each irrigation main plot and insecticide termination sub-plot effect in 2006 trial
Profits ($/acre)*Lint values
($/lb)*Yields (lbs/acre)*
LSD05 = 105.21
LSD05 = 59.66
LSD05 = 0.03
p>0.05
LSD05 = 189.87
LSD05 = 116.13
0.48
0.48
0.50
0.50

Irrigation termination 2006
600
800
1,000
1,200
1,400
1,600
1,800
2,000
1 w k prior toflow ering
NAWF = 7.3 NAWF = 5 NAWF = 5+166DD60s
NAWF = 5+650DD60s
2006 crop maturity at final irrigation application*
Yie
ld (
lbs/
ac)
150
250
350
450
550
650
Pro
fit
($/a
c)
Yield (lbs/ac)
Profits ($/ac)
*Termination at NAWF=5 + 166 DD60s is equivalent to NAWF=5 + 366 DD60s because of rainfall.

Insect control termination 2006
600
800
1,000
1,200
1,400
1,600
1,800
2,000
1 w k prior toflow ering
NAWF = 7.3 NAWF = 5+280DD60s
NAWF = 5+650DD60s
2006 crop maturity at final insecticide application
Yie
ld (
lbs/
ac)
150
250
350
450
550
650
Pro
fit
($/a
c)
Yield (lbs/ac)
Profits ($/ac)

Conclusions
Problem Statement
Insect control termination NAWF = 5 + 280 DD60s Yield and profits did not increase beyond 280 DD60s COTMAN guideline (350 DD60s) can economically be
applied to tarnished plant bug
Irrigation termination NAWF = 5 + 360 DD60s Yield and profits did not increase beyond 360 DD60s Irrigation termination based on COTMAN monitoring
is feasible

Acknowledgments

Questions
Recommended
![Multigrid for Elliptic Monge Amp ere Equation · Multigrid for Elliptic Monge Amp ere ... Monge-Amp ere equations were rst studied by Gaspard Monge in 1784 [3] and later by Andre-Marie](https://img.pdfslide.us/doc/110x75/5c45b40693f3c34c50612fad/multigrid-for-elliptic-monge-amp-ere-equation-multigrid-for-elliptic-monge-amp.jpg)