1 FT/P1-20
Dynamic erosion of plasma facing materials under ITER relevant thermal shock loads in the electron beam facility, JUDITH
T. Hirai, W. Kühnlein, J. Linke, G. Sergienko
Forschungszentrum Jülich GmbH, EURATOM Association, 52425 Jülich, Germany
e-mail contact of main author: [email protected]
Abstract. ITER relevant thermal shock loads have been performed in the electron beam facility, JUDITH.
Dynamic erosion processes of fine grain graphite, carbon fiber composite (CFC) and W-1%La2O3 were
observed by optical diagnostics. Collective small particle release which may correspond to erosion of graphite
binder phase was observed at 2 GW/m2 in graphite, whereas, distinguished particle release was observed at the
same power density in CFC. The distinguished particle release was concluded to be due to brittle destruction of
overheated PAN fibers which has lower thermal conductivity in vertical direction. Most particles released from
W-1%La2O3 were appeared to be droplets splashed from the molten surface. The contribution of brittle
destruction in W-1%La2O3 was not clearly observed in this particular thermal shock loads. Release of tungsten
atoms and WO molecules was not observed by emission spectrometer even at high power density, 1.1 GW/m2
which caused melting of the surfaces, however, release of LaO molecules was detected even at lower power
density, 0.6 GW/m2 where and the surface did not show significant modification.
1. Introduction
Thermal shock loads in the order of several 10 MJ/m2 with duration of a few ms (plasma
disruptions) are predicted in ITER [1]. Carbon based materials (carbon fiber composite:
CFC) had been selected as plasma facing armor materials in ITER divertor since it has a high
thermal shock resistance and high thermal conductivity. However, recent studies show a
strong erosion of carbon based materials due to macroscopic erosion caused by brittle
destruction (BD) under plasma disruption condition [2-9]. Macroscopic erosion is associated
with a substantial material loss because the released particles are not re-deposited on
surfaces but create directly dusts. Moreover, brittle materials such as tungsten and the alloys
that are the other ITER candidate materials in the divertor, are also concerned from a view
point of material loss due to BD. Therefore, the detailed studies of material erosion under
thermal shock loads are necessary. In the present paper, dynamic erosion processes of plasma
facing materials under intense thermal loads were studied by newly developed optical
diagnostics.
2. Experiments
2.1 Electron beam facility, JUDITH
2 FT/P1-20
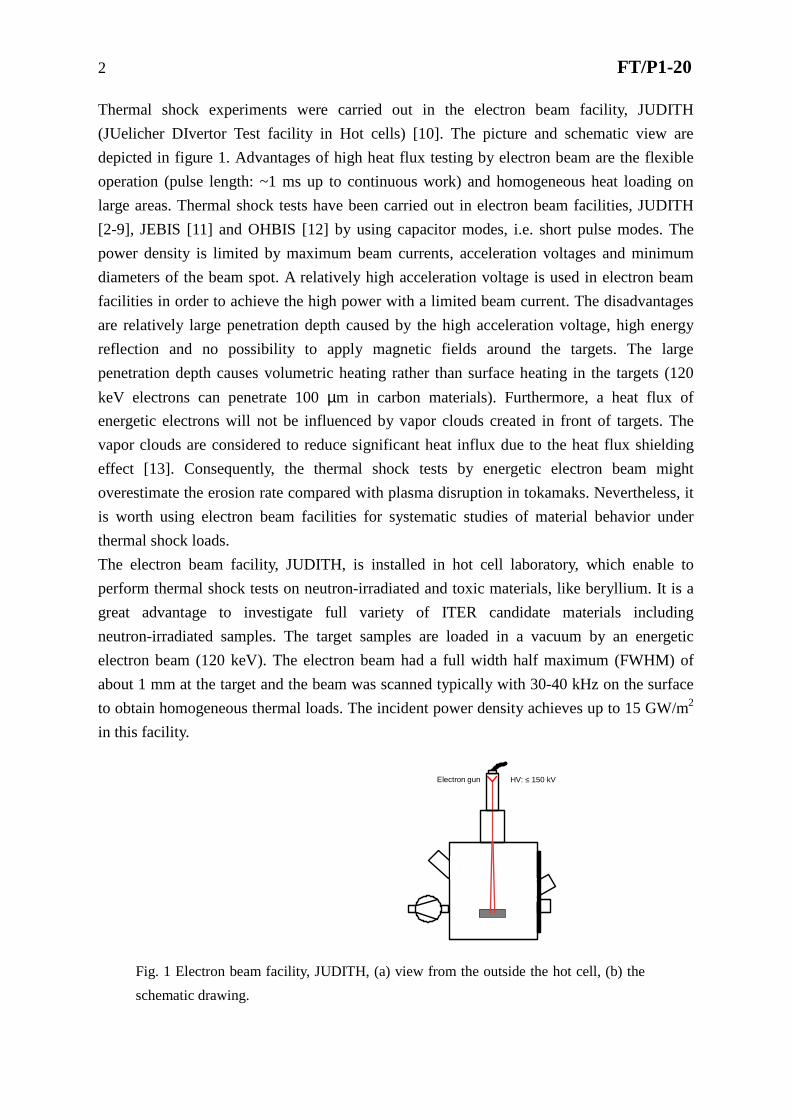
Thermal shock experiments were carried out in the electron beam facility, JUDITH
(JUelicher DIvertor Test facility in Hot cells) [10]. The picture and schematic view are
depicted in figure 1. Advantages of high heat flux testing by electron beam are the flexible
operation (pulse length: ~1 ms up to continuous work) and homogeneous heat loading on
large areas. Thermal shock tests have been carried out in electron beam facilities, JUDITH
[2-9], JEBIS [11] and OHBIS [12] by using capacitor modes, i.e. short pulse modes. The
power density is limited by maximum beam currents, acceleration voltages and minimum
diameters of the beam spot. A relatively high acceleration voltage is used in electron beam
facilities in order to achieve the high power with a limited beam current. The disadvantages
are relatively large penetration depth caused by the high acceleration voltage, high energy
reflection and no possibility to apply magnetic fields around the targets. The large
penetration depth causes volumetric heating rather than surface heating in the targets (120
keV electrons can penetrate 100 µm in carbon materials). Furthermore, a heat flux of
energetic electrons will not be influenced by vapor clouds created in front of targets. The
vapor clouds are considered to reduce significant heat influx due to the heat flux shielding
effect [13]. Consequently, the thermal shock tests by energetic electron beam might
overestimate the erosion rate compared with plasma disruption in tokamaks. Nevertheless, it
is worth using electron beam facilities for systematic studies of material behavior under
thermal shock loads.
The electron beam facility, JUDITH, is installed in hot cell laboratory, which enable to
perform thermal shock tests on neutron-irradiated and toxic materials, like beryllium. It is a
great advantage to investigate full variety of ITER candidate materials including
neutron-irradiated samples. The target samples are loaded in a vacuum by an energetic
electron beam (120 keV). The electron beam had a full width half maximum (FWHM) of
about 1 mm at the target and the beam was scanned typically with 30-40 kHz on the surface
to obtain homogeneous thermal loads. The incident power density achieves up to 15 GW/m2
in this facility.
Fig. 1 Electron beam facility, JUDITH, (a) view from the outside the hot cell, (b) the
schematic drawing.
HV: ≤ 150 kVElectron gun
Scanning coils
target
Infrared camera, Pyrometers
420L
2200L/s
Camera
Spectrometer,Photo detectors
HV: ≤ 150 kVElectron gun
Scanning coils
target
Infrared camera, Pyrometers
420L
2200L/s
Camera
Spectrometer,Photo detectors
(a) (b)HV: ≤ 150 kVElectron gun
Scanning coils
target
Infrared camera, Pyrometers
420L
2200L/s
Camera
Spectrometer,Photo detectors
HV: ≤ 150 kVElectron gun
Scanning coils
target
Infrared camera, Pyrometers
420L
2200L/s
Camera
Spectrometer,Photo detectors
(a) (b)

3 FT/P1-20
Pyrometer
60Photodiode array #2
Sample10
Photodiode array #1
1 Ω, Current measurement[mm]
Emission spectrometer=25 mm
4030
20
Photodiode array #3
Photodiode array #4
12.5
Electron beam,120 keV
Pyrometer
60Photodiode array #2
Sample10
Photodiode array #1
1 Ω, Current measurement[mm]
Emission spectrometer=25 mm
4030
20
Photodiode array #3
Photodiode array #4
12.5
Electron beam,120 keV
Fig. 2, Observing volumes of optical diagnostics in JUDITH.
2.2 Diagnostics
In order to observe the dynamic erosion processes, optical diagnostics have been developed.
The erosion processes under thermal shock loads can be roughly classified into two
processes: macroscopic and microscopic erosion. The macroscopic erosion corresponds to
particle release due to brittle destruction and/or splashing of molten surface. It was observed
by photodiode array (PDA) aligned above the target surface. Thermal radiation from hot
particles was detected by the PDA with near-infrared cut-off filter (850 nm). The observing
volume is 1.8 x 7.6 mm (shown in figure 2) at 4 different points along the electron beam axis.
The microscopic erosion corresponds to releases of atomic and molecular components due to
sublimation or evaporation at high temperatures. It was detected by emission spectrometer.
Emission spectrometer could detect ultraviolet (200 nm) to infrared (1000 nm), however, the
transmission of optics and optical fiber limited the observing wavelength in a visible range
(380 nm - 800 nm). The observing volumes are shown in figure 2. A single color pyrometer
was pointing at the loaded hot surface with an observing area of φ ~ 4 mm. The pyrometer
provided an average surface temperature in the observing area. Emissivity was fixed at
values of 0.9 for carbon based materials and 0.3 for W-1%La2O3. Consequently, the
measuring temperatures were 600 - 4000 oC in case of carbon based materials and above 700 oC in case of tungsten alloy. Current measurements were also performed to monitor
“absorbed current” (electric current through the samples) by measuring the electric potential
of a grounded resistor (1 Ω).
2.3 Samples and experimental conditions
Fine grain graphite (R6650, SGL-Carbon), CFC (NB31, SNECMA Motors) and W-1%La2O3

4 FT/P1-20
(c ) W-1%La2O3(b) CFC (NB31)(a) Graphite (R6650) (c ) W-1%La2O3(b) CFC (NB31)(a) Graphite (R6650)
Fig.3, time integral image during thermal shock tests on (a) graphite, 2 GW/m2, 4.6 ms, (b) CFC, 2 GW/m2, 4.6ms, (c) W-1%La2O3, 1.1 GW/m2, 4.6 ms.
(Plansee) with dimensions of 25 x 25 x 10 mm3, were loaded by the electron beam at room
temperature. The loading power density and the duration were 0.6 - 2 GW/m2 and 4.6 ms,
respectively. All high power density shots were applied on small areas (~16 mm2), therefore,
the increase of bulk temperature was negligible.
3. Results and discussion
3.1 Thermal shock tests on carbon based materials, graphite and CFC
In case of graphite, two components of particle release due to brittle destruction were
considered: large particles and small particles which are corresponding to graphite grain
clusters and binder phase, respectively [5,8,9]. At the present power density, faint traces were
observed as shown in Fig. 3(a). This is the small particle release from graphite target. The
surface temperature reached above 3000 oC in the thermal shock test (Fig. 4(a)). Absorbed
current started to drop around 2000 oC and the current exceeded zero point to negative after
the shot (Fig. 4(b)). It is caused by thermal electron emission from the hot surface.
According to the surface temperature excursion, there was not significant disturbance from
the thermally emitted electron since the experiments were performed with energetic electron
beam (120keV). As can be expected by the collective release of small particles, continuum
was observed in PDA signals (Fig. 4(c)). All signals started to appear around 3 ms when the
surface temperature was high enough (>2500oC) and disappear immediately after the shot.
These results indicate relatively fast speed of released particles [9].
CFC showed particle release due to brittle destruction at power density 2 GW/m2 (see bright
traces in Fig. 3(b)). The PDA signals showed rather distinguished particle release (Fig. 4(f)).
The maximum surface temperature was around 2500 oC. This was lower than graphite.
However, one should note that the temperature is averaged over the observing area. The
particular CFC, NB31, has ex-pitch fibers with high thermal conductivity and PAN fibers
with lower thermal conductivity in the vertical direction. The local overheating could
apparently occur at PAN fibers. In fact, pitch fiber did not show remarkable modification,

5 FT/P1-20
Fig.4, time evolution of surface temperatures (Temp.), absorbed currents (Iab), PDA signals during thermal shock tests on (a) - (c) graphite, 2 GW/m2, 4.6 ms, (d) - (f) CFC , 2 GW/m2, 4.6 ms, (g) - (i) W-1%La2O3 , 1.1 GW/m2, 4.6 ms.
(c) W-1%La2O3(b) W-1%La2O3(a) CFC (NB31)
2 GW/m2, 4.6 ms 0.6 GW/m2, 4.6 ms 1.1 GW/m2, 4.6 ms1 mm
(c) W-1%La2O3(b) W-1%La2O3(a) CFC (NB31)
2 GW/m2, 4.6 ms 0.6 GW/m2, 4.6 ms 1.1 GW/m2, 4.6 ms1 mm
Fig.5, Microstructures of loaded surfaces. (a) CFC, 2 GW/m2, 4.6 ms, (b) W-1%La2O3, 0.6 GW/m2, (c) W-1%La2O3, 1.1 GW/m2, 4.6 ms.
whereas, PAN fibers showed strong erosion as shown in Fig. 5(a). PDA signals in numbers
of tests at the same condition showed that no particular initiation temperature (averaged
surface temperature) where the particle release appeared as PDA signals. This also indicates
that particle release started at local overheated points. The initiation temperature depends on
the local structures and local thermal properties. Consequently, it is concluded that CFC
would be suffered from macroscopic erosion because of local overheating associated with its
inhomogeneous structure.
Figure 6 shows spectra in front of targets. Microscopic erosion, i.e. released atoms and
molecules are observed by emission spectrometer. Figure 6(a) and (b) show spectra from the
graphite and CFC samples, respectively. C2 Swan bands and C3 bands around 400 nm, were
observed predominately [14,15]. Strong CII lines were observed in CFC, whereas, no CII
lines were visible in graphite in this particular condition. This indicates that there were
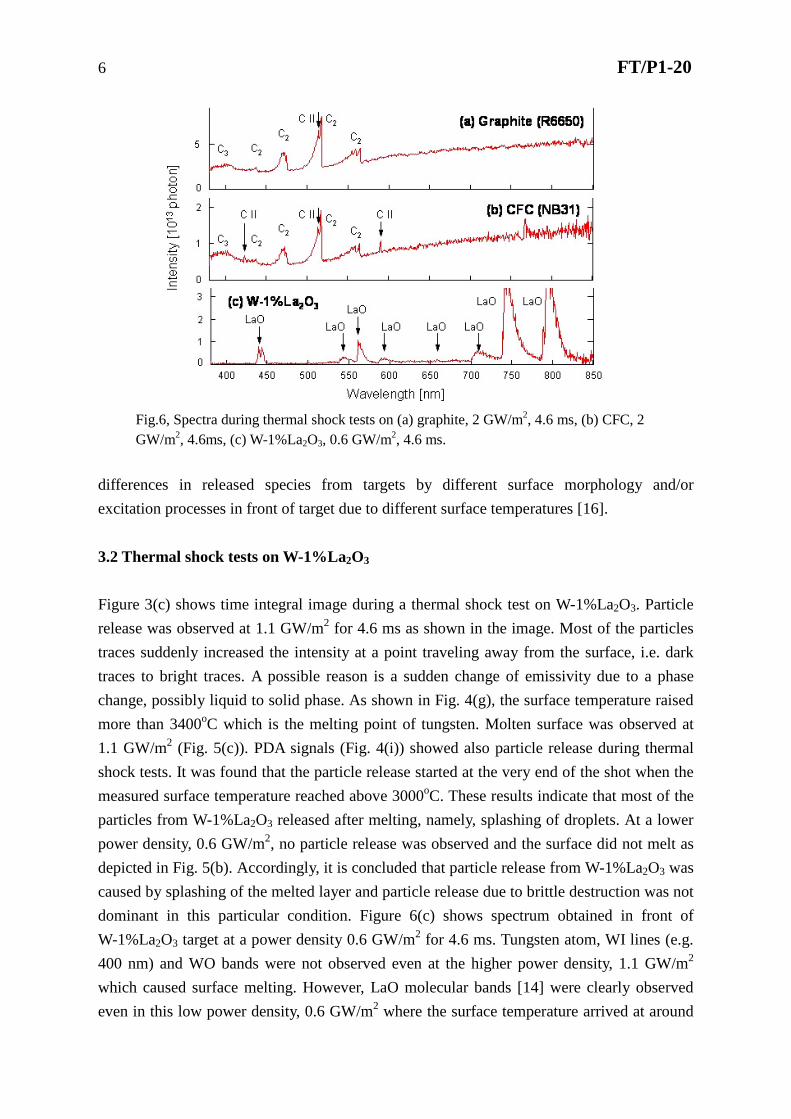
6 FT/P1-20
Fig.6, Spectra during thermal shock tests on (a) graphite, 2 GW/m2, 4.6 ms, (b) CFC, 2 GW/m2, 4.6ms, (c) W-1%La2O3, 0.6 GW/m2, 4.6 ms.
differences in released species from targets by different surface morphology and/or
excitation processes in front of target due to different surface temperatures [16].
3.2 Thermal shock tests on W-1%La2O3
Figure 3(c) shows time integral image during a thermal shock test on W-1%La2O3. Particle
release was observed at 1.1 GW/m2 for 4.6 ms as shown in the image. Most of the particles
traces suddenly increased the intensity at a point traveling away from the surface, i.e. dark
traces to bright traces. A possible reason is a sudden change of emissivity due to a phase
change, possibly liquid to solid phase. As shown in Fig. 4(g), the surface temperature raised
more than 3400oC which is the melting point of tungsten. Molten surface was observed at
1.1 GW/m2 (Fig. 5(c)). PDA signals (Fig. 4(i)) showed also particle release during thermal
shock tests. It was found that the particle release started at the very end of the shot when the
measured surface temperature reached above 3000oC. These results indicate that most of the
particles from W-1%La2O3 released after melting, namely, splashing of droplets. At a lower
power density, 0.6 GW/m2, no particle release was observed and the surface did not melt as
depicted in Fig. 5(b). Accordingly, it is concluded that particle release from W-1%La2O3 was
caused by splashing of the melted layer and particle release due to brittle destruction was not
dominant in this particular condition. Figure 6(c) shows spectrum obtained in front of
W-1%La2O3 target at a power density 0.6 GW/m2 for 4.6 ms. Tungsten atom, WI lines (e.g.
400 nm) and WO bands were not observed even at the higher power density, 1.1 GW/m2
which caused surface melting. However, LaO molecular bands [14] were clearly observed
even in this low power density, 0.6 GW/m2 where the surface temperature arrived at around

7 FT/P1-20
2500 oC and the surface did not show significant modification. It means that the La2O3
particles dispersed in the bulk tungsten dissociated below melting temperature of tungsten
and released from the surface. In fact, La2O3 has melting temperature around 2300 oC. It was
molten and evaporated during the thermal shock loads. As it is often observed in tungsten
alloy, severe cracking was observed at the vicinity of the melting spots. Taniguchi et al
reported that the weight loss of W-1%La2O3 was greater than that of pure tungsten at 1.25
GW/m2 for 2 ms [17]. It indicates that adding La2O3 in tungsten does not mean improvement
of tungsten performances and it causes introduction of additional impurity in vacuum
chamber.
4. Summary
Dynamic erosion processes were observed by optical diagnostics in electron beam facility,
JUDITH. Collective small particle release was observed in case of graphite, at 2 GW/m2 for
4.6 ms, whereas, distinguished particle release was observed in case of CFC in the same
condition. The distinguished particles from CFC were concluded to be segments of PAN
fibers. W-1%La2O3 seemed to release mainly droplet due to melt layer splash. Contribution
of brittle destruction in W-1%La2O3 under thermal shock tests was not clearly observed in
this particular condition. Release of W atom and WO species was not observed even at 1.1
GW/m2 which caused significant melting of the surfaces, however, release of LaO molecules
were clearly detected even at low power density, 0.6 GW/m2 where the surface did not show
significant modification.
Acknowledgements
Authors would like to appreciate Mr. Oliver Schimt and Mr. Uwe Westerhoff in Institute for
Plasma Physics, Forschungszentrum Jülich for considerable supports on the developments of
data acquisition system for electron beam facility, JUDITH.
References
[1] FEDERICI, G., SKINNER, C. H., et al. Nucl. Fusion 41 (2001) 1967.
[2] LINKE, J., BOLT, H., DUWE, R., KÜHNLEIN, W., LODATO, A., RÖDIG, M.,
SCHÖPFLIN, K., WIECHERS, B., J. Nucl. Mater. 283-287 (2000) 1152-1156.
[3] LINKE, J., RUBEL, M., MALMBERG, J. A., DARKE, J. R., DUWE, R., PENKALLA,
H.-J., RÖDIG, M., WESSEL, E., Physica Scripta T91 (2001) 36-42.
[4] LINKE, J., AKIBA, M., DUWE, R., LODATO, A., PENKALLA, H.-J., RÖDIG, M.,
SCHÖPFLIN, K., J. Nucl. Mater. 290-293 (2001) 1102-1106.
[5] LINKE, J., AMOUROUX, S., BERTHE, E., KOZA, Y., KÜHNLEIN, W., RÖDIG, M.,

8 FT/P1-20
Fusion Eng. Des. 66-68 (2003) 395-399.
[6] KOZA, Y., BERTHE, E., LEHMANN, E., LINKE, J., RÖDIG, M., WESSEL, E.,
SINGHWISER, L., J. Nucl. Mater. 329-333 (2004) 706-710.
[7] KOZA, Y., AMOUROUX, S., BAZYLEV, B. N., BERTHE, E., KÜHNLEIN, W., LINKE,
J., PENKALLA, H.-J., SINGHEISER, L., Physica Scripta T111 (2004) 167-172.
[8] HIRAI, T., LINKE, J., KÜHNLEIN, W., SERGIENKO, G., BREZINSEK, S., J. Nucl.
Mater. 321 (2003) 110–114.
[9] HIRAI, T., BREZINSEK, S., KÜHNLEIN, W., LINKE J., SERGIENKO, G., Physica
Scripta T111 (2004) 163-166.
[10] DUWE, R., KÜHNLEIN, W., MÜNSTERMANN, H., Proc. 18th Symposium on Fusion
Thechnology (SOFT), Karlsruhe Germany, (1994) p.355.
[11] TANIGUCHI, M., SATO, K., EZATO, K., YOKOYAMA, K., AKIBA, M., J. Nuclear
Material, 307-311, (2002) 719-722.
[12] RÖDIG, M., ISHISTUKA, E., GARACASH, A., KAWAMURA, H., LINKE, J.,
LITUNOVSKI, N., MEROLA, M., J. Nucl. Mater. 307-311 (2002) 53-59.
[13] ARKHIPOV, N., BAKHTIN, V., BARSUK, V., KURKIN, S., MIRONOVA, E.,
PIAZZA, G., SAFRONOV, V., SCAFFIDI-ARGENTINA, F., TOPORKOV, D., VASENIN,
S., WÜRZ, H., ZHITLUKHIN, A., J. Nucl. Mater. 307-311 (2002) 1364-1368.
[14] PEARSE, R. E. B., GAYDON, A. G., “The idensification of molecular spectra” John
Wiley & Sons, Inc. New York, 1976.
[15] AREPALLI, S., SCOTT, C. D., Chem. Phys. Lett. 302 (1999) 139-145.
[16] JANEV, R. K., DRAWIN, H. W., Atomic and Plasma–Material Interaction Process in
Controlled Thermonuclear Fusion, Elsevier, Amsterdam, 1993, p. 213.
[17] TANIGUCHI, M., SATO, K., EZATO, K., MASAKI, K., NAKAMURA, K., MIYA, N.,
ARAKI, M., AKIBA, M., Fusion Technology 39 (2001) 890.
Recommended