SIGl
20
SIN
R
LDA Ed
Ar
Bh
NTEF Technlobal Health
011-09-01
NTEF A20047 -
Repo
Living CDisabilA National
ditor(s)
rne H. Eide
hekie Jele
ology and So and Welfare
Unrestricted
rt
Conditities inl Represe
F
ociety
ions amn Swazentative S
FODSW
mong Pziland Study
WA
Peoplee with


PROJECT NO. 60G00530
REPORT NO. SINTEF A20047
VERSION 1
PROJECT NO. 60G00530
REPORT NO. SINTEF A20047
VERSION 1
Table of contents
1 ACKNOWLEDGEMENTS ............................................................................................................................................................................................ 1
2 FOREWORD BY FFO ................................................................................................................................................................................................... 3
3 SUMMARY ........................................................................................................................................................................................................................ 5
4 PREFACE ........................................................................................................................................................................................................................... 7
5 THE CONTEXT - SWAZILAND BACKGROUND ............................................................................................................................................ 9
6 DESIGN AND METHODS ....................................................................................................................................................................................... 23
7 CONCEPTUAL UNDERSTANDING ................................................................................................................................................................... 35
7.1 Disability ................................................................................................................................................................................................................ 35
7.2 International Classification of Functioning, Disability and Health (ICF) ............................................................ 36
7.3 Application of ICF in the current study ........................................................................................................................................ 37
7.4 Environmental factors................................................................................................................................................................................ 37
7.5 Living conditions ............................................................................................................................................................................................. 38
7.6 Disability and living conditions ........................................................................................................................................................... 38
7.7 Combining two traditions and ICF .................................................................................................................................................... 40
8 RESULTS ........................................................................................................................................................................................................................ 42
8.1 Household section ........................................................................................................................................................................................ 42
8.2 Individual section ........................................................................................................................................................................................... 60
9 SUMMARY OF RESULTS ...................................................................................................................................................................................... 86
10 DISCUSSION ................................................................................................................................................................................................................ 89
11 CONCLUSION ............................................................................................................................................................................................................... 94
12 REFERENCES .............................................................................................................................................................................................................. 95
PROJECT NO. 60G00530
REPORT NO. SINTEF A20047
VERSION 1
APPENDICES
A. Household Listing form
B. Household questionnaire
C. Individual questionnaire
D. Individual control questionnaire

PROJECT NO. 60G00530
REPORT NO. SINTEF A20047
VERSION 1
1
1 ACKNOWLEDGEMENTS
Arne H. Eide, SINTEF.
This is a report from a National, representative household survey carried out in Swaziland
in 2009 – 2010. A large amount of effort has been put into this two‐year exercise until
finally we can present the results of the combined efforts. First of all, this is a credit to
the Federation of Disabled People in Swaziland (FODSWA): To the Management
Committee headed by Ms. Buyie Masuku for being in control of the whole process, and
to the Project Co‐ordinator Mr. Bhekie Jele who for the most of the study handled all
aspects in this comprehensive and complex process. Mr Yusman B Kamaleri from SINTEF
played an important role in supporting FODSWA during the implementation of the study.
The Executive Committee for the survey comprised of Mr. Makhosini Makhubu –
FODSWA, Mr Choice Ginindza – Central Statistical Office, Mr. Fortune Dlamini – Central
Statistical Office, Ms. Sindie Dube – Deputy Prime Minister’s Office, and Mr. Mathew –
University of Swaziland. They should all be thanked for their support and efforts to make
this survey a useful tool for disabled people in Swaziland in the years to come.
A number of disabled individuals have contributed in different roles. Not least has this
been an exercise that has proven the capabilities of disabled people, either in the
Management Committee, as enumerators or as supervisors. This report and this study
had not been possible without their enthusiastic participation, and the inclusion of
individuals with disabilities in this exercise is a remarkable achievement, given the
difficult situation for many individuals with disabilities in Swaziland and in the region.
This effort may be one important step in changing in the role of disabled people, from
objectives for research to actors and decision makers in research.
PROJECT NO. 60G00530
REPORT NO. SINTEF A20047
VERSION 1
2
The Central Statistical Office (CSO) has offered assistance in the preparations for the
study and personnel from CSO participated actively as supervisors during data collection.
Particular thanks CSO, Ministry of Health and University of Swaziland who were
represented in the Management Committee of the study and have all been open for
consultations during the research process. These are all key institutions for following up
the results of the study as well as for further utilization of the data material.
Southern Africa Federation of the Disabled SAFOD) and it’s late Executive Director Mr.
Alexander Phiri has been a supportive partner in this exercise as in the preceding studies
on living conditions in the Region. His passing away during the study in Swaziland was a
tremendous blow to us all. Fortunately, Alexander managed to write his contribution to
this report before he fell ill, and we have included the chapter in this report in respect of
his memory.

PROJECT NO. 60G00530
REPORT NO. SINTEF A20047
VERSION 1
3
2 FOREWORD BY FFO
Jarl Ovesen & Hanne Witsø
FFO ‐ The Norwegian Federation of Organisations of Disabled People ‐ believes that
documentation is the most fruitful means in civil dialogue when change in society is the
goal. Research results provide us with national, representative, credible and indisputable
documentation. When we lobby for change and improvement of the living conditions for
people with disabilities, we are often met by a requirement of documentation. This is
why we, through many years, have been collaborating with SINTEF in the area of Living
Conditions Studies in southern Africa.
FFO applies for funding for the Living Conditions Studies from NORAD through the Atlas
Alliance. In addition to being the principal for the studies, we also take an active part in
the whole process. We have a clear vision about how the results are to be presented and
how they should be used. It is crucial to FFO that disabled peoples organisations are
involved in and also feel an ownership to the studies. The study design takes into account
the involvement of both FFO and the national federation of organisations of disabled
people in the respective country where the studies are being implemented.
However, documentation in itself is of little use if it is put in a drawer. In collaboration
with the national federation, FFO always plans for awareness building in the country
when the results are ready. Both FODSWA and SAFOD will be using the results from the
study; SAFOD on regional level and FODSWA on national level.
FODSWA now has the “proof” that is often demanded by governments and ministries –
solid documentation of the living conditions of people with disabilities, compared to the
living conditions of the non‐disabled population. Our belief – based on our experience
from other countries ‐ is that this will strengthen the position and the action of FODSWA.
PROJECT NO. 60G00530
REPORT NO. SINTEF A20047
VERSION 1
4
FODSWA will continue to lobby, now more targeted, for improved living conditions of
people with disabilities. In the long run, we also think that having such useful
documentation will improve the visibility of FODSWA in society, the human rights aspect
of people with disabilities will be more emphasized, and last, but not least: The living
conditions of people with disabilities will improve.

PROJECT NO. 60G00530
REPORT NO. SINTEF A20047
VERSION 1
5
3 SUMMARY
A national, representative household survey on living conditions among people with
disabilities was carried out in Swaziland in 2009 – 2010. The study is part of a regional
series of similar studies which so far has covered six other countries in the southern
Africa region. The content of these surveys are largely similar, forming a regional data
base that can be utilized for international comparison.
It is a particular feature of these studies, including this one in Swaziland, that much of the
responsibility, including a decisive role during the implementation including the content
of the study, practical implementation and later application of results, has been with the
national disability federation (in Swaziland: FODSWA).
The design of the study is based on experiences from the previous countries, but adapted
to the context of Swaziland through involvement of a range of local stakeholders. The
design further builds on current development of disability research including the
International Classification of Functioning, Disability and Health (ICF) (WHO 2001) and
the work of the Washington City Group on Disability Statistics. The Central Statistical
Office provided critically important support by utilizing the current national sampling
frame for the selection of areas for data collection. A two‐stage cluster sampling was
applied. Data collection was carried out by a team appointed by FODSWA, comprising
disabled enumerators and staff from the CSO. Data entry was carried out in Swaziland,
while SINTEF did the analyses for this report.
The study comprised three questionnaires; one for the households, one for identified
disabled members of the sampled households and one for a matched control group of
non‐disabled. Initially, a listing exercise was carried out in order to identify households
with disabled members in the sampled Enumeration Areas. The sample comprised 1635
PROJECT NO. 60G00530
REPORT NO. SINTEF A20047
VERSION 1
6
households with a total of 8734 individuals, of which 876 were identified as disabled
according to the applied screening procedure.
Results from the study as presented in this report is organized according to a series of
key indicators on level of living. Thus, the indicators comprise demographic differences,
socio‐economic status, dietary diversity, access to information, education and literacy,
employment, causes of disability, experiences of discrimination, access to health and
welfare services, accessibility at home and in the local community, assistive devices,
assistance in daily life, involvement in family and social life, physical and mental health,
knowledge about diseases, awareness about rights. Key results are summarized below.
The findings confirm that there are substantial gaps on a number of key indicators on
level of living, to the disadvantage of individuals with disability and disabled women living
in rural areas in particular. It is recommended that the evidence base found in this
research report is utilized by DPOs in Swaziland in their advocacy work, by Government
bodies in their planning and service provision, as a basis for monitoring development. It is
further recommended that the data is further utilized by researchers and Central
Statistical Office in Swaziland, and not least as a knowledge base for development of the
disability policy in the country.

PROJECT NO. 60G00530
REPORT NO. SINTEF A20047
VERSION 1
7
4 PREFACE
Alexander M. Phiri – Director General, SAFOD
In 2000, at the Millennium Summit (in New York), the World leaders committed
themselves to “spare no effort to free our fellow men, women and children from the
abject and dehumanizing conditions of extreme poverty”. This commitment was
translated into what later on became to be known as the eight Millennium Development
Goals (MDGs) whose main purpose is to halve world poverty by the year 2015.
Interestingly, at the time the Millennium Declaration of 2000 was being enunciated, the
disability movement in Africa had just successfully lobbied with its African leadership for
an important initiative on the implementation of the African Decade of Persons with
Disabilities which was to run from 2000 to 2009. Concurrent with these global
developments, and initiatives, the Southern Africa Federation of the Disabled (SAFOD)
and its Norwegian Partner, FFO (Norwegian Federation of Organisations of People with
Disabilities), agreed to work on a number of joint activities which among other things
would include building the capacity of organizations of people with disabilities and
undertaking studies on the Living Conditions among people with Activity Limitations in
SAFOD member countries. It was further agreed that these studies would be carried out
from country to country during the Decade period to collect disability data which would
then be used to raise awareness on disability in respective countries. Thus, between
2000 and 2009, the Living Conditions Studies were carried out in Malawi, Mozambique,
Namibia, South Africa, Zambia and Zimbabwe.
In 2009 – 2010 it was agreed to do national representative studies in Lesotho and
Swaziland simultaneously as these countries were found to be relatively smaller and
much easier to handle than other SAFOD member countries. Having done these two
PROJECT NO. 60G00530
REPORT NO. SINTEF A20047
VERSION 1
8
countries, it means that there are now only two countries remaining to do the studies,
i.e. Angola and Botswana.
Over the years it has been SAFOD’s desire to see governmental and non – governmental
organizations utilizing the study findings to improve the quality of life of people with
disabilities in the region. Indeed some governments and local authorities are finding the
data from these studies useful in designing their development plans. The completion of
the study reports in Lesotho and Swaziland have coincided with the debate and adoption
by world leaders at the UN of an annual report on “Assessing Progress in Africa towards
the Millennium Development Goals (MDGs) 2010”. The report presents an African
continent that has made progress in a number of key areas such as equality in primary
education, political empowerment of women, access to safe drinking water, and reducing
the spread of HIV / AIDS and TB. Incidentally, 2010 marks the 10th year of the MDGs and
2015 is only five years away. SAFOD’s critical question is around the reality of achieving
the MDGs when disability is silent in this global poverty reduction strategy.
Perhaps the data from the Living Conditions Studies may be used by governments, the
UN itself, and other stakeholders to assess future progress (if any) on the implementation
of the MDGs. As SAFOD we are more than happy to work with the MDGs implementers
in this area.
Thanks to our Norwegian partner, FFO, for providing the resources that enabled our two
member organizations, LNFOD and FODSWA, to carry out these studies under the
supervision of another important Norwegian partner, SINTEF Health Research. Our
thanks also go to Universities, Government Ministries, Central Statistical Offices, DPOs,
individuals and other stakeholders in Lesotho and Swaziland for making these studies a
success!
PROJECT NO. 60G00530
REPORT NO. SINTEF A20047
VERSION 1
9
5 THE CONTEXT - SWAZILAND BACKGROUND
Mr. Bheki Jele
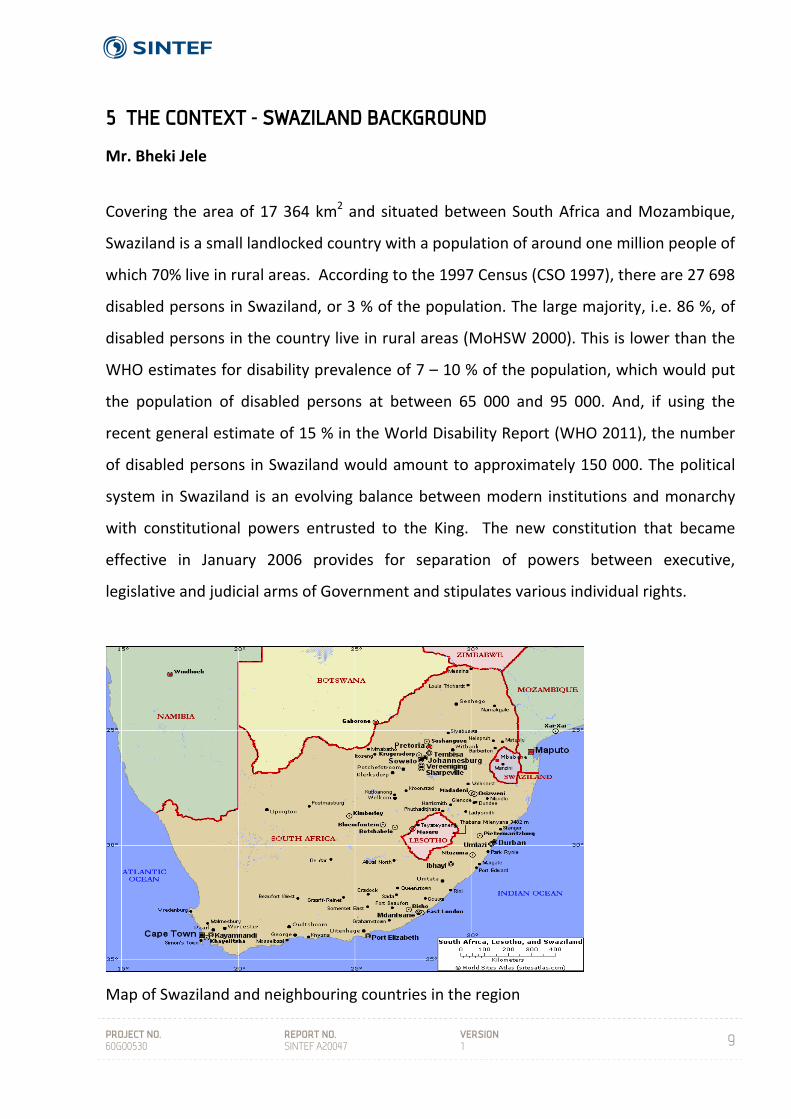
Covering the area of 17 364 km2 and situated between South Africa and Mozambique,
Swaziland is a small landlocked country with a population of around one million people of
which 70% live in rural areas. According to the 1997 Census (CSO 1997), there are 27 698
disabled persons in Swaziland, or 3 % of the population. The large majority, i.e. 86 %, of
disabled persons in the country live in rural areas (MoHSW 2000). This is lower than the
WHO estimates for disability prevalence of 7 – 10 % of the population, which would put
the population of disabled persons at between 65 000 and 95 000. And, if using the
recent general estimate of 15 % in the World Disability Report (WHO 2011), the number
of disabled persons in Swaziland would amount to approximately 150 000. The political
system in Swaziland is an evolving balance between modern institutions and monarchy
with constitutional powers entrusted to the King. The new constitution that became
effective in January 2006 provides for separation of powers between executive,
legislative and judicial arms of Government and stipulates various individual rights.
Map of Swaziland and neighbouring countries in the region
PROJECT NO. 60G00530
REPORT NO. SINTEF A20047
VERSION 1
10
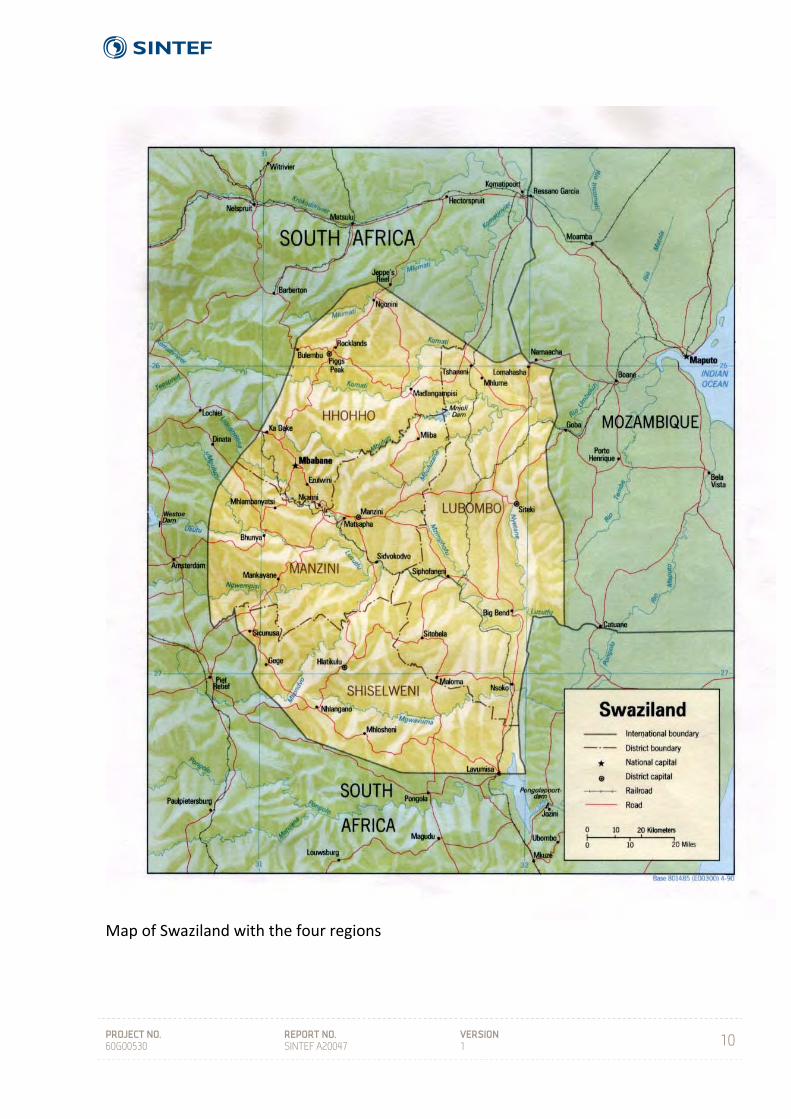
Map of Swaziland with the four regions
PROJECT NO. 60G00530
REPORT NO. SINTEF A20047
VERSION 1
11
The human toll of HIV and AIDS in Swaziland is a tragic reality being experienced by
families, communities and the nation at large. There is no aspect of life in Swaziland that
has not directly or indirectly been adversely influenced by HIV and AIDS, and the
pandemic has become the major cause of illness and death among young and middle
aged Swazis, depriving households and society of a critical human resource base and
thereby reversing the social and economic gains the country has attained.
Swaziland has a relatively high GPD per capita income of US$2, 415. Despite this, about
69% of the country’s 1 018 million people live below the national poverty line (CSO
2001). Income distribution is skewed, and according to the Swaziland Household Income
and Expenditure Survey (SHIES) of 2001, 56% of wealth is held by the richest 20% while
the poorest 20% own less than 4.3%. The country has recorded a Gini Coefficient of 51%,
which is considered great inequality according to the international standard (op.cit.).
People with disabilities form a significant part of the poor majority of Swaziland, and
whose human rights have been violated for centuries due to past policies, programs,
strategies and attitudes. Conditions of people with disabilities are exacerbated by their
systematic exclusion from the mainstream of society and therefore resulting in high rates
of infection and affection of the above discussed issues.
Situation of people with disabilities in Swaziland
Living with a disability in Swaziland presents significant challenges. There is a general
belief that those who have a disability are bewitched or inflicted by bad spirits. Many
believe that being around people with disabilities can bring bad luck. As a result, many
people with disabilities are hidden in their homesteads and are not given an opportunity
to participate and contribute to society.
People with disabilities in Swaziland remain marginalized and vulnerable. The impact of
poverty, HIV/AIDS, and the gender imbalance in society compounds the problems of
PROJECT NO. 60G00530
REPORT NO. SINTEF A20047
VERSION 1
12
disability and discrimination. The absence of any comprehensive laws and policies to
address people with disabilities’ access to equal opportunities reflect a lack of political
will and a failure to recognize disability rights as human rights. The failure by the society
to recognize disability as a human right issue contributes to the devaluing and
dehumanization of people with disabilities. People with disabilities have the same rights
as able bodied and they are entitled to enjoy all citizenry rights. Affording equal
opportunities to people with disabilities will achieve the most important and cherished
goals for them. It will result in a maximum degree of autonomy and independence for
people with disabilities and the benefit will be for the whole society. The attitude of
government and the community of treating disability as a medical condition rather than a
reflection of many existing social challenges are limiting the participation of people with
disabilities in society. It is worth noting that it is the society and inaccessible environment
that makes people disabled rather than their physical being. It is therefore important to
address the attitudes of society and the inaccessibility of our physical environment so
that the integration of people with disabilities is automatic.
Our belief is that people with disabilities in Swaziland today are the agents for and
victims of political, economic and socio‐cultural changes which the mother continent is
experiencing. People with disabilities tend to be more open minded, flexible and less
constrained by the negative aspects of “tradition”. They have eagerness and ability to
learn; they are less afraid of technological and social change and adjustment; they have
an instinct for social responsibility, and if appropriately applied to, they have energy
ready to be applied to the development objectives of Swaziland.
Despite the availability of basic frameworks for the provision of services and calling for
the enactment of legislations appropriate for people with disabilities in Swaziland, they
still face extreme levels of inequality and discrimination. The majority of people and
their families are therefore forced into depending on the little social grants provided for
survival.

PROJECT NO. 60G00530
REPORT NO. SINTEF A20047
VERSION 1
13
Different social, economic and political factors interact and create underdevelopment,
marginalization, unequal access to resources and lack of service provision for this sector
of the population. This effectively discourages many of those who struggle for autonomy
and financial independence. It is no longer denied that the systematic deprivation and
disadvantage that disabled people experience is caused by socio‐economic barriers and
restrictive environments. A critical problem they face is the inaccessibility of the outside
world. This refers to buildings, communications intended for deaf, blind, people with
mental disabilities as well as services such as public transport and opportunities for social
integration.
An important issue is the relationship that exists between the high incidences of disability
and poverty. Jointly with unemployment and social isolation, poverty forms part of the
key issues that contribute to the exclusion of people with disabilities and is responsible
for their cumulative disadvantage.
Paternalistic attitudes and a piece –meal approach to addressing the needs of people
with disabilities have hampered their integration into society. Past approaches have
focused on the limitations and not on the capacities of people with disabilities.
Special Groupings with Disabilities
Selected categories of people with disabilities are particularly vulnerable to
discrimination, abuse and encounter barriers to participation in society, due to a number
of factors impacting on their disabilities, which require distinct attention.
The consequences of deficiencies and disablement are particularly serious for women
and children, who are subjected to social, cultural and economic disadvantages that
impede their (women) access to health care, education, vocational training and
employment. Not only are women with disabilities discriminated against as disabled
PROJECT NO. 60G00530
REPORT NO. SINTEF A20047
VERSION 1
14
people, but they also experience oppression and marginalization as women in a
patriarchal society.
For many children, the presence of an impairment leads to rejection or isolation from
experiences that are part of ‘normal’ development, making them more vulnerable to
violence and abuse. Most of their disabilities are as a result of poverty and preventable
diseases such a measles, alcohol and drug abuse, or injuries sustained as a result of social
and political violence.
Disabled women and girls are more often subject to various types of violence, particularly
sexual violence, and are more vulnerable to HIV & AIDS transmission given the increased
risk of sexual violence. Inclusive programs, and accessible services that would ensure the
necessary special support for women and girls with disabilities, remain the only form of
systems of ensuring respect for, protection of the rights and empowerment of women
and girls with disabilities.
Children living in rural areas or in informal settlement are the most vulnerable to
disablement and HIV & AIDS, more so as facilities for early detection, diagnosis and
support are inadequate. Inadequate facilities inevitably lead to an increase in both the
extent and the severity of disablement.
People with multiple disabilities, mental disabilities, invisible disabilities, congenital
disabilities and severe disabilities are special groupings who require special attention; as
mainstream services do not, most of the time, address their social needs adequately.
Lack of comprehension of their needs often leads to misunderstandings, exclusion and
wrong conclusions on how their needs should be appropriately addressed and their rights
promoted.
PROJECT NO. 60G00530
REPORT NO. SINTEF A20047
VERSION 1
15
The disability movement in Swaziland
During the late 1970s several philanthropists undertook to establish organisations that
would work on addressing issues of people with disabilities. An example is the Swaziland
National Society for the Handicapped which was firstly run by the spouses of members of
the British government on a charity basis. The organisation served to raise funds to
support people with disabilities in many different aspects of their lives. This ranged from
providing school fees (to enable them to get an education) to purchasing wheelchairs to
enable them to gain a decent mobility level.
The beginning of the disability movement during the 1980s was an appropriate time to
enable people with disabilities in the region to begin to question the role of service
providers, charity workers, therapists, rehabilitation workers and the Government, on
their role as liberators of people with disabilities as an “oppressed” section of the
population. Over the years people with disabilities have emerged as leaders, managers
and directors of their own cause. This was a great revelation to a nation that, over many
years, had believed that people with disabilities were not capable of doing anything for
themselves and had to be looked after and provided for by their respective families and
the Government. As a predominantly traditional nation; the Swazi nation has very strong
family relations even up to the clan level. This therefore provided for a very “protective
and supportive” environment for people with disabilities and also created a highly
depended group of nationals.
The Federation of Organizations of the Disabled Persons in Swaziland (FODSWA) is a
human rights oriented coordinating body of DPOs formed in 1993by organizations of
people with disabilities in Swaziland due to lack of coordination of their activities.
FODSWA has four affiliates;
a. Swaziland National Association of the Deaf (SNAD)
b. Swaziland National Association of the Physically Disabled (SNAPDPe)

PROJECT NO. 60G00530
REPORT NO. SINTEF A20047
VERSION 1
16
c. Swaziland Association of the Visually Impaired (SAVIP)
d. Parents of Children with Disabilities. (PCDSWA)
The Federation is governed by a National Executive Committee (NEC) elected by its
General Assembly formed by delegates from affiliates every four years. Apart from the
NEC, FODSWA has a committee responsible for youth and women with disabilities issues
whose chairpersons are members of the NEC with the responsibility of ensuring that the
needs of the two groups are mainstreamed in all programs of FODSWA. To strengthen
and promote working relationship with other organizations, FODSWA is a member of the
Coordinating Assembly of Non‐ Government Organizations in Swaziland (CANGO), the
Federation of Organizations of the Disabled Persons in Southern Africa (SAFOD) and
Disabled People International (DPI).
Government of Swaziland policies and disability (Lang 2008)
a) Disability provisions on Government strategies
People with disabilities in Swaziland have always been on the receiving end of
developmental processes, it is necessary that structures and systems be instituted to
address the situation. The present government recognizes that people with disabilities
are key partners in national development and service delivery. This is in evidence to the
involvement of people with disabilities in the following policy formulation:
i. National Development Strategy (NDS) August 1999
ii. Population Policy
iii. Constitution
iv. SPEED
i. NDS (4.8.2.1 Disadvantaged Groups)
The National Development Strategy (NDS) recommends the following strategies for
government’s implementation in addressing issues of people with disabilities in
Swaziland;
PROJECT NO. 60G00530
REPORT NO. SINTEF A20047
VERSION 1
17
a) Integration and Awareness
Integrate persons with disabilities into economic and social activities.
Ensure the integration of programmes for persons with disabilities into
mainstream education.
Provide infrastructure for rehabilitation for those who cannot be
integrated. Institutions catering for disabled people (e.g. school for the
blind, deaf and vocational training) must be expanded to cater for the
existing and expected demand.
Create institutional and policy mechanisms through which persons with
disabilities can be rehabilitated and integrated effectively with the rest of
society.
Raise awareness on how to prevent the various forms of disabilities.
b) Equity
Enact legislations to protect the disadvantaged groups from abuse and
discrimination.
Ensure that all infrastructural designs are inclusive of the needs of persons
with disabilities.
Introduce measures that will support the operations of NGOs to help
specific groups.
Enact legislations to ensure equal opportunities for persons with
disabilities.
ii. Population Policy (Thematic Area Six and Eight page 45, 4.5.16)
Establish a National Unit / framework to deal with issues of persons with
disabilities
Strengthen and expand activities to integrate persons with disabilities into
mainstream society,
PROJECT NO. 60G00530
REPORT NO. SINTEF A20047
VERSION 1
18
Develop a national programme to deal with issues of disability, including
improving the capacity for testing and early detection of disabilities and the
rehabilitation of persons with disabilities.
Improve the enforcement of laws and regulations on safety standards
Discourage cultural practices that discriminate against persons with disabilities,
Improve access to social and public services including transport for persons with
disabilities,
Sensitize the public on issues concerning persons with disabilities; and
Empower communities and extended families to care for persons with disabilities.
iii. Constitution (Chapter Four section 31)
The rights of persons with disabilities shall be respected. The parliament shall
pass laws to enforce the recognition of the rights of the disabled.
iv. SPEED (Presented to Parliament in August by His Honorable Prime Minister A.T.
Dlamini)
Government Vision
“To build a truly twenty‐First Century Kingdom of Swaziland, cultural united, integrated
and stable, economically prosperous and socially well organized with equal opportunity
for all, irrespective of gender, and responsibility from all”.
“To provide a climate and infrastructure that will progressively maximize the quality and
security of the life of the people of Swaziland and make the best use of the country’s
natural and human resources”.
Human Development, “For the government vision to be sustainable, it is imperative that
fellow citizens including people with disabilities should see more meaningful in the
quality of their lives and in their living conditions”.

PROJECT NO. 60G00530
REPORT NO. SINTEF A20047
VERSION 1
19
Although people with disabilities have participated in the formulation of some of the
above policies and strategies, there is still little that is done to implement the
contributions made by people with disabilities. This may be due to the fact that there is
no government mechanism to coordinate such implementation.
The National Development Strategy (1997)
The purpose of the NDS is to formulate a Vision and Mission Statement with appropriate
strategies for socio‐economic development for the next 25 years, and provide a guide for
the formulation of development plans and for the equitable allocation of resources. It is
designed to strengthen the Government’s development planning and management
capacities and anchor it firmly to a national consensus on the direction of future
developments in the country.
The National Development Strategy includes a section on people with disabilities. The
strategy “recommends” measures to improve the situation of people with disabilities:
the enactment of legislation to ensure equal opportunities for people with disabilities
and to protect them from discrimination; ensuring that the built environment and public
transport are accessible; the integration of programmes for people with disabilities into
mainstream education; the creation of institutional mechanisms to rehabilitate and
integrate people with disabilities into society; ensuring adequate and accessible
sanitation facilities; the introduction of social security payments to disadvantaged
groups; the promotion of cooperatives for women, youth and people with disabilities.
The strategy calls for “special attention to members of society with disabilities” in human
resources development.
The National Development Strategy made the following recommendations with regard to
persons with disabilities:
PROJECT NO. 60G00530
REPORT NO. SINTEF A20047
VERSION 1
20
a) Integration and Awareness: Integrate persons with disabilities into economic and
social activities: Ensure the integration of programmes for persons with disabilities into
mainstream education: Provide infrastructure for rehabilitation for those who cannot be
integrated. Institutions catering for disabled people (e.g. schools for the visually and
hearing impaired, and vocational training) must be expanded to cater for the existing and
expected demand: Create institutional and policy mechanisms through which persons
with disabilities can be rehabilitated and integrated effectively with the rest of society:
Raise awareness on how to prevent various forms of disabilities.
b) Equity: Enact legislation to protect the disadvantaged groups from abuse and
discrimination: Ensure that all infrastructural designs are inclusive of the needs of
persons with disabilities: Introduce measures that will support the operations of NGOs to
help specific groups: Enact legislation to ensure equal opportunities for persons with
disabilities.
Special Education and Accessibility (National Development Strategy 1997)
This strategy promotes the integration of persons with disabilities into the mainstream of
the education system; Enable persons with visual impairments to have access to colleges
and universities by providing the necessary equipment for their training; Ensure equal
access to education and training for women and girls at all levels and in all sections of
formal, non‐formal and life skills development; Promote education as a basic human right
and ensure that males and females receive equal treatment and benefits at all levels and
in all areas of the education system; Seek and enforce equitable access to Tibiyo
bursaries and scholarships.
There are no secondary schools or special educational alternatives for children with
hearing impairments. In July, 2006 the Federation of Disabled Persons in Swaziland
complained that there were no schools for approximately 900 visually impaired children
of school age. In August 2006, the Minister for Enterprise and Employment told the

PROJECT NO. 60G00530
REPORT NO. SINTEF A20047
VERSION 1
21
Swaziland Association of Visually Impaired People that he was shocked to learn that of
the 10,600 visually impaired persons in the country, only three were employed.
Consequently, in November 2006 the Ministry of Health and Social Welfare released a
report which found that 49 % of interviewed persons with disabilities had not completed
primary school, 19 % went beyond primary school, and 25 % were employed, mostly in
the private sector.
Social Security and Welfare (National Development Strategy, 1997)
The following strategies are recommended:
a) Rehabilitation: Increase rehabilitation centers for those that have had problems with
the law and also ensure the provision of psychological counseling services; Establish
rehabilitation centers for people who abuse alcohol and drugs.
b) Direct Welfare Assistance; Establish temporary shelters for abandoned and abused
children and adults. This will entail an acknowledgement that the extended family
system is deteriorating and provision of safety nets to those who are in need,
particularly the homeless and street children ; Strengthen and promote adoption
mechanisms and foster care homes for children;
c) Education and Information: Educate and sensitize the public on the issue of human
rights, such as abuse of children and women as well as sexual harassment, the uses of
limiting and inappropriate language and actions towards women, the elderly, youth
and persons with disabilities: Improve structures and mechanisms to facilitate proper
and effective information dissemination on social welfare matters;
d) Policy and Legislation; ensure equal opportunities for persons with disabilities to
enable them to become more independent.
National Education Policy (1999)
The National Education Policy is the official policy of the Ministry of Education and is
based on the overall objective of “the provision of opportunities for all pupils of school‐

PROJECT NO. 60G00530
REPORT NO. SINTEF A20047
VERSION 1
22
going age and adults to develop themselves in order to improve the quality of their own
lives and the standard of living of their communities”.
Section 5 of the National Education Policy specifically addresses special needs education.
The policy aims at including children with disabilities in the mainstream school system.
Section 5.3 of the policy states that:‐
“The Ministry of Education shall facilitate access to education for all learners with
disabilities by improving the infrastructure to make it user‐friendly from basic through
tertiary level [and] shall support the integration and inclusion of children with special
learning needs in the Education System.”
The policy also contains a section on Vocational Education and Training (VET). The policy
lists four goals of the VET system: “Development of a functional gender sensitive,
affordable and efficient VET‐System of sufficient capacity according to the needs of the
economy, the society and the individual; Enhancement of VET as an attractive and
integrated component of a permeable Comprehensive System of Education: Promotion
of entrepreneurial skills and values as an integral element of VET at all stages, sectors
and areas: Contribution to a foresighted and coordinated National Skills Development
Planning and to Business and Employment Promotion Programs.”
The policy aims at reducing unemployment, by (1) ensuring that “vocational training
becomes an important element in efforts aimed at eradicating inequity and inequality
among the people of Swaziland and includes groups thus far neglected, such as women
and disabled [persons]”; and (2) change the focus of the VET system from formal
economy wage employment to self‐employment, thereby balancing skills demand and
supply. Another objective is to provide training to the “widest possible range of citizens,
irrespective of their level of formal education”.
PROJECT NO. 60G00530
REPORT NO. SINTEF A20047
VERSION 1
23
6 DESIGN AND METHODS
Mr. Bhekie Jele, Co‐ordinator and Programme Officer, FODSWA
Introduction
This chapter presents the methodology used for the design and selection of sample of
households for the survey.
The study required that the estimates obtained should be representative nation‐wide. A
census would have been too expensive given the available resources. However, it is
widely known that sample surveys whose design and methodologies are well developed
and executed can produce estimates that can be very close to those that would have
been arrived at had a census been conducted. Hence, the survey was carried out on a
sample basis and the design and methodologies used in the study are discussed below.
This chapter covers information on how the sample size was determined, the available
sampling frame, sampling and data collection methodologies.
Scope of the survey
The scope of the survey in terms of topics covered was guided by similar studies
conducted in Malawi, Mozambique, Namibia, South African, Zambia and Zimbabwe
between 2001 and 2010 (Kamaleri & Eide 2010, Eide & Kamaleri 2010, Eide & Loeb
2006a; Loeb & Eide 2004; Eide et al. 2003a; 2003b). A continuous process of consultation
with organizations of people with disabilities in Swaziland, Government departments
responsible for both disability and statistics and other key stakeholders on disability
issues, provided technical support in shaping the scope of the survey. As such, the survey
only included agreed upon topics of policy relevance.
PROJECT NO. 60G00530
REPORT NO. SINTEF A20047
VERSION 1
24
Determination of Sample Size
From the onset, the target population for sampling was all private households in
Swaziland excluding institutionalized and homeless people.
The sample used for this study is a sub ‐ sample of the master sample derived from the
National Census (2007) of Swaziland from the Central Statistics Office and the
methodology is the same as the master sample methodology. A master sample is a
sample from which sub‐samples can be selected to serve the needs of more than one
survey or survey round, and it can take several forms. A master sample with simple and
rather common design is one consisting of Primary Sampling Units (PSUs), where the
PSUs are Enumeration Areas (EAs). The sample is used for two‐stage sample selection, in
which the second‐stage sampling units (SSUs) are housing units or households.
The survey was designed to cover 359 Standard Enumeration Areas (SEAs) across the 4
regions, approximately 7 200 non‐institutionalized private households residing in the
rural and urban areas of Swaziland. The survey was carried out for a period of 90 days
using a cross sectional sample. The sample was nationally and regionally efficient and
was expected to yield reliable estimates at regional, local and national levels. The table
below shows a detailed sample size.

PROJECT NO. 60G00530
REPORT NO. SINTEF A20047
VERSION 1
25
Table A: allocation of the 2009 Disability sample into sub‐regional strata and sample sizes
by region and urban / rural
Sub‐Regions
Census 2007
HHs
Census 2007
PSUs
DISABILITY
PSUs House Holds
Hhohho urban 20,554 170 98 1,960
Manzini urban 12,053 100 58 1,153
Shiselweni urban 3,634 22 13 254
Lubombo urban 9,692 81 47 934
Hhohho rural 38,331 397 35 707
Manzini rural 57,373 474 42 844
Shiselweni rural 32,515 395 35 703
Lubombo rural 31,993 352 31 627
Total 206,145 1,991 359 7,180
Sampling procedures
It was calculated that a sample of 7 180 households would be adequate to provide
estimates of acceptable precision at the national level and the terms of reference
dictated that there should be complete enumeration of all people with disabilities in the
sampled enumeration areas. The lowest level for which the available frame had
information, as discussed above, was the enumeration area and the information
comprised of only totals of persons and households. In addition, there was no
information on the prevalence of persons with disabilities at the enumeration area level.
Considering the coverage of 7 180 households, and that an enumeration area would
contain on average 10 households with at least one disabled member, a sample of 359
enumeration areas were planned to be covered in the study within which all persons
identified to have a disability were to be interviewed. Each one of the regions (Hhohho,
PROJECT NO. 60G00530
REPORT NO. SINTEF A20047
VERSION 1
26
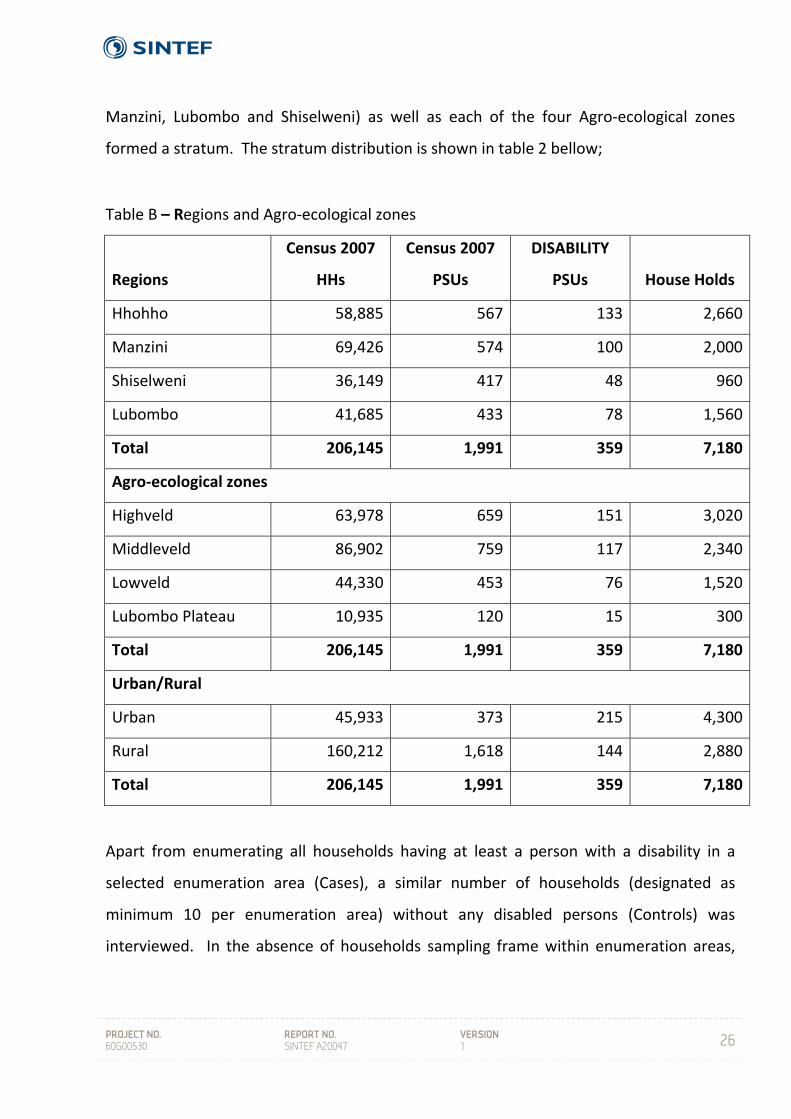
Manzini, Lubombo and Shiselweni) as well as each of the four Agro‐ecological zones
formed a stratum. The stratum distribution is shown in table 2 bellow;
Table B – Regions and Agro‐ecological zones
Regions
Census 2007
HHs
Census 2007
PSUs
DISABILITY
PSUs House Holds
Hhohho 58,885 567 133 2,660
Manzini 69,426 574 100 2,000
Shiselweni 36,149 417 48 960
Lubombo 41,685 433 78 1,560
Total 206,145 1,991 359 7,180
Agro‐ecological zones
Highveld 63,978 659 151 3,020
Middleveld 86,902 759 117 2,340
Lowveld 44,330 453 76 1,520
Lubombo Plateau 10,935 120 15 300
Total 206,145 1,991 359 7,180
Urban/Rural
Urban 45,933 373 215 4,300
Rural 160,212 1,618 144 2,880
Total 206,145 1,991 359 7,180
Apart from enumerating all households having at least a person with a disability in a
selected enumeration area (Cases), a similar number of households (designated as
minimum 10 per enumeration area) without any disabled persons (Controls) was
interviewed. In the absence of households sampling frame within enumeration areas,
PROJECT NO. 60G00530
REPORT NO. SINTEF A20047
VERSION 1
27
the selection of Controls was done by the enumerators in the field. The household listing
was also done concurrently with the data collection exercise.
PROJECT NO. 60G00530
REPORT NO. SINTEF A20047
VERSION 1
28
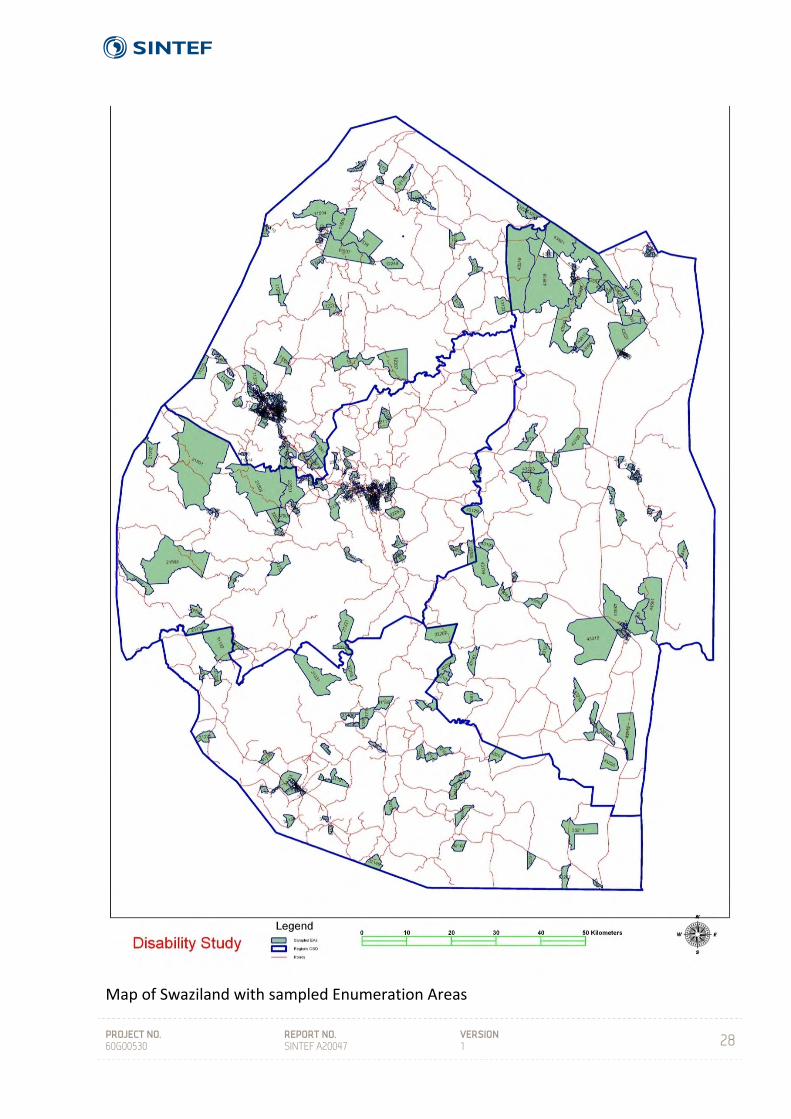
Map of Swaziland with sampled Enumeration Areas

PROJECT NO. 60G00530
REPORT NO. SINTEF A20047
VERSION 1
29
Data Collection
The research teams used maps provided by CSO to locate selected enumeration areas
and identified their boundaries. Having identified the boundaries, the members of the
team listed all the households that were found to exist at the time of the survey. The
listing was done utilizing a household listing and screening form that was designed
specifically for this study. The enumerators were required to complete the case
questionnaire upon identifying a household with a person with disability and the overall
household questionnaire and immediately identify a control household. A total of
twenty households were to be interviewed in each enumerating area and further list all
households available in the EA.
Questionnaires
Data collection questionnaires that had been used in previous similar studies conducted
in Lesotho, Malawi, Mozambique, Namibia, South Africa, Zambia and Zimbabwe between
2001 and 2010 (Kamaleri & Eide 2010, Eide & Kamaleri 2010, Eide & Loeb 2006a; Loeb &
Eide 2004; Eide et al. 2003a; 2003b;) were combined and adapted for use in Swaziland.
In addition, a disability‐screening instrument was included as well as a matrix on activity
limitations and participation restrictions, drawing on the concepts of the ICF. The design
applied in this study in Swaziland is similar to the design applied in the previous study in
Lesotho (Kamaleri & Eide 2010) save some differences in formulations of a few questions.
User participation was an important element in the design development. This process
included a one‐day workshop attended by 30 professionals, researchers, people with
disabilities and civil servants who discussed and came up with general information that
was used to adapt the general questionnaire into the needs of Swaziland. After revision,
four separate questionnaires comprised four key elements; in the ‘Levels of Living
Conditions Questionnaire’:
PROJECT NO. 60G00530
REPORT NO. SINTEF A20047
VERSION 1
30
i) Household study on living conditions – a set of core indicators of living
conditions for all permanent members of the household (including control
households)
ii) Screening for disability;
iii) Detailed Questionnaire for people with disabilities including the Activity and
Participation Matrix drawn from ICF and
iv) Detailed questionnaire to individuals without disability (controls)
The final versions of the questionnaires were developed in English. A few further
modifications were done during the supervisors’ orientation and enumerators’ training
workshops. Prior to that, the technical committee also had an opportunity to critic the
questionnaire and ensured that it covered all areas of need in Swaziland.
A separate screening instrument was applied during identification of individuals with
disabilities. All research instruments applied in the survey are found in the appendices of
this report.
a) The generic household questionnaire covered the following topics:
Demography and Disease burden
Education and Literacy
Economic activities of household members
Reproductive Health of Females aged 12 to 49 years
Household amenities and housing conditions
Household access to facilities
Household asset ownership including land
Household Income and its main source
Household food production
Household monthly Expenditure and rankings

PROJECT NO. 60G00530
REPORT NO. SINTEF A20047
VERSION 1
31
Death in the households
b) The detailed Disability Questionnaire covered the following topics:
Activity Limitations and Participation restrictions
Environmental factors
Health
Awareness, need and receipt of services
Education and employment / income
Assistive devices and technology
Accessibility in the home and surroundings
Inclusion in family and social life
Health and general well‐being
Knowledge of HIV/AIDS, Malaria, TB and Diabetes.
c) Control questionnaire for people without disabilities covered the following topics;
Activity limitation
Participation restriction
Environmental factors
Health
Education and employment / income
Accessibility in the home and surroundings
Inclusion in family and social life
Health and general well‐being
Knowledge of HIV/AIDS, Malaria, TB and Diabetes.
In each one of the 359 enumeration areas, the Living conditions questionnaire was
administered to the head of household of each of the selected 10 case households as
well as to each head in the selected 10 control households. The Detailed questionnaire
was administered to each of the disabled members found in the 10 case households. A
PROJECT NO. 60G00530
REPORT NO. SINTEF A20047
VERSION 1
32
proxy was interviewed if the individual with disability was not present or was unable to
answer.
Understanding the Activity Limitation and Participation Restriction Matrix
It is important to be able to differentiate between the two concepts or dimensions that
we have attempted to capture by using this ICF‐based matrix. While on the surface
Activity Limitations and Participation Restrictions may appear similar, they do in fact
measure two distinct aspects of the disability phenomenon. In considering activity
limitations we ask: “How difficult is it for you to perform this activity without any kind of
assistance at all?” The intention is to capture or measure an individual’s capacity to carry
out the 44 different activities of daily living listed in the matrix – it is a measure of the
person’s level of functioning. Participation restrictions, on the other hand, measure an
individual’s level of performance in their current or usual environment (i.e. where they
normally are: at home, at school or at work). To capture this aspect we ask: “Do you
experience any problem(s) in performing this activity in your current environment?” For
further discussion on the relationship between the two dimensions, see Eide et al. 2007.
We find that if disability is measured according to some predefined societal norm then
we neglect to take into account the individual’s own experiences (interacting with their
social and physical environment) with respect to their particular disability.
Measurements are in this study based on an individual’s experience and capability in
their environment.
The Research Teams
A total of 20 field personnel were recruited for execution of the study within the required
period. CSO recruited three supervisors and three enumerators who were all non‐
disabled. The remaining 14 members were recruited by FODSWA. All together 11 of the
14 field personnel were disabled. During the training, however, some members were

PROJECT NO. 60G00530
REPORT NO. SINTEF A20047
VERSION 1
33
dropped from the team. There were a total of 4 mobile field teams and each comprised
of 4 enumerators, 1 supervisor and 1 driver and assigned to each region. The field
supervisor’s role was to take a leading role in identifying the boundaries of selected
enumeration area, oversee the day‐to‐day data collection procedures while in the field,
problem solving while in the field and checking completed questionnaires. The
enumerators’ role was mainly the listing of households in the enumeration areas utilizing
the screening form and carrying out of interviews with respondents of the selected
households. A research coordinator was identified with the responsibility of overseeing
and managing all aspects of the data collection process to ensure that all logistics
necessary for the successful data collection exercise in the field were being adhered to
and solve problems which the field teams could not handle on their own. Three data
capturers were recruited by FODSWA and were responsible for data entry. The table
below shows the complete team members.
PROJECT NO. 60G00530
REPORT NO. SINTEF A20047
VERSION 1
34
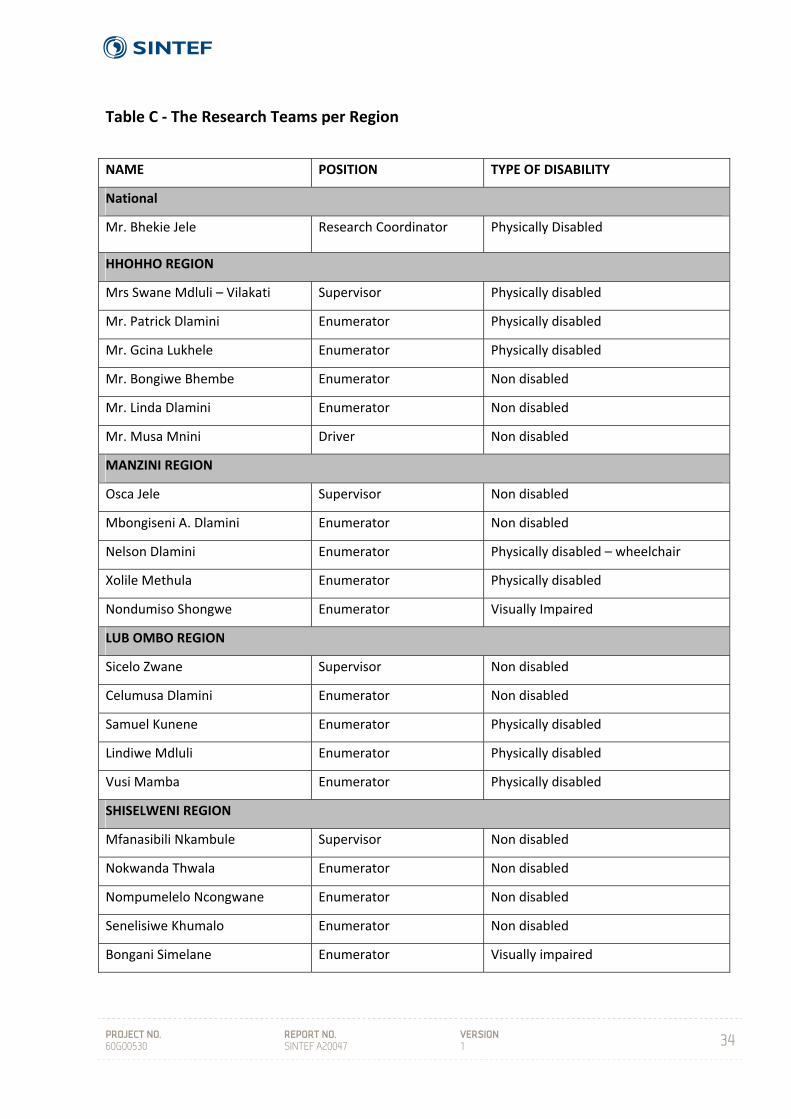
Table C ‐ The Research Teams per Region
NAME POSITION TYPE OF DISABILITY
National
Mr. Bhekie Jele Research Coordinator Physically Disabled
HHOHHO REGION
Mrs Swane Mdluli – Vilakati Supervisor Physically disabled
Mr. Patrick Dlamini Enumerator Physically disabled
Mr. Gcina Lukhele Enumerator Physically disabled
Mr. Bongiwe Bhembe Enumerator Non disabled
Mr. Linda Dlamini Enumerator Non disabled
Mr. Musa Mnini Driver Non disabled
MANZINI REGION
Osca Jele Supervisor Non disabled
Mbongiseni A. Dlamini Enumerator Non disabled
Nelson Dlamini Enumerator Physically disabled – wheelchair
Xolile Methula Enumerator Physically disabled
Nondumiso Shongwe Enumerator Visually Impaired
LUB OMBO REGION
Sicelo Zwane Supervisor Non disabled
Celumusa Dlamini Enumerator Non disabled
Samuel Kunene Enumerator Physically disabled
Lindiwe Mdluli Enumerator Physically disabled
Vusi Mamba Enumerator Physically disabled
SHISELWENI REGION
Mfanasibili Nkambule Supervisor Non disabled
Nokwanda Thwala Enumerator Non disabled
Nompumelelo Ncongwane Enumerator Non disabled
Senelisiwe Khumalo Enumerator Non disabled
Bongani Simelane Enumerator Visually impaired

PROJECT NO. 60G00530
REPORT NO. SINTEF A20047
VERSION 1
35
7 CONCEPTUAL UNDERSTANDING
A H Eide, Y Kamaleri
Disability and living conditions are core concepts to the study presented in this report.
Our own understanding of these concepts has progressed in unison with some
interesting developments in recent years. Both concepts are open to interpretation and
can be perceived in different ways. In addition, it is important to be aware that the
understanding and application of these concepts will vary from one socio‐cultural context
to another (Whyte & Ingstad, 1998). As the concepts are important for the design of the
study as well as for the analyses and understanding of results, some clarifications are
necessary.
7.1 Disability
During the 1970s there was a strong reaction among representatives of organisations of
persons with disabilities and professionals in the field of disability against the then
current terminology. The new concept of disability was more focused on the close
connection between the limitations experienced by individuals with disabilities, the
design and structure of their environments and the attitude of the general population.
Recent development has seen a shift in terminology and an increasing tendency towards
viewing the disability complex as a process (the disablement process), involving a number
of different elements on individual and societal levels. The recently adopted UN
Convention on Rights of People with Disabilities (CRPD) (UN 2006) defines disability as:
"Persons with disabilities include those who have long‐term physical,
mental, intellectual or sensory impairments which in interaction with
various barriers may hinder their full and effective participation in
society on an equal basis with others" (Article 1)
PROJECT NO. 60G00530
REPORT NO. SINTEF A20047
VERSION 1
36
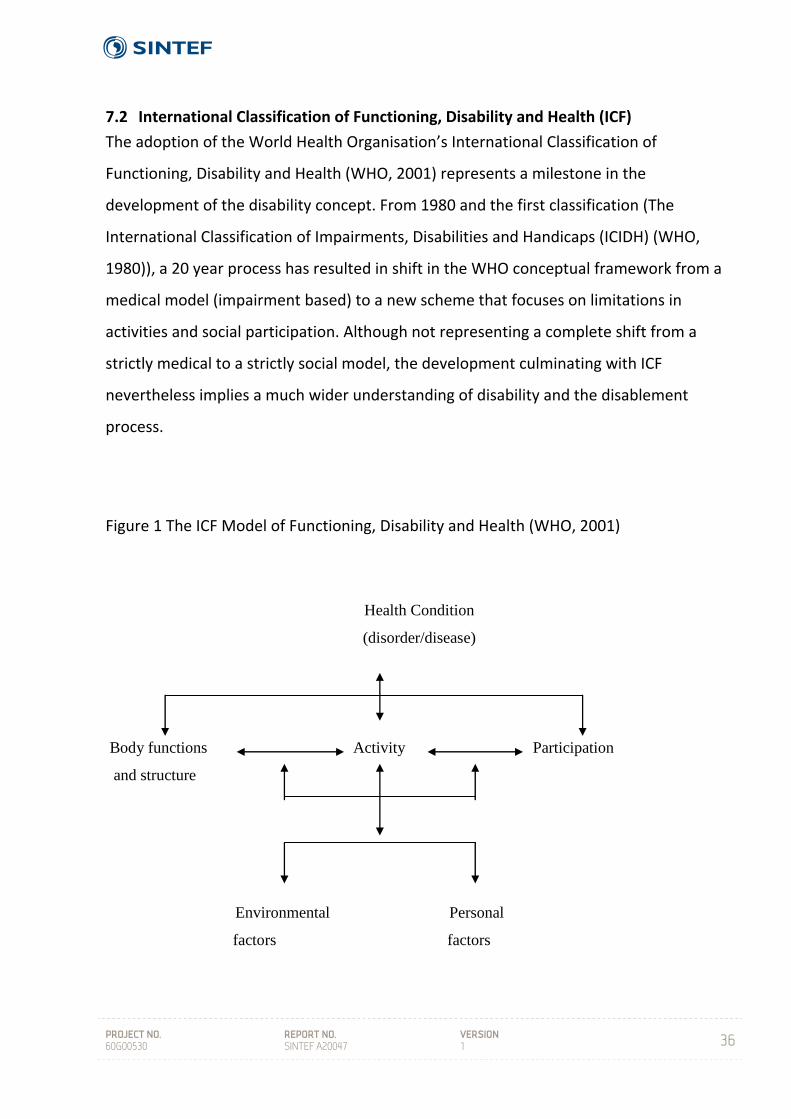
7.2 International Classification of Functioning, Disability and Health (ICF)
The adoption of the World Health Organisation’s International Classification of
Functioning, Disability and Health (WHO, 2001) represents a milestone in the
development of the disability concept. From 1980 and the first classification (The
International Classification of Impairments, Disabilities and Handicaps (ICIDH) (WHO,
1980)), a 20 year process has resulted in shift in the WHO conceptual framework from a
medical model (impairment based) to a new scheme that focuses on limitations in
activities and social participation. Although not representing a complete shift from a
strictly medical to a strictly social model, the development culminating with ICF
nevertheless implies a much wider understanding of disability and the disablement
process.
Figure 1 The ICF Model of Functioning, Disability and Health (WHO, 2001)
Health Condition
(disorder/disease)
Body functions Activity Participation
and structure
Environmental Personal
factors factors

PROJECT NO. 60G00530
REPORT NO. SINTEF A20047
VERSION 1
37
7.3 Application of ICF in the current study
The conceptual development from ICIDH to ICF is important here as this shift also has a
methodological parallel. The classification forms a basis for the collection of statistical
data on disability. The current study does not represent an application of ICF, and it has
not been the intention to test the new classification as such. Rather, the study is inspired
by the conceptual basis for ICF and has attempted to approach disability as activity
limitations and restrictions in social participation. This is pronounced in the screening
procedure and in the inclusion of a matrix on activity limitations and social participation
restrictions developed particularly for this study. The current study does, none the less,
provide a unique possibility for applying some core concepts from the ICF and testing
some aspects of the model statistically1.
An understanding of disability as defined by activity limitations and restrictions in
participation within a theoretical framework as described in Figure 1 underlies this study.
The term “disability” is, with this in mind, a problematic concept since it refers to, or is
associated with, an individualistic and impairment‐based understanding. As a term, it is
nevertheless applied throughout this text since it is regarded as a commonly accepted
concept, and its usage is practical in the absence of any new, easy to use terminology in
this sector.
7.4 Environmental factors
Environmental factors are important elements in the ICF model, and it is fundamental to
the present understanding of disability that activity limitations and restrictions in
participation are formulated in the exchange between an individual and his/her
environment. In the current study, environmental factors are included in an activity and
participation matrix (See appendix). It is however acknowledged that studies like the
current one traditionally focus on the individual and that this is also the case here.
1 Will be published separately

PROJECT NO. 60G00530
REPORT NO. SINTEF A20047
VERSION 1
38
7.5 Living conditions
The concepts of “level of living” or “living conditions” have developed from a relatively
narrow economic and material definition to a current concern with human capabilities
and how individuals utilise their capabilities (Heiberg & Øvensen, 1993). Although
economic and material indicators play an important role in the tradition of level of living
surveys in the industrialised countries, an individual’s level of living is currently defined
not so much by his or her economic possessions, but by the ability to exercise choice and
to affect the course of his or her own life. The level of living studies have been more and
more concerned with such questions and are currently attempting to examine the degree
to which people can participate in social, political and economic decision‐making and can
work creatively and productively to shape their own future (UNDP, 1997).
A number of core items can be regarded as vital to any level of living study:
Demographics, health, education, housing, work and income. Other indicators may
comprise use of time, social contact, sense of influence, sense of well‐being, perceptions
of social conflict, access to political resources, access to services, social participation,
privacy and protection, etc. The choice of which indicators to include will vary according
to the specific requirements of each study and the circumstances under which the
studies are undertaken.
7.6 Disability and living conditions
Research on living conditions is comparative by nature. Comparison between groups or
monitoring development over time within groups and populations are often the very
reasons for carrying out such studies. The purpose is thus often to identify population
groups with certain characteristics and to study whether there are systematic differences
in living conditions between groups – or to study changes in living conditions within
groups over time and to compare development over time between groups. Population
sub‐groups of interest in such studies are often defined by geography, gender, age – or
PROJECT NO. 60G00530
REPORT NO. SINTEF A20047
VERSION 1
39
the focus of the current research, i.e. people with disabilities vs. non‐disabled. Research
in high‐income countries has demonstrated that people with disabilities are worse off
along the whole spectre of indicators concerning living conditions, and that this gap has
also remained during times with steady improvement of conditions for all (Hem & Eide,
1998). This research‐based information has been very useful for advocacy purposes, for
education and attitude change in the population, as well as for planning and resource
allocation purposes.
These same patterns of systematic differences are also at work in low‐income countries,
as has been documented in our studies in other countries in the region (op. cit.).
When the stated purpose of the research is to study living conditions among people with
disabilities, it is essential, at the onset, to decide upon a working definition of disability in
order to identify who is disabled and who is not. This is a more complex issue than
choosing between a “medical model” on one side and a “social model” on the other. How
this is understood and carried out has major impact on the results of research, and
consequently on the application of results (refer to chapter 3.1 on the disability concept).
The ICF may to some extent be viewed as an attempt to combine a broad range of factors
that influence the “disability phenomena”.
The authors behind this research report support the idea that disability or the
disablement process is manifested in the exchange between the individual and his/her
environment. Disability is thus present if an individual is (severely) restricted in his/her
daily life activities due to a mismatch between functional abilities and demands of
society. The role of the physical and social environment in disabling individuals has been
very much in focus during the last 10 – 20 years with the adoption of the Standard Rules,
the World Programme of Action, ICF, and lately the UN Convention (CRPWD). It is logical
PROJECT NO. 60G00530
REPORT NO. SINTEF A20047
VERSION 1
40
that this development is followed by research on the mechanisms that produce disability
in the meeting between the individual and his/her environment.
It is true that studies of living conditions among people with disabilities in high‐income
countries have been criticised for not evolving from an individualistic perspective. Data
are collected about individuals and functional limitations are still in focus. It is a dilemma
that this research tradition has not yet been able to reflect the relational and relative
view on disability that most researchers in this field would support today. While we agree
to such viewpoints, we nevertheless argue that a “traditional” study is needed in low‐
income countries to allow for a description of the situation as well as comparing between
groups and over time. In high‐income countries such studies have shown themselves to
be powerful tools in the continuous struggle for the improvement of living conditions
among people with disabilities. In spite of an individualistic bias in the design of these
studies, the results can still be applied in a critical perspective on contextual and
relational aspects that represents important mechanisms in the disablement process.
7.7 Combining two traditions and ICF
The design that has been developed and tested here aims at combining two research
traditions: studies on living conditions and disability studies2. Pre‐existing and validated
questionnaires that had been used in Namibia (on general living conditions – NPC, 2000)
and in South Africa (on disability – Schneider et. al., 1999) were combined and adapted
for use in the surveys. A third element, on activities and participation, was included to
incorporate the conceptual developments that have taken place in connection with
development of ICF. By combining the two traditions, a broader set of variables that can
describe the situation for people with disabilities are included as compared to the
traditional disability statistics. Secondly, a possibility is established for comparing the
conditions of disabled people (and households with disabled people) with non‐disabled
(and households without any disabled members). It is argued that such comparative
2 By “disability studies” we understand a broad specter of different studies that have generated knowledge about the situation of people with disabilities.
PROJECT NO. 60G00530
REPORT NO. SINTEF A20047
VERSION 1
41
information is much more potent in the struggle for improvement of the situation for
disabled people, reflecting the developmental target for the current study.

PROJECT NO. 60G00530
REPORT NO. SINTEF A20047
VERSION 1
42
8 RESULTS
The results are presented in two sections: i) Households with and without (controls)
disabled members, and ii) Individuals with disabilities and the control sample of matched
individuals.
Particular care has been taken during analyses to control for both gender and regional
differences. Whenever these potential confounders have revealed significant differences
these are commented in the text, otherwise not.
8.1 Household section
Table 1. Number of households and individuals in the study
Individuals with disabilities in Table 1 qualify as disabled with at least two “some” on the
screening question (see below). A total of 876 individuals with disability are included in
the sample. A small number of missing explains some variation in the number of
individuals and households in the analyses below.
______________________________________________________________________________
Number of
_________________________________________________
Source Households Individuals Persons with disabilities
Households having 812 4780 876
a person with disability
______________________________________________________________________________
Households without a 823 3954
person with disability (controls)
______________________________________________________________________________
Total 1635 8734
______________________________________________________________________________

PROJECT NO. 60G00530
REPORT NO. SINTEF A20047
VERSION 1
43
Table 2. Total number of individuals in the households, by gender
‐‐‐‐‐‐‐‐‐‐‐‐‐‐‐‐‐‐‐‐‐‐‐‐‐‐‐‐‐‐‐‐‐‐‐‐‐‐‐‐‐‐‐‐‐‐‐‐‐‐‐‐‐‐‐‐‐‐‐‐‐‐‐‐‐‐‐‐‐‐‐‐‐‐‐‐‐‐‐‐‐‐‐‐‐‐‐‐‐‐‐‐‐‐‐‐‐‐‐‐‐‐‐‐‐‐‐‐‐‐‐‐‐‐‐‐‐‐
Female Male Total
n % n % n %
‐‐‐‐‐‐‐‐‐‐‐‐‐‐‐‐‐‐‐‐‐‐‐‐‐‐‐‐‐‐‐‐‐‐‐‐‐‐‐‐‐‐‐‐‐‐‐‐‐‐‐‐‐‐‐‐‐‐‐‐‐‐‐‐‐‐‐‐‐‐‐‐‐‐‐‐‐‐‐‐‐‐‐‐‐‐‐‐‐‐‐‐‐‐‐‐‐‐‐‐‐‐‐‐‐‐‐‐‐‐‐‐‐‐‐‐‐‐
Disabled HHs 2484 52.0 2291 48.0 4775 100.0
Control HHs 2064 52.4 1875 47.6 3939 100.0
‐‐‐‐‐‐‐‐‐‐‐‐‐‐‐‐‐‐‐‐‐‐‐‐‐‐‐‐‐‐‐‐‐‐‐‐‐‐‐‐‐‐‐‐‐‐‐‐‐‐‐‐‐‐‐‐‐‐‐‐‐‐‐‐‐‐‐‐‐‐‐‐‐‐‐‐‐‐‐‐‐‐‐‐‐‐‐‐‐‐‐‐‐‐‐‐‐‐‐‐‐‐‐‐‐‐‐‐‐‐‐‐‐‐‐‐‐‐
Total 4548 52.2 4166 47.8 8714 100.0
‐‐‐‐‐‐‐‐‐‐‐‐‐‐‐‐‐‐‐‐‐‐‐‐‐‐‐‐‐‐‐‐‐‐‐‐‐‐‐‐‐‐‐‐‐‐‐‐‐‐‐‐‐‐‐‐‐‐‐‐‐‐‐‐‐‐‐‐‐‐‐‐‐‐‐‐‐‐‐‐‐‐‐‐‐‐‐‐‐‐‐‐‐‐‐‐‐‐‐‐‐‐‐‐‐‐‐‐‐‐‐‐‐‐‐‐‐‐
There were 4548 females and 4166 males included in the households. Gender difference
in the table is not statistically significant. Of the individuals with disabilities,
Table 3. Total number of disabled in the households, by gender
‐‐‐‐‐‐‐‐‐‐‐‐‐‐‐‐‐‐‐‐‐‐‐‐‐‐‐‐‐‐‐‐‐‐‐‐‐‐‐‐‐‐‐‐‐‐‐‐‐‐‐‐‐‐‐‐‐‐‐‐‐‐‐‐‐‐‐‐‐‐‐‐‐‐‐‐‐‐‐‐‐‐‐‐‐‐‐‐‐‐‐‐‐‐‐‐‐‐‐‐‐‐‐‐‐‐‐‐‐‐‐‐‐‐‐‐‐‐
Female Male Total
N % n % n %
‐‐‐‐‐‐‐‐‐‐‐‐‐‐‐‐‐‐‐‐‐‐‐‐‐‐‐‐‐‐‐‐‐‐‐‐‐‐‐‐‐‐‐‐‐‐‐‐‐‐‐‐‐‐‐‐‐‐‐‐‐‐‐‐‐‐‐‐‐‐‐‐‐‐‐‐‐‐‐‐‐‐‐‐‐‐‐‐‐‐‐‐‐‐‐‐‐‐‐‐‐‐‐‐‐‐‐‐‐‐‐‐‐‐‐‐‐‐
Disabled 405 46.2 471 53.8 876 100.0
Non‐disabled 4117 52.9 3668 47.1 7785 100.0
‐‐‐‐‐‐‐‐‐‐‐‐‐‐‐‐‐‐‐‐‐‐‐‐‐‐‐‐‐‐‐‐‐‐‐‐‐‐‐‐‐‐‐‐‐‐‐‐‐‐‐‐‐‐‐‐‐‐‐‐‐‐‐‐‐‐‐‐‐‐‐‐‐‐‐‐‐‐‐‐‐‐‐‐‐‐‐‐‐‐‐‐‐‐‐‐‐‐‐‐‐‐‐‐‐‐‐‐‐‐‐‐‐‐‐‐‐‐
Total 4522 100.0 4139 100.0 8661 100.0
‐‐‐‐‐‐‐‐‐‐‐‐‐‐‐‐‐‐‐‐‐‐‐‐‐‐‐‐‐‐‐‐‐‐‐‐‐‐‐‐‐‐‐‐‐‐‐‐‐‐‐‐‐‐‐‐‐‐‐‐‐‐‐‐‐‐‐‐‐‐‐‐‐‐‐‐‐‐‐‐‐‐‐‐‐‐‐‐‐‐‐‐‐‐‐‐‐‐‐‐‐‐‐‐‐‐‐‐‐‐‐‐‐‐‐‐‐‐
The proportion of males and females with disability is this study differed between HHs
with disabled members and Control HHs, 46.2% and 53.8 % females respectively (χ2 =
13.96, df = 1, p < .001).
PROJECT NO. 60G00530
REPORT NO. SINTEF A20047
VERSION 1
44
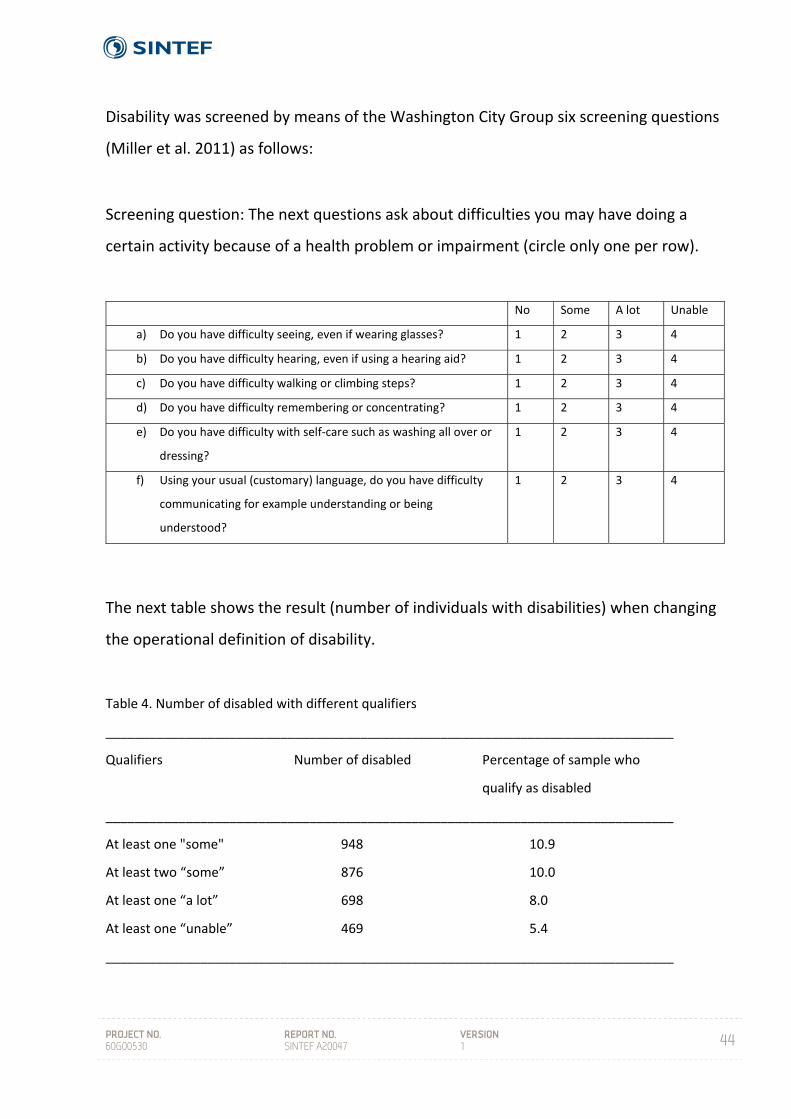
Disability was screened by means of the Washington City Group six screening questions
(Miller et al. 2011) as follows:
Screening question: The next questions ask about difficulties you may have doing a
certain activity because of a health problem or impairment (circle only one per row).
The next table shows the result (number of individuals with disabilities) when changing
the operational definition of disability.
Table 4. Number of disabled with different qualifiers
______________________________________________________________________________
Qualifiers Number of disabled Percentage of sample who
qualify as disabled
______________________________________________________________________________
At least one "some" 948 10.9
At least two “some” 876 10.0
At least one “a lot” 698 8.0
At least one “unable” 469 5.4
______________________________________________________________________________
No Some A lot Unable
a) Do you have difficulty seeing, even if wearing glasses? 1 2 3 4
b) Do you have difficulty hearing, even if using a hearing aid? 1 2 3 4
c) Do you have difficulty walking or climbing steps? 1 2 3 4
d) Do you have difficulty remembering or concentrating? 1 2 3 4
e) Do you have difficulty with self‐care such as washing all over or
dressing?
1 2 3 4
f) Using your usual (customary) language, do you have difficulty
communicating for example understanding or being
understood?
1 2 3 4
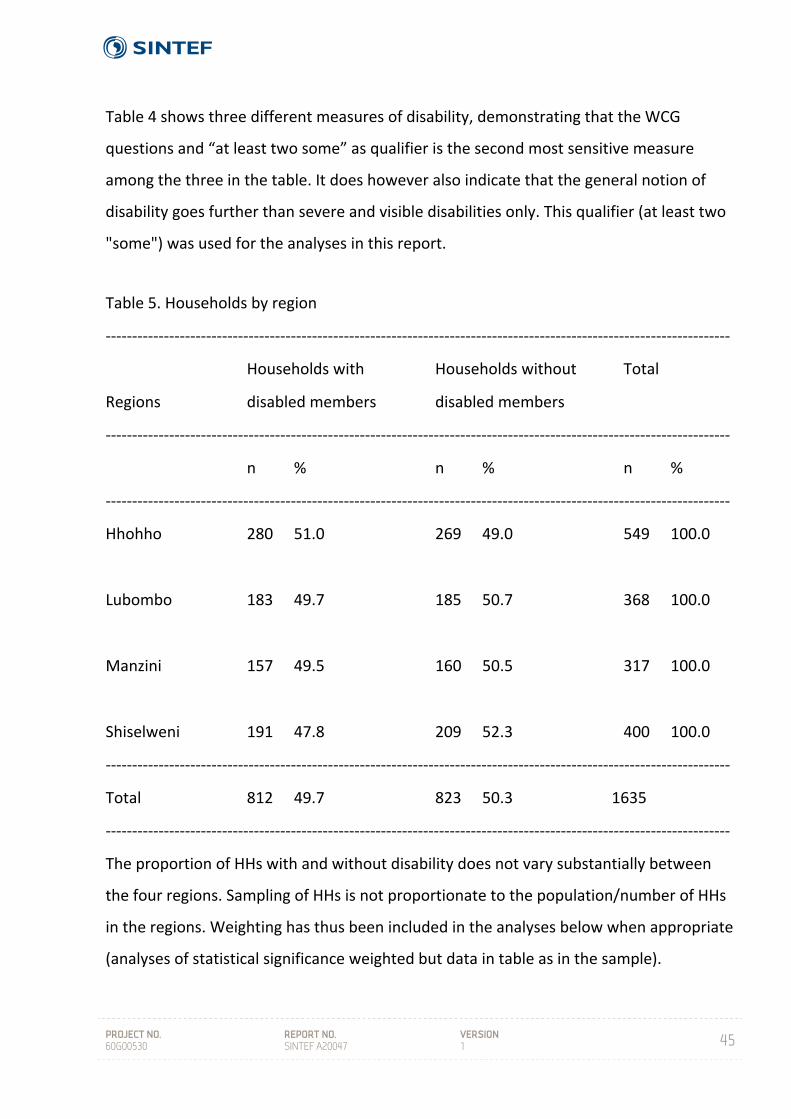
PROJECT NO. 60G00530
REPORT NO. SINTEF A20047
VERSION 1
45
Table 4 shows three different measures of disability, demonstrating that the WCG
questions and “at least two some” as qualifier is the second most sensitive measure
among the three in the table. It does however also indicate that the general notion of
disability goes further than severe and visible disabilities only. This qualifier (at least two
"some") was used for the analyses in this report.
Table 5. Households by region
‐‐‐‐‐‐‐‐‐‐‐‐‐‐‐‐‐‐‐‐‐‐‐‐‐‐‐‐‐‐‐‐‐‐‐‐‐‐‐‐‐‐‐‐‐‐‐‐‐‐‐‐‐‐‐‐‐‐‐‐‐‐‐‐‐‐‐‐‐‐‐‐‐‐‐‐‐‐‐‐‐‐‐‐‐‐‐‐‐‐‐‐‐‐‐‐‐‐‐‐‐‐‐‐‐‐‐‐‐‐‐‐‐‐‐‐‐‐
Households with Households without Total
Regions disabled members disabled members
‐‐‐‐‐‐‐‐‐‐‐‐‐‐‐‐‐‐‐‐‐‐‐‐‐‐‐‐‐‐‐‐‐‐‐‐‐‐‐‐‐‐‐‐‐‐‐‐‐‐‐‐‐‐‐‐‐‐‐‐‐‐‐‐‐‐‐‐‐‐‐‐‐‐‐‐‐‐‐‐‐‐‐‐‐‐‐‐‐‐‐‐‐‐‐‐‐‐‐‐‐‐‐‐‐‐‐‐‐‐‐‐‐‐‐‐‐‐
n % n % n %
‐‐‐‐‐‐‐‐‐‐‐‐‐‐‐‐‐‐‐‐‐‐‐‐‐‐‐‐‐‐‐‐‐‐‐‐‐‐‐‐‐‐‐‐‐‐‐‐‐‐‐‐‐‐‐‐‐‐‐‐‐‐‐‐‐‐‐‐‐‐‐‐‐‐‐‐‐‐‐‐‐‐‐‐‐‐‐‐‐‐‐‐‐‐‐‐‐‐‐‐‐‐‐‐‐‐‐‐‐‐‐‐‐‐‐‐‐‐
Hhohho 280 51.0 269 49.0 549 100.0
Lubombo 183 49.7 185 50.7 368 100.0
Manzini 157 49.5 160 50.5 317 100.0
Shiselweni 191 47.8 209 52.3 400 100.0
‐‐‐‐‐‐‐‐‐‐‐‐‐‐‐‐‐‐‐‐‐‐‐‐‐‐‐‐‐‐‐‐‐‐‐‐‐‐‐‐‐‐‐‐‐‐‐‐‐‐‐‐‐‐‐‐‐‐‐‐‐‐‐‐‐‐‐‐‐‐‐‐‐‐‐‐‐‐‐‐‐‐‐‐‐‐‐‐‐‐‐‐‐‐‐‐‐‐‐‐‐‐‐‐‐‐‐‐‐‐‐‐‐‐‐‐‐‐
Total 812 49.7 823 50.3 1635
‐‐‐‐‐‐‐‐‐‐‐‐‐‐‐‐‐‐‐‐‐‐‐‐‐‐‐‐‐‐‐‐‐‐‐‐‐‐‐‐‐‐‐‐‐‐‐‐‐‐‐‐‐‐‐‐‐‐‐‐‐‐‐‐‐‐‐‐‐‐‐‐‐‐‐‐‐‐‐‐‐‐‐‐‐‐‐‐‐‐‐‐‐‐‐‐‐‐‐‐‐‐‐‐‐‐‐‐‐‐‐‐‐‐‐‐‐‐
The proportion of HHs with and without disability does not vary substantially between
the four regions. Sampling of HHs is not proportionate to the population/number of HHs
in the regions. Weighting has thus been included in the analyses below when appropriate
(analyses of statistical significance weighted but data in table as in the sample).
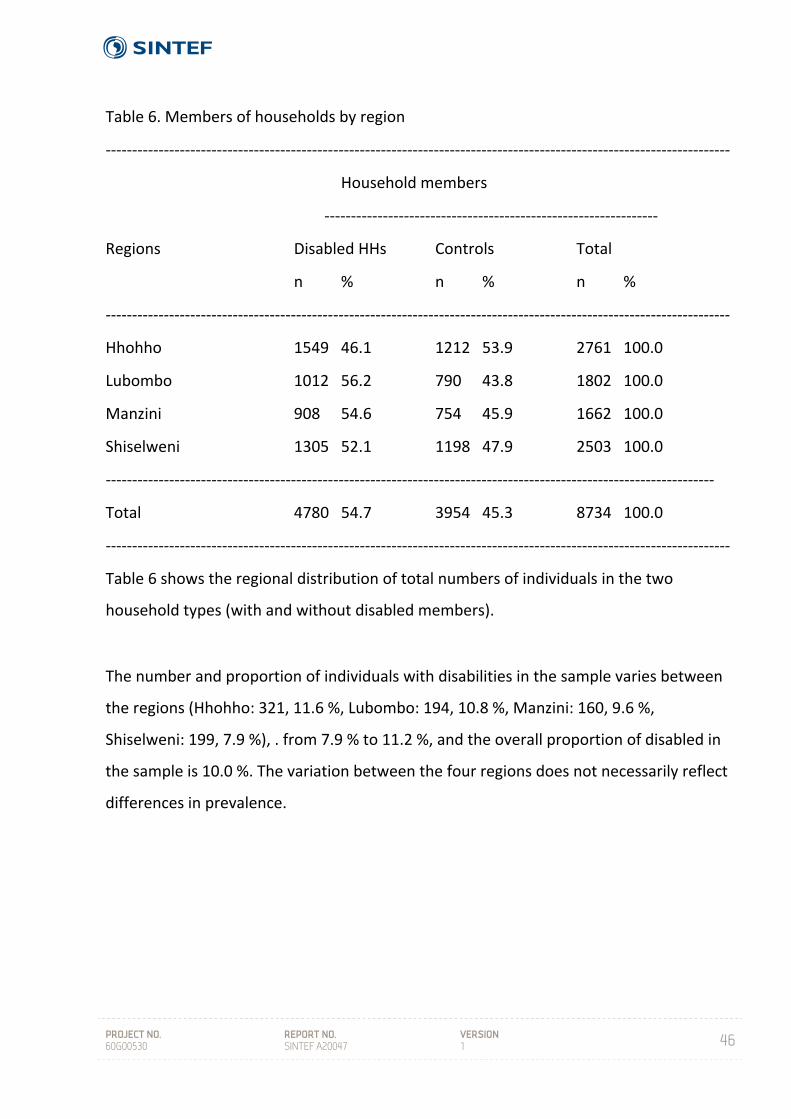
PROJECT NO. 60G00530
REPORT NO. SINTEF A20047
VERSION 1
46
Table 6. Members of households by region
‐‐‐‐‐‐‐‐‐‐‐‐‐‐‐‐‐‐‐‐‐‐‐‐‐‐‐‐‐‐‐‐‐‐‐‐‐‐‐‐‐‐‐‐‐‐‐‐‐‐‐‐‐‐‐‐‐‐‐‐‐‐‐‐‐‐‐‐‐‐‐‐‐‐‐‐‐‐‐‐‐‐‐‐‐‐‐‐‐‐‐‐‐‐‐‐‐‐‐‐‐‐‐‐‐‐‐‐‐‐‐‐‐‐‐‐‐‐
Household members
‐‐‐‐‐‐‐‐‐‐‐‐‐‐‐‐‐‐‐‐‐‐‐‐‐‐‐‐‐‐‐‐‐‐‐‐‐‐‐‐‐‐‐‐‐‐‐‐‐‐‐‐‐‐‐‐‐‐‐‐‐‐‐
Regions Disabled HHs Controls Total
n % n % n %
‐‐‐‐‐‐‐‐‐‐‐‐‐‐‐‐‐‐‐‐‐‐‐‐‐‐‐‐‐‐‐‐‐‐‐‐‐‐‐‐‐‐‐‐‐‐‐‐‐‐‐‐‐‐‐‐‐‐‐‐‐‐‐‐‐‐‐‐‐‐‐‐‐‐‐‐‐‐‐‐‐‐‐‐‐‐‐‐‐‐‐‐‐‐‐‐‐‐‐‐‐‐‐‐‐‐‐‐‐‐‐‐‐‐‐‐‐‐
Hhohho 1549 46.1 1212 53.9 2761 100.0
Lubombo 1012 56.2 790 43.8 1802 100.0
Manzini 908 54.6 754 45.9 1662 100.0
Shiselweni 1305 52.1 1198 47.9 2503 100.0
‐‐‐‐‐‐‐‐‐‐‐‐‐‐‐‐‐‐‐‐‐‐‐‐‐‐‐‐‐‐‐‐‐‐‐‐‐‐‐‐‐‐‐‐‐‐‐‐‐‐‐‐‐‐‐‐‐‐‐‐‐‐‐‐‐‐‐‐‐‐‐‐‐‐‐‐‐‐‐‐‐‐‐‐‐‐‐‐‐‐‐‐‐‐‐‐‐‐‐‐‐‐‐‐‐‐‐‐‐‐‐‐‐‐‐
Total 4780 54.7 3954 45.3 8734 100.0
‐‐‐‐‐‐‐‐‐‐‐‐‐‐‐‐‐‐‐‐‐‐‐‐‐‐‐‐‐‐‐‐‐‐‐‐‐‐‐‐‐‐‐‐‐‐‐‐‐‐‐‐‐‐‐‐‐‐‐‐‐‐‐‐‐‐‐‐‐‐‐‐‐‐‐‐‐‐‐‐‐‐‐‐‐‐‐‐‐‐‐‐‐‐‐‐‐‐‐‐‐‐‐‐‐‐‐‐‐‐‐‐‐‐‐‐‐‐
Table 6 shows the regional distribution of total numbers of individuals in the two
household types (with and without disabled members).
The number and proportion of individuals with disabilities in the sample varies between
the regions (Hhohho: 321, 11.6 %, Lubombo: 194, 10.8 %, Manzini: 160, 9.6 %,
Shiselweni: 199, 7.9 %), . from 7.9 % to 11.2 %, and the overall proportion of disabled in
the sample is 10.0 %. The variation between the four regions does not necessarily reflect
differences in prevalence.
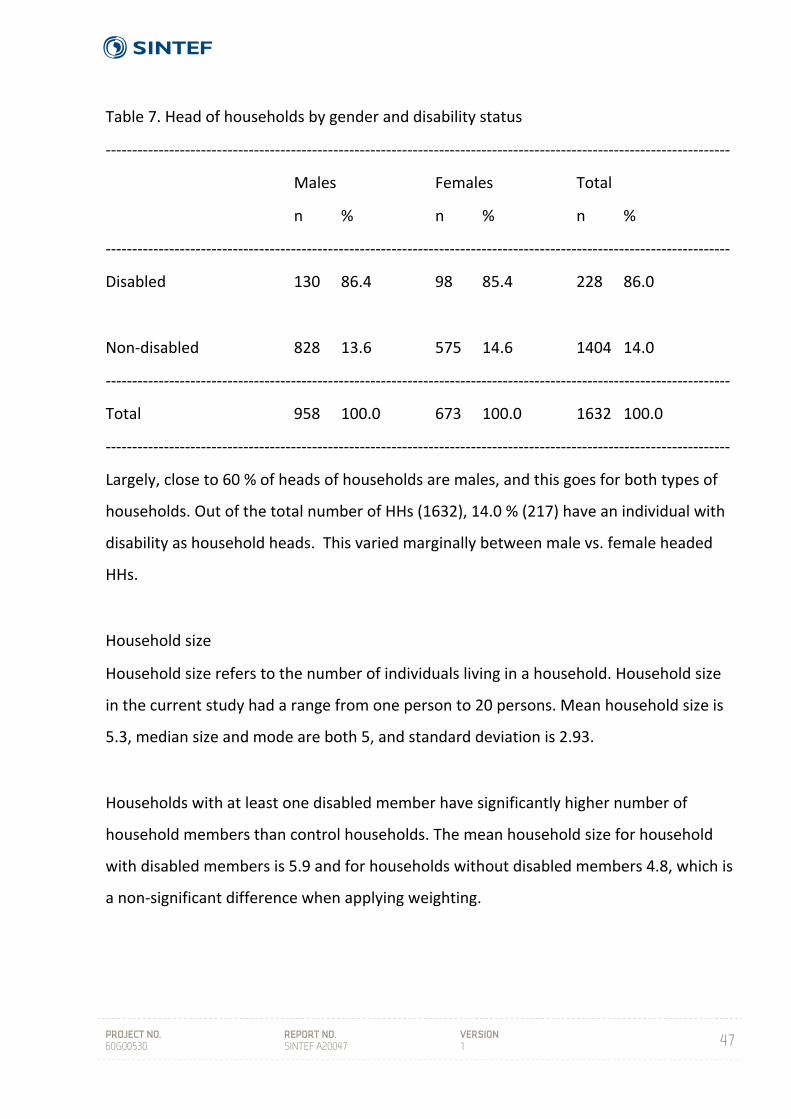
PROJECT NO. 60G00530
REPORT NO. SINTEF A20047
VERSION 1
47
Table 7. Head of households by gender and disability status
‐‐‐‐‐‐‐‐‐‐‐‐‐‐‐‐‐‐‐‐‐‐‐‐‐‐‐‐‐‐‐‐‐‐‐‐‐‐‐‐‐‐‐‐‐‐‐‐‐‐‐‐‐‐‐‐‐‐‐‐‐‐‐‐‐‐‐‐‐‐‐‐‐‐‐‐‐‐‐‐‐‐‐‐‐‐‐‐‐‐‐‐‐‐‐‐‐‐‐‐‐‐‐‐‐‐‐‐‐‐‐‐‐‐‐‐‐‐
Males Females Total
n % n % n %
‐‐‐‐‐‐‐‐‐‐‐‐‐‐‐‐‐‐‐‐‐‐‐‐‐‐‐‐‐‐‐‐‐‐‐‐‐‐‐‐‐‐‐‐‐‐‐‐‐‐‐‐‐‐‐‐‐‐‐‐‐‐‐‐‐‐‐‐‐‐‐‐‐‐‐‐‐‐‐‐‐‐‐‐‐‐‐‐‐‐‐‐‐‐‐‐‐‐‐‐‐‐‐‐‐‐‐‐‐‐‐‐‐‐‐‐‐‐
Disabled 130 86.4 98 85.4 228 86.0
Non‐disabled 828 13.6 575 14.6 1404 14.0
‐‐‐‐‐‐‐‐‐‐‐‐‐‐‐‐‐‐‐‐‐‐‐‐‐‐‐‐‐‐‐‐‐‐‐‐‐‐‐‐‐‐‐‐‐‐‐‐‐‐‐‐‐‐‐‐‐‐‐‐‐‐‐‐‐‐‐‐‐‐‐‐‐‐‐‐‐‐‐‐‐‐‐‐‐‐‐‐‐‐‐‐‐‐‐‐‐‐‐‐‐‐‐‐‐‐‐‐‐‐‐‐‐‐‐‐‐‐
Total 958 100.0 673 100.0 1632 100.0
‐‐‐‐‐‐‐‐‐‐‐‐‐‐‐‐‐‐‐‐‐‐‐‐‐‐‐‐‐‐‐‐‐‐‐‐‐‐‐‐‐‐‐‐‐‐‐‐‐‐‐‐‐‐‐‐‐‐‐‐‐‐‐‐‐‐‐‐‐‐‐‐‐‐‐‐‐‐‐‐‐‐‐‐‐‐‐‐‐‐‐‐‐‐‐‐‐‐‐‐‐‐‐‐‐‐‐‐‐‐‐‐‐‐‐‐‐‐
Largely, close to 60 % of heads of households are males, and this goes for both types of
households. Out of the total number of HHs (1632), 14.0 % (217) have an individual with
disability as household heads. This varied marginally between male vs. female headed
HHs.
Household size
Household size refers to the number of individuals living in a household. Household size
in the current study had a range from one person to 20 persons. Mean household size is
5.3, median size and mode are both 5, and standard deviation is 2.93.
Households with at least one disabled member have significantly higher number of
household members than control households. The mean household size for household
with disabled members is 5.9 and for households without disabled members 4.8, which is
a non‐significant difference when applying weighting.
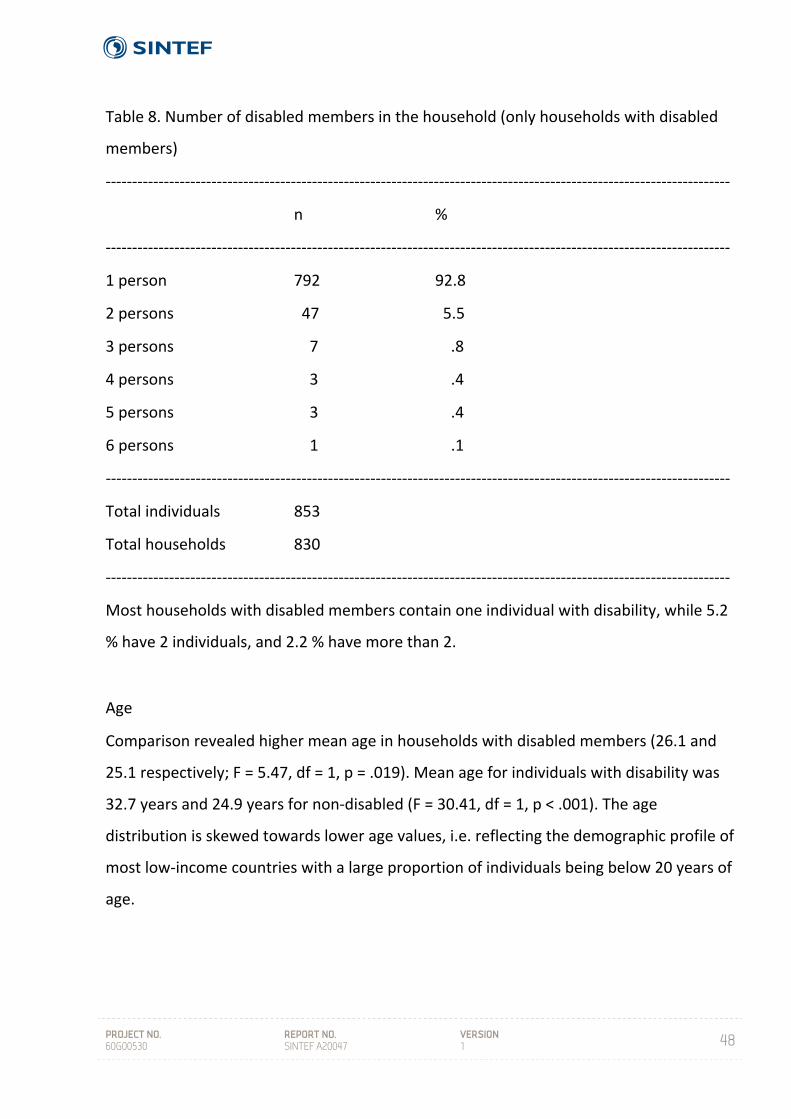
PROJECT NO. 60G00530
REPORT NO. SINTEF A20047
VERSION 1
48
Table 8. Number of disabled members in the household (only households with disabled
members)
‐‐‐‐‐‐‐‐‐‐‐‐‐‐‐‐‐‐‐‐‐‐‐‐‐‐‐‐‐‐‐‐‐‐‐‐‐‐‐‐‐‐‐‐‐‐‐‐‐‐‐‐‐‐‐‐‐‐‐‐‐‐‐‐‐‐‐‐‐‐‐‐‐‐‐‐‐‐‐‐‐‐‐‐‐‐‐‐‐‐‐‐‐‐‐‐‐‐‐‐‐‐‐‐‐‐‐‐‐‐‐‐‐‐‐‐‐‐
n %
‐‐‐‐‐‐‐‐‐‐‐‐‐‐‐‐‐‐‐‐‐‐‐‐‐‐‐‐‐‐‐‐‐‐‐‐‐‐‐‐‐‐‐‐‐‐‐‐‐‐‐‐‐‐‐‐‐‐‐‐‐‐‐‐‐‐‐‐‐‐‐‐‐‐‐‐‐‐‐‐‐‐‐‐‐‐‐‐‐‐‐‐‐‐‐‐‐‐‐‐‐‐‐‐‐‐‐‐‐‐‐‐‐‐‐‐‐‐
1 person 792 92.8
2 persons 47 5.5
3 persons 7 .8
4 persons 3 .4
5 persons 3 .4
6 persons 1 .1
‐‐‐‐‐‐‐‐‐‐‐‐‐‐‐‐‐‐‐‐‐‐‐‐‐‐‐‐‐‐‐‐‐‐‐‐‐‐‐‐‐‐‐‐‐‐‐‐‐‐‐‐‐‐‐‐‐‐‐‐‐‐‐‐‐‐‐‐‐‐‐‐‐‐‐‐‐‐‐‐‐‐‐‐‐‐‐‐‐‐‐‐‐‐‐‐‐‐‐‐‐‐‐‐‐‐‐‐‐‐‐‐‐‐‐‐‐‐
Total individuals 853
Total households 830
‐‐‐‐‐‐‐‐‐‐‐‐‐‐‐‐‐‐‐‐‐‐‐‐‐‐‐‐‐‐‐‐‐‐‐‐‐‐‐‐‐‐‐‐‐‐‐‐‐‐‐‐‐‐‐‐‐‐‐‐‐‐‐‐‐‐‐‐‐‐‐‐‐‐‐‐‐‐‐‐‐‐‐‐‐‐‐‐‐‐‐‐‐‐‐‐‐‐‐‐‐‐‐‐‐‐‐‐‐‐‐‐‐‐‐‐‐‐
Most households with disabled members contain one individual with disability, while 5.2
% have 2 individuals, and 2.2 % have more than 2.
Age
Comparison revealed higher mean age in households with disabled members (26.1 and
25.1 respectively; F = 5.47, df = 1, p = .019). Mean age for individuals with disability was
32.7 years and 24.9 years for non‐disabled (F = 30.41, df = 1, p < .001). The age
distribution is skewed towards lower age values, i.e. reflecting the demographic profile of
most low‐income countries with a large proportion of individuals being below 20 years of
age.

PROJECT NO. 60G00530
REPORT NO. SINTEF A20047
VERSION 1
49
Dependency ratio
Dependency ratio is a measure of the structure of the household. This is a measure of the
proportion of a population which is composed of dependents (people who are too young
or too old to work). The current definition of dependents is individuals who are below 15
years or over 65 years, while working age is between 15 and 65. The dependency ratio is
equal to the number of dependants divided by the number of individuals in working age.
Analyses revealed that disabled households have somewhat higher dependency ratio
than control households; 0.72 and 0.67 respectively. This implies that households with
disabled members tend to have more dependent individuals compared to the control
households.
Gender
Small and non‐significant differences were found in the proportion of female members in
disabled and control households. In the households with disabled members 52.0 %
(2484) were females, while control households had 52.4 % (2064).
Socio‐economic status
Socio‐economic status (SES) was measured by recording possessions of 26 different items
in the household.

PROJECT NO. 60G00530
REPORT NO. SINTEF A20047
VERSION 1
50
Table 9. Distribution of household items by household type
For 18 out of the 26 items, the difference between disabled HHs and control HHs is
significant and all differences implying higher proportion of ownership among control
households. Scale analyses of all items in Table 10 yielded Alpha = .86, which is a good
----------------------------------------------------------------------------------------------------------------------
Household item Disabled HHs Control HHs Total
n % n % n %
----------------------------------------------------------------------------------------------------------------------
a. Radio1 590 73.4 693 85.2 1283 79.3
b. Hi-fi/music stereo2 175 21.8 234 28.8 409 25.3
c. Television1 298 37.1 380 46.7 678 41.9
d. DVD/VHS player1 231 28.7 319 39.2 550 34.0
e. Cell phone2 639 79.5 685 84.3 1324 81.9
f. Telephone in the house4 87 10.8 92 11.3 179 11.1
g. Iron2 576 71.6 635 78.1 1211 74.9
h. Fan2 112 13.9 152 18.7 264 16.3
i. Heater3 64 8.0 90 11.1 154 9.5
j. Air conditioner2 12 1.5 28 3.4 40 2.5
k. Stove with gas/electric3 273 34.0 315 38.7 588 36.4
l. Stove with paraffin4 155 19.3 164 20.2 319 19.7
m. Table and chairs4 470 58.5 511 62.9 981 60.7
n. Refrigerator2 279 34.7 348 42.8 627 38.8
o. Microwave1 82 10.2 142 17.5 224 13.9
p. Electricity3 291 36.2 336 41.3 627 38.8
q. Solar energy system4 78 9.7 87 10.7 165 10.2
r. Electrical generator4 12 1.5 20 2.5 32 2.0
s. Personal computer2 29 3.6 51 6.3 80 4.9
t. Bicycle2 56 7.0 94 11.6 150 9.3
u. Motorcycle4 12 1.5 12 1.5 24 1.5
v. Private car2 132 16.4 174 21.4 306 18.9
w. Bed(s)1 722 89.8 768 94.5 1490 92.1
x. Livestock4 270 33.6 275 33.9 545 33.7
y. Washing machine4 21 2.6 26 3.2 47 2.9
z. Satellite dish1 79 9.8 131 16.2 210 13.0
----------------------------------------------------------------------------------------------------------------------------------------------
1 p < .001, 2 p < .01, 3 p < .05, 4 n.s.
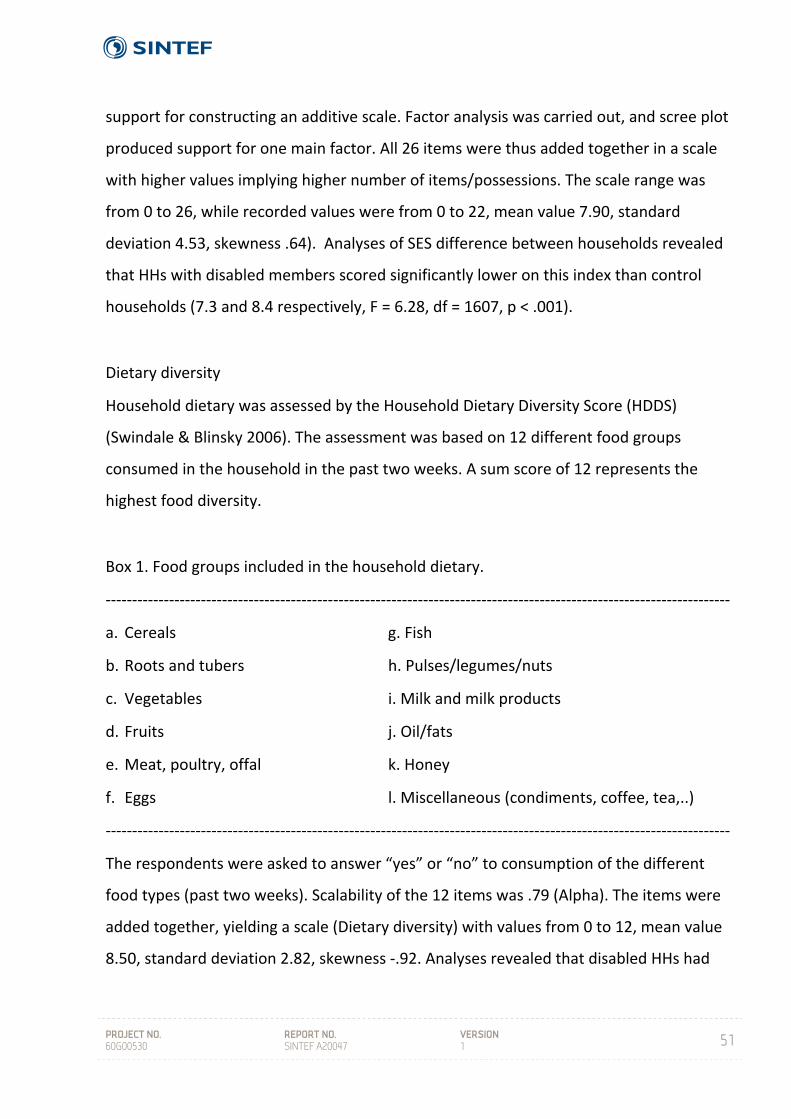
PROJECT NO. 60G00530
REPORT NO. SINTEF A20047
VERSION 1
51
support for constructing an additive scale. Factor analysis was carried out, and scree plot
produced support for one main factor. All 26 items were thus added together in a scale
with higher values implying higher number of items/possessions. The scale range was
from 0 to 26, while recorded values were from 0 to 22, mean value 7.90, standard
deviation 4.53, skewness .64). Analyses of SES difference between households revealed
that HHs with disabled members scored significantly lower on this index than control
households (7.3 and 8.4 respectively, F = 6.28, df = 1607, p < .001).
Dietary diversity
Household dietary was assessed by the Household Dietary Diversity Score (HDDS)
(Swindale & Blinsky 2006). The assessment was based on 12 different food groups
consumed in the household in the past two weeks. A sum score of 12 represents the
highest food diversity.
Box 1. Food groups included in the household dietary.
‐‐‐‐‐‐‐‐‐‐‐‐‐‐‐‐‐‐‐‐‐‐‐‐‐‐‐‐‐‐‐‐‐‐‐‐‐‐‐‐‐‐‐‐‐‐‐‐‐‐‐‐‐‐‐‐‐‐‐‐‐‐‐‐‐‐‐‐‐‐‐‐‐‐‐‐‐‐‐‐‐‐‐‐‐‐‐‐‐‐‐‐‐‐‐‐‐‐‐‐‐‐‐‐‐‐‐‐‐‐‐‐‐‐‐‐‐‐
a. Cereals g. Fish
b. Roots and tubers h. Pulses/legumes/nuts
c. Vegetables i. Milk and milk products
d. Fruits j. Oil/fats
e. Meat, poultry, offal k. Honey
f. Eggs l. Miscellaneous (condiments, coffee, tea,..)
‐‐‐‐‐‐‐‐‐‐‐‐‐‐‐‐‐‐‐‐‐‐‐‐‐‐‐‐‐‐‐‐‐‐‐‐‐‐‐‐‐‐‐‐‐‐‐‐‐‐‐‐‐‐‐‐‐‐‐‐‐‐‐‐‐‐‐‐‐‐‐‐‐‐‐‐‐‐‐‐‐‐‐‐‐‐‐‐‐‐‐‐‐‐‐‐‐‐‐‐‐‐‐‐‐‐‐‐‐‐‐‐‐‐‐‐‐‐
The respondents were asked to answer “yes” or “no” to consumption of the different
food types (past two weeks). Scalability of the 12 items was .79 (Alpha). The items were
added together, yielding a scale (Dietary diversity) with values from 0 to 12, mean value
8.50, standard deviation 2.82, skewness ‐.92. Analyses revealed that disabled HHs had
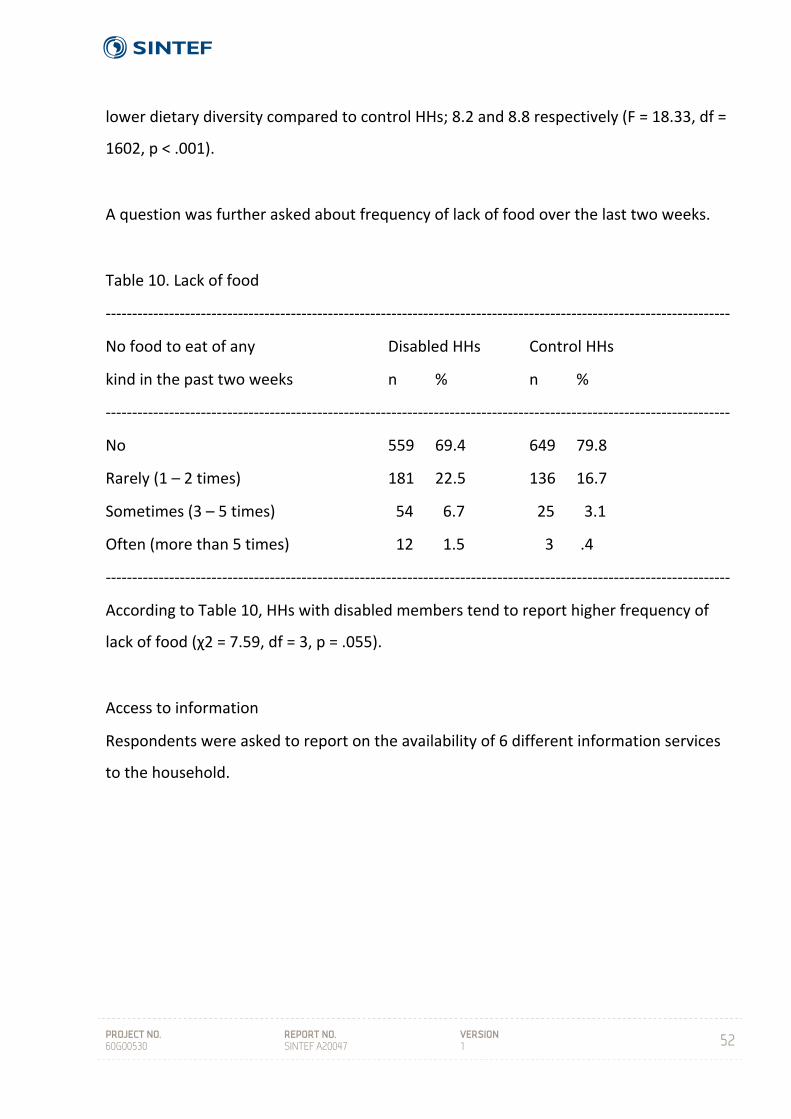
PROJECT NO. 60G00530
REPORT NO. SINTEF A20047
VERSION 1
52
lower dietary diversity compared to control HHs; 8.2 and 8.8 respectively (F = 18.33, df =
1602, p < .001).
A question was further asked about frequency of lack of food over the last two weeks.
Table 10. Lack of food
‐‐‐‐‐‐‐‐‐‐‐‐‐‐‐‐‐‐‐‐‐‐‐‐‐‐‐‐‐‐‐‐‐‐‐‐‐‐‐‐‐‐‐‐‐‐‐‐‐‐‐‐‐‐‐‐‐‐‐‐‐‐‐‐‐‐‐‐‐‐‐‐‐‐‐‐‐‐‐‐‐‐‐‐‐‐‐‐‐‐‐‐‐‐‐‐‐‐‐‐‐‐‐‐‐‐‐‐‐‐‐‐‐‐‐‐‐‐
No food to eat of any Disabled HHs Control HHs
kind in the past two weeks n % n %
‐‐‐‐‐‐‐‐‐‐‐‐‐‐‐‐‐‐‐‐‐‐‐‐‐‐‐‐‐‐‐‐‐‐‐‐‐‐‐‐‐‐‐‐‐‐‐‐‐‐‐‐‐‐‐‐‐‐‐‐‐‐‐‐‐‐‐‐‐‐‐‐‐‐‐‐‐‐‐‐‐‐‐‐‐‐‐‐‐‐‐‐‐‐‐‐‐‐‐‐‐‐‐‐‐‐‐‐‐‐‐‐‐‐‐‐‐‐
No 559 69.4 649 79.8
Rarely (1 – 2 times) 181 22.5 136 16.7
Sometimes (3 – 5 times) 54 6.7 25 3.1
Often (more than 5 times) 12 1.5 3 .4
‐‐‐‐‐‐‐‐‐‐‐‐‐‐‐‐‐‐‐‐‐‐‐‐‐‐‐‐‐‐‐‐‐‐‐‐‐‐‐‐‐‐‐‐‐‐‐‐‐‐‐‐‐‐‐‐‐‐‐‐‐‐‐‐‐‐‐‐‐‐‐‐‐‐‐‐‐‐‐‐‐‐‐‐‐‐‐‐‐‐‐‐‐‐‐‐‐‐‐‐‐‐‐‐‐‐‐‐‐‐‐‐‐‐‐‐‐‐
According to Table 10, HHs with disabled members tend to report higher frequency of
lack of food (χ2 = 7.59, df = 3, p = .055).
Access to information
Respondents were asked to report on the availability of 6 different information services
to the household.
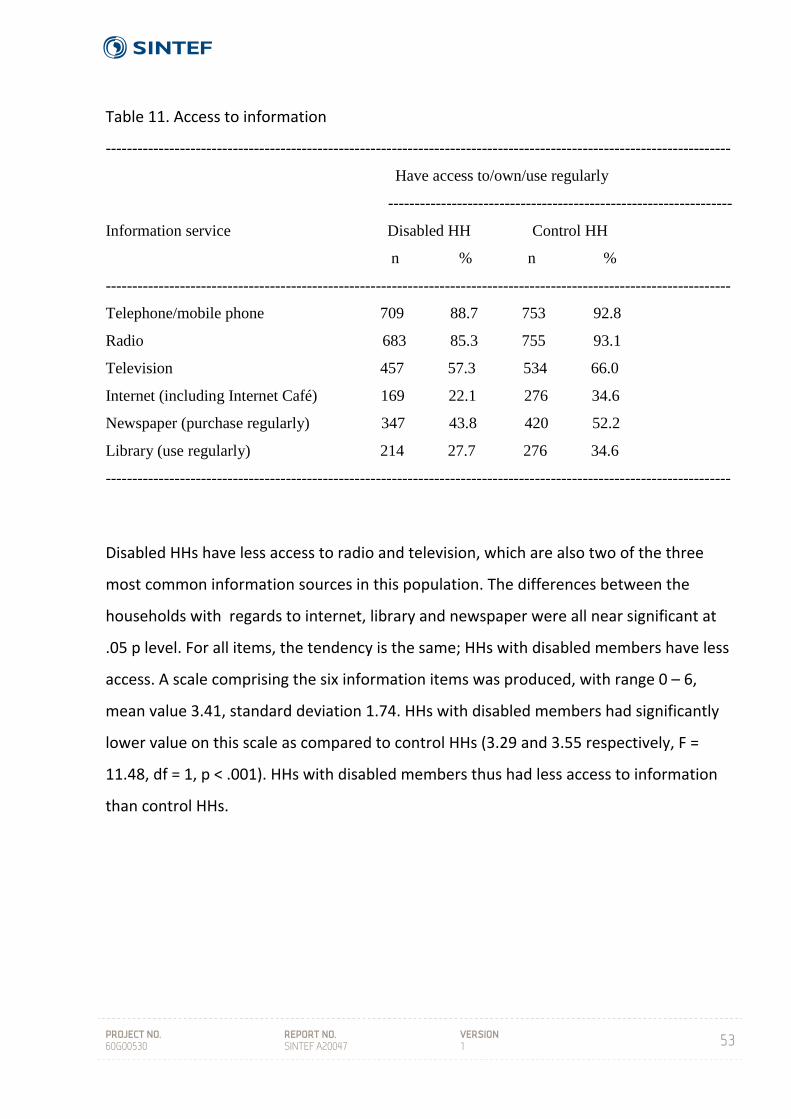
PROJECT NO. 60G00530
REPORT NO. SINTEF A20047
VERSION 1
53
Table 11. Access to information
Disabled HHs have less access to radio and television, which are also two of the three
most common information sources in this population. The differences between the
households with regards to internet, library and newspaper were all near significant at
.05 p level. For all items, the tendency is the same; HHs with disabled members have less
access. A scale comprising the six information items was produced, with range 0 – 6,
mean value 3.41, standard deviation 1.74. HHs with disabled members had significantly
lower value on this scale as compared to control HHs (3.29 and 3.55 respectively, F =
11.48, df = 1, p < .001). HHs with disabled members thus had less access to information
than control HHs.
----------------------------------------------------------------------------------------------------------------------
Have access to/own/use regularly
-----------------------------------------------------------------
Information service Disabled HH Control HH
n % n %
----------------------------------------------------------------------------------------------------------------------
Telephone/mobile phone 709 88.7 753 92.8
Radio 683 85.3 755 93.1
Television 457 57.3 534 66.0
Internet (including Internet Café) 169 22.1 276 34.6
Newspaper (purchase regularly) 347 43.8 420 52.2
Library (use regularly) 214 27.7 276 34.6
----------------------------------------------------------------------------------------------------------------------

PROJECT NO. 60G00530
REPORT NO. SINTEF A20047
VERSION 1
54
Education
Analyses of education variables included only respondents aged 15 years old and above.
Table 12. Did not receive a formal primary education, by gender and disability status (%
of n)
‐‐‐‐‐‐‐‐‐‐‐‐‐‐‐‐‐‐‐‐‐‐‐‐‐‐‐‐‐‐‐‐‐‐‐‐‐‐‐‐‐‐‐‐‐‐‐‐‐‐‐‐‐‐‐‐‐‐‐‐‐‐‐‐‐‐‐‐‐‐‐‐‐‐‐‐‐‐‐‐‐‐‐‐‐‐‐‐‐‐‐‐‐‐‐‐‐‐‐‐‐‐‐‐‐‐‐‐‐‐‐‐‐‐‐‐‐‐
Disabled Non‐disabled
‐‐‐‐‐‐‐‐‐‐‐‐‐‐‐‐‐‐‐‐‐‐‐‐‐‐‐‐‐‐‐‐‐‐‐‐‐‐‐‐‐‐‐‐‐‐‐‐‐‐‐‐‐‐‐‐‐‐‐‐‐‐‐‐‐‐‐‐‐‐‐‐‐‐‐‐‐‐‐‐‐‐‐‐‐‐‐‐‐‐‐‐‐‐‐‐‐‐‐‐‐‐‐‐‐‐‐‐‐‐‐‐‐‐‐‐‐‐
Males 337 16.6 165 9.9
Females 389 17.5 224 12.2
‐‐‐‐‐‐‐‐‐‐‐‐‐‐‐‐‐‐‐‐‐‐‐‐‐‐‐‐‐‐‐‐‐‐‐‐‐‐‐‐‐‐‐‐‐‐‐‐‐‐‐‐‐‐‐‐‐‐‐‐‐‐‐‐‐‐‐‐‐‐‐‐‐‐‐‐‐‐‐‐‐‐‐‐‐‐‐‐‐‐‐‐‐‐‐‐‐‐‐‐‐‐‐‐‐‐‐‐‐‐‐‐‐‐‐‐‐‐
Significant gender differences between individuals with disability and non‐disabled were
found as shown in Table 10 (Males: χ2 = 10.00, df = 1, p < .01. Females: χ2 = 5.90, df = 1,
p < .01). Although a higher proportion of females than men did not receive any formal
education in both groups (disabled/non‐disabled), these differences are not statistically
significant. Approximately one out of six individuals with disabilities in this data material
has not received any formal education, while the corresponding figure for non‐disabled is
approximately one in ten.
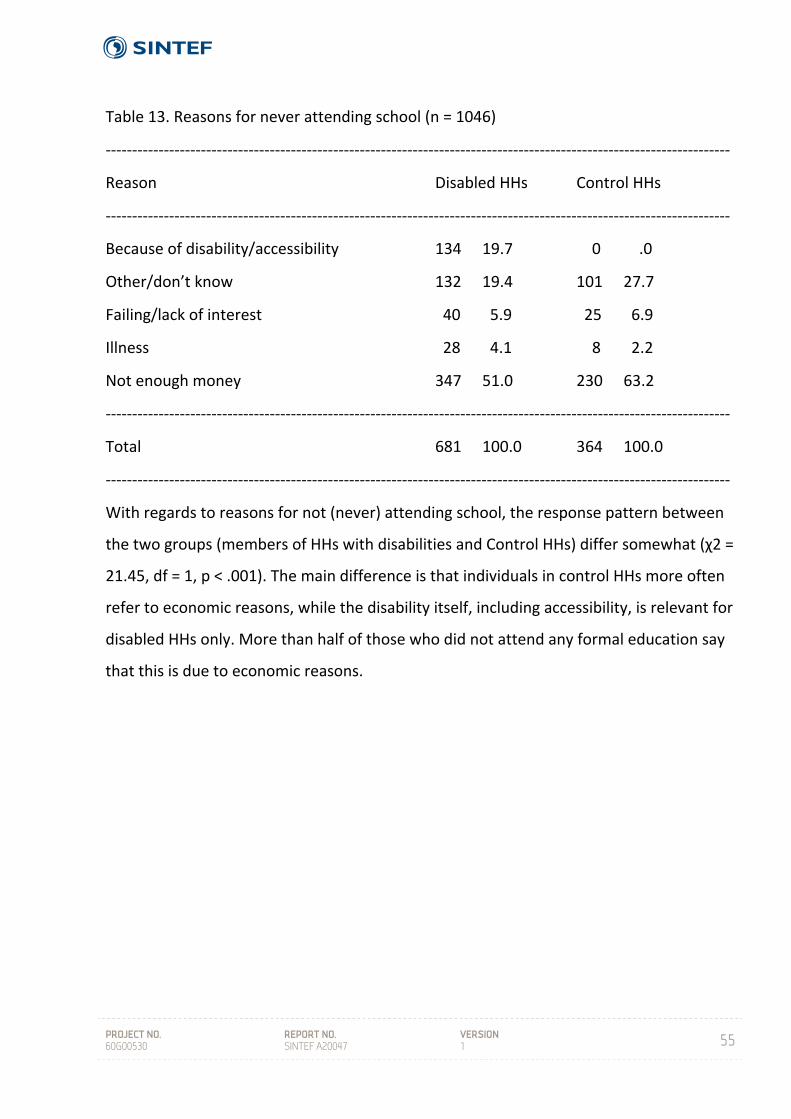
PROJECT NO. 60G00530
REPORT NO. SINTEF A20047
VERSION 1
55
Table 13. Reasons for never attending school (n = 1046)
‐‐‐‐‐‐‐‐‐‐‐‐‐‐‐‐‐‐‐‐‐‐‐‐‐‐‐‐‐‐‐‐‐‐‐‐‐‐‐‐‐‐‐‐‐‐‐‐‐‐‐‐‐‐‐‐‐‐‐‐‐‐‐‐‐‐‐‐‐‐‐‐‐‐‐‐‐‐‐‐‐‐‐‐‐‐‐‐‐‐‐‐‐‐‐‐‐‐‐‐‐‐‐‐‐‐‐‐‐‐‐‐‐‐‐‐‐‐
Reason Disabled HHs Control HHs
‐‐‐‐‐‐‐‐‐‐‐‐‐‐‐‐‐‐‐‐‐‐‐‐‐‐‐‐‐‐‐‐‐‐‐‐‐‐‐‐‐‐‐‐‐‐‐‐‐‐‐‐‐‐‐‐‐‐‐‐‐‐‐‐‐‐‐‐‐‐‐‐‐‐‐‐‐‐‐‐‐‐‐‐‐‐‐‐‐‐‐‐‐‐‐‐‐‐‐‐‐‐‐‐‐‐‐‐‐‐‐‐‐‐‐‐‐‐
Because of disability/accessibility 134 19.7 0 .0
Other/don’t know 132 19.4 101 27.7
Failing/lack of interest 40 5.9 25 6.9
Illness 28 4.1 8 2.2
Not enough money 347 51.0 230 63.2
‐‐‐‐‐‐‐‐‐‐‐‐‐‐‐‐‐‐‐‐‐‐‐‐‐‐‐‐‐‐‐‐‐‐‐‐‐‐‐‐‐‐‐‐‐‐‐‐‐‐‐‐‐‐‐‐‐‐‐‐‐‐‐‐‐‐‐‐‐‐‐‐‐‐‐‐‐‐‐‐‐‐‐‐‐‐‐‐‐‐‐‐‐‐‐‐‐‐‐‐‐‐‐‐‐‐‐‐‐‐‐‐‐‐‐‐‐‐
Total 681 100.0 364 100.0
‐‐‐‐‐‐‐‐‐‐‐‐‐‐‐‐‐‐‐‐‐‐‐‐‐‐‐‐‐‐‐‐‐‐‐‐‐‐‐‐‐‐‐‐‐‐‐‐‐‐‐‐‐‐‐‐‐‐‐‐‐‐‐‐‐‐‐‐‐‐‐‐‐‐‐‐‐‐‐‐‐‐‐‐‐‐‐‐‐‐‐‐‐‐‐‐‐‐‐‐‐‐‐‐‐‐‐‐‐‐‐‐‐‐‐‐‐‐
With regards to reasons for not (never) attending school, the response pattern between
the two groups (members of HHs with disabilities and Control HHs) differ somewhat (χ2 =
21.45, df = 1, p < .001). The main difference is that individuals in control HHs more often
refer to economic reasons, while the disability itself, including accessibility, is relevant for
disabled HHs only. More than half of those who did not attend any formal education say
that this is due to economic reasons.
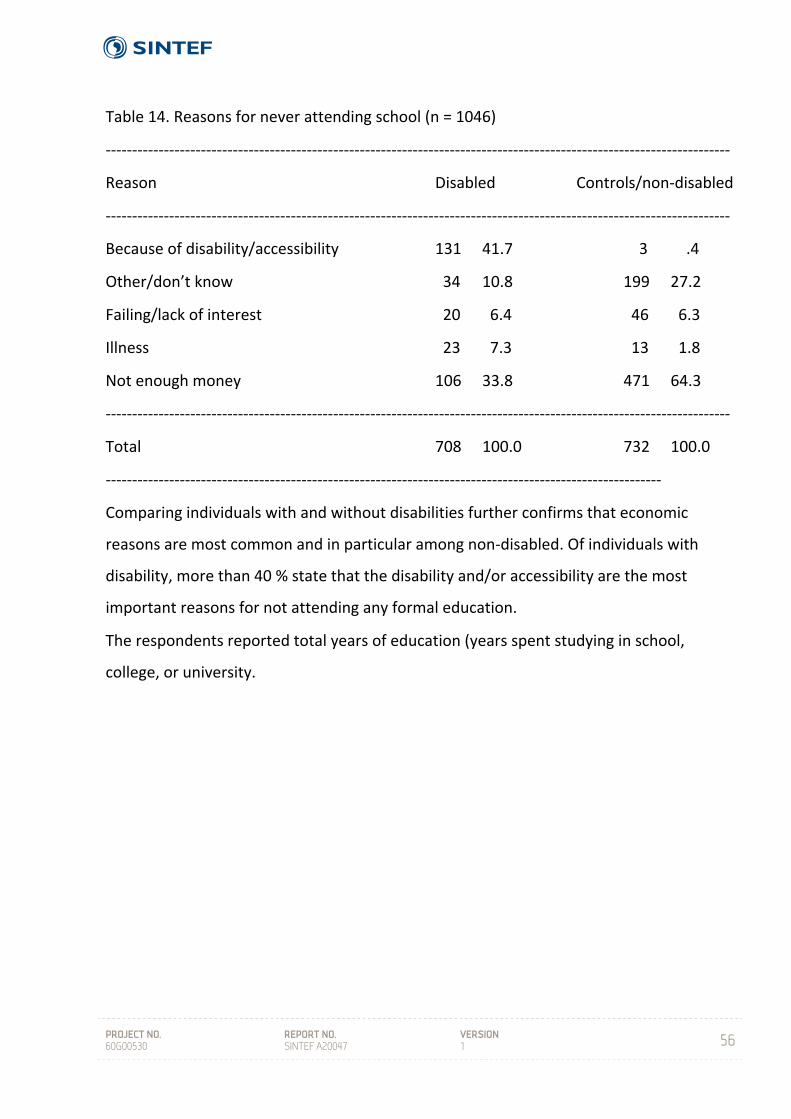
PROJECT NO. 60G00530
REPORT NO. SINTEF A20047
VERSION 1
56
Table 14. Reasons for never attending school (n = 1046)
‐‐‐‐‐‐‐‐‐‐‐‐‐‐‐‐‐‐‐‐‐‐‐‐‐‐‐‐‐‐‐‐‐‐‐‐‐‐‐‐‐‐‐‐‐‐‐‐‐‐‐‐‐‐‐‐‐‐‐‐‐‐‐‐‐‐‐‐‐‐‐‐‐‐‐‐‐‐‐‐‐‐‐‐‐‐‐‐‐‐‐‐‐‐‐‐‐‐‐‐‐‐‐‐‐‐‐‐‐‐‐‐‐‐‐‐‐‐
Reason Disabled Controls/non‐disabled
‐‐‐‐‐‐‐‐‐‐‐‐‐‐‐‐‐‐‐‐‐‐‐‐‐‐‐‐‐‐‐‐‐‐‐‐‐‐‐‐‐‐‐‐‐‐‐‐‐‐‐‐‐‐‐‐‐‐‐‐‐‐‐‐‐‐‐‐‐‐‐‐‐‐‐‐‐‐‐‐‐‐‐‐‐‐‐‐‐‐‐‐‐‐‐‐‐‐‐‐‐‐‐‐‐‐‐‐‐‐‐‐‐‐‐‐‐‐
Because of disability/accessibility 131 41.7 3 .4
Other/don’t know 34 10.8 199 27.2
Failing/lack of interest 20 6.4 46 6.3
Illness 23 7.3 13 1.8
Not enough money 106 33.8 471 64.3
‐‐‐‐‐‐‐‐‐‐‐‐‐‐‐‐‐‐‐‐‐‐‐‐‐‐‐‐‐‐‐‐‐‐‐‐‐‐‐‐‐‐‐‐‐‐‐‐‐‐‐‐‐‐‐‐‐‐‐‐‐‐‐‐‐‐‐‐‐‐‐‐‐‐‐‐‐‐‐‐‐‐‐‐‐‐‐‐‐‐‐‐‐‐‐‐‐‐‐‐‐‐‐‐‐‐‐‐‐‐‐‐‐‐‐‐‐‐
Total 708 100.0 732 100.0
‐‐‐‐‐‐‐‐‐‐‐‐‐‐‐‐‐‐‐‐‐‐‐‐‐‐‐‐‐‐‐‐‐‐‐‐‐‐‐‐‐‐‐‐‐‐‐‐‐‐‐‐‐‐‐‐‐‐‐‐‐‐‐‐‐‐‐‐‐‐‐‐‐‐‐‐‐‐‐‐‐‐‐‐‐‐‐‐‐‐‐‐‐‐‐‐‐‐‐‐‐‐‐‐‐
Comparing individuals with and without disabilities further confirms that economic
reasons are most common and in particular among non‐disabled. Of individuals with
disability, more than 40 % state that the disability and/or accessibility are the most
important reasons for not attending any formal education.
The respondents reported total years of education (years spent studying in school,
college, or university.
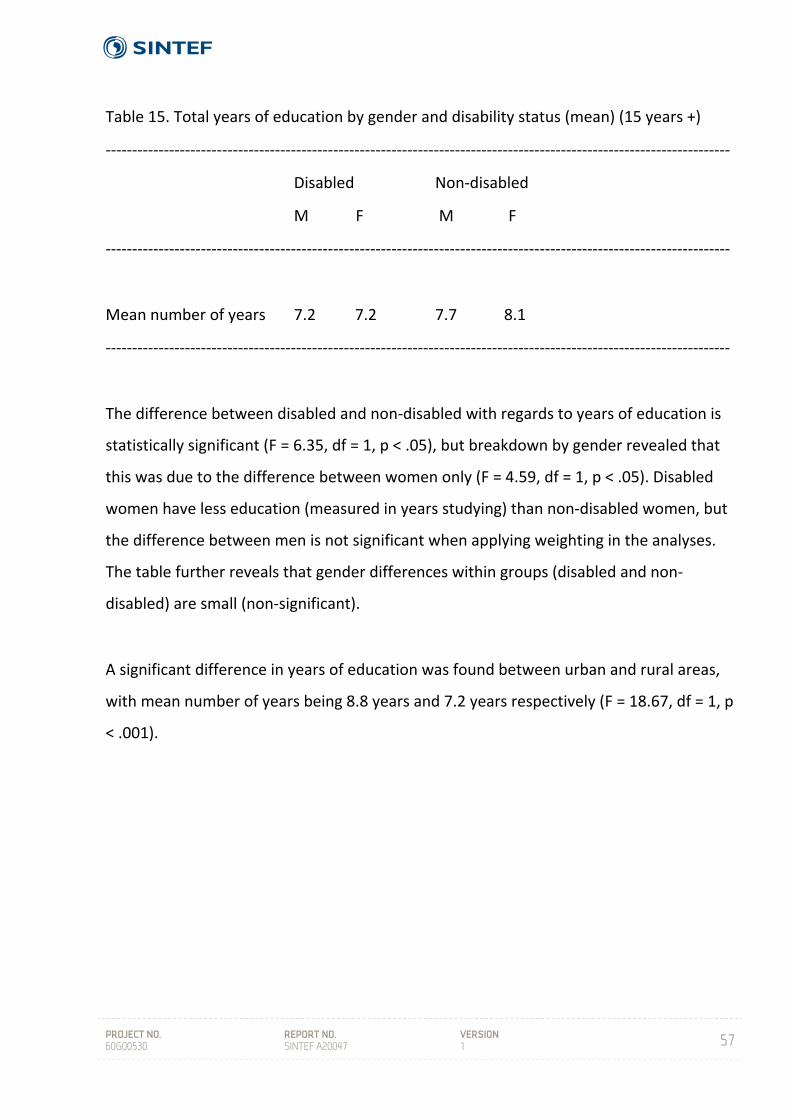
PROJECT NO. 60G00530
REPORT NO. SINTEF A20047
VERSION 1
57
Table 15. Total years of education by gender and disability status (mean) (15 years +)
‐‐‐‐‐‐‐‐‐‐‐‐‐‐‐‐‐‐‐‐‐‐‐‐‐‐‐‐‐‐‐‐‐‐‐‐‐‐‐‐‐‐‐‐‐‐‐‐‐‐‐‐‐‐‐‐‐‐‐‐‐‐‐‐‐‐‐‐‐‐‐‐‐‐‐‐‐‐‐‐‐‐‐‐‐‐‐‐‐‐‐‐‐‐‐‐‐‐‐‐‐‐‐‐‐‐‐‐‐‐‐‐‐‐‐‐‐‐
Disabled Non‐disabled
M F M F
‐‐‐‐‐‐‐‐‐‐‐‐‐‐‐‐‐‐‐‐‐‐‐‐‐‐‐‐‐‐‐‐‐‐‐‐‐‐‐‐‐‐‐‐‐‐‐‐‐‐‐‐‐‐‐‐‐‐‐‐‐‐‐‐‐‐‐‐‐‐‐‐‐‐‐‐‐‐‐‐‐‐‐‐‐‐‐‐‐‐‐‐‐‐‐‐‐‐‐‐‐‐‐‐‐‐‐‐‐‐‐‐‐‐‐‐‐‐
Mean number of years 7.2 7.2 7.7 8.1
‐‐‐‐‐‐‐‐‐‐‐‐‐‐‐‐‐‐‐‐‐‐‐‐‐‐‐‐‐‐‐‐‐‐‐‐‐‐‐‐‐‐‐‐‐‐‐‐‐‐‐‐‐‐‐‐‐‐‐‐‐‐‐‐‐‐‐‐‐‐‐‐‐‐‐‐‐‐‐‐‐‐‐‐‐‐‐‐‐‐‐‐‐‐‐‐‐‐‐‐‐‐‐‐‐‐‐‐‐‐‐‐‐‐‐‐‐‐
The difference between disabled and non‐disabled with regards to years of education is
statistically significant (F = 6.35, df = 1, p < .05), but breakdown by gender revealed that
this was due to the difference between women only (F = 4.59, df = 1, p < .05). Disabled
women have less education (measured in years studying) than non‐disabled women, but
the difference between men is not significant when applying weighting in the analyses.
The table further reveals that gender differences within groups (disabled and non‐
disabled) are small (non‐significant).
A significant difference in years of education was found between urban and rural areas,
with mean number of years being 8.8 years and 7.2 years respectively (F = 18.67, df = 1, p
< .001).
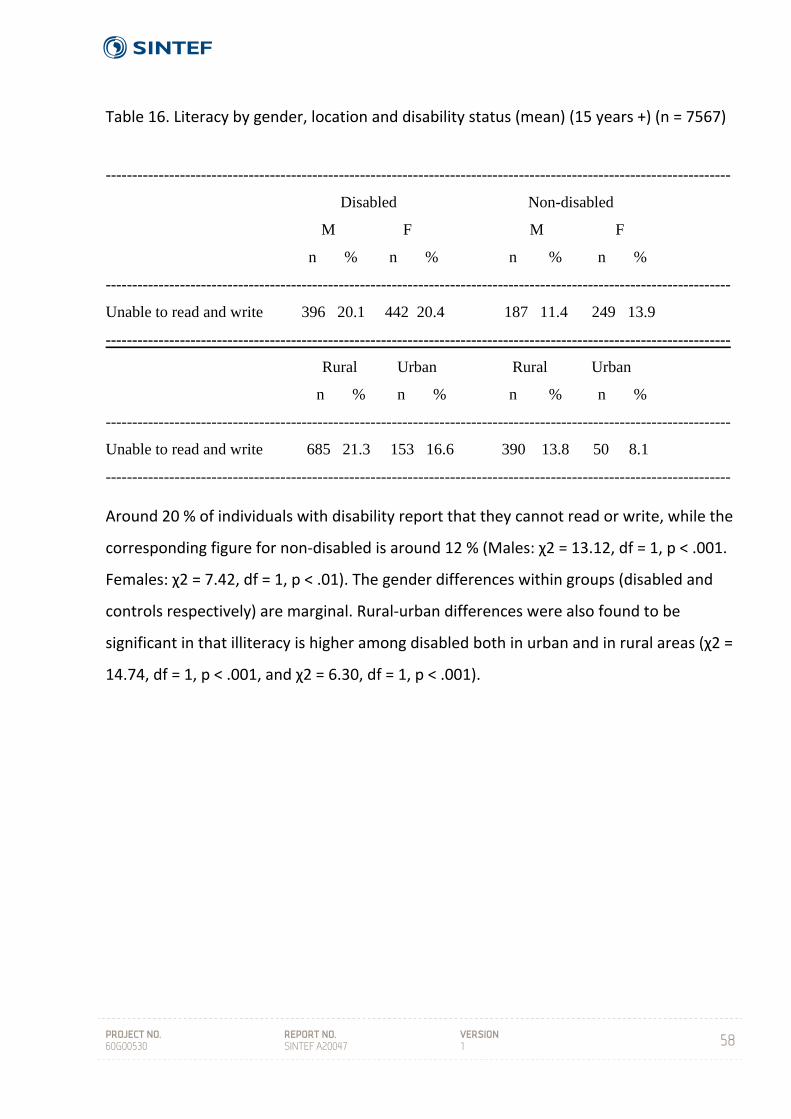
PROJECT NO. 60G00530
REPORT NO. SINTEF A20047
VERSION 1
58
Table 16. Literacy by gender, location and disability status (mean) (15 years +) (n = 7567)
Around 20 % of individuals with disability report that they cannot read or write, while the
corresponding figure for non‐disabled is around 12 % (Males: χ2 = 13.12, df = 1, p < .001.
Females: χ2 = 7.42, df = 1, p < .01). The gender differences within groups (disabled and
controls respectively) are marginal. Rural‐urban differences were also found to be
significant in that illiteracy is higher among disabled both in urban and in rural areas (χ2 =
14.74, df = 1, p < .001, and χ2 = 6.30, df = 1, p < .001).
----------------------------------------------------------------------------------------------------------------------
Disabled Non-disabled
M F M F
n % n % n % n %
----------------------------------------------------------------------------------------------------------------------
Unable to read and write 396 20.1 442 20.4 187 11.4 249 13.9
----------------------------------------------------------------------------------------------------------------------
Rural Urban Rural Urban
n % n % n % n %
----------------------------------------------------------------------------------------------------------------------
Unable to read and write 685 21.3 153 16.6 390 13.8 50 8.1
----------------------------------------------------------------------------------------------------------------------
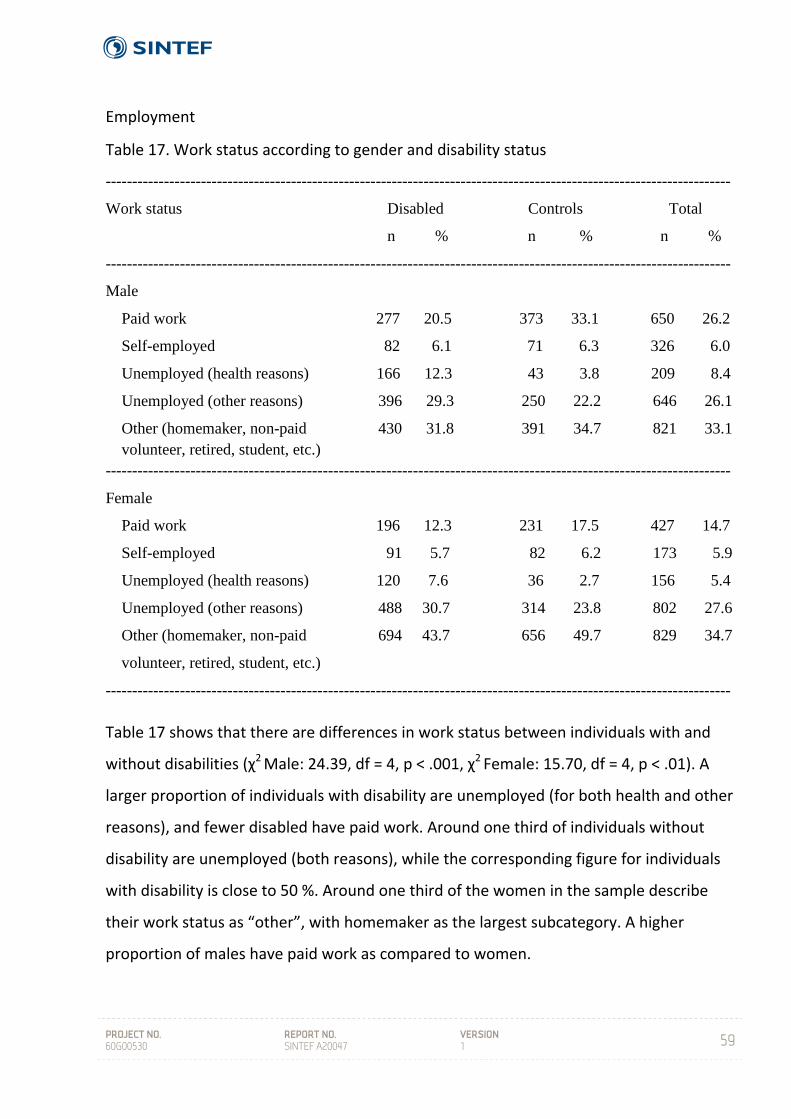
PROJECT NO. 60G00530
REPORT NO. SINTEF A20047
VERSION 1
59
Employment
Table 17. Work status according to gender and disability status
Table 17 shows that there are differences in work status between individuals with and
without disabilities (χ2 Male: 24.39, df = 4, p < .001, χ2 Female: 15.70, df = 4, p < .01). A
larger proportion of individuals with disability are unemployed (for both health and other
reasons), and fewer disabled have paid work. Around one third of individuals without
disability are unemployed (both reasons), while the corresponding figure for individuals
with disability is close to 50 %. Around one third of the women in the sample describe
their work status as “other”, with homemaker as the largest subcategory. A higher
proportion of males have paid work as compared to women.
----------------------------------------------------------------------------------------------------------------------
Work status Disabled Controls Total
n % n % n %
----------------------------------------------------------------------------------------------------------------------
Male
Paid work 277 20.5 373 33.1 650 26.2
Self-employed 82 6.1 71 6.3 326 6.0
Unemployed (health reasons) 166 12.3 43 3.8 209 8.4
Unemployed (other reasons) 396 29.3 250 22.2 646 26.1
Other (homemaker, non-paid 430 31.8 391 34.7 821 33.1 volunteer, retired, student, etc.) ----------------------------------------------------------------------------------------------------------------------
Female
Paid work 196 12.3 231 17.5 427 14.7
Self-employed 91 5.7 82 6.2 173 5.9
Unemployed (health reasons) 120 7.6 36 2.7 156 5.4
Unemployed (other reasons) 488 30.7 314 23.8 802 27.6
Other (homemaker, non-paid 694 43.7 656 49.7 829 34.7
volunteer, retired, student, etc.)
----------------------------------------------------------------------------------------------------------------------
PROJECT NO. 60G00530
REPORT NO. SINTEF A20047
VERSION 1
60
Reproductive health
Questions about reproductive health were asked to women above 15 years of age. Of
disabled women, 70.8 % (1135) confirmed that they had given birth, while the
corresponding figure for non‐disabled women was 74.8 % (987). The difference was not
statistically significant. Mean number of children was 3.6 and 3.4 respectively (n.s.).
Respondents were asked whether any pregnancies had ended before term. Among
disabled women, 7.0 % (111) reported stillbirths, while the corresponding figure for non‐
disabled was 6.4 % (84) (n.s.). Mean number of stillbirths was 1.6 among disabled women
and 1.4 among non‐disabled, but this difference is not large enough to be statistically
significant. There is thus a weak but non‐significant tendency for disabled women to have
more stillbirths than the non‐disabled control group.
8.2 Individual section
Every individual identified with disability during the household interview was invited to
participate in a detailed individual interview, including a total of 866 persons. For
comparative purposes, 807 persons from control households were also invited to
participate in the individual interviews. The detailed questionnaire for the control
individuals comprised only a short version of the questionnaire used for interviewing
individuals with disability.
Of individuals with disability, 41.7 % (360) of the interviews were with the disabled
person him/herself. A total of 45.7 % (394) of the interviews were with proxys, i.e. for the
most part the head of the household. In the remaining 12.6 % (109) of the interviews,
both the individual with disability and someone else from the household, again mostly
the head of the household, participated.
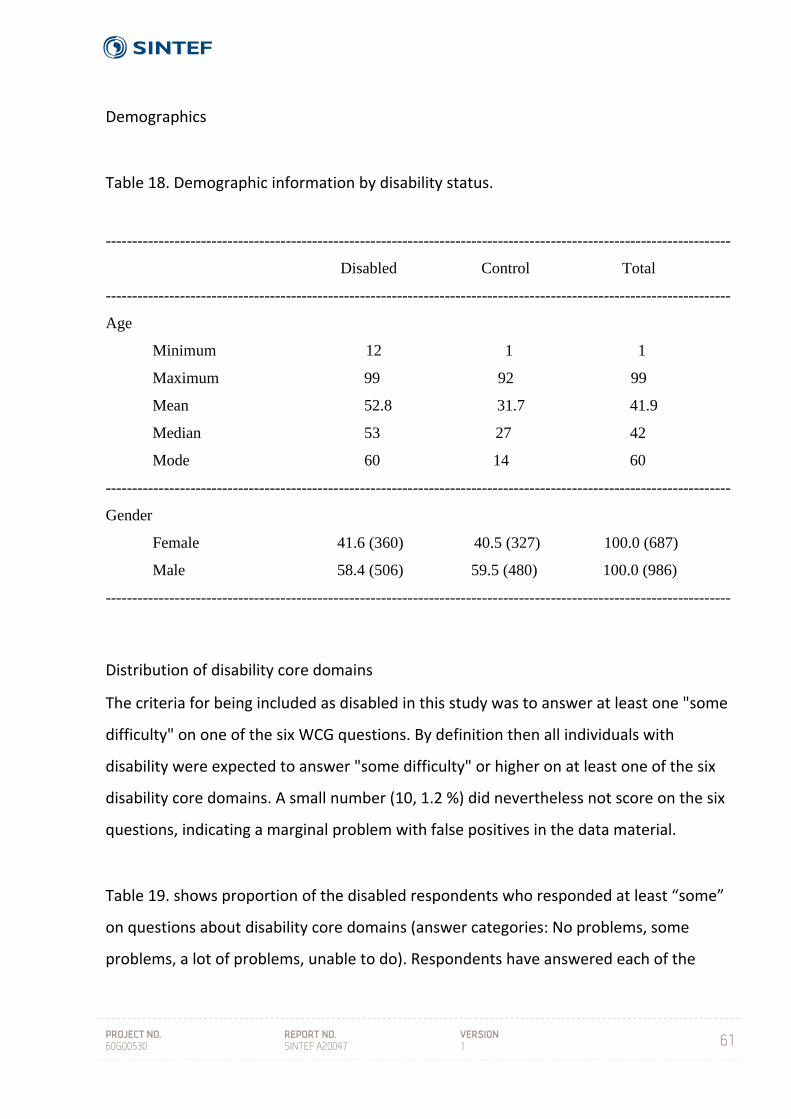
PROJECT NO. 60G00530
REPORT NO. SINTEF A20047
VERSION 1
61
Demographics
Table 18. Demographic information by disability status.
Distribution of disability core domains
The criteria for being included as disabled in this study was to answer at least one "some
difficulty" on one of the six WCG questions. By definition then all individuals with
disability were expected to answer "some difficulty" or higher on at least one of the six
disability core domains. A small number (10, 1.2 %) did nevertheless not score on the six
questions, indicating a marginal problem with false positives in the data material.
Table 19. shows proportion of the disabled respondents who responded at least “some”
on questions about disability core domains (answer categories: No problems, some
problems, a lot of problems, unable to do). Respondents have answered each of the
----------------------------------------------------------------------------------------------------------------------
Disabled Control Total
----------------------------------------------------------------------------------------------------------------------
Age
Minimum 12 1 1
Maximum 99 92 99
Mean 52.8 31.7 41.9
Median 53 27 42
Mode 60 14 60
----------------------------------------------------------------------------------------------------------------------
Gender
Female 41.6 (360) 40.5 (327) 100.0 (687)
Male 58.4 (506) 59.5 (480) 100.0 (986)
----------------------------------------------------------------------------------------------------------------------
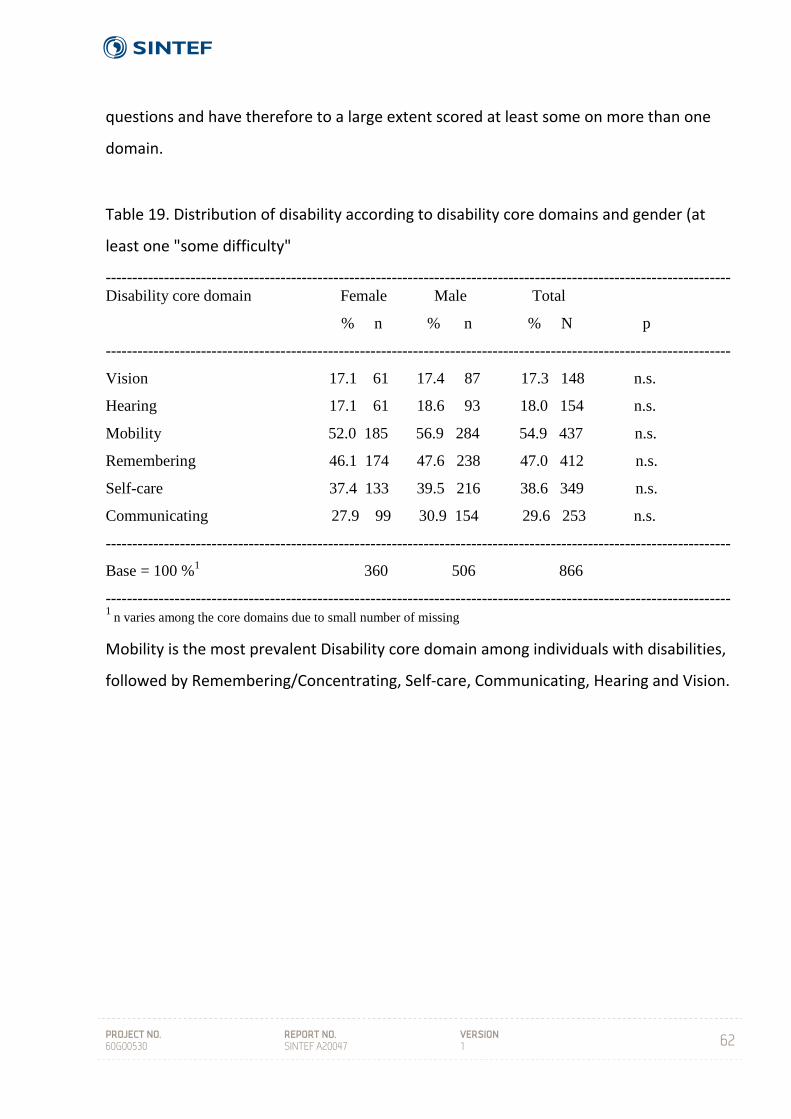
PROJECT NO. 60G00530
REPORT NO. SINTEF A20047
VERSION 1
62
questions and have therefore to a large extent scored at least some on more than one
domain.
Table 19. Distribution of disability according to disability core domains and gender (at
least one "some difficulty"
Mobility is the most prevalent Disability core domain among individuals with disabilities,
followed by Remembering/Concentrating, Self‐care, Communicating, Hearing and Vision.
----------------------------------------------------------------------------------------------------------------------Disability core domain Female Male Total
% n % n % N p
----------------------------------------------------------------------------------------------------------------------
Vision 17.1 61 17.4 87 17.3 148 n.s.
Hearing 17.1 61 18.6 93 18.0 154 n.s.
Mobility 52.0 185 56.9 284 54.9 437 n.s.
Remembering 46.1 174 47.6 238 47.0 412 n.s.
Self-care 37.4 133 39.5 216 38.6 349 n.s.
Communicating 27.9 99 30.9 154 29.6 253 n.s.
----------------------------------------------------------------------------------------------------------------------
Base = 100 %1 360 506 866
----------------------------------------------------------------------------------------------------------------------1
n varies among the core domains due to small number of missing
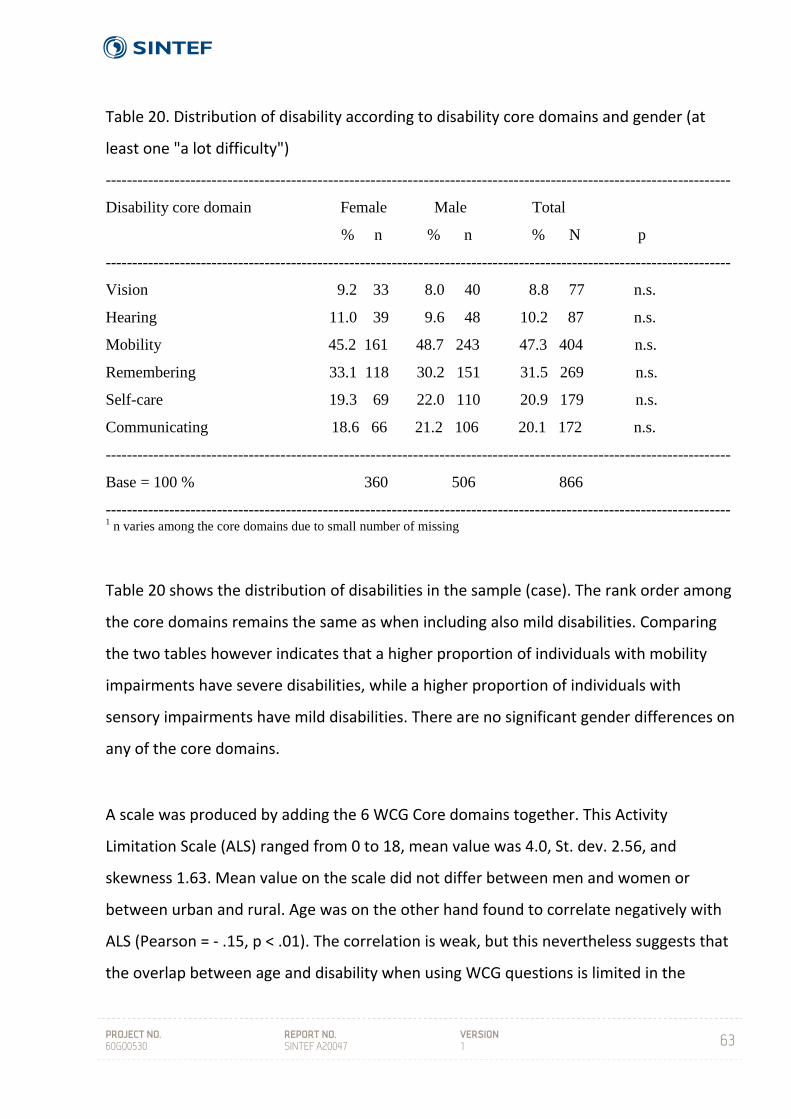
PROJECT NO. 60G00530
REPORT NO. SINTEF A20047
VERSION 1
63
Table 20. Distribution of disability according to disability core domains and gender (at
least one "a lot difficulty")
Table 20 shows the distribution of disabilities in the sample (case). The rank order among
the core domains remains the same as when including also mild disabilities. Comparing
the two tables however indicates that a higher proportion of individuals with mobility
impairments have severe disabilities, while a higher proportion of individuals with
sensory impairments have mild disabilities. There are no significant gender differences on
any of the core domains.
A scale was produced by adding the 6 WCG Core domains together. This Activity
Limitation Scale (ALS) ranged from 0 to 18, mean value was 4.0, St. dev. 2.56, and
skewness 1.63. Mean value on the scale did not differ between men and women or
between urban and rural. Age was on the other hand found to correlate negatively with
ALS (Pearson = ‐ .15, p < .01). The correlation is weak, but this nevertheless suggests that
the overlap between age and disability when using WCG questions is limited in the
----------------------------------------------------------------------------------------------------------------------
Disability core domain Female Male Total
% n % n % N p
----------------------------------------------------------------------------------------------------------------------
Vision 9.2 33 8.0 40 8.8 77 n.s.
Hearing 11.0 39 9.6 48 10.2 87 n.s.
Mobility 45.2 161 48.7 243 47.3 404 n.s.
Remembering 33.1 118 30.2 151 31.5 269 n.s.
Self-care 19.3 69 22.0 110 20.9 179 n.s.
Communicating 18.6 66 21.2 106 20.1 172 n.s.
----------------------------------------------------------------------------------------------------------------------
Base = 100 % 360 506 866
----------------------------------------------------------------------------------------------------------------------1 n varies among the core domains due to small number of missing
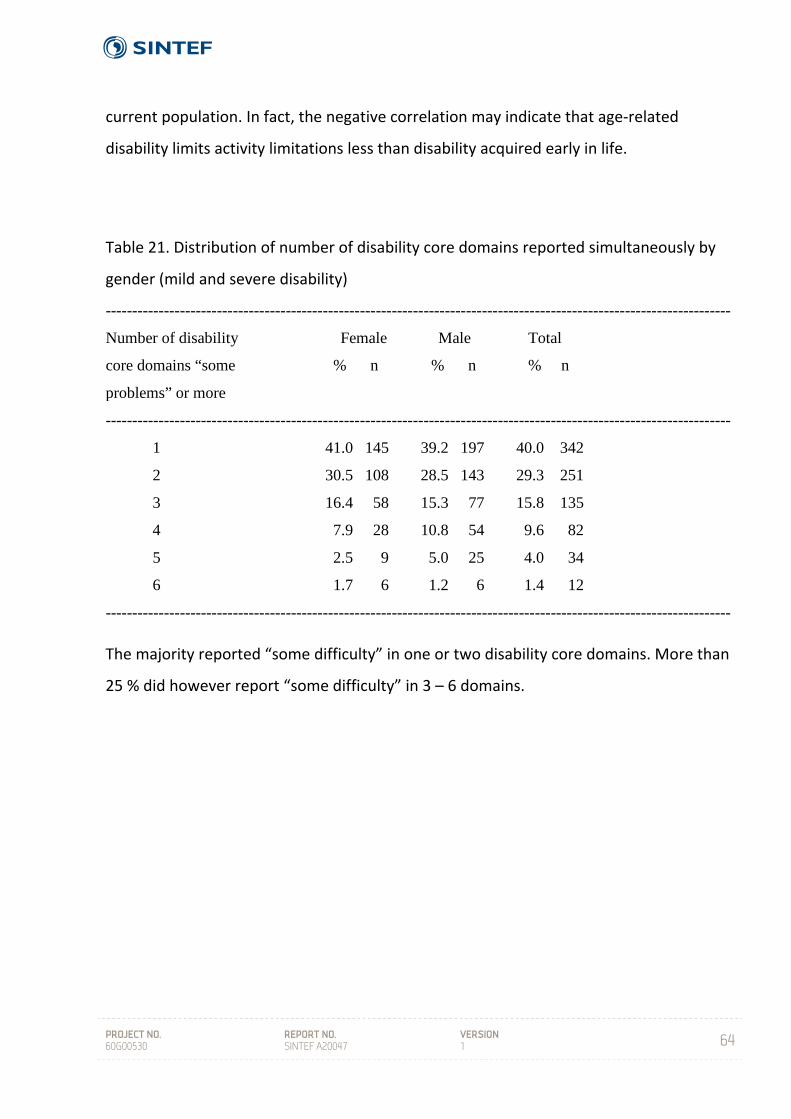
PROJECT NO. 60G00530
REPORT NO. SINTEF A20047
VERSION 1
64
current population. In fact, the negative correlation may indicate that age‐related
disability limits activity limitations less than disability acquired early in life.
Table 21. Distribution of number of disability core domains reported simultaneously by
gender (mild and severe disability)
The majority reported “some difficulty” in one or two disability core domains. More than
25 % did however report “some difficulty” in 3 – 6 domains.
----------------------------------------------------------------------------------------------------------------------
Number of disability Female Male Total
core domains “some % n % n % n
problems” or more
----------------------------------------------------------------------------------------------------------------------
1 41.0 145 39.2 197 40.0 342
2 30.5 108 28.5 143 29.3 251
3 16.4 58 15.3 77 15.8 135
4 7.9 28 10.8 54 9.6 82
5 2.5 9 5.0 25 4.0 34
6 1.7 6 1.2 6 1.4 12
----------------------------------------------------------------------------------------------------------------------
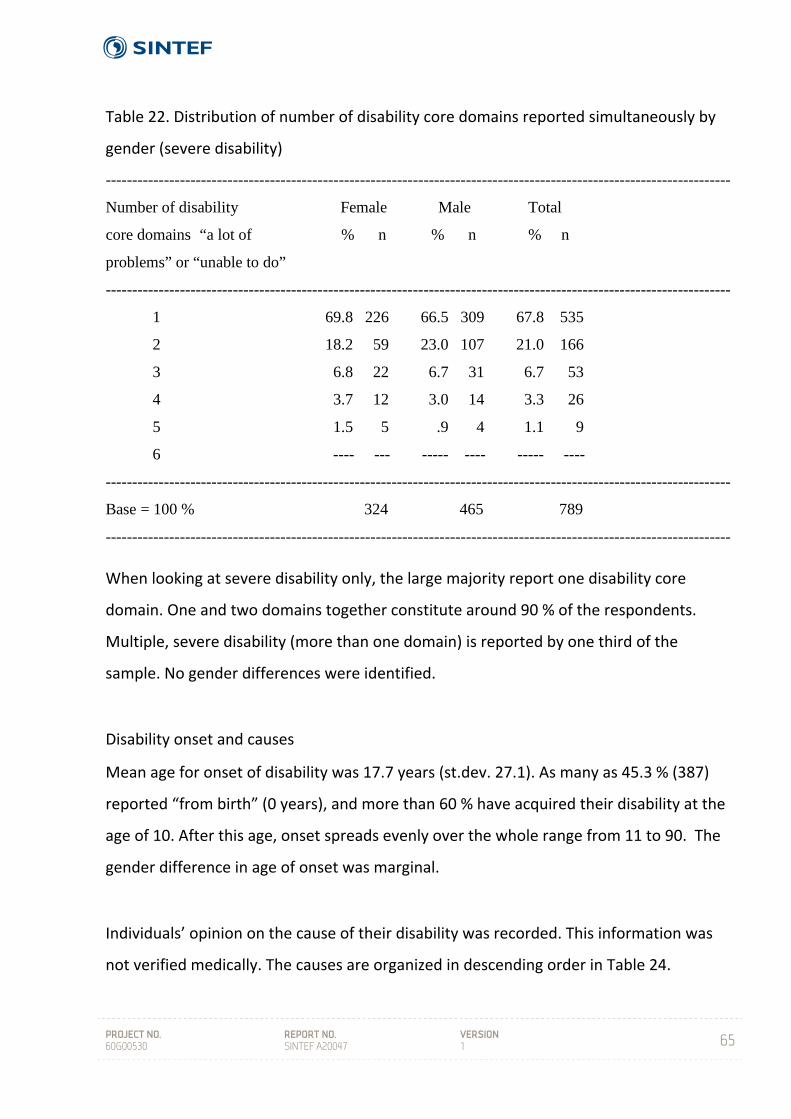
PROJECT NO. 60G00530
REPORT NO. SINTEF A20047
VERSION 1
65
Table 22. Distribution of number of disability core domains reported simultaneously by
gender (severe disability)
When looking at severe disability only, the large majority report one disability core
domain. One and two domains together constitute around 90 % of the respondents.
Multiple, severe disability (more than one domain) is reported by one third of the
sample. No gender differences were identified.
Disability onset and causes
Mean age for onset of disability was 17.7 years (st.dev. 27.1). As many as 45.3 % (387)
reported “from birth” (0 years), and more than 60 % have acquired their disability at the
age of 10. After this age, onset spreads evenly over the whole range from 11 to 90. The
gender difference in age of onset was marginal.
Individuals’ opinion on the cause of their disability was recorded. This information was
not verified medically. The causes are organized in descending order in Table 24.
----------------------------------------------------------------------------------------------------------------------
Number of disability Female Male Total
core domains “a lot of % n % n % n
problems” or “unable to do”
----------------------------------------------------------------------------------------------------------------------
1 69.8 226 66.5 309 67.8 535
2 18.2 59 23.0 107 21.0 166
3 6.8 22 6.7 31 6.7 53
4 3.7 12 3.0 14 3.3 26
5 1.5 5 .9 4 1.1 9
6 ---- --- ----- ---- ----- ----
----------------------------------------------------------------------------------------------------------------------
Base = 100 % 324 465 789
----------------------------------------------------------------------------------------------------------------------
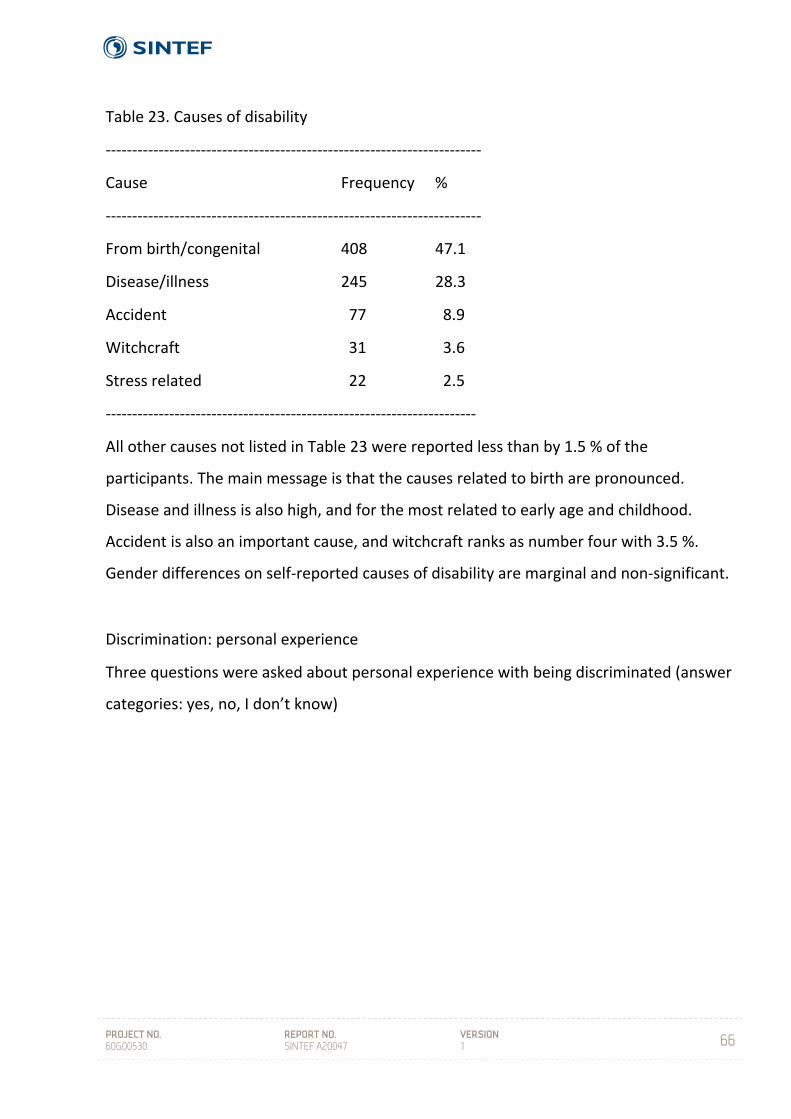
PROJECT NO. 60G00530
REPORT NO. SINTEF A20047
VERSION 1
66
Table 23. Causes of disability
‐‐‐‐‐‐‐‐‐‐‐‐‐‐‐‐‐‐‐‐‐‐‐‐‐‐‐‐‐‐‐‐‐‐‐‐‐‐‐‐‐‐‐‐‐‐‐‐‐‐‐‐‐‐‐‐‐‐‐‐‐‐‐‐‐‐‐‐‐‐‐
Cause Frequency %
‐‐‐‐‐‐‐‐‐‐‐‐‐‐‐‐‐‐‐‐‐‐‐‐‐‐‐‐‐‐‐‐‐‐‐‐‐‐‐‐‐‐‐‐‐‐‐‐‐‐‐‐‐‐‐‐‐‐‐‐‐‐‐‐‐‐‐‐‐‐‐
From birth/congenital 408 47.1
Disease/illness 245 28.3
Accident 77 8.9
Witchcraft 31 3.6
Stress related 22 2.5
‐‐‐‐‐‐‐‐‐‐‐‐‐‐‐‐‐‐‐‐‐‐‐‐‐‐‐‐‐‐‐‐‐‐‐‐‐‐‐‐‐‐‐‐‐‐‐‐‐‐‐‐‐‐‐‐‐‐‐‐‐‐‐‐‐‐‐‐‐‐
All other causes not listed in Table 23 were reported less than by 1.5 % of the
participants. The main message is that the causes related to birth are pronounced.
Disease and illness is also high, and for the most related to early age and childhood.
Accident is also an important cause, and witchcraft ranks as number four with 3.5 %.
Gender differences on self‐reported causes of disability are marginal and non‐significant.
Discrimination: personal experience
Three questions were asked about personal experience with being discriminated (answer
categories: yes, no, I don’t know)
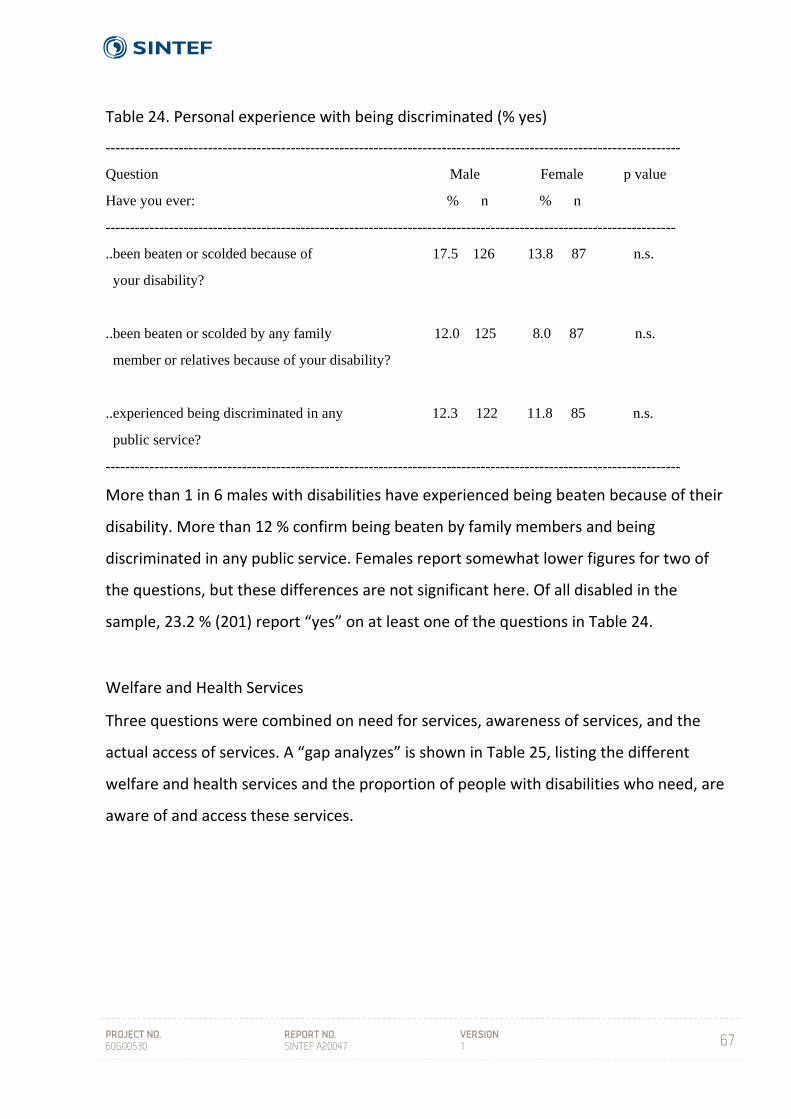
PROJECT NO. 60G00530
REPORT NO. SINTEF A20047
VERSION 1
67
Table 24. Personal experience with being discriminated (% yes)
----------------------------------------------------------------------------------------------------------------------
Question Male Female p value
Have you ever: % n % n
---------------------------------------------------------------------------------------------------------------------
..been beaten or scolded because of 17.5 126 13.8 87 n.s.
your disability?
..been beaten or scolded by any family 12.0 125 8.0 87 n.s.
member or relatives because of your disability?
..experienced being discriminated in any 12.3 122 11.8 85 n.s.
public service?
----------------------------------------------------------------------------------------------------------------------
More than 1 in 6 males with disabilities have experienced being beaten because of their
disability. More than 12 % confirm being beaten by family members and being
discriminated in any public service. Females report somewhat lower figures for two of
the questions, but these differences are not significant here. Of all disabled in the
sample, 23.2 % (201) report “yes” on at least one of the questions in Table 24.
Welfare and Health Services
Three questions were combined on need for services, awareness of services, and the
actual access of services. A “gap analyzes” is shown in Table 25, listing the different
welfare and health services and the proportion of people with disabilities who need, are
aware of and access these services.
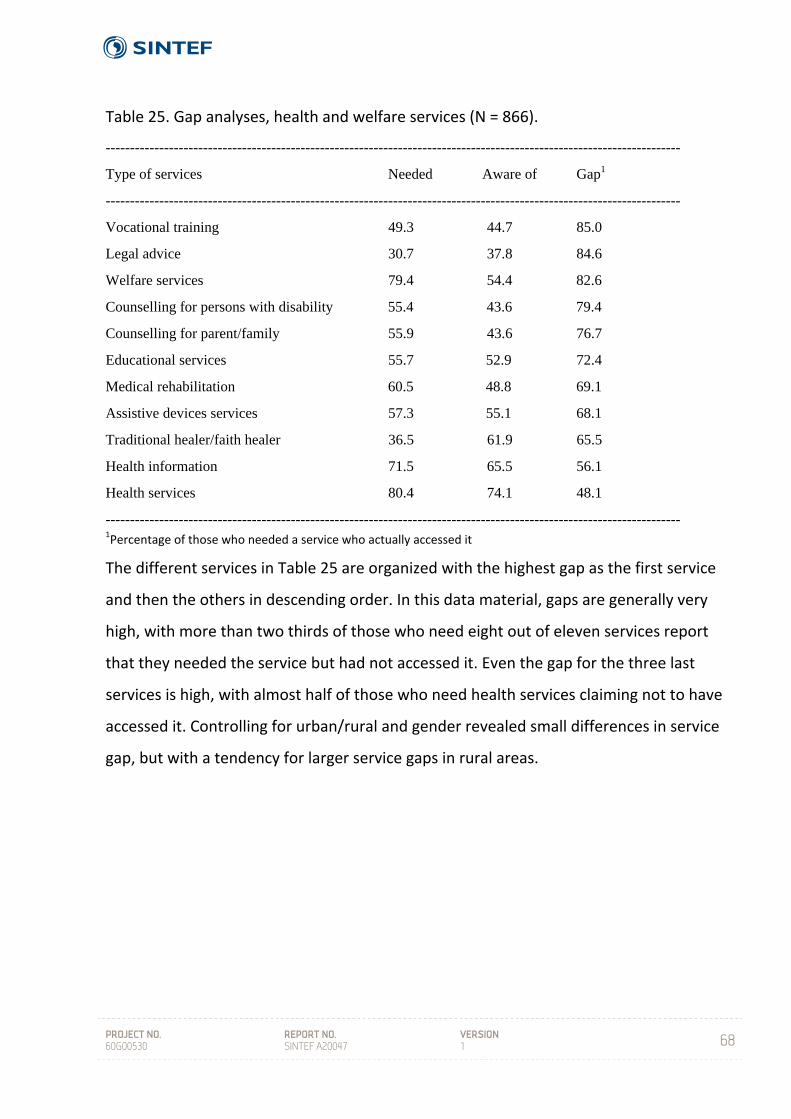
PROJECT NO. 60G00530
REPORT NO. SINTEF A20047
VERSION 1
68
Table 25. Gap analyses, health and welfare services (N = 866).
----------------------------------------------------------------------------------------------------------------------
Type of services Needed Aware of Gap1
----------------------------------------------------------------------------------------------------------------------
Vocational training 49.3 44.7 85.0
Legal advice 30.7 37.8 84.6
Welfare services 79.4 54.4 82.6
Counselling for persons with disability 55.4 43.6 79.4
Counselling for parent/family 55.9 43.6 76.7
Educational services 55.7 52.9 72.4
Medical rehabilitation 60.5 48.8 69.1
Assistive devices services 57.3 55.1 68.1
Traditional healer/faith healer 36.5 61.9 65.5
Health information 71.5 65.5 56.1
Health services 80.4 74.1 48.1
---------------------------------------------------------------------------------------------------------------------- 1Percentage of those who needed a service who actually accessed it
The different services in Table 25 are organized with the highest gap as the first service
and then the others in descending order. In this data material, gaps are generally very
high, with more than two thirds of those who need eight out of eleven services report
that they needed the service but had not accessed it. Even the gap for the three last
services is high, with almost half of those who need health services claiming not to have
accessed it. Controlling for urban/rural and gender revealed small differences in service
gap, but with a tendency for larger service gaps in rural areas.
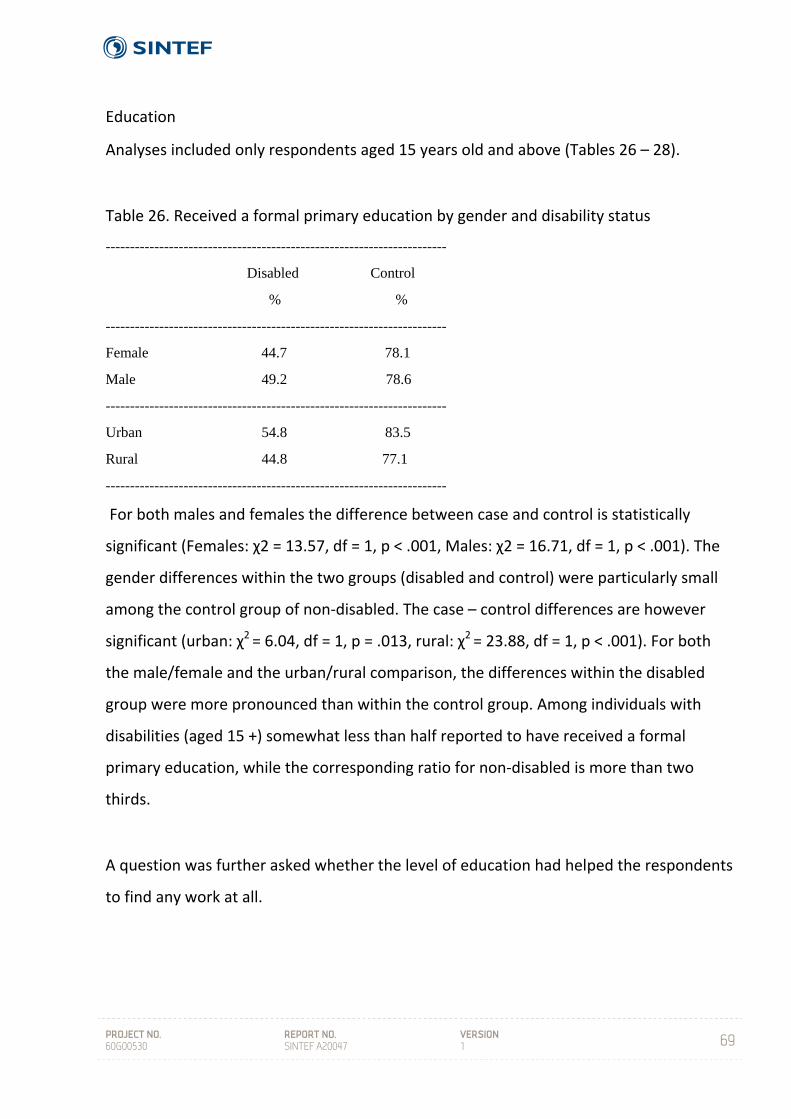
PROJECT NO. 60G00530
REPORT NO. SINTEF A20047
VERSION 1
69
Education
Analyses included only respondents aged 15 years old and above (Tables 26 – 28).
Table 26. Received a formal primary education by gender and disability status
----------------------------------------------------------------------
Disabled Control
% %
----------------------------------------------------------------------
Female 44.7 78.1
Male 49.2 78.6
----------------------------------------------------------------------
Urban 54.8 83.5
Rural 44.8 77.1
----------------------------------------------------------------------
For both males and females the difference between case and control is statistically
significant (Females: χ2 = 13.57, df = 1, p < .001, Males: χ2 = 16.71, df = 1, p < .001). The
gender differences within the two groups (disabled and control) were particularly small
among the control group of non‐disabled. The case – control differences are however
significant (urban: χ2 = 6.04, df = 1, p = .013, rural: χ2 = 23.88, df = 1, p < .001). For both
the male/female and the urban/rural comparison, the differences within the disabled
group were more pronounced than within the control group. Among individuals with
disabilities (aged 15 +) somewhat less than half reported to have received a formal
primary education, while the corresponding ratio for non‐disabled is more than two
thirds.
A question was further asked whether the level of education had helped the respondents
to find any work at all.
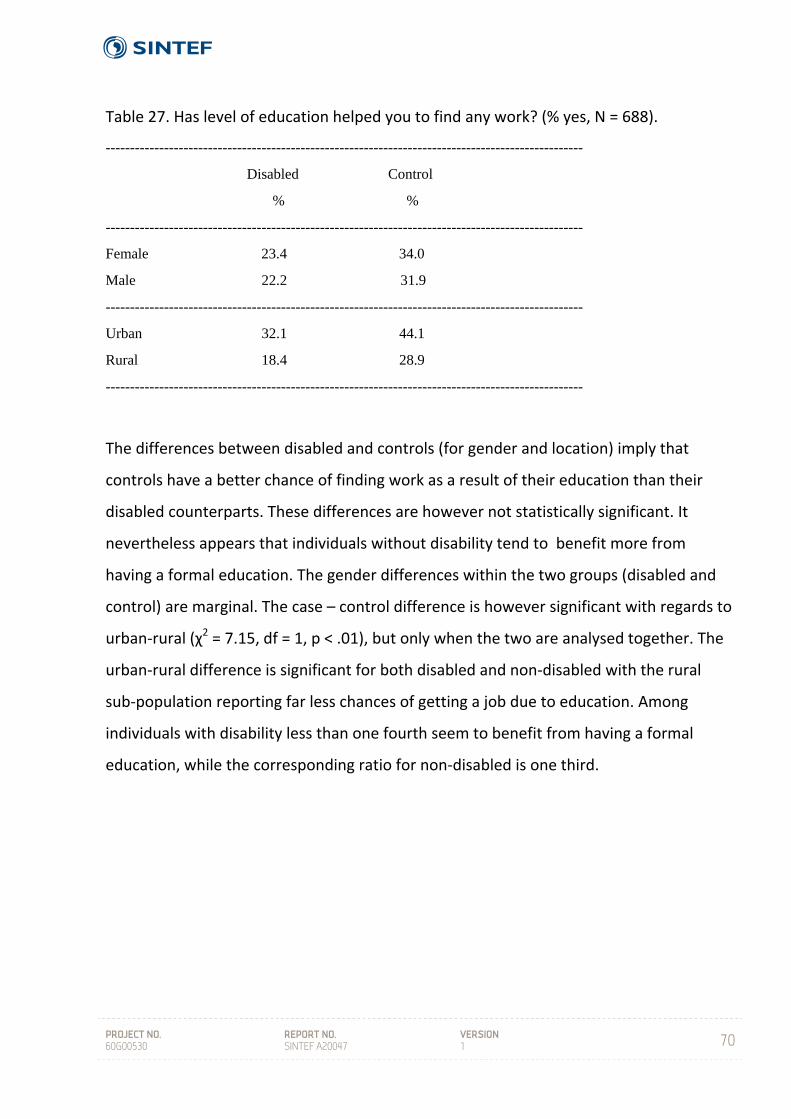
PROJECT NO. 60G00530
REPORT NO. SINTEF A20047
VERSION 1
70
Table 27. Has level of education helped you to find any work? (% yes, N = 688).
--------------------------------------------------------------------------------------------------
Disabled Control
% %
--------------------------------------------------------------------------------------------------
Female 23.4 34.0
Male 22.2 31.9
--------------------------------------------------------------------------------------------------
Urban 32.1 44.1
Rural 18.4 28.9
--------------------------------------------------------------------------------------------------
The differences between disabled and controls (for gender and location) imply that
controls have a better chance of finding work as a result of their education than their
disabled counterparts. These differences are however not statistically significant. It
nevertheless appears that individuals without disability tend to benefit more from
having a formal education. The gender differences within the two groups (disabled and
control) are marginal. The case – control difference is however significant with regards to
urban‐rural (χ2 = 7.15, df = 1, p < .01), but only when the two are analysed together. The
urban‐rural difference is significant for both disabled and non‐disabled with the rural
sub‐population reporting far less chances of getting a job due to education. Among
individuals with disability less than one fourth seem to benefit from having a formal
education, while the corresponding ratio for non‐disabled is one third.

PROJECT NO. 60G00530
REPORT NO. SINTEF A20047
VERSION 1
71
Table 28. Did you study as far as planned? (> 15 years) (% yes, N = 669)
--------------------------------------------------------------------------------------------------
Disabled Control
% %
--------------------------------------------------------------------------------------------------
Female 8.8 15.4
Male 8.5 12.2
--------------------------------------------------------------------------------------------------
Urban 14.3 18.4
Rural 6.4 11.8
-------------------------------------------------------------------------------------------------
The differences between disabled and non‐disabled on this question are not statistically
significant, but there is a tendency for controls to confirm that they studied as far as
planes to a larger degree than disabled. Apparently, the large majority do not achieve
according to own expectations in the educational system.

PROJECT NO. 60G00530
REPORT NO. SINTEF A20047
VERSION 1
72
Employment
Respondents with and without disability aged 15 years and above were asked if they
were currently working. Currently working includes casual labour, part‐time work and
those who were self‐employed.
Table 29. Current employment status, by disability status (% of N) (NF = 454, NM = 676)
NR = 855, NU = 269)
----------------------------------------------------------------------------------------------------------------------
Currently working Disabled Control Total
M F M F M F
----------------------------------------------------------------------------------------------------------------------
Yes 8.4 4.5 31.7 28.9 19.4 15.9
----------------------------------------------------------------------------------------------------------------------
R U R U R U
-----------------------------------------------------------------------------------------------------------------------
Yes 4.9 13.1 24.6 49.2 14.2 29.7
---------------------------------------------------------------------------------------------------------------------
Those who did not respond "yes" in Table 29 covered the reasons "never been
employed", "have been employed before", and "housewife/homemaker". The difference
between disabled and controls is significant for both males and females (χ2 = 14.06, df =
1, p < .001, and χ2 = 11.75, df = 1, p < .001 respectively). Individuals with disability report
substantially less work experience than non‐disabled (controls), and a much higher
proportion have never been employed. Gender differences within groups (disabled and
control) are not significant. The difference between urban and rural is further near
significant for disabled and significant for controls (disabled: χ2 = 3.78, df = 1, p = .065,
controls: χ2 = 6.00, df = 1, p = .015). The least employed are the rural disabled, while the
urban controls have the highest level of current employment. Among individuals with
disability, around two thirds have never been employed, while the corresponding
proportion for controls is slightly less than half.
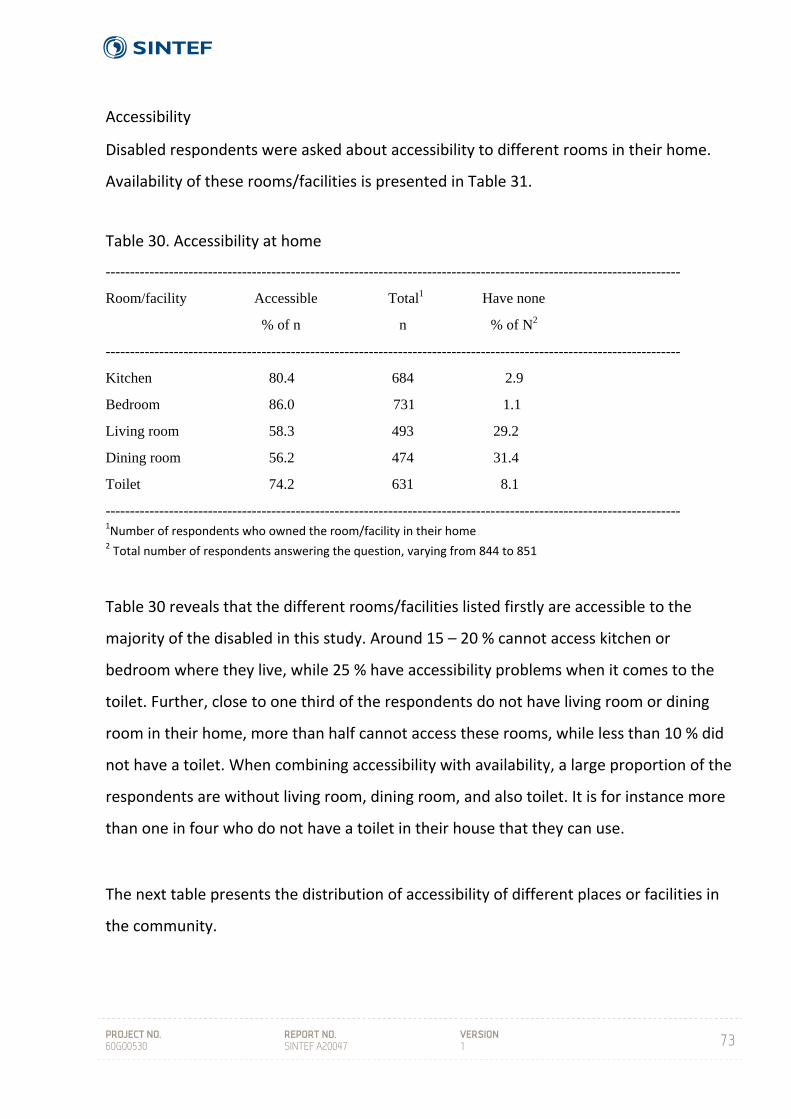
PROJECT NO. 60G00530
REPORT NO. SINTEF A20047
VERSION 1
73
Accessibility
Disabled respondents were asked about accessibility to different rooms in their home.
Availability of these rooms/facilities is presented in Table 31.
Table 30. Accessibility at home
----------------------------------------------------------------------------------------------------------------------
Room/facility Accessible Total1 Have none
% of n n % of N2
----------------------------------------------------------------------------------------------------------------------
Kitchen 80.4 684 2.9
Bedroom 86.0 731 1.1
Living room 58.3 493 29.2
Dining room 56.2 474 31.4
Toilet 74.2 631 8.1
---------------------------------------------------------------------------------------------------------------------- 1Number of respondents who owned the room/facility in their home 2 Total number of respondents answering the question, varying from 844 to 851
Table 30 reveals that the different rooms/facilities listed firstly are accessible to the
majority of the disabled in this study. Around 15 – 20 % cannot access kitchen or
bedroom where they live, while 25 % have accessibility problems when it comes to the
toilet. Further, close to one third of the respondents do not have living room or dining
room in their home, more than half cannot access these rooms, while less than 10 % did
not have a toilet. When combining accessibility with availability, a large proportion of the
respondents are without living room, dining room, and also toilet. It is for instance more
than one in four who do not have a toilet in their house that they can use.
The next table presents the distribution of accessibility of different places or facilities in
the community.
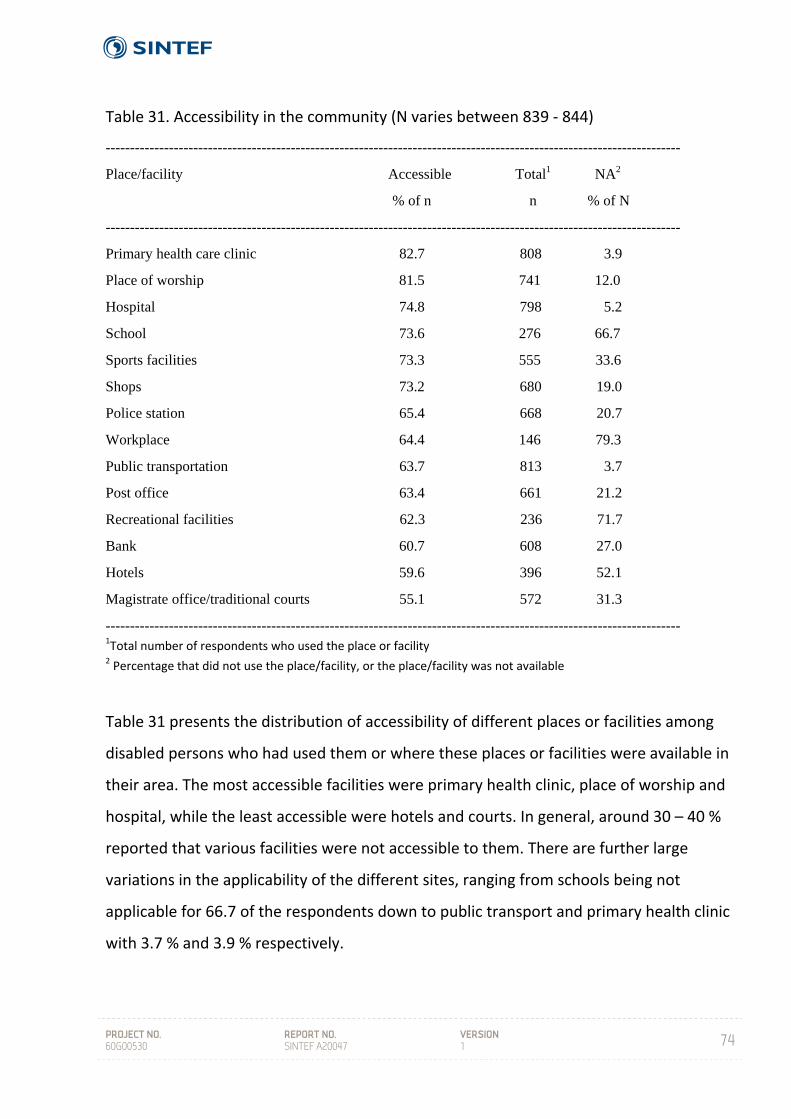
PROJECT NO. 60G00530
REPORT NO. SINTEF A20047
VERSION 1
74
Table 31. Accessibility in the community (N varies between 839 ‐ 844)
----------------------------------------------------------------------------------------------------------------------
Place/facility Accessible Total1 NA2
% of n n % of N
----------------------------------------------------------------------------------------------------------------------
Primary health care clinic 82.7 808 3.9
Place of worship 81.5 741 12.0
Hospital 74.8 798 5.2
School 73.6 276 66.7
Sports facilities 73.3 555 33.6
Shops 73.2 680 19.0
Police station 65.4 668 20.7
Workplace 64.4 146 79.3
Public transportation 63.7 813 3.7
Post office 63.4 661 21.2
Recreational facilities 62.3 236 71.7
Bank 60.7 608 27.0
Hotels 59.6 396 52.1
Magistrate office/traditional courts 55.1 572 31.3
---------------------------------------------------------------------------------------------------------------------- 1Total number of respondents who used the place or facility 2 Percentage that did not use the place/facility, or the place/facility was not available
Table 31 presents the distribution of accessibility of different places or facilities among
disabled persons who had used them or where these places or facilities were available in
their area. The most accessible facilities were primary health clinic, place of worship and
hospital, while the least accessible were hotels and courts. In general, around 30 – 40 %
reported that various facilities were not accessible to them. There are further large
variations in the applicability of the different sites, ranging from schools being not
applicable for 66.7 of the respondents down to public transport and primary health clinic
with 3.7 % and 3.9 % respectively.
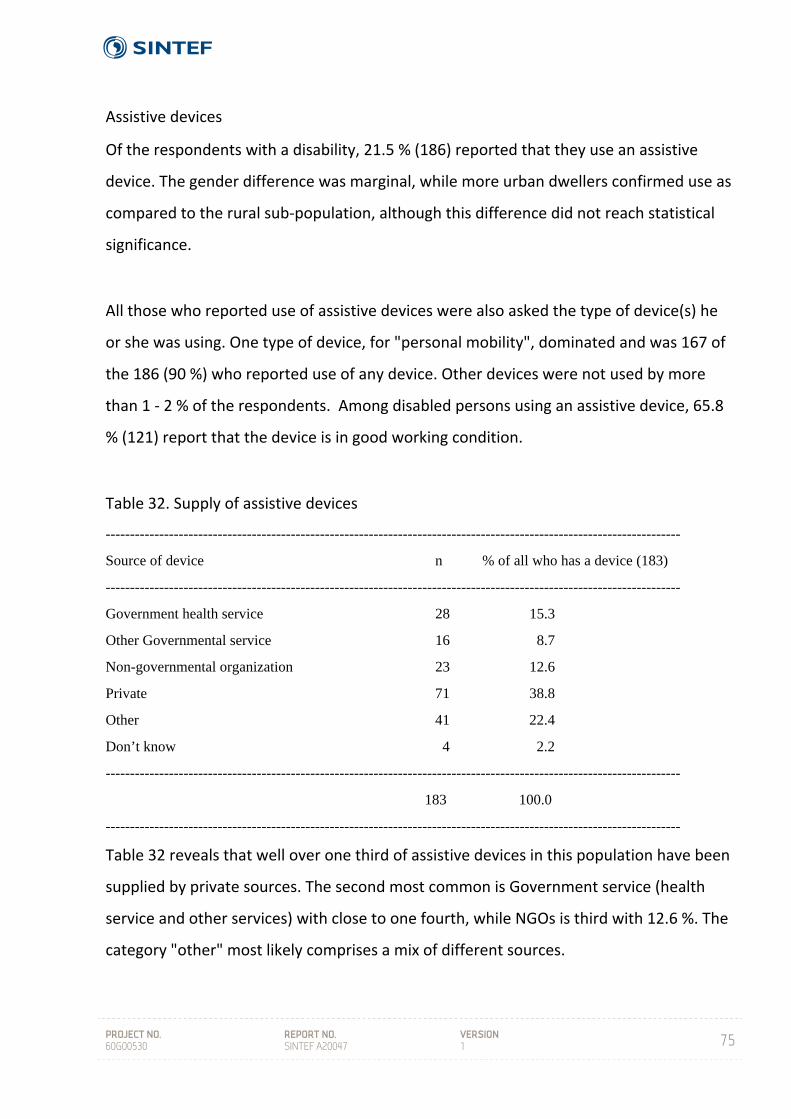
PROJECT NO. 60G00530
REPORT NO. SINTEF A20047
VERSION 1
75
Assistive devices
Of the respondents with a disability, 21.5 % (186) reported that they use an assistive
device. The gender difference was marginal, while more urban dwellers confirmed use as
compared to the rural sub‐population, although this difference did not reach statistical
significance.
All those who reported use of assistive devices were also asked the type of device(s) he
or she was using. One type of device, for "personal mobility", dominated and was 167 of
the 186 (90 %) who reported use of any device. Other devices were not used by more
than 1 ‐ 2 % of the respondents. Among disabled persons using an assistive device, 65.8
% (121) report that the device is in good working condition.
Table 32. Supply of assistive devices
----------------------------------------------------------------------------------------------------------------------
Source of device n % of all who has a device (183)
----------------------------------------------------------------------------------------------------------------------
Government health service 28 15.3
Other Governmental service 16 8.7
Non-governmental organization 23 12.6
Private 71 38.8
Other 41 22.4
Don’t know 4 2.2
----------------------------------------------------------------------------------------------------------------------
183 100.0
----------------------------------------------------------------------------------------------------------------------
Table 32 reveals that well over one third of assistive devices in this population have been
supplied by private sources. The second most common is Government service (health
service and other services) with close to one fourth, while NGOs is third with 12.6 %. The
category "other" most likely comprises a mix of different sources.

PROJECT NO. 60G00530
REPORT NO. SINTEF A20047
VERSION 1
76
Concerning maintenance of the devices, the answers grouped largely into three: Self‐
repair/maintenance with approximately one third (34.4 %), no maintenance was
reported by more than one fourth (27.8 %), and family members were reported by one
fifth (20.7 %). Basically this implies that for the large part, those who supply assistive
devices do not maintain them, and that this is left to the individual device owner/user to
sort out by him or herself.
The respondents were also asked to assess the information or help/training they had
been given on how to use the device(s). As many as 42.4 % stated that they had not
received any information/training, approximately one third (34.2 %) had received some
information, while 29.6 % reported complete/full information.
Table 33. Level of satisfaction with assistive device (n = 179)
----------------------------------------------------------------------------------------------------------------------
Level of Female Male Total
satisfaction % % %
----------------------------------------------------------------------------------------------------------------------
Very content 31.5 34.9 33.5
Content 39.7 42.5 41.3
Less content 20.5 16.0 17.9
Not content 8.2 6.6 7.3 ----------------------------------------------------------------------------------------------------------------------
Table 33 reveals small and insignificant gender differences. Around one fourth (25.2 %)
are less content or not content, while the large majority are content or very content with
their assistive device.
Assistance in daily life activities
The need for assistance in carrying out daily life activities may vary with gender, age and
severity of disability. In Table 34 below, the basis for the calculation are individuals who
answered “yes”, “no” or “sometimes”. “Not applicable” as a response category was

PROJECT NO. 60G00530
REPORT NO. SINTEF A20047
VERSION 1
77
coded as missing, explaining for instance the low n on studying, which clearly is relevant
only for a certain segment of the population.
Table 34. Assistance needed in daily life activities (% of n)
------------------------------------------------------------------------------------------ Activity n Yes Sometime No ------------------------------------------------------------------------------------------ Emotional support 773 69.2 16.6 14.2
Finances 796 62.4 17.7 19.8
Cooking 800 54.5 18.5 27.0
Transport 789 50.6 19.3 30.2
Shopping 805 49.4 24.5 26.1
Studying 278 33.8 21.6 44.6
Bathing 845 24.6 12.5 62.8
Dressing 846 23.0 14.7 62.3
Moving around 839 20.1 13.2 66.6
Toileting 845 19.1 7.2 73.7
Eating/feeding 844 12.8 5.9 81.3
------------------------------------------------------------------------------------------
Among the daily life activities in Table 34, the highest ranked (more assistance needed)
are activities that all require social engagement in one way or another. On the other
hand, all the lowest ranked but one (moving around) are directly related to personal
care. The results also show that the need for emotional support is ranked highest and
even above financial support which is a strong signal in a poor population. No gender
differences were identified.
All variables in Table 34 were included in an additive scale with values 1 (no), 2
(sometime), and 3 (yes) on single items. This yielded a scale with min/max values being
12/36, mean 18.7, St. dev. 6.07 and skewness .78. The scale was included in a regression
model with age, gender and severity of disability as predictors.
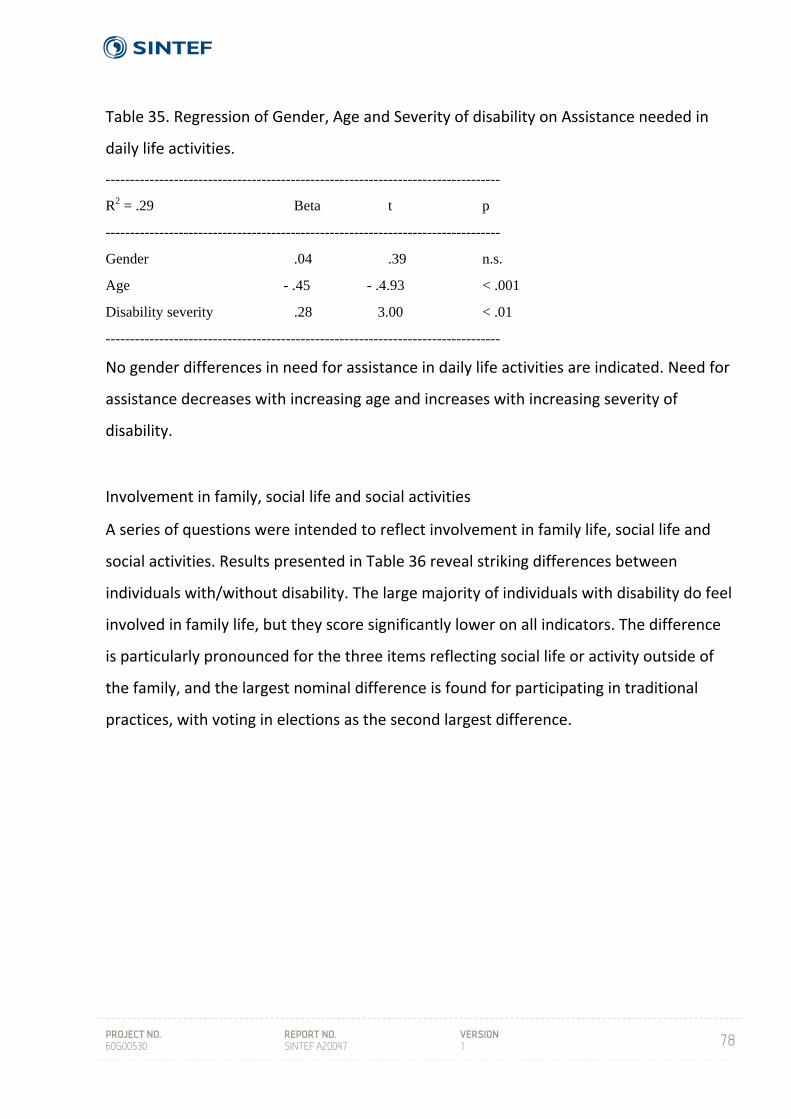
PROJECT NO. 60G00530
REPORT NO. SINTEF A20047
VERSION 1
78
Table 35. Regression of Gender, Age and Severity of disability on Assistance needed in
daily life activities.
---------------------------------------------------------------------------------
R2 = .29 Beta t p
---------------------------------------------------------------------------------
Gender .04 .39 n.s.
Age - .45 - .4.93 < .001
Disability severity .28 3.00 < .01
---------------------------------------------------------------------------------
No gender differences in need for assistance in daily life activities are indicated. Need for
assistance decreases with increasing age and increases with increasing severity of
disability.
Involvement in family, social life and social activities
A series of questions were intended to reflect involvement in family life, social life and
social activities. Results presented in Table 36 reveal striking differences between
individuals with/without disability. The large majority of individuals with disability do feel
involved in family life, but they score significantly lower on all indicators. The difference
is particularly pronounced for the three items reflecting social life or activity outside of
the family, and the largest nominal difference is found for participating in traditional
practices, with voting in elections as the second largest difference.
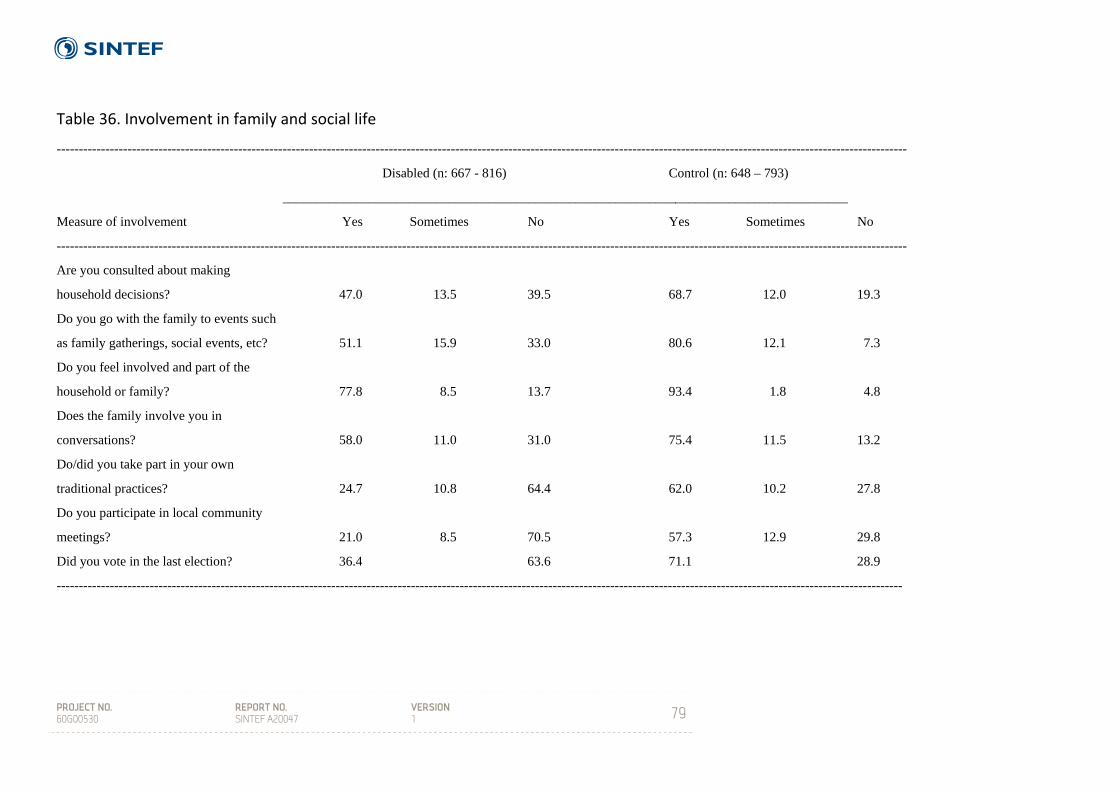
PROJECT NO. 60G00530
REPORT NO. SINTEF A20047
VERSION 1
79
Table 36. Involvement in family and social life
------------------------------------------------------------------------------------------------------------------------------------------------------------------------------------------------
Disabled (n: 667 - 816) Control (n: 648 – 793)
_____________________________________________________________________________________
Measure of involvement Yes Sometimes No Yes Sometimes No
------------------------------------------------------------------------------------------------------------------------------------------------------------------------------------------------
Are you consulted about making
household decisions? 47.0 13.5 39.5 68.7 12.0 19.3
Do you go with the family to events such
as family gatherings, social events, etc? 51.1 15.9 33.0 80.6 12.1 7.3
Do you feel involved and part of the
household or family? 77.8 8.5 13.7 93.4 1.8 4.8
Does the family involve you in
conversations? 58.0 11.0 31.0 75.4 11.5 13.2
Do/did you take part in your own
traditional practices? 24.7 10.8 64.4 62.0 10.2 27.8
Do you participate in local community
meetings? 21.0 8.5 70.5 57.3 12.9 29.8
Did you vote in the last election? 36.4 63.6 71.1 28.9
-----------------------------------------------------------------------------------------------------------------------------------------------------------------------------------------------
PROJECT NO. 60G00530
REPORT NO. SINTEF A20047
VERSION 1
80
Individuals with disability were also asked whether they knew about any organizations for
disabled people (DPOs) and if they were a member. Concerning the first question, the large
majority (84.4 %) were not aware of any DPO. An even larger majority (95.6 %) reported
not to be member of a DPO. Males tended to have lower awareness and were less inclined
to membership. The major finding here is very low awareness and membership. Both
awareness and membership were higher in urban areas, largely due to higher awareness
among women and more urban men being members.
General health
Assessment of general well‐being was done using a standardized 12 – item General Health
Questionnaire (GHQ – 12) (Goldberg & Williams 1988). A standard (Likert) scoring
procedure was applied with the GHQ – 12 scale, with item scores ranging from 0 to 3 and
with higher scores representing higher psychological distress. Mean value on the scale was
10.90, standard deviation 6.72, and range 0 – 36). In addition two general questions on
personal assessment of physical and mental health were asked. The GHQ – 12 is
constructed to detect psychiatric disorders in community settings and non‐psychiatric
clinical settings, such as primary care or general practice, and is a general measure
reflecting anxiety and depression.
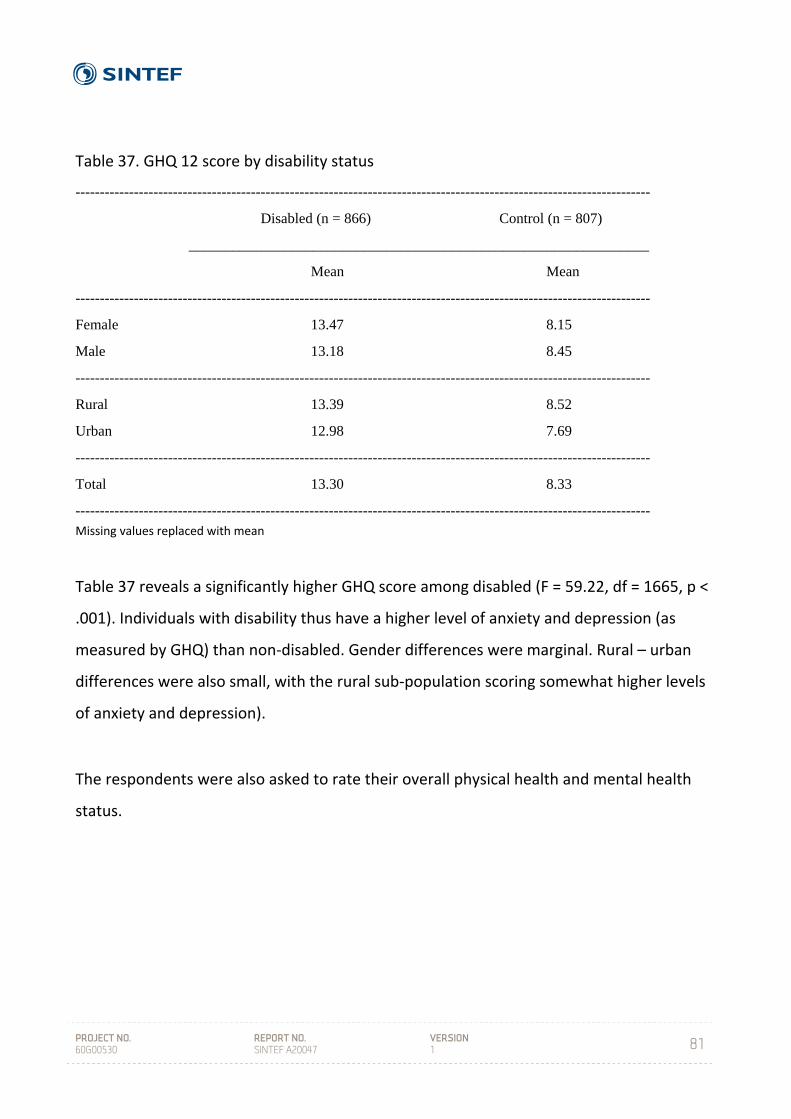
PROJECT NO. 60G00530
REPORT NO. SINTEF A20047
VERSION 1
81
Table 37. GHQ 12 score by disability status
----------------------------------------------------------------------------------------------------------------------
Disabled (n = 866) Control (n = 807)
_______________________________________________________________
Mean Mean
----------------------------------------------------------------------------------------------------------------------
Female 13.47 8.15
Male 13.18 8.45
----------------------------------------------------------------------------------------------------------------------
Rural 13.39 8.52
Urban 12.98 7.69
----------------------------------------------------------------------------------------------------------------------
Total 13.30 8.33
---------------------------------------------------------------------------------------------------------------------- Missing values replaced with mean
Table 37 reveals a significantly higher GHQ score among disabled (F = 59.22, df = 1665, p <
.001). Individuals with disability thus have a higher level of anxiety and depression (as
measured by GHQ) than non‐disabled. Gender differences were marginal. Rural – urban
differences were also small, with the rural sub‐population scoring somewhat higher levels
of anxiety and depression).
The respondents were also asked to rate their overall physical health and mental health
status.
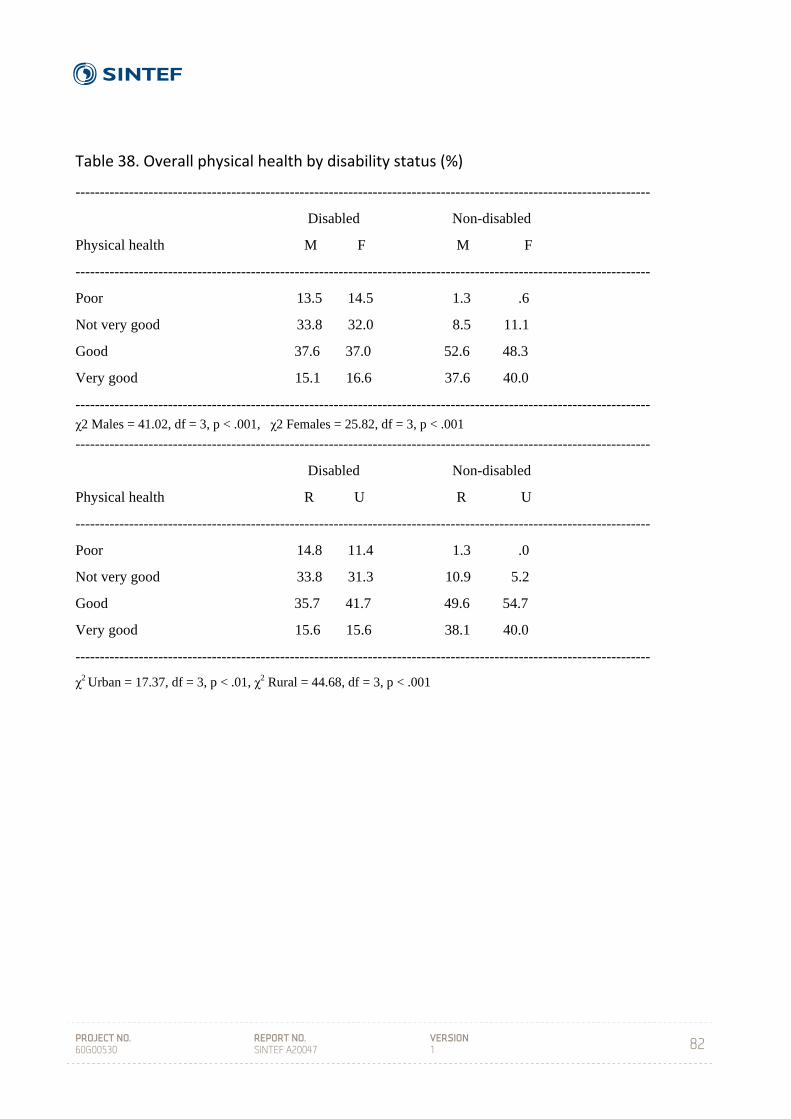
PROJECT NO. 60G00530
REPORT NO. SINTEF A20047
VERSION 1
82
Table 38. Overall physical health by disability status (%)
----------------------------------------------------------------------------------------------------------------------
Disabled Non-disabled
Physical health M F M F
----------------------------------------------------------------------------------------------------------------------
Poor 13.5 14.5 1.3 .6
Not very good 33.8 32.0 8.5 11.1
Good 37.6 37.0 52.6 48.3
Very good 15.1 16.6 37.6 40.0
---------------------------------------------------------------------------------------------------------------------- χ2 Males = 41.02, df = 3, p < .001, χ2 Females = 25.82, df = 3, p < .001
----------------------------------------------------------------------------------------------------------------------
Disabled Non-disabled
Physical health R U R U
----------------------------------------------------------------------------------------------------------------------
Poor 14.8 11.4 1.3 .0
Not very good 33.8 31.3 10.9 5.2
Good 35.7 41.7 49.6 54.7
Very good 15.6 15.6 38.1 40.0
----------------------------------------------------------------------------------------------------------------------
χ2 Urban = 17.37, df = 3, p < .01, χ2 Rural = 44.68, df = 3, p < .001

PROJECT NO. 60G00530
REPORT NO. SINTEF A20047
VERSION 1
83
Table 39. Overall mental health by disability status (%)
----------------------------------------------------------------------------------------------------------------------
Disabled Non-disabled
Mental health M F M F
----------------------------------------------------------------------------------------------------------------------
Poor 13.3 14.8 1.1 .6
Not very good 38.7 31.1 5.1 6.2
Good 34.1 39.3 58.0 49.5
Very good 13.9 14.8 35.9 43.7
---------------------------------------------------------------------------------------------------------------------- χ2 Males = 56.56, df = 3, p < .001, χ2 Females = 34.34, df = 3, p < .001
----------------------------------------------------------------------------------------------------------------------
Disabled Non-disabled
Mental health R U R U
----------------------------------------------------------------------------------------------------------------------
Poor 15.6 9.0 1.2 .0
Not very good 36.4 33.3 7.1 .5
Good 34.9 39.5 54.2 55.7
Very good 13.0 14.8 37.5 43.8
----------------------------------------------------------------------------------------------------------------------
χ2 Urban = 23.55, df = 3, p < .001, χ2 Rural = 67.77, df = 3, p < .001
----------------------------------------------------------------------------------------------------------------------
Individuals with disability rate both their physical and mental health to be poorer than
their non‐disabled counterparts, and this difference is significant for both men and
women, as well as for the urban and the rural sub‐population. A majority of disabled rate
their mental health to be “not very good” or “poor”, while the corresponding figures for
the controls are in the area of 6 – 8 %. These are substantial differences in subjective
health. While gender differences within groups (disabled/ non‐disabled) appear to be
small, the differences between urban and rural among disabled and non‐disabled
respectively are pronounced. The rural sub‐population rate their physical and mental
health as being clearly poorer than among their urban counterparts.

PROJECT NO. 60G00530
REPORT NO. SINTEF A20047
VERSION 1
84
Table 40. Knowledge about some common diseases (% of n)
----------------------------------------------------------------------------------------------------------------------
Do you have any Did you experience Have you ever
knowledge about any problems under- had this disease?
this disease? standing/obtaining
information about
this disease?
---------------------------------------------------------------------------------------------------------------------------
% yes % yes % yes
Disabled Non-disabled Disabled Non-disabled Disabled Non-
Disease disabled
--------------------------------------------------------------------------------------------------------------------------
HIV/AIDS 59.3 86.5 26.0 25.7 9.5 6.4
Malaria 49.3 74.8 25.1 19.3 8.0 7.3
TB 56.2 78.8 27.6 21.6 9.7 9.5
Diabetes 47.1 68.8 31.1 24.6 8.8 5.8
--------------------------------------------------------------------------------------------------------------------------
With regards to knowledge about the four common diseases, a consistent pattern emerges
in that individuals with disability report significantly less knowledge than non‐disabled,
with the gap in percentage being from 17 to 25. The most common diseases are known to
approximately half of the disabled sample.
When asked to assess problems understanding and obtaining information about the
diseases, for three out of the four diseases individuals with disability report slightly more
problems than non‐disabled, with HIV/AIDS being the exception. More than 25 % of
disabled report that they have problems obtaining or understanding such information,
while the corresponding figure for non‐disabled is around 20 %.
Respondents were asked to report whether they were infected of the four diseases. Firstly,
differences between the two groups are small. However, it is worth noting that individuals
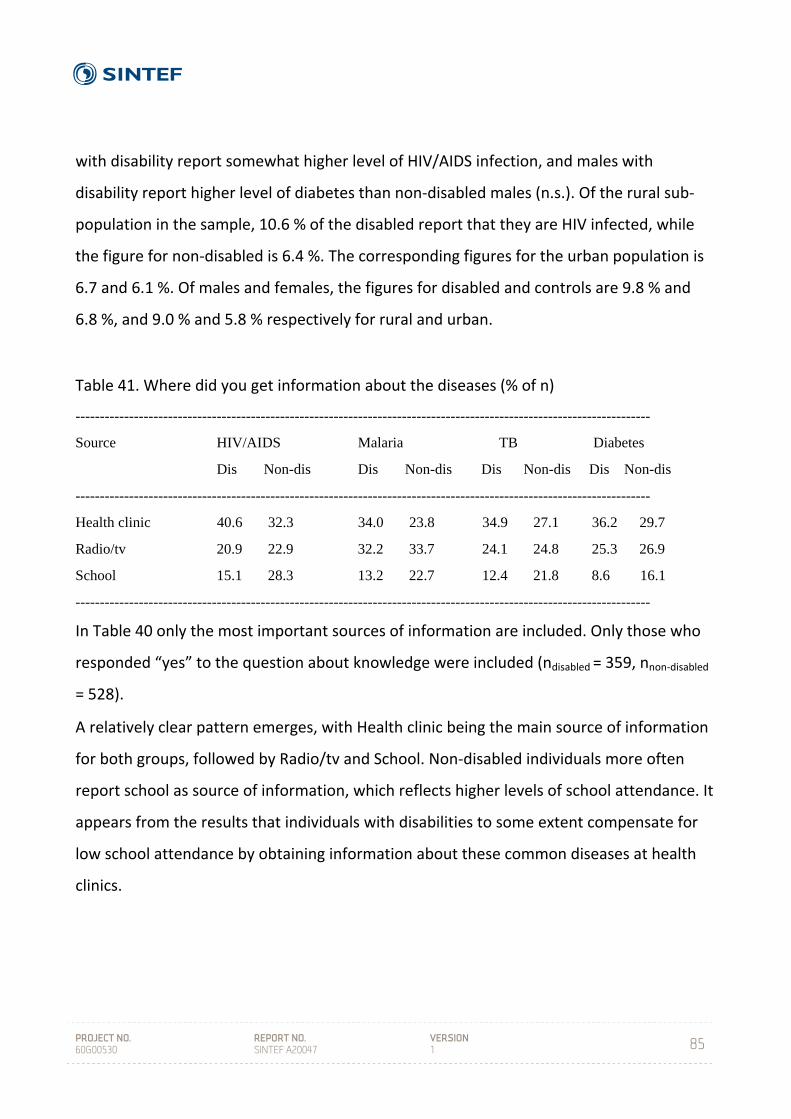
PROJECT NO. 60G00530
REPORT NO. SINTEF A20047
VERSION 1
85
with disability report somewhat higher level of HIV/AIDS infection, and males with
disability report higher level of diabetes than non‐disabled males (n.s.). Of the rural sub‐
population in the sample, 10.6 % of the disabled report that they are HIV infected, while
the figure for non‐disabled is 6.4 %. The corresponding figures for the urban population is
6.7 and 6.1 %. Of males and females, the figures for disabled and controls are 9.8 % and
6.8 %, and 9.0 % and 5.8 % respectively for rural and urban.
Table 41. Where did you get information about the diseases (% of n)
----------------------------------------------------------------------------------------------------------------------
Source HIV/AIDS Malaria TB Diabetes
Dis Non-dis Dis Non-dis Dis Non-dis Dis Non-dis
----------------------------------------------------------------------------------------------------------------------
Health clinic 40.6 32.3 34.0 23.8 34.9 27.1 36.2 29.7
Radio/tv 20.9 22.9 32.2 33.7 24.1 24.8 25.3 26.9
School 15.1 28.3 13.2 22.7 12.4 21.8 8.6 16.1
----------------------------------------------------------------------------------------------------------------------
In Table 40 only the most important sources of information are included. Only those who
responded “yes” to the question about knowledge were included (ndisabled = 359, nnon‐disabled
= 528).
A relatively clear pattern emerges, with Health clinic being the main source of information
for both groups, followed by Radio/tv and School. Non‐disabled individuals more often
report school as source of information, which reflects higher levels of school attendance. It
appears from the results that individuals with disabilities to some extent compensate for
low school attendance by obtaining information about these common diseases at health
clinics.
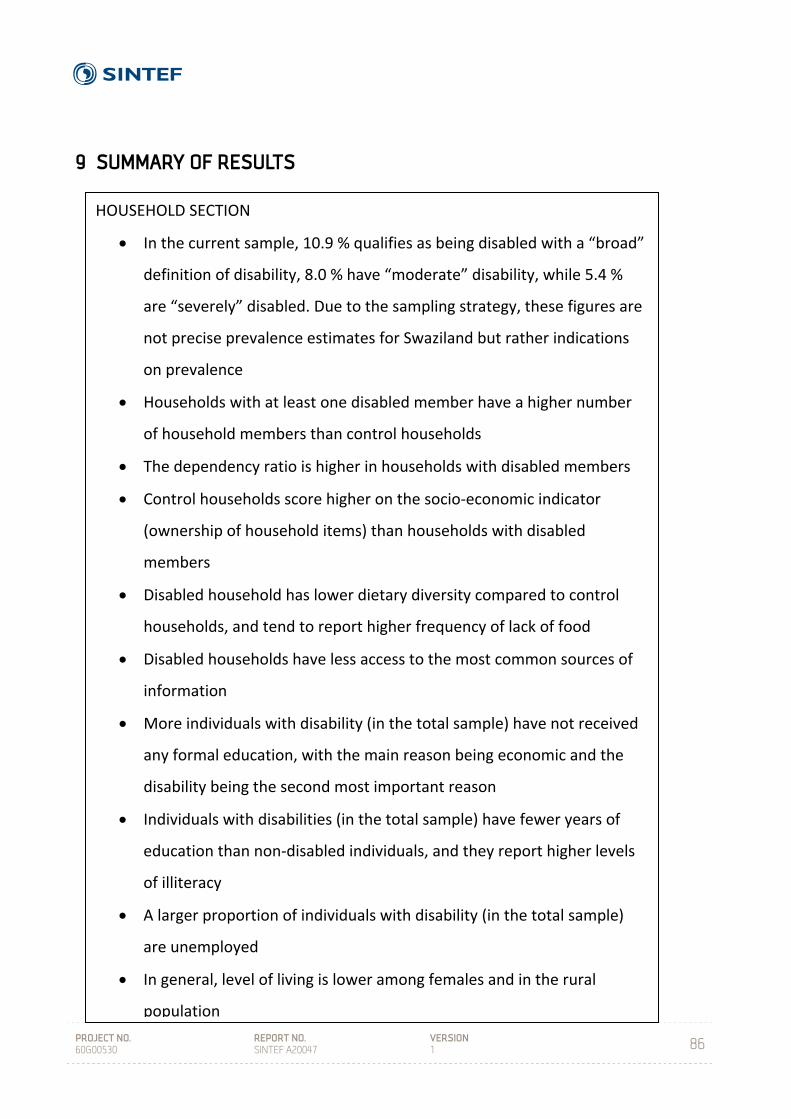
PROJECT NO. 60G00530
REPORT NO. SINTEF A20047
VERSION 1
86
9 SUMMARY OF RESULTS
HOUSEHOLD SECTION
In the current sample, 10.9 % qualifies as being disabled with a “broad”
definition of disability, 8.0 % have “moderate” disability, while 5.4 %
are “severely” disabled. Due to the sampling strategy, these figures are
not precise prevalence estimates for Swaziland but rather indications
on prevalence
Households with at least one disabled member have a higher number
of household members than control households
The dependency ratio is higher in households with disabled members
Control households score higher on the socio‐economic indicator
(ownership of household items) than households with disabled
members
Disabled household has lower dietary diversity compared to control
households, and tend to report higher frequency of lack of food
Disabled households have less access to the most common sources of
information
More individuals with disability (in the total sample) have not received
any formal education, with the main reason being economic and the
disability being the second most important reason
Individuals with disabilities (in the total sample) have fewer years of
education than non‐disabled individuals, and they report higher levels
of illiteracy
A larger proportion of individuals with disability (in the total sample)
are unemployed
In general, level of living is lower among females and in the rural
population
PROJECT NO. 60G00530
REPORT NO. SINTEF A20047
VERSION 1
87
….INDIVIDUAL SECTION….
Of the different disability types applied in the Washington City Group
screening instrument, mobility is the most prevalent (more than 50 %),
followed by Remembering/Concentrating (almost 50 %), Self‐care
(more than one third), Communication, Vision, and Hearing.
The major cause of disability is reported to be “From birth/Congenital”,
followed by “Disease/Illness. These two account for more than two
thirds of individuals with disability
More than one in six males with disability have experienced being
beaten or scolded because of their disability, while this figure is
somewhat lower for women
Gaps in services (proportion of those who needed a service and did not
access the service) are generally very high with the largest gaps found
for Vocational training, Legal advice and Welfare services, and the
smallest gaps found for Health services, Health information and
Traditional healer.
Close to half of individuals with disability have not received a formal
primary education, while the corresponding figure for non‐disabled is
somewhat above one in four
Individuals with disability report substantially less work experience than
non‐disabled, and a much higher proportion have never been employed
Around 30 – 40 % of individuals with disability report that various
facilities were not accessible to them
One fifth of individuals with disability use an assistive device, provision
of devices are largely from the private/NGO sector, four out of ten had
not received any instruction on use of the devices, and maintenance is
largely left to the individual/family
PROJECT NO. 60G00530
REPORT NO. SINTEF A20047
VERSION 1
88
INDIVIDUAL SECTION (continued)
Among daily life activities, individuals with disability need more
assistance with activities that require social engagement, and with
emotional support as the highest ranked
The large majority of individuals with disability report that they are
involved in family life, but they score significantly lower on a number of
indicators. The difference is particularly pronounced with regards to
social life or activity outside of the family
Individuals with disability have higher levels of anxiety and depression
as compared to non‐disabled
Somewhat less than half of individuals with disability rate their physical
and mental health to be “not very good” or “poor”
Individuals with disability rate both their physical and their mental
health to be poorer than their non‐disabled counterparts
Individuals with disability report significantly less knowledge about
some common diseases, and more than one in four of the disabled
report that they have problems obtaining or understanding health
information
Differences between the two groups (disabled and non‐disabled) are in
general small with regards to self‐reported diseases, but individuals
with disability report higher levels of HIV/AIDS infection and males with
disability report higher level of diabetes than non‐disabled males
PROJECT NO. 60G00530
REPORT NO. SINTEF A20047
VERSION 1
89
10 DISCUSSION
Arne H Eide
A national, representative study on living conditions among people with disabilities has
been carried out in Swaziland in 2009 – 2011. This report brings some of the key results
from this study. LNFOD, FFO, and SINTEF have, in collaboration with Central Statistical
Office and other public bodies and institutions in Swaziland as well as SAFOD as a regional
disability organization, established the first generation of data about individuals with
disabilities and their households in the country. The data base also comprises a sample of
non‐disabled, which provides a basis for comparing between disabled and non‐disabled.
Having established evidence for differences between disabled and non‐disabled is an
important step in the promotion of human rights and improved level of living among
individuals with disability. The study offers an opportunity for boosting advocacy, for
setting priorities, for assessing impact and developing policies, for monitoring the
situation, and for increased knowledge among disabled and the public in general.
The study, which follows similar studies in Namibia, Zimbabwe, Malawi, Zambia,
Mozambique and Lesotho, also adds to a growing body of information on the situation
among people with disabilities in the southern Africa region. The regional data base
provides opportunities for comparing between countries and across the region and may be
a vehicle for sharing of experiences and build capacity in the region to improve the
situation for people with disabilities. In the long run this can contribute to implement the
new Convention on the Rights of Disabled People (UN 2006) which has been signed and
ratified by several of the countries.
A particular feature of this and the preceding studies is the broad inclusion of individuals
with disabilities in all stages of the research process, and the position of disabled people’s
PROJECT NO. 60G00530
REPORT NO. SINTEF A20047
VERSION 1
90
organizations (DPOs) in initiating and controlling the research and it’s future application.
Including individuals with disabilities as interviewers have reduced the threshold for
individuals with disabilities and their families to come out with information, and it has
proven that disabled are contributing members of society when given a chance to be so.
Our experience from neighboring countries implies that this will yield a stronger, more
experienced organization with improved standing nationally and in the region. It is
anticipated that the study will lead to a further development of the working relationship
between FODSWA, other disability organizations, and the relevant authorities in Swaziland.
The study and this report is also intended as a tool for policy makers, the ministries and
other public bodies that have particular responsibility for disability issues, and for
mainstreaming disability across different sectors. This requires that the disability
movement and relevant authorities utilize the opportunity provided by this report to
engage in a long‐term dialogue on how to translate research findings into action at
different levels in society.
An interesting feature of household composition that has been found also in the previous
studies is that households with disabled members tend to be larger than control
households. Further, the Dependency Ratio was also shown to be higher among
households with disabled members, reflecting more members at dependent age groups.
This implies higher burdens for households with disabled members as compared to control
households. As there are few services to support families and individuals with disabilities
living at home; practical, economic, social, emotional and other problems will to a large
extent have to be solved within the household itself. The studies of disability and poverty
by Ingstad & Grut in Kenya (2007) and Yemen (Grut & Ingstad 2006) provide some in‐depth
information about coping mechanisms at the household level.

PROJECT NO. 60G00530
REPORT NO. SINTEF A20047
VERSION 1
91
A main finding in the study is that households with disabled members and individuals with
disabilities score lower on a number of indicators of level of living conditions as compared
to households without disabled members or non‐disabled individuals. By and large, this
pattern in the data material from Swaziland parallels the pattern that has been observed in
the previous studies in the region. Bearing in mind the discussion around household
composition above, comparative analyses between household types do not take such
differences into account. Thus, the differences shown in this and previous reports will
underestimate the differences in living conditions at household level.
It has not been aimed in this study to find a precise estimate of disability prevalence in
Swaziland, and the results around prevalence as presented above should be interpreted
with care. Previous experience has however shown that using the disability screening
procedure developed by the Washington City Group on Disability Statistics will produce
higher prevalence rates as compared to other less sensitive and impairment based
questions. The results here confirm this, but also contribute to demonstrate that any
prevalence reflects the definition of disability that has been applied, and in this case:
where the cut‐off point between disabled and non‐disabled is set (see Loeb & Eide 2008
for further discussion).
Individuals with disability report substantially higher levels of mental health problems than
their non‐disabled counterparts, and need for emotional support score highest among
services needed in daily life. This confirms previous studies in the region and provides a
strong message that mental health and disability is an area for further research and
intervention. Several authors have underlined the absence of research and need for
attention to this problem in low‐income countries (e.g. Patel 2007).
PROJECT NO. 60G00530
REPORT NO. SINTEF A20047
VERSION 1
92
Also with regards to physical health, individuals with disability report substantially more
health problems than their non‐disabled counterparts. This is in contrast to the lack of
knowledge about some common diseases, where more than half report not to have any
information at all, and there is a slight tendency for individuals with disability to have
greater problems in obtaining and understanding health information. The results further
revealed substantial gaps in accessing different types of (health) services. We thus have a
situation in which the least healthy have most problems with knowledge and information
as well as accessibility problems. This indicates that the particular problems individuals
with disabilities may have in relation to health services need some urgent attention and
that particular efforts should be made to reduce these barriers. The results further indicate
that accessibility problems goes beyond these particular services and that also other
sectors need to consider accessibility problems. The evidence provided in this study may
form a good basis for pushing this in the right direction.
Education and employment are key elements in any measure of living conditions, and for
both indicators individuals with disability are worse off than others. The differences in
formal education and literacy may have different reasons, but it is an indication of either
discrimination or lack of awareness or both.
Direct and open discrimination and abuse is documented for among 20 % of individuals
with disability. More subtle forms of daily life discrimination or exclusion are however also
documented in particular with regards to traditional practices, local community meetings
and voting. The differences between disabled and non‐disabled on these indicators are
pronounced and there are also differences in the same direction with regards to other
indicators of family and social life. There may be different or rather a combination of
reasons for this, and the study does not provide results that can contribute to explain this
phenomenon. Most likely, the results indicate that exclusion of disabled takes different
PROJECT NO. 60G00530
REPORT NO. SINTEF A20047
VERSION 1
93
forms and can be found within the family, in the local community as well as in institutional
practices. While the current results may be utilized to counter discriminatory practices,
further research into this will be necessary in order to reveal causes and solutions to the
problems.
Assistive devices are important for many individuals to reduce barriers for an active daily
life and participation at home and in the local community. The proportion of disabled who
use an assistive device is approximately the same as in other countries in the region, and
this also goes for the information about supply with NGOs or other private sources as the
most important. Lack of maintenance and information are other problems revealed in this
study. Those who currently use a device are however largely happy with their device.
Gender and the urban‐rural dimension were included in most of the analyses, revealing
differences on several key indicators. Although gender and urban‐rural differences are not
confirmed on all indicators, the general picture is that the urban population is better off
than their rural counterparts and that men fare better than women on key indicators as
education, employment, information and health. There is thus ample reason to target
individuals with disabilities in rural areas, and in particular rural women, in order to
achieve the Millennium Development Goals and to live up to the standards set by the UN
Convention on the Rights of Disabled People.
PROJECT NO. 60G00530
REPORT NO. SINTEF A20047
VERSION 1
94
11 CONCLUSION
The findings in this study on living conditions among people with disabilities and non‐
disabled controls confirm that there are substantial gaps on a number of key indicators on
level of living, to the disadvantage of individuals with disability and disabled women living
in rural areas in particular. It is recommended that the evidence base found in this
research report is utilized by DPOs in Swaziland in their advocacy work, by Government
bodies in their planning and service provision, as a basis for monitoring development. It is
further recommended that the data is further utilized by researchers and Central Statistical
Office in Swaziland, and not least as a knowledge base for development of the disability
policy in the country.
PROJECT NO. 60G00530
REPORT NO. SINTEF A20047
VERSION 1
95
12 REFERENCES
CSO (2007) National Census. Mbabane, Central Statistical Office.
CSO. (2001) Swaziland Household Income and Expenditure Survey (SHIES). Mbabane, Ministry of Economic
Planning and Development, Central Statistical Office.
CSO (1997) National Census. Mbabane, Central Statistical Office.
Eide A H, Kamaleri Y (Eds.) (2009) Living conditions among people with disabilities in Mozambique. SINTEF
Report No. A9348. Oslo; SINTEF Health Research
Eide A H, Jelsma J, Loeb M E, Maart S, Ka’ Toni M (2007) Exploring ICF components in a survey among Xhosa
speakers in Eastern & Western Cape, South Africa. Disability and Rehabilitation, 30, 11, 819 – 829.
Eide A H, Loeb M E (2006) Living conditions among people with disabilities in Zambia. A national
representative survey. SINTEF Report No. A262. Oslo, SINTEF Health Research
Eide, A. H., Nhiwatiwa, S.,Muderedzi, J., Loeb, M. E. (2003a) Living conditions among people with acitivity
limitations in Zimbabwe. A representative regional survey. SINTEF report no. STF78A034512. Oslo, SINTEF
Unimed.
Eide, A. H., van Rooy, G., Loeb, M. (2003b) Living Conditions among people with Disabilities in Namibia. A
National, Representative Study. SINTEF Report no. STF 78 A034503. Oslo, SINTEF Unimed.
Grut L, Ingstad B. This is my life ‐ Living with a disability in Yemen. A qualitative study. The World Bank
2006.
Hem, K. G., Eide, A. H. (1998) Funksjonshemmedes levekår 1987‐1995: Sakker akterut tross forbedringer.
Samfunnsspeilet, 2, 20 – 25.
Heiberg M, Øvensen G (1993) Palestinian Society in Gaza, West Bank and Arab Jerusalem. A Survey of Living
Conditions. FAFO Report no. 151. Oslo, FAFO.
Ingstad B, Grut L (2007) See me, and do not forget me – People with disabilities in Kenya. World Bank
Publications & Report: SINEF Health Research, Oslo.
Kamaleri Y, Eide A H (Eds.) (2010) Living Conditions among People with Disabilities in Lesotho. A National,
Representative Study. SINTEF Report No. A17239. Oslo: SINTEF Technology & Society.
Lang R (2008) Disability Policy Audit in Namibia, Swaziland, Malawi and Mozambique. Final Report. London;
Leonard Cheshire Disability and Inclusive Development Centre, University College London.
Loeb M E, Eide A H, Mont D (2008) Approaching disability prevalence: the case of Zambia. European Journal
of Disability Research. 2, 32 – 43.

PROJECT NO. 60G00530
REPORT NO. SINTEF A20047
VERSION 1
96
Loeb M, Eide A H (Eds.) (2004) Living Conditions among People with Activity Limitations in Malawi. SINTEF
Report no. STF78 A044511. Oslo, SINTEF Health Research.
MoHSW (2000) Disability Profile in Swaziland. Government of Swaziland. Mbabane, Ministry of Health and
Social Welfare.
Miller K, Mont D, Maitland A, Altman B, Madans J (2011) Results of a cross‐national structured cognitive
interviewing protocol to test measures of disability. Quality & Quantity, 45, 4, 801 ‐ 815
NPC (2000) Level of Living Conditions Survey. Windhoek: National Planning Commission.
Patel V (2007) Promoting mental health in developing countries. Lancet, 370, 9590, p 821.
WHO (2011) World Disability Report. World Health Organization and The World Bank. Geneva, World
Health Organization.
WHO (2001) International Classification of Functioning, Disability and Health. Geneva: World Health
Organization.
Schneider M, Claasens M, Kimmie Z, Morgan R, Naicker S, Roberts A,
WHO (1980) The International Classification of Impairments, Disabilities and Handicaps. Geneva: World
Health Organization.
PROJECT NO. 60G00530
REPORT NO. SINTEF A20047
VERSION 1
97
APPENDICES
PROJECT NO. 60G00530
REPORT NO. SINTEF A20047
VERSION 1
98
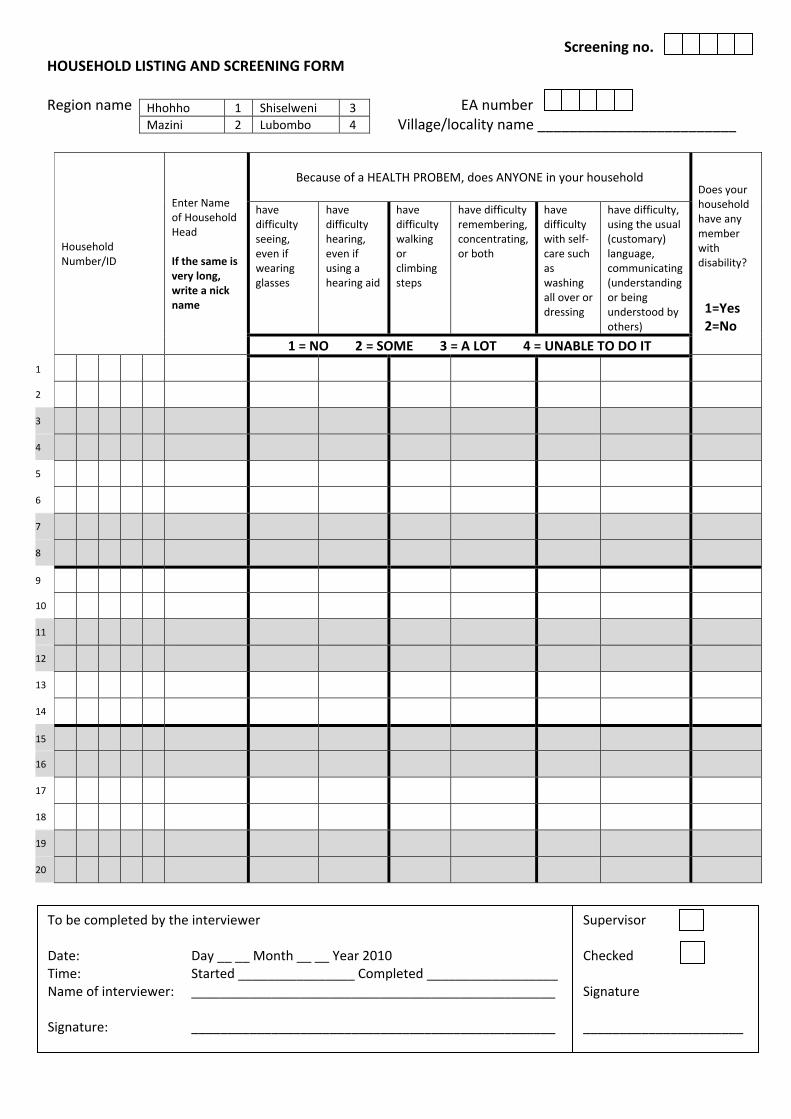
HOUSEHOLD LISTING AND SCREENING FORM Region name EA number
Village/locality name _________________________
Household Number/ID
Enter Name of Household Head If the same is very long, write a nick name
Because of a HEALTH PROBEM, does ANYONE in your household
Does your household have any member with disability?
1=Yes 2=No
have difficulty seeing, even if wearing glasses
have difficulty hearing, even if using a hearing aid
have difficulty walking or climbing steps
have difficulty remembering, concentrating, or both
have difficulty with self‐care such as washing all over or dressing
have difficulty, using the usual (customary) language, communicating (understanding or being understood by others)
1 = NO 2 = SOME 3 = A LOT 4 = UNABLE TO DO IT
1
2
3
4
5
6
7
8
9
10
11
12
13
14
15
16
17
18
19
20
To be completed by the interviewer Date: Day __ __ Month __ __ Year 2010 Time: Started ________________ Completed __________________ Name of interviewer: __________________________________________________ Signature: __________________________________________________
Supervisor Checked Signature ______________________
Hhohho 1 Shiselweni 3
Mazini 2 Lubombo 4
Screening no.
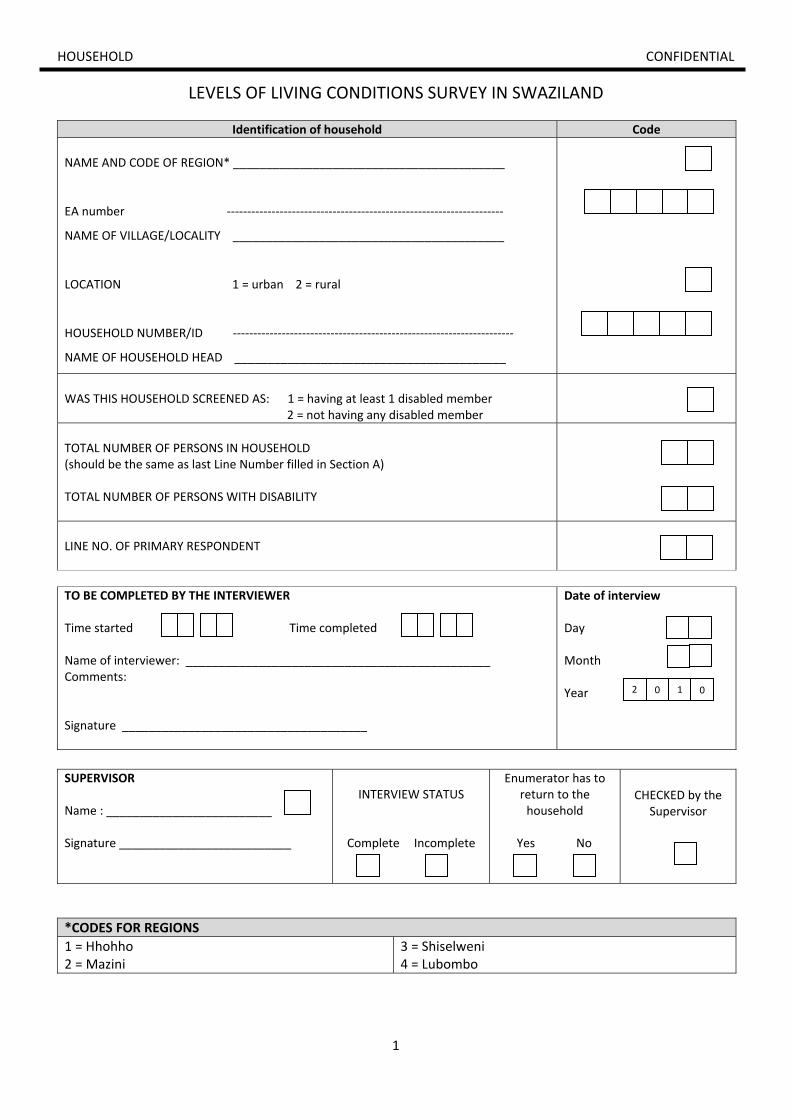
1
HOUSEHOLD CONFIDENTIAL
LEVELS OF LIVING CONDITIONS SURVEY IN SWAZILAND
Identification of household Code
NAME AND CODE OF REGION* _________________________________________
EA number ‐‐‐‐‐‐‐‐‐‐‐‐‐‐‐‐‐‐‐‐‐‐‐‐‐‐‐‐‐‐‐‐‐‐‐‐‐‐‐‐‐‐‐‐‐‐‐‐‐‐‐‐‐‐‐‐‐‐‐‐‐‐‐‐‐‐‐‐
NAME OF VILLAGE/LOCALITY _________________________________________
LOCATION 1 = urban 2 = rural
HOUSEHOLD NUMBER/ID ‐‐‐‐‐‐‐‐‐‐‐‐‐‐‐‐‐‐‐‐‐‐‐‐‐‐‐‐‐‐‐‐‐‐‐‐‐‐‐‐‐‐‐‐‐‐‐‐‐‐‐‐‐‐‐‐‐‐‐‐‐‐‐‐‐‐‐‐‐
NAME OF HOUSEHOLD HEAD _________________________________________
WAS THIS HOUSEHOLD SCREENED AS: 1 = having at least 1 disabled member 2 = not having any disabled member
TOTAL NUMBER OF PERSONS IN HOUSEHOLD (should be the same as last Line Number filled in Section A) TOTAL NUMBER OF PERSONS WITH DISABILITY
LINE NO. OF PRIMARY RESPONDENT
TO BE COMPLETED BY THE INTERVIEWER Time started Time completed Name of interviewer: ______________________________________________ Comments: Signature _____________________________________
Date of interview Day Month Year
SUPERVISOR Name : _________________________ Signature __________________________
INTERVIEW STATUS
Complete Incomplete
Enumerator has to return to the household
Yes No
CHECKED by the Supervisor
*CODES FOR REGIONS
1 = Hhohho 2 = Mazini
3 = Shiselweni 4 = Lubombo
2 0 1 0
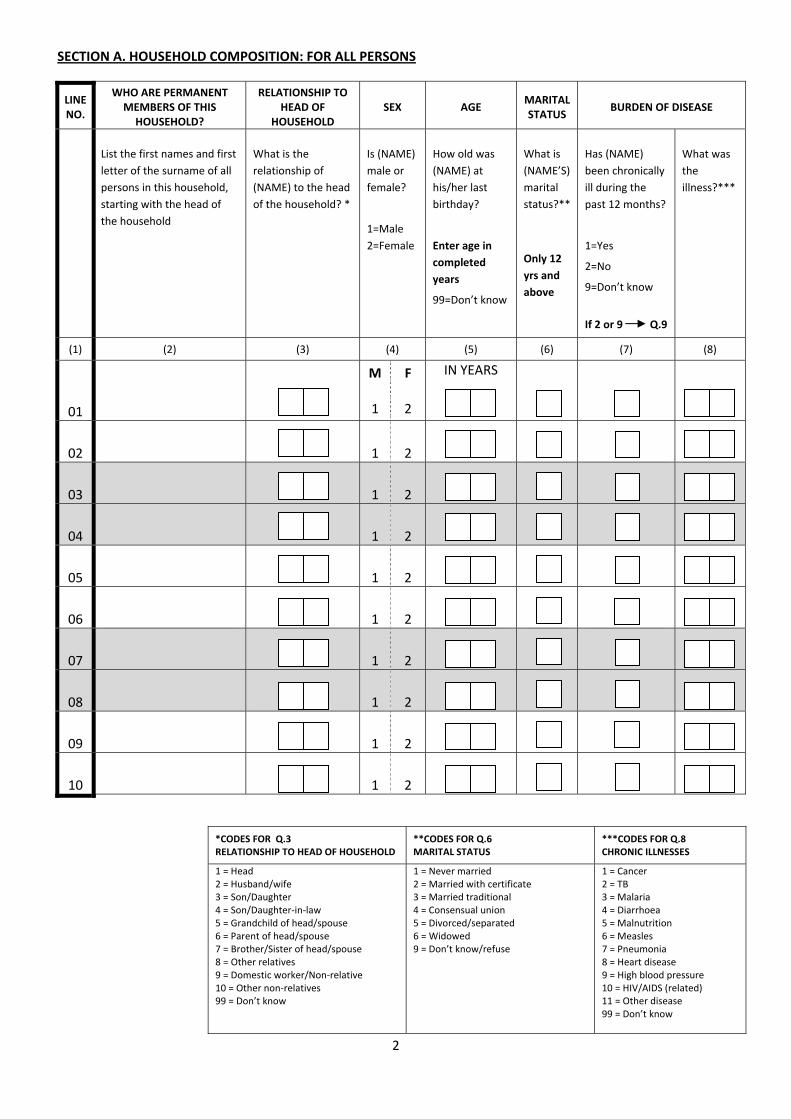
2
SECTION A. HOUSEHOLD COMPOSITION: FOR ALL PERSONS
LINE NO.
WHO ARE PERMANENT MEMBERS OF THIS HOUSEHOLD?
RELATIONSHIP TO HEAD OF
HOUSEHOLD SEX AGE
MARITAL STATUS
BURDEN OF DISEASE
List the first names and first
letter of the surname of all
persons in this household,
starting with the head of
the household
What is the
relationship of
(NAME) to the head
of the household? *
Is (NAME)
male or
female?
1=Male
2=Female
How old was
(NAME) at
his/her last
birthday?
Enter age in
completed
years
99=Don’t know
What is
(NAME’S)
marital
status?**
Only 12
yrs and
above
Has (NAME)
been chronically
ill during the
past 12 months?
1=Yes
2=No
9=Don’t know
If 2 or 9 Q.9
What was
the
illness?***
(1) (2) (3) (4) (5) (6) (7) (8)
01
M 1
F 2
IN YEARS
02
1 2
03
1 2
04
1 2
05
1 2
06
1 2
07
1 2
08
1 2
09
1 2
10
1 2
*CODES FOR Q.3 RELATIONSHIP TO HEAD OF HOUSEHOLD
**CODES FOR Q.6 MARITAL STATUS
***CODES FOR Q.8 CHRONIC ILLNESSES
1 = Head 2 = Husband/wife 3 = Son/Daughter 4 = Son/Daughter‐in‐law 5 = Grandchild of head/spouse 6 = Parent of head/spouse 7 = Brother/Sister of head/spouse 8 = Other relatives 9 = Domestic worker/Non‐relative 10 = Other non‐relatives 99 = Don’t know
1 = Never married2 = Married with certificate 3 = Married traditional 4 = Consensual union 5 = Divorced/separated 6 = Widowed 9 = Don’t know/refuse
1 = Cancer 2 = TB 3 = Malaria 4 = Diarrhoea 5 = Malnutrition 6 = Measles 7 = Pneumonia 8 = Heart disease 9 = High blood pressure 10 = HIV/AIDS (related) 11 = Other disease 99 = Don’t know
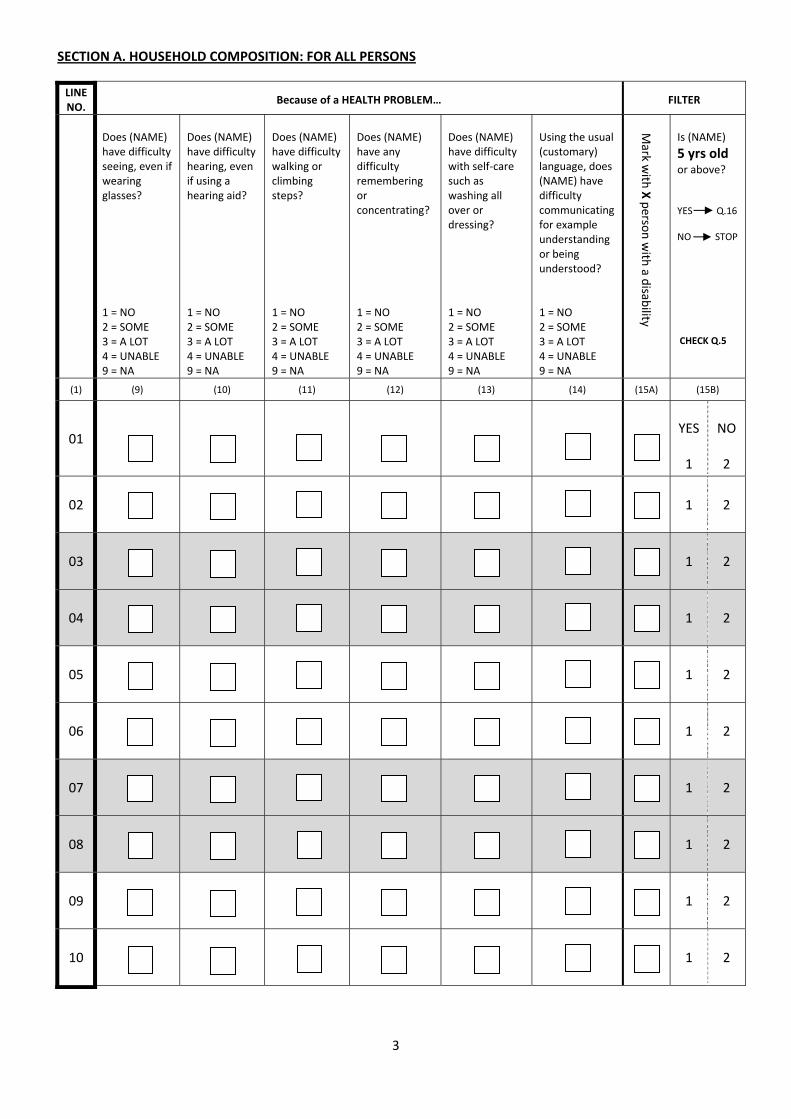
3
SECTION A. HOUSEHOLD COMPOSITION: FOR ALL PERSONS
LINE NO.
Because of a HEALTH PROBLEM… FILTER
Does (NAME) have difficulty seeing, even if wearing glasses? 1 = NO 2 = SOME 3 = A LOT 4 = UNABLE 9 = NA
Does (NAME) have difficulty hearing, even if using a hearing aid? 1 = NO 2 = SOME 3 = A LOT 4 = UNABLE 9 = NA
Does (NAME) have difficulty walking or climbing steps? 1 = NO 2 = SOME 3 = A LOT 4 = UNABLE 9 = NA
Does (NAME) have any difficulty remembering or concentrating? 1 = NO 2 = SOME 3 = A LOT 4 = UNABLE 9 = NA
Does (NAME) have difficulty with self‐care such as washing all over or dressing? 1 = NO 2 = SOME 3 = A LOT 4 = UNABLE 9 = NA
Using the usual (customary) language, does (NAME) have difficulty communicating for example understanding or being understood? 1 = NO 2 = SOME 3 = A LOT 4 = UNABLE 9 = NA
Is (NAME)
5 yrs old or above? YES Q.16 NO STOP CHECK Q.5
(1) (9) (10) (11) (12) (13) (14) (15A) (15B)
01
YES 1
NO 2
02
1 2
03
1 2
04
1 2
05
1 2
06
1 2
07
1 2
08
1 2
09
1 2
10
1 2
Mark w
ith X perso
n with
a disab
ility

4
SECTION A. HOUSEHOLD COMPOSITION: FOR ALL PERSONS – cont. for household member 11 ‐20
LINE NO.
WHO ARE PERMANENT MEMBERS OF THIS HOUSEHOLD?
RELATIONSHIP TO HEAD OF HOUSEHOLD
SEX AGE MARITAL STATUS
BURDEN OF DISEASE
List the first names and first
letter of the surname of all
persons in this household,
starting with the head of the
household.
What is the
relationship of
(NAME) to the
head of the
household? *
Is (NAME)
male or
female?
1=Male
2=Female
How old was
(NAME) at
his/her last
birthday?
Enter age in
completed
years
99=Don’t know
What is
(NAME’S)
marital
status?**
Only 12
yrs and
above
Has (NAME)
been chronically
ill during the
past 12 months?
1=Yes
2=No
9=Don’t know
If 2 or 9 Q.9
What was
the
illness?***
(1) (2) (3) (4) (5) (6) (7) (8)
11
M 1
F 2
IN YEARS
12
1 2
13
1 2
14
1 2
15
1 2
16
1 2
17
1 2
18
1 2
19
1 2
20
1 2
*CODES FOR Q.3 RELATIONSHIP TO HEAD OF HOUSEHOLD
**CODES FOR Q.6 MARITAL STATUS
***CODES FOR Q.8 CHRONIC ILLNESSES
1 = Head 2 = Husband/wife 3 = Son/Daughter 4 = Son/Daughter‐in‐law 5 = Grandchild of head/spouse 6 = Parent of head/spouse 7 = Brother/Sister of head/spouse 8 = Other relatives 9 = Domestic worker/Non‐relative 10 = Other non‐relatives 99 = Don’t know
1 = Never married/single2 = Married with certificate 3 = Married traditional 4 = Consensual union 5 = Divorced/separated 6 = Widowed 9 = Don’t know/refuse
1 = Cancer 2 = TB 3 = Malaria 4 = Diarrhoea 5 = Malnutrition 6 = Measles 7 = Pneumonia 8 = Heart disease 9 = High blood pressure 10 = HIV/AIDS (related) 11 = Other disease 99 = Don’t know
IF THERE ARE MORE
THAN 20 PERSONS IN
THE HOUSEHOLD,
PLEASE USE A
CONTINUATION
SHEET AND TICK THE
BOX BELOW
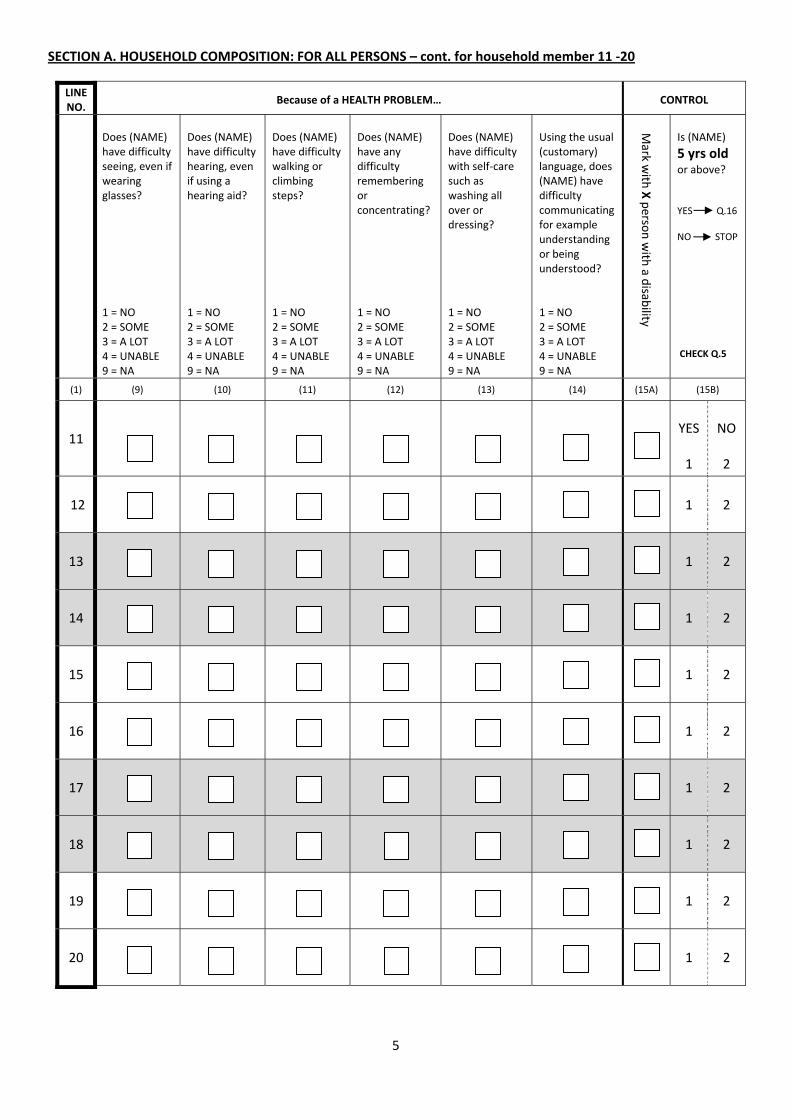
5
SECTION A. HOUSEHOLD COMPOSITION: FOR ALL PERSONS – cont. for household member 11 ‐20
LINE NO.
Because of a HEALTH PROBLEM… CONTROL
Does (NAME) have difficulty seeing, even if wearing glasses? 1 = NO 2 = SOME 3 = A LOT 4 = UNABLE 9 = NA
Does (NAME) have difficulty hearing, even if using a hearing aid? 1 = NO 2 = SOME 3 = A LOT 4 = UNABLE 9 = NA
Does (NAME) have difficulty walking or climbing steps? 1 = NO 2 = SOME 3 = A LOT 4 = UNABLE 9 = NA
Does (NAME) have any difficulty remembering or concentrating? 1 = NO 2 = SOME 3 = A LOT 4 = UNABLE 9 = NA
Does (NAME) have difficulty with self‐care such as washing all over or dressing? 1 = NO 2 = SOME 3 = A LOT 4 = UNABLE 9 = NA
Using the usual (customary) language, does (NAME) have difficulty communicating for example understanding or being understood? 1 = NO 2 = SOME 3 = A LOT 4 = UNABLE 9 = NA
Is (NAME)
5 yrs old or above? YES Q.16 NO STOP CHECK Q.5
(1) (9) (10) (11) (12) (13) (14) (15A) (15B)
11
YES 1
NO 2
12
1 2
13
1 2
14
1 2
15
1 2
16
1 2
17
1 2
18
1 2
19
1 2
20
1 2
Mark w
ith X perso
n with
a disab
ility

6
SECTION B. LEVEL OF EDUCATION OF HOUSEHOLD MEMBERS – AGED 5 YEARS OR ABOVE
LINE NO. ATTENDING SCHOOL
YEARS OF EDUCATION
HIGHEST GRADE
COMPLETED*
REASONS NEVER ATTTEND SCHOOL**
LITERACY CONTROL
Transfer the LINE NO. of persons as listed in Sect. A who are 5 yrs old or above
Has (NAME) attended any school, college or university? 1 = YES 2 = NO Q.19 9 = DON’T KNOW
How many years in all did (NAME) spend studying in school, college or university? 99 = DON’T KNOW
What is (NAME’S) highest standard form or level of education completed?* SKIP Q19A & Q19B
If (NAME) never attend school, what is the reason?** (Code up to 2 reasons) To be asked only if (NAME) answered NO in column (16)
Can (NAME) read and write in any language? 1 = YES 2 = NO 9 = DON’T KNOW
Is (NAME)
15 years old or above? YES Q.22 NO STOP
CHECK Q.5
(1) (16) (17) (18) (19A) (19B) (20) (21)
YES 1
NO 2
1 2
1 2
1 2
1 2
1 2
1 2
1 2
1 2
1 2
*CODES FOR Q.18 HIGHEST GRADE COMPLETED
**CODES FOR Q.19A & 19B REASONS FOR NOT ATTENDING/LEFT SCHOOL/COLLEGE OR UNIVERSITY
0 = not completed Grade 1 1 ‐ 11 = Grade 1 ‐ 11 12 = Grade 12 (O‐level) 13 = A‐level 14 = College/Diploma 15 = University 16 = Post‐graduates 99 = Don't know/refuse
0=Not enough money 1=Failing/underachiever 2=Illness 3=Lack of interest 4=Because of disability 5=School not accessible 6=Pregnancy 7=Other 9=Don’t know
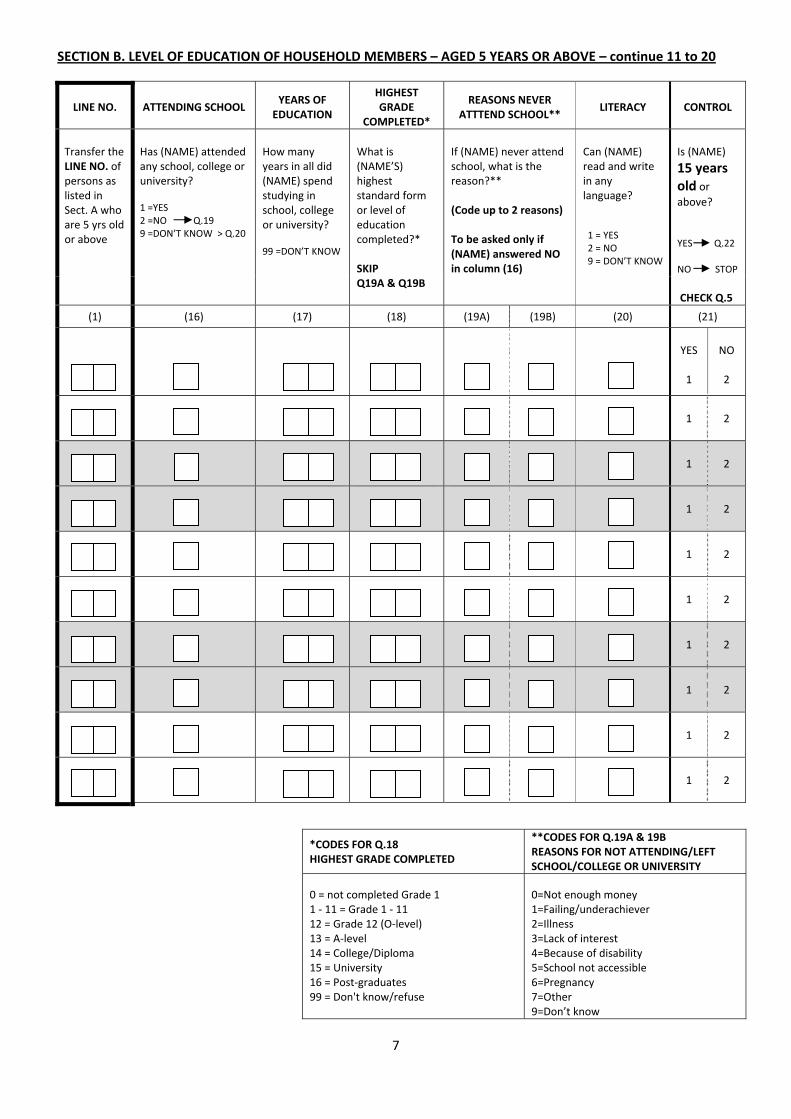
7
SECTION B. LEVEL OF EDUCATION OF HOUSEHOLD MEMBERS – AGED 5 YEARS OR ABOVE – continue 11 to 20
LINE NO. ATTENDING SCHOOL YEARS OF EDUCATION
HIGHEST GRADE
COMPLETED*
REASONS NEVER ATTTEND SCHOOL**
LITERACY CONTROL
Transfer the LINE NO. of persons as listed in Sect. A who are 5 yrs old or above
Has (NAME) attended any school, college or university? 1 =YES 2 =NO Q.19 9 =DON’T KNOW > Q.20
How many years in all did (NAME) spend studying in school, college or university? 99 =DON’T KNOW
What is (NAME’S) highest standard form or level of education completed?* SKIP Q19A & Q19B
If (NAME) never attend school, what is the reason?** (Code up to 2 reasons) To be asked only if (NAME) answered NO in column (16)
Can (NAME) read and write in any language? 1 = YES 2 = NO 9 = DON’T KNOW
Is (NAME)
15 years old or above? YES Q.22 NO STOP
CHECK Q.5
(1) (16) (17) (18) (19A) (19B) (20) (21)
YES 1
NO 2
1 2
1 2
1 2
1 2
1 2
1 2
1 2
1 2
1 2
*CODES FOR Q.18 HIGHEST GRADE COMPLETED
**CODES FOR Q.19A & 19B REASONS FOR NOT ATTENDING/LEFT SCHOOL/COLLEGE OR UNIVERSITY
0 = not completed Grade 1 1 ‐ 11 = Grade 1 ‐ 11 12 = Grade 12 (O‐level) 13 = A‐level 14 = College/Diploma 15 = University 16 = Post‐graduates 99 = Don't know/refuse
0=Not enough money 1=Failing/underachiever 2=Illness 3=Lack of interest 4=Because of disability 5=School not accessible 6=Pregnancy 7=Other 9=Don’t know

8
SECTION C. ECONOMIC ACTIVITY OF HOUSEHOLD MEMBERS AGED 15 YEARS OR ABOVE
LINE NO. WORK STATUS* POSSESS ANY SKILL? TYPE OF TRAINING CONTROL
Transfer the LINE NO. of persons as listed in Sect. A who are 15 yrs old or above
What is the work status of (NAME)?*
Apart from formal education, has (NAME) received any formal or informal training that has resulted in his/her having a particular skill e.g. carpentering, sewing, running business, farming etc.? 1 = YES 2 = NO Q.25 9 = DON’T KNOW Q.25
Did (NAME) receive any formal or informal training to get the skill? 1= Formal 2= Informal 9= Don’t know
Is (NAME) a
Female? YES Q.26 NO STOP
CHECK Q.4
(1) (22) (23) (24) (25)
YES 1
NO 2
1 2
1 2
1 2
1 2
1 2
1 2
1 2
1 2
1 2
1 2
1 2
*CODE FOR Q.22 WORK STATUS
1 = Paid work 2 = Self employed, such as own business or farming 3 = Non‐paid work such as volunteer or charity 4 = Student 5 = Keeping house/homemaker 6 = Retired 7 = Unemployed (health reasons) 8 = Unemployed (other reasons) 9 = Others 99 = Don’t know/Refuse

9
SECTION D. REPRODUCTIVE HEALTH OF FEMALE HOUSEHOLD MEMBERS AGED 15 YEARS OR ABOVE
LINE NO. CHILDREN NO. OF CHILDREN STILLBIRTHS NO. OF STILLBIRTS
Transfer the LINE NO. of persons as listed in Sect. A who are 15 yrs old or above
Does (NAME) have any children? 1 = YES 2 = NO Q.28 9 = DON’T KNOW Q.28
How many children do (NAME) have today? Don’t include those that have died
Does (NAME) have pregnancies ended before term? 1 = YES 2 = NO STOP 9 = DON’T KNOW STOP
How many did (NAME) have pregnancies ended before term? 99 = DON’T KNOW
BOYS GIRLS
(1) (26) (27a) (27b) (28) (29)
NOTE: The following questions should be completed by the PRIMARY RESPONDENT/HEAD OF HOUSEHOLD
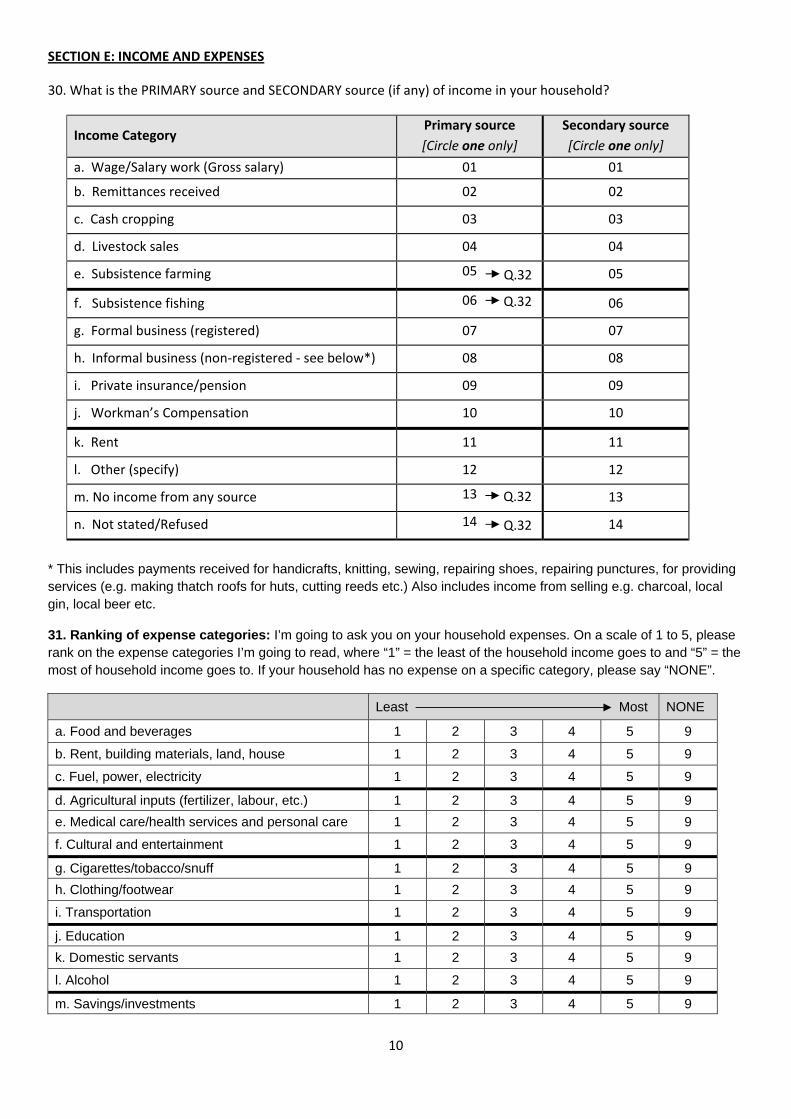
10
SECTION E: INCOME AND EXPENSES
30. What is the PRIMARY source and SECONDARY source (if any) of income in your household?
Income Category Primary source
[Circle one only]
Secondary source
[Circle one only]
a. Wage/Salary work (Gross salary) 01 01
b. Remittances received 02 02
c. Cash cropping 03 03
d. Livestock sales 04 04
e. Subsistence farming 05 05
f. Subsistence fishing 06 06
g. Formal business (registered) 07 07
h. Informal business (non‐registered ‐ see below*) 08 08
i. Private insurance/pension 09 09
j. Workman’s Compensation 10 10
k. Rent 11 11
l. Other (specify) 12 12
m. No income from any source 13 13
n. Not stated/Refused 14 14
* This includes payments received for handicrafts, knitting, sewing, repairing shoes, repairing punctures, for providing services (e.g. making thatch roofs for huts, cutting reeds etc.) Also includes income from selling e.g. charcoal, local gin, local beer etc.
31. Ranking of expense categories: I’m going to ask you on your household expenses. On a scale of 1 to 5, please rank on the expense categories I’m going to read, where “1” = the least of the household income goes to and “5” = the most of household income goes to. If your household has no expense on a specific category, please say “NONE”.
Least Most NONE
a. Food and beverages 1 2 3 4 5 9
b. Rent, building materials, land, house 1 2 3 4 5 9
c. Fuel, power, electricity 1 2 3 4 5 9
d. Agricultural inputs (fertilizer, labour, etc.) 1 2 3 4 5 9
e. Medical care/health services and personal care 1 2 3 4 5 9
f. Cultural and entertainment 1 2 3 4 5 9
g. Cigarettes/tobacco/snuff 1 2 3 4 5 9
h. Clothing/footwear 1 2 3 4 5 9
i. Transportation 1 2 3 4 5 9
j. Education 1 2 3 4 5 9
k. Domestic servants 1 2 3 4 5 9
l. Alcohol 1 2 3 4 5 9
m. Savings/investments 1 2 3 4 5 9
Q.32
Q.32
Q.32
Q.32
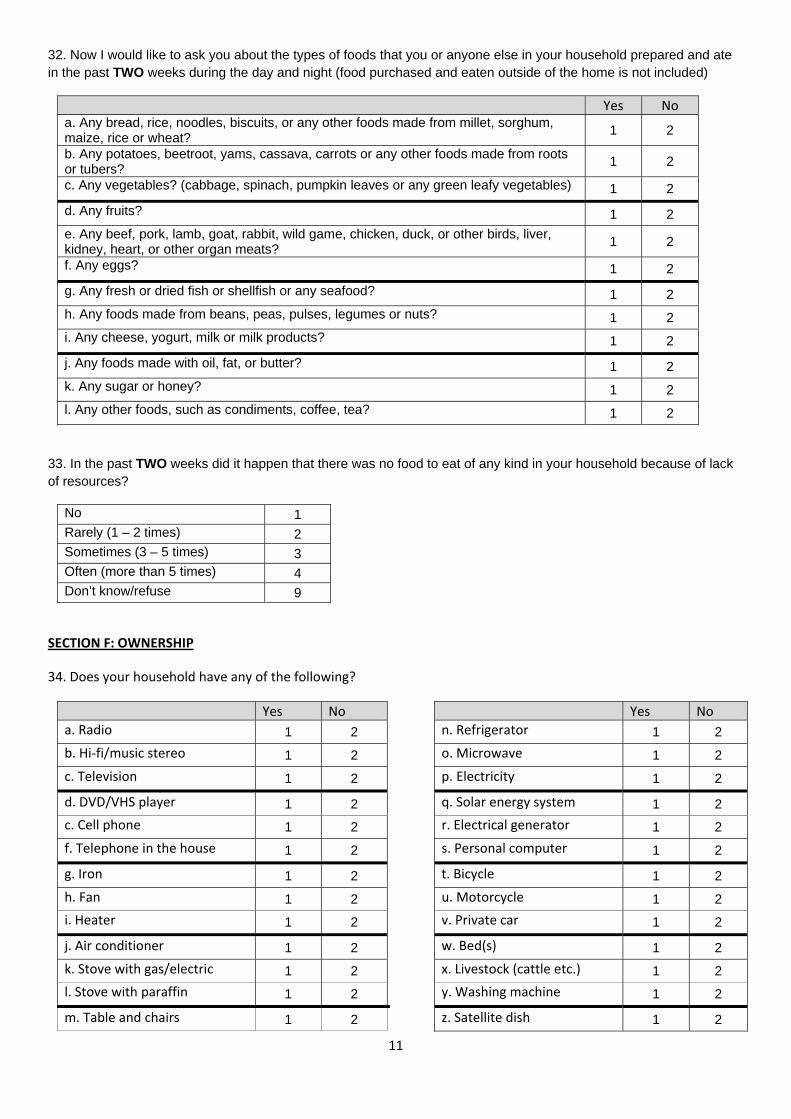
11
32. Now I would like to ask you about the types of foods that you or anyone else in your household prepared and ate in the past TWO weeks during the day and night (food purchased and eaten outside of the home is not included)
Yes No a. Any bread, rice, noodles, biscuits, or any other foods made from millet, sorghum, maize, rice or wheat?
1 2
b. Any potatoes, beetroot, yams, cassava, carrots or any other foods made from roots or tubers?
1 2
c. Any vegetables? (cabbage, spinach, pumpkin leaves or any green leafy vegetables) 1 2
d. Any fruits? 1 2
e. Any beef, pork, lamb, goat, rabbit, wild game, chicken, duck, or other birds, liver, kidney, heart, or other organ meats?
1 2
f. Any eggs? 1 2
g. Any fresh or dried fish or shellfish or any seafood? 1 2
h. Any foods made from beans, peas, pulses, legumes or nuts? 1 2
i. Any cheese, yogurt, milk or milk products? 1 2
j. Any foods made with oil, fat, or butter? 1 2
k. Any sugar or honey? 1 2
l. Any other foods, such as condiments, coffee, tea? 1 2
33. In the past TWO weeks did it happen that there was no food to eat of any kind in your household because of lack of resources?
No 1 Rarely (1 – 2 times) 2 Sometimes (3 – 5 times) 3 Often (more than 5 times) 4 Don’t know/refuse 9
SECTION F: OWNERSHIP
34. Does your household have any of the following?
Yes No Yes No
a. Radio 1 2 n. Refrigerator 1 2
b. Hi‐fi/music stereo 1 2 o. Microwave 1 2
c. Television 1 2 p. Electricity 1 2
d. DVD/VHS player 1 2 q. Solar energy system 1 2
c. Cell phone 1 2 r. Electrical generator 1 2
f. Telephone in the house 1 2 s. Personal computer 1 2
g. Iron 1 2 t. Bicycle 1 2
h. Fan 1 2 u. Motorcycle 1 2
i. Heater 1 2 v. Private car 1 2
j. Air conditioner 1 2 w. Bed(s) 1 2
k. Stove with gas/electric 1 2 x. Livestock (cattle etc.) 1 2
l. Stove with paraffin 1 2 y. Washing machine 1 2
m. Table and chairs 1 2 z. Satellite dish 1 2
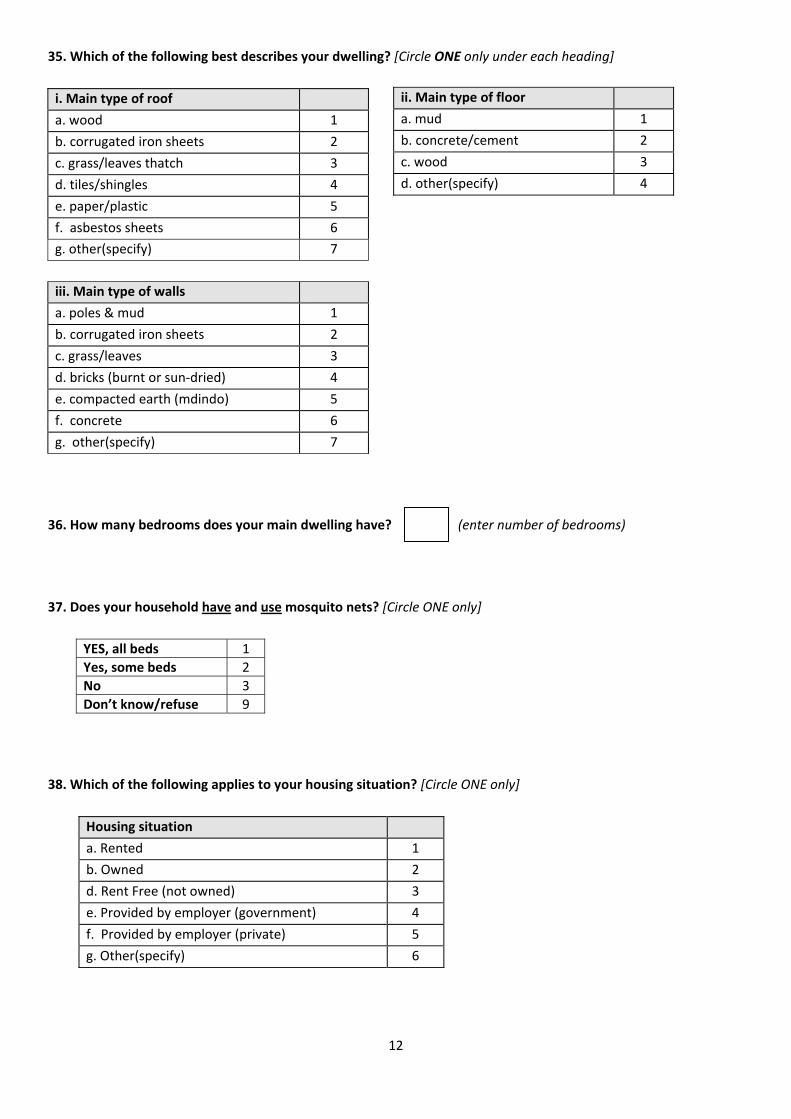
12
35. Which of the following best describes your dwelling? [Circle ONE only under each heading]
i. Main type of roof
a. wood 1
b. corrugated iron sheets 2
c. grass/leaves thatch 3
d. tiles/shingles 4
e. paper/plastic 5
f. asbestos sheets 6
g. other(specify) 7
iii. Main type of walls
a. poles & mud 1
b. corrugated iron sheets 2
c. grass/leaves 3
d. bricks (burnt or sun‐dried) 4
e. compacted earth (mdindo) 5
f. concrete 6
g. other(specify) 7
36. How many bedrooms does your main dwelling have? (enter number of bedrooms)
37. Does your household have and use mosquito nets? [Circle ONE only]
YES, all beds 1
Yes, some beds 2
No 3
Don’t know/refuse 9
38. Which of the following applies to your housing situation? [Circle ONE only]
Housing situation
a. Rented 1
b. Owned 2
d. Rent Free (not owned) 3
e. Provided by employer (government) 4
f. Provided by employer (private) 5
g. Other(specify) 6
ii. Main type of floor
a. mud 1
b. concrete/cement 2
c. wood 3
d. other(specify) 4

13
[Circle ONE only]
39. What is the MAIN source of drinking water in your household at present? [Circle ONE only]
Source of water:
a. Piped water inside 1
b. Piped water outdoors, on property 2
c. Piped water outside the property 3
d. Public pipe/tap 4
e. Borehole 5
f. Protected well 6
g. Unprotected well 7
h. River/ stream/dam/spring/lake 8
i. Rain‐water tank 9
j. Water carrier/tanker 10
k. Other(specify) 11
l. Don’t know/refuse 99
40. What is the MAIN source of energy that your household uses for cooking and lighting?
[Circle ONE only]
41. What kind of sanitation facility does your household mainly use?
i. Source of energy for cooking
a. Electricity 1
b. Paraffin 2
c. Gas 3
d. Wood 4
e. Coal/charcoal 5
f. Solar 6
i. Dung/grass/stalks 7
j. None 8
k. Other (specify) 9
l. Don’t know/refuse 99
ii. Source of energy for lighting
a. Electricity 1
b. Paraffin 2
c. Gas 3
d. Wood 4
e. Coal/charcoal 5
f. Solar 6
g. Candles 7
h. Torch 8
j. None 9
k. Other (specify) 10
l. Don’t know/refuse 99
a. Flush toilet 1
b. Traditional pit toilet 2
c. Ventilated improved pit toilet 3
d. No facility 4
e. Other(specify) 5
f. Don’t know/refuse 9

14
SECTION G: TRANSPORT AND COMMUNICATION 42. How long (in time) does it take to WALK ONE WAY to each of these facilities?
Service/Facility* *Coding:
a. Nearest school 1 = Facility not available within walking distance
2 = 5 minutes or less 3 = 6 – 15 minutes 4 = 16 – 30 minutes 5 = 31 – 60 minutes 6 = more than 60 minutes 9 = Don’t know/ Not available (NA)
b. Nearest health facility
c. Nearest market/shop
d. Nearest sports facility
e. Post office
f. Police station
g. Church/Mosque/Temple
43. What is the MAIN MODE of transport that household members use when visiting each of these facilities?
Service/Facility* *Coding:
a. Nearest school
1 = Walk/Wheelchair 2 = Bicycle 3 = Motor bike 4 = Bus 5 = Taxi 6 = Boat
7 = Own car 8 = Company car 9 = Hike lift (car) 10 = Cart 11 = Other 99 = Don’t know / NA
b. Nearest health facility
c. Nearest market/shop
d. Nearest sports facility
e. Post office
f. Police station
g. Church/Mosque/Temple
44. How available and affordable are the following services to your household?
Service Availability** Affordability **Coding:
a. Telephone/mobile phone YES
1
NO
2
1 = Own/use regularly*
2 = Have access to
3 = Have no use for
4 = Have no access to
9 = Don’t know/refuse
b. Radio 1 2
c. Television (TV) 1 2
d. Internet (including Internet Café) 1 2
e. Newspaper (*purchase regularly) 1 2
f. Library (*use regularly) 1 2
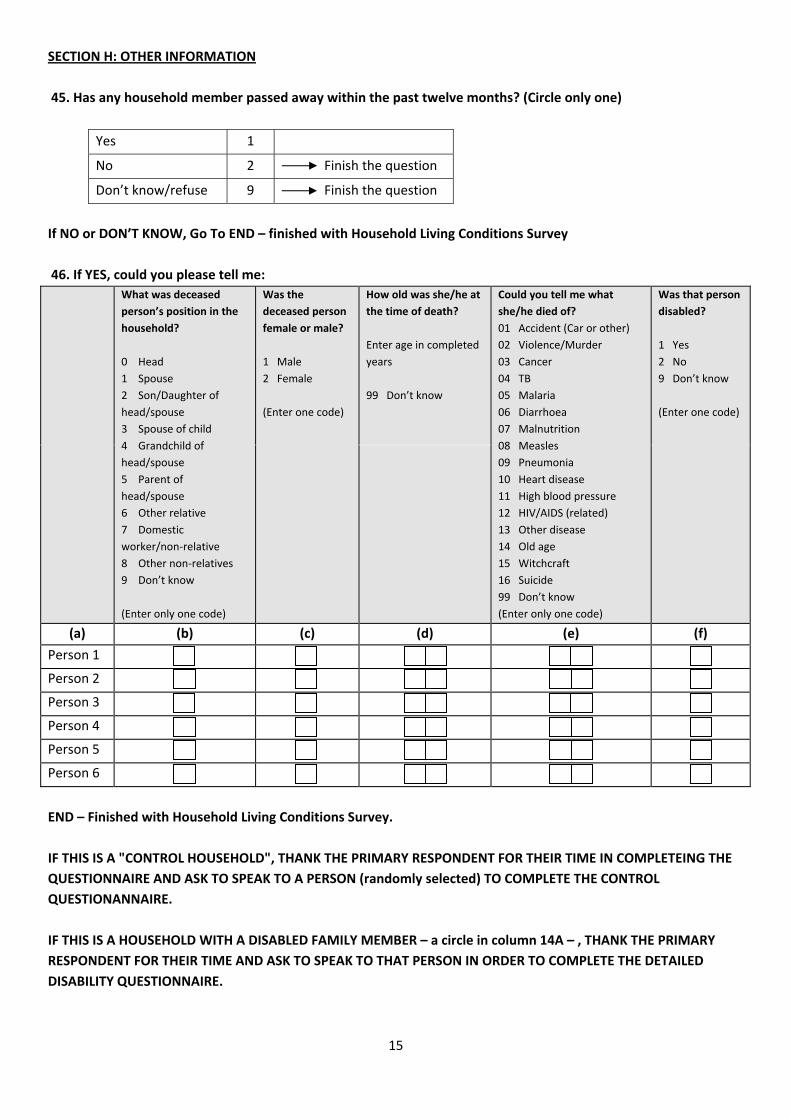
15
SECTION H: OTHER INFORMATION
45. Has any household member passed away within the past twelve months? (Circle only one)
Yes 1
No 2 Finish the question
Don’t know/refuse 9 Finish the question
If NO or DON’T KNOW, Go To END – finished with Household Living Conditions Survey
46. If YES, could you please tell me:
What was deceased
person’s position in the
household?
0 Head
1 Spouse
2 Son/Daughter of
head/spouse
3 Spouse of child
4 Grandchild of
head/spouse
5 Parent of
head/spouse
6 Other relative
7 Domestic
worker/non‐relative
8 Other non‐relatives
9 Don’t know
(Enter only one code)
Was the
deceased person
female or male?
1 Male
2 Female
(Enter one code)
How old was she/he at
the time of death?
Enter age in completed
years
99 Don’t know
Could you tell me what
she/he died of?
01 Accident (Car or other)
02 Violence/Murder
03 Cancer
04 TB
05 Malaria
06 Diarrhoea
07 Malnutrition
08 Measles
09 Pneumonia
10 Heart disease
11 High blood pressure
12 HIV/AIDS (related)
13 Other disease
14 Old age
15 Witchcraft
16 Suicide
99 Don’t know
(Enter only one code)
Was that person
disabled?
1 Yes
2 No
9 Don’t know
(Enter one code)
(a) (b) (c) (d) (e) (f)
Person 1
Person 2
Person 3
Person 4
Person 5
Person 6
END – Finished with Household Living Conditions Survey.
IF THIS IS A "CONTROL HOUSEHOLD", THANK THE PRIMARY RESPONDENT FOR THEIR TIME IN COMPLETEING THE
QUESTIONNAIRE AND ASK TO SPEAK TO A PERSON (randomly selected) TO COMPLETE THE CONTROL
QUESTIONANNAIRE.
IF THIS IS A HOUSEHOLD WITH A DISABLED FAMILY MEMBER – a circle in column 14A – , THANK THE PRIMARY
RESPONDENT FOR THEIR TIME AND ASK TO SPEAK TO THAT PERSON IN ORDER TO COMPLETE THE DETAILED
DISABILITY QUESTIONNAIRE.
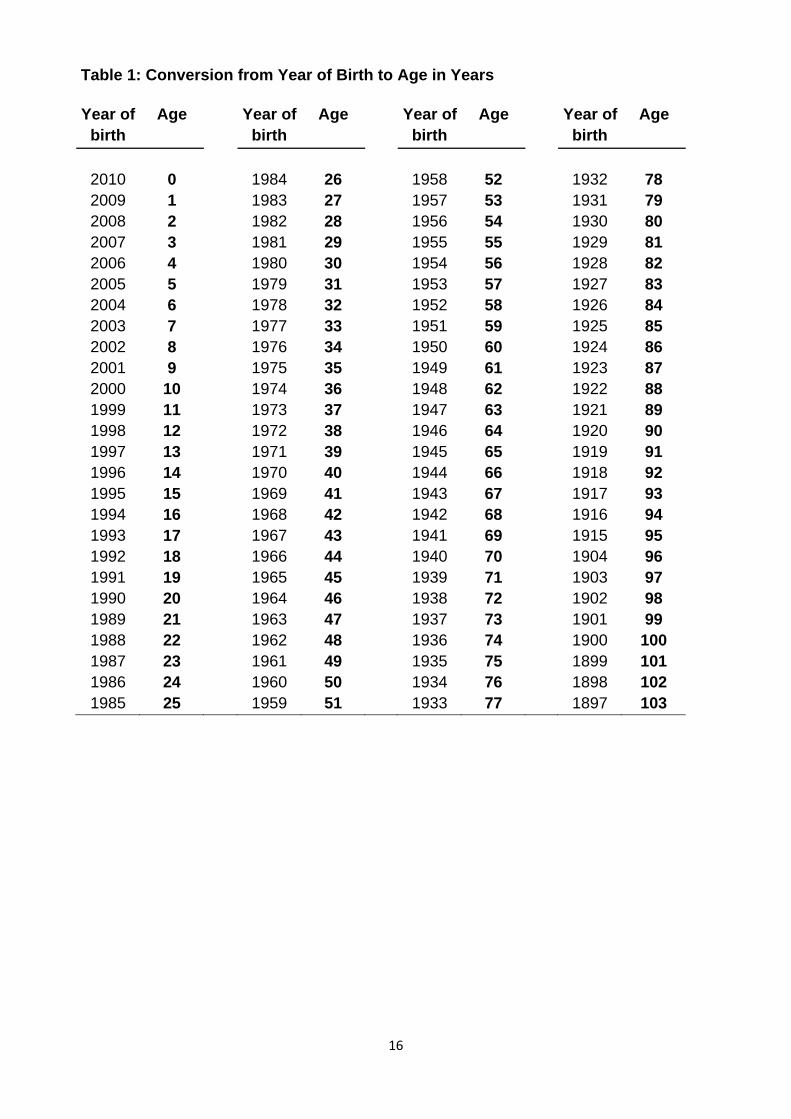
16
Table 1: Conversion from Year of Birth to Age in Years
Year of Age Year of Age Year of Age Year of Age
birth birth birth birth
2010 0 1984 26 1958 52 1932 78 2009 1 1983 27 1957 53 1931 79 2008 2 1982 28 1956 54 1930 80 2007 3 1981 29 1955 55 1929 81 2006 4 1980 30 1954 56 1928 82 2005 5 1979 31 1953 57 1927 83 2004 6 1978 32 1952 58 1926 84 2003 7 1977 33 1951 59 1925 85 2002 8 1976 34 1950 60 1924 86 2001 9 1975 35 1949 61 1923 87 2000 10 1974 36 1948 62 1922 88 1999 11 1973 37 1947 63 1921 89 1998 12 1972 38 1946 64 1920 90 1997 13 1971 39 1945 65 1919 91 1996 14 1970 40 1944 66 1918 92 1995 15 1969 41 1943 67 1917 93 1994 16 1968 42 1942 68 1916 94 1993 17 1967 43 1941 69 1915 95 1992 18 1966 44 1940 70 1904 96 1991 19 1965 45 1939 71 1903 97 1990 20 1964 46 1938 72 1902 98 1989 21 1963 47 1937 73 1901 99 1988 22 1962 48 1936 74 1900 100 1987 23 1961 49 1935 75 1899 101 1986 24 1960 50 1934 76 1898 102 1985 25 1959 51 1933 77 1897 103

1
INDIVIDUAL ‐ CASE CONFIDENTIAL
DETAILED QUESTIONNAIRE FOR PEOPLE WITH DISABILITIES
Identification of person with disability Code
NAME AND CODE OF REGION* _________________________________________
EA number ‐‐‐‐‐‐‐‐‐‐‐‐‐‐‐‐‐‐‐‐‐‐‐‐‐‐‐‐‐‐‐‐‐‐‐‐‐‐‐‐‐‐‐‐‐‐‐‐‐‐‐‐‐‐‐‐‐‐‐‐‐‐‐‐‐‐‐‐
NAME OF VILLAGE/LOCALITY _________________________________________
LOCATION 1 = urban 2 = rural
HOUSEHOLD NUMBER/ID ‐‐‐‐‐‐‐‐‐‐‐‐‐‐‐‐‐‐‐‐‐‐‐‐‐‐‐‐‐‐‐‐‐‐‐‐‐‐‐‐‐‐‐‐‐‐‐‐‐‐‐‐‐‐‐‐‐‐‐‐‐‐‐‐‐‐‐‐‐
NAME OF HOUSEHOLD HEAD _________________________________________
DETAIL OF PERSON WITH DISABILITY NAME ______________________________________________________________ AGE LINE NUMBER OF PERSON IN HOUSEHOLD LISTING
IS THIS A FACE‐TO‐FACE INTERVIEW WITH THE PERSON WITH DISABILITY?[Do not read out. Code by observation] 1 = YES (i.e. interview directly with the person with disability) 2 = NO (i.e. someone else is reporting on behalf of the person with disability) 3 = BOTH (i.e. someone else is reporting together with the person with disability) If NO or BOTH, who is the person reporting? Line number of person as proxy ‐‐‐‐‐‐‐‐‐‐‐‐‐‐‐‐‐‐‐‐‐‐‐‐‐‐‐‐‐‐‐‐‐‐‐‐‐‐‐‐‐‐‐‐‐‐‐‐‐‐‐‐‐‐‐‐‐‐‐‐‐‐‐‐‐‐‐‐‐
TO BE COMPLETED BY THE INTERVIEWER Time started Time completed Name of interviewer: ______________________________________________ Comments: Signature _____________________________________
Date of interview Day Month Year
SUPERVISOR Name : __________________________ Signature __________________________
INTERVIEW STATUS
Complete Incomplete
Enumerator has to return to the household
Yes No
CHECKED by the Supervisor
*CODES FOR REGIONS
1 = Hhohho 2 = Mazini
3 = Shiselweni 4 = Lubombo
02 1 0
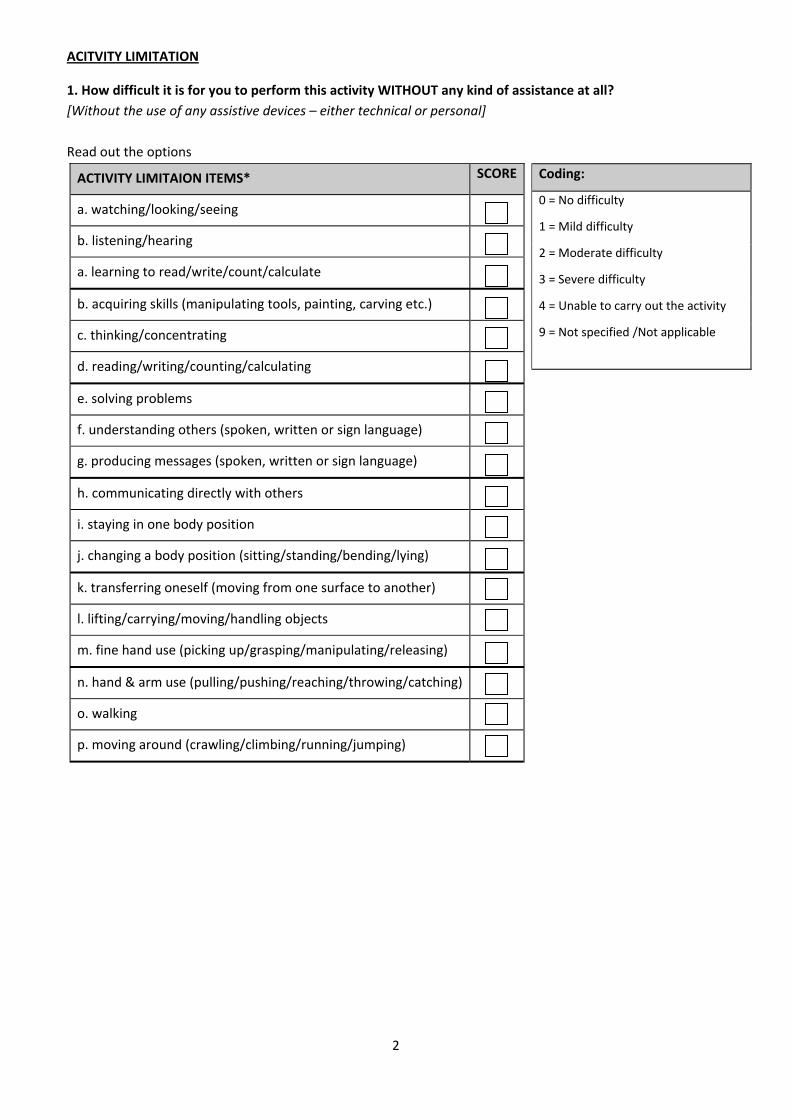
2
ACITVITY LIMITATION
1. How difficult it is for you to perform this activity WITHOUT any kind of assistance at all?
[Without the use of any assistive devices – either technical or personal]
Read out the options
ACTIVITY LIMITAION ITEMS* SCORE
a. watching/looking/seeing
b. listening/hearing
a. learning to read/write/count/calculate
b. acquiring skills (manipulating tools, painting, carving etc.)
c. thinking/concentrating
d. reading/writing/counting/calculating
e. solving problems
f. understanding others (spoken, written or sign language)
g. producing messages (spoken, written or sign language)
h. communicating directly with others
i. staying in one body position
j. changing a body position (sitting/standing/bending/lying)
k. transferring oneself (moving from one surface to another)
l. lifting/carrying/moving/handling objects
m. fine hand use (picking up/grasping/manipulating/releasing)
n. hand & arm use (pulling/pushing/reaching/throwing/catching)
o. walking
p. moving around (crawling/climbing/running/jumping)
Coding:
0 = No difficulty
1 = Mild difficulty
2 = Moderate difficulty
3 = Severe difficulty
4 = Unable to carry out the activity
9 = Not specified /Not applicable

3
PARTICIPATION RESTRICTION
2. Do you have any difficulty performing this activity in your current environment?
[Current environment where you live, work and play etc for the majority of your time, and with the use of any
assistive devices, either technical or personal]
Read out the options
Coding:
0 = No problem
1 = Mild problem
2 = Moderate problem
3 = Severe problem
4 = Complete problem
(unable to perform)
9 = Not specified /Not applicable
PARTICIPATION RESTRICTION ITEMS* SCORE
a. washing oneself
b. care of body parts, teeth, nails and hair
c. toileting
d. dressing and undressing
e. eating and drinking
f. shopping (getting goods and services)
g. preparing meals (cooking)
h. doing housework (washing/cleaning)
i. taking care of personal objects (mending/repairing)
j. taking care of others
k. making friends and maintaining friendships
l. interacting with persons in authority (officials, village chiefs)
m. interacting with strangers
n. creating and maintaining family relationships
o. making and maintaining intimate relationships
p. going to school and studying (education)
q. getting and keeping a job (work & employment)
r. handling income and payments (economic life)
s. clubs/organisations (community life)
t. recreation/leisure (sports/play/crafts/hobbies/arts/culture)
w. religious/spiritual activities
x. political life and citizenship
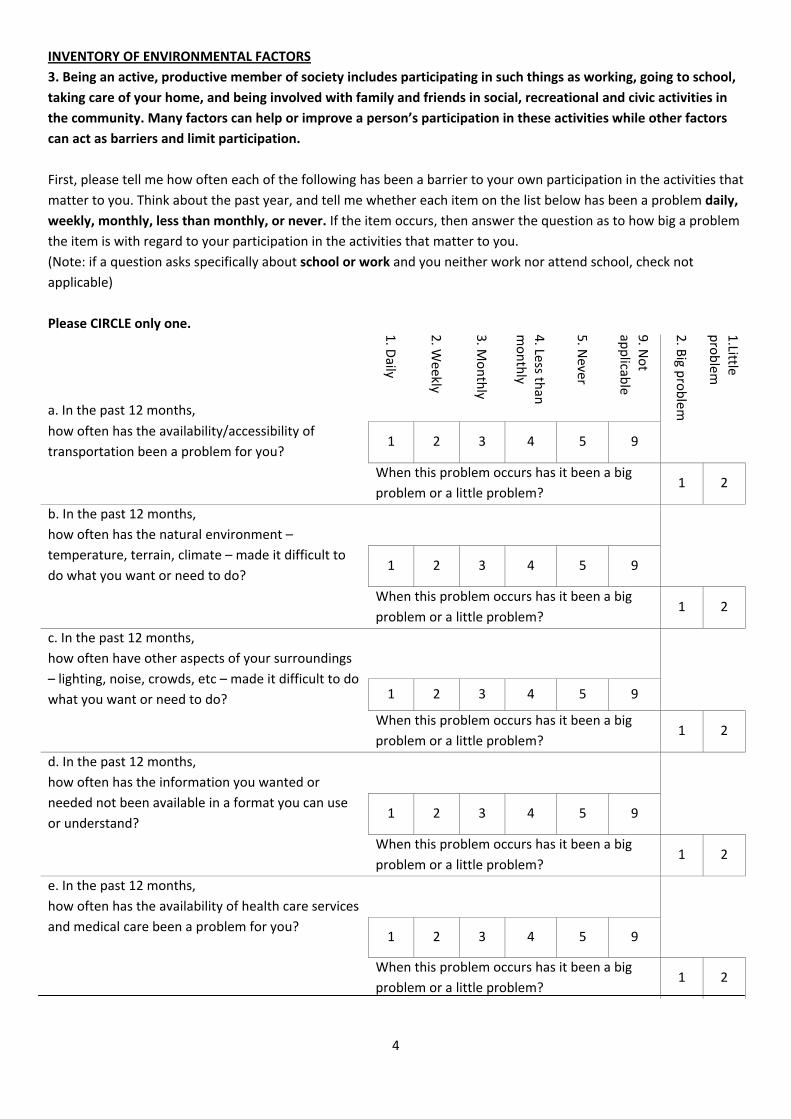
4
INVENTORY OF ENVIRONMENTAL FACTORS
3. Being an active, productive member of society includes participating in such things as working, going to school,
taking care of your home, and being involved with family and friends in social, recreational and civic activities in
the community. Many factors can help or improve a person’s participation in these activities while other factors
can act as barriers and limit participation.
First, please tell me how often each of the following has been a barrier to your own participation in the activities that
matter to you. Think about the past year, and tell me whether each item on the list below has been a problem daily,
weekly, monthly, less than monthly, or never. If the item occurs, then answer the question as to how big a problem
the item is with regard to your participation in the activities that matter to you.
(Note: if a question asks specifically about school or work and you neither work nor attend school, check not
applicable)
Please CIRCLE only one.
a. In the past 12 months, 1. D
aily
2. W
eekly
3. M
onthly
4. Less th
an
monthly
5. N
ever
9. N
ot
applicab
le
2. B
ig problem
1.Little
problem
how often has the availability/accessibility of
transportation been a problem for you? 1 2 3 4 5 9
When this problem occurs has it been a big
problem or a little problem? 1 2
b. In the past 12 months,
how often has the natural environment –
temperature, terrain, climate – made it difficult to
do what you want or need to do?
1 2 3 4 5 9
When this problem occurs has it been a big
problem or a little problem? 1 2
c. In the past 12 months,
how often have other aspects of your surroundings
– lighting, noise, crowds, etc – made it difficult to do
what you want or need to do?
1 2 3 4 5 9
When this problem occurs has it been a big
problem or a little problem? 1 2
d. In the past 12 months,
how often has the information you wanted or
needed not been available in a format you can use
or understand?
1 2 3 4 5 9
When this problem occurs has it been a big
problem or a little problem? 1 2
e. In the past 12 months,
how often has the availability of health care services
and medical care been a problem for you?
1 2 3 4 5 9
When this problem occurs has it been a big
problem or a little problem? 1 2
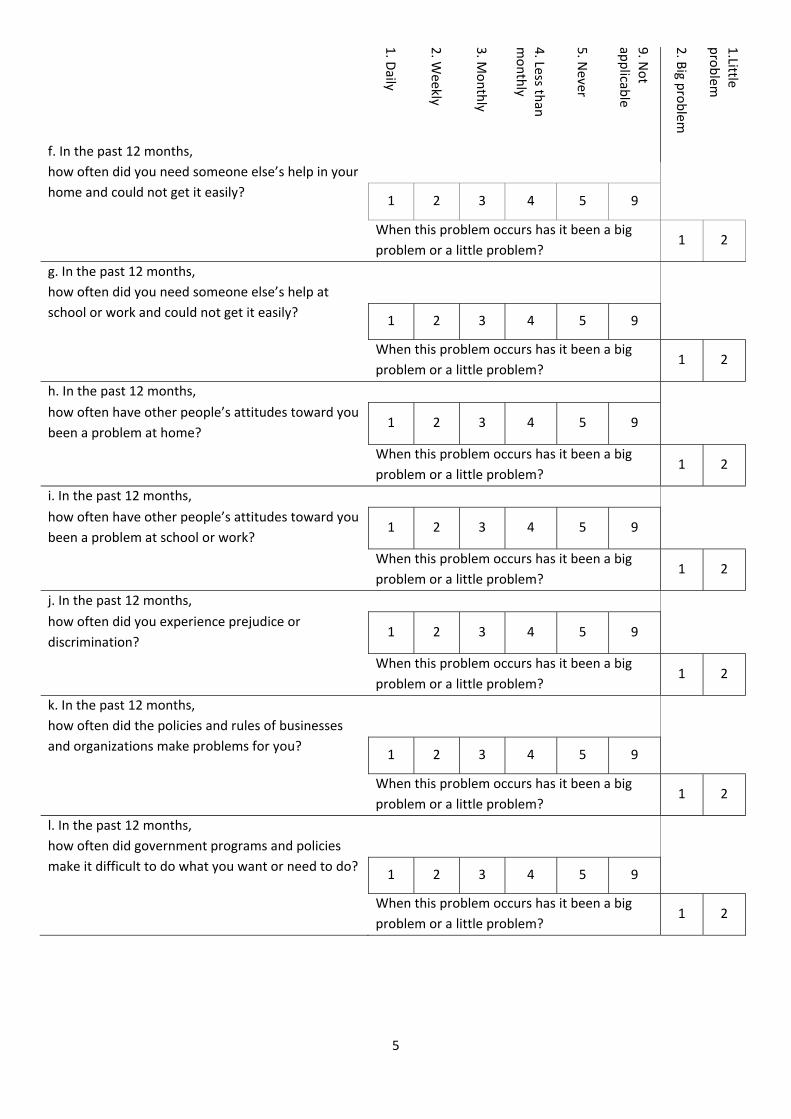
5
1. D
aily
2. W
eekly
3. M
onthly
4. Less th
an
monthly
5. N
ever
9. N
ot
applicab
le
2. B
ig problem
1.Little
problem
f. In the past 12 months,
how often did you need someone else’s help in your
home and could not get it easily?
1 2 3 4 5 9
When this problem occurs has it been a big
problem or a little problem? 1 2
g. In the past 12 months,
how often did you need someone else’s help at
school or work and could not get it easily?
1 2 3 4 5 9
When this problem occurs has it been a big
problem or a little problem? 1 2
h. In the past 12 months,
how often have other people’s attitudes toward you
been a problem at home? 1 2 3 4 5 9
When this problem occurs has it been a big
problem or a little problem? 1 2
i. In the past 12 months,
how often have other people’s attitudes toward you
been a problem at school or work? 1 2 3 4 5 9
When this problem occurs has it been a big
problem or a little problem? 1 2
j. In the past 12 months,
how often did you experience prejudice or
discrimination? 1 2 3 4 5 9
When this problem occurs has it been a big
problem or a little problem? 1 2
k. In the past 12 months,
how often did the policies and rules of businesses
and organizations make problems for you?
1 2 3 4 5 9
When this problem occurs has it been a big
problem or a little problem? 1 2
l. In the past 12 months,
how often did government programs and policies
make it difficult to do what you want or need to do?
1 2 3 4 5 9
When this problem occurs has it been a big
problem or a little problem? 1 2
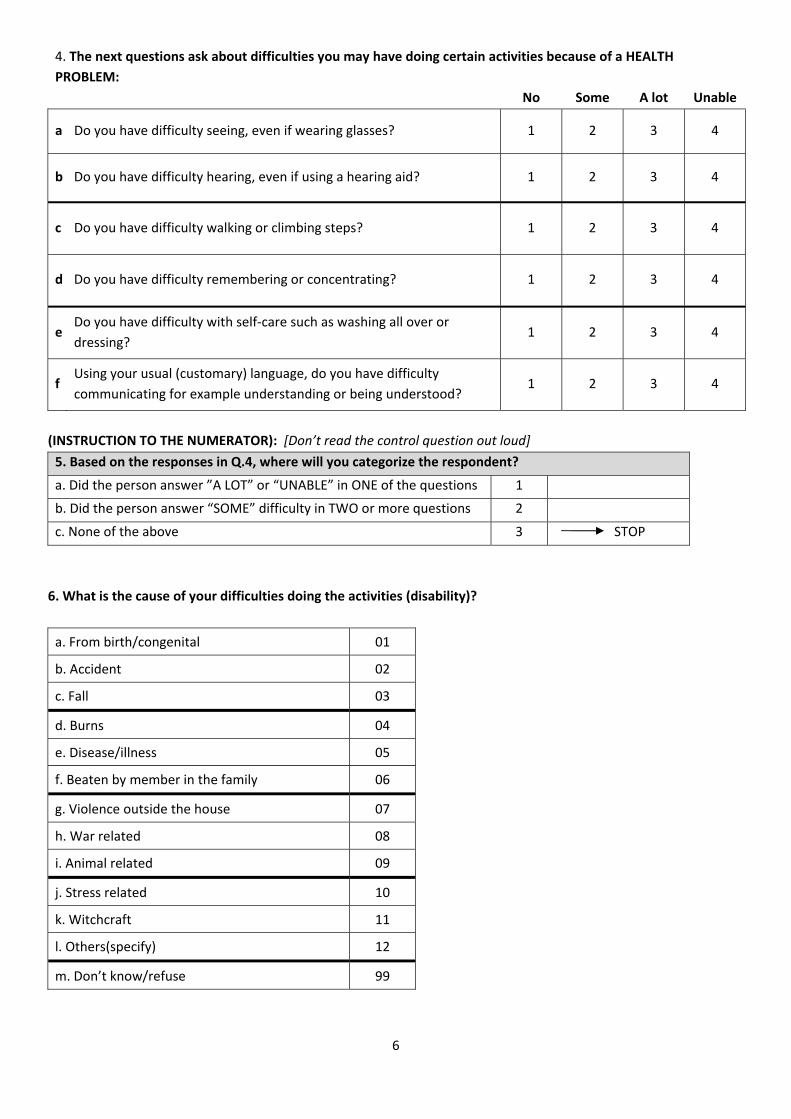
6
4. The next questions ask about difficulties you may have doing certain activities because of a HEALTH
PROBLEM:
No Some A lot Unable
a Do you have difficulty seeing, even if wearing glasses? 1 2 3 4
b Do you have difficulty hearing, even if using a hearing aid? 1 2 3 4
c Do you have difficulty walking or climbing steps? 1 2 3 4
d Do you have difficulty remembering or concentrating? 1 2 3 4
e Do you have difficulty with self‐care such as washing all over or
dressing? 1 2 3 4
f Using your usual (customary) language, do you have difficulty
communicating for example understanding or being understood? 1 2 3 4
(INSTRUCTION TO THE NUMERATOR): [Don’t read the control question out loud]
5. Based on the responses in Q.4, where will you categorize the respondent?
a. Did the person answer ”A LOT” or “UNABLE” in ONE of the questions 1
b. Did the person answer “SOME” difficulty in TWO or more questions 2
c. None of the above 3 STOP
6. What is the cause of your difficulties doing the activities (disability)?
a. From birth/congenital 01
b. Accident 02
c. Fall 03
d. Burns 04
e. Disease/illness 05
f. Beaten by member in the family 06
g. Violence outside the house 07
h. War related 08
i. Animal related 09
j. Stress related 10
k. Witchcraft 11
l. Others(specify) 12
m. Don’t know/refuse 99
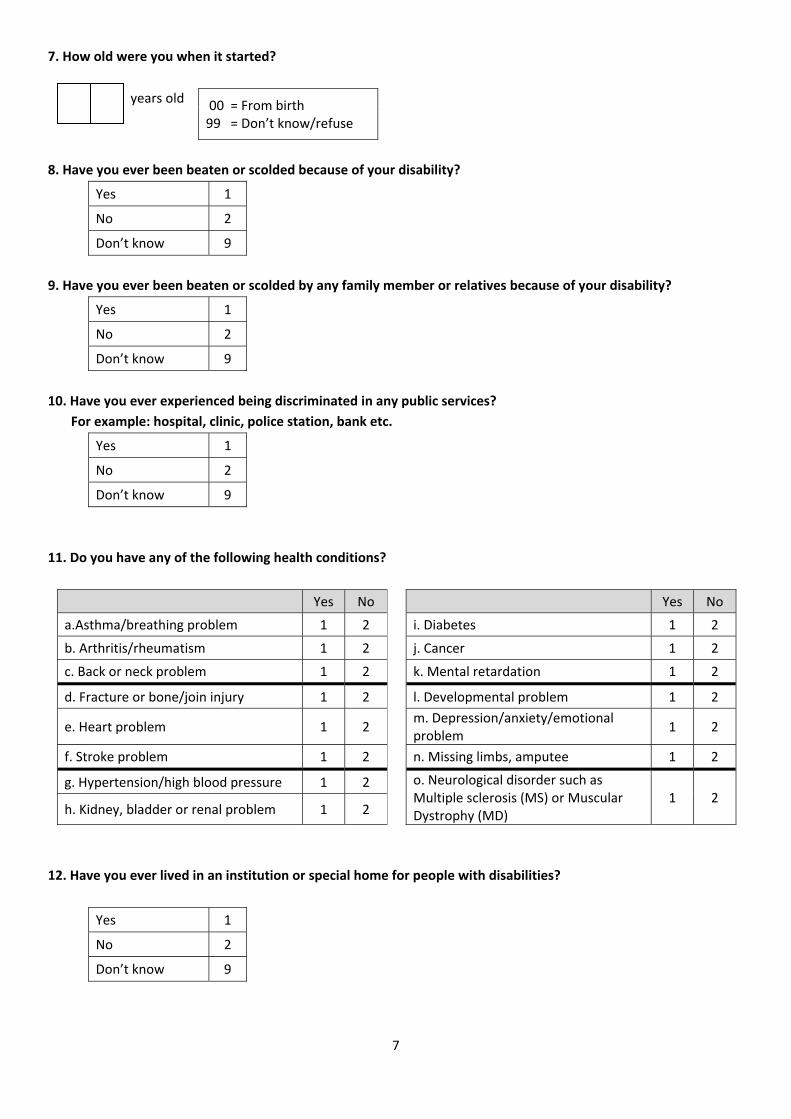
7
7. How old were you when it started?
years old 00 = From birth 99 = Don’t know/refuse
8. Have you ever been beaten or scolded because of your disability?
Yes 1
No 2
Don’t know 9
9. Have you ever been beaten or scolded by any family member or relatives because of your disability?
Yes 1
No 2
Don’t know 9
10. Have you ever experienced being discriminated in any public services?
For example: hospital, clinic, police station, bank etc.
Yes 1
No 2
Don’t know 9
11. Do you have any of the following health conditions?
Yes No Yes No
a.Asthma/breathing problem 1 2 i. Diabetes 1 2
b. Arthritis/rheumatism 1 2 j. Cancer 1 2
c. Back or neck problem 1 2 k. Mental retardation 1 2
d. Fracture or bone/join injury 1 2 l. Developmental problem 1 2
e. Heart problem 1 2 m. Depression/anxiety/emotional problem
1 2
f. Stroke problem 1 2 n. Missing limbs, amputee 1 2
g. Hypertension/high blood pressure 1 2 o. Neurological disorder such as Multiple sclerosis (MS) or Muscular Dystrophy (MD)
1 2 h. Kidney, bladder or renal problem 1 2
12. Have you ever lived in an institution or special home for people with disabilities?
Yes 1
No 2
Don’t know 9
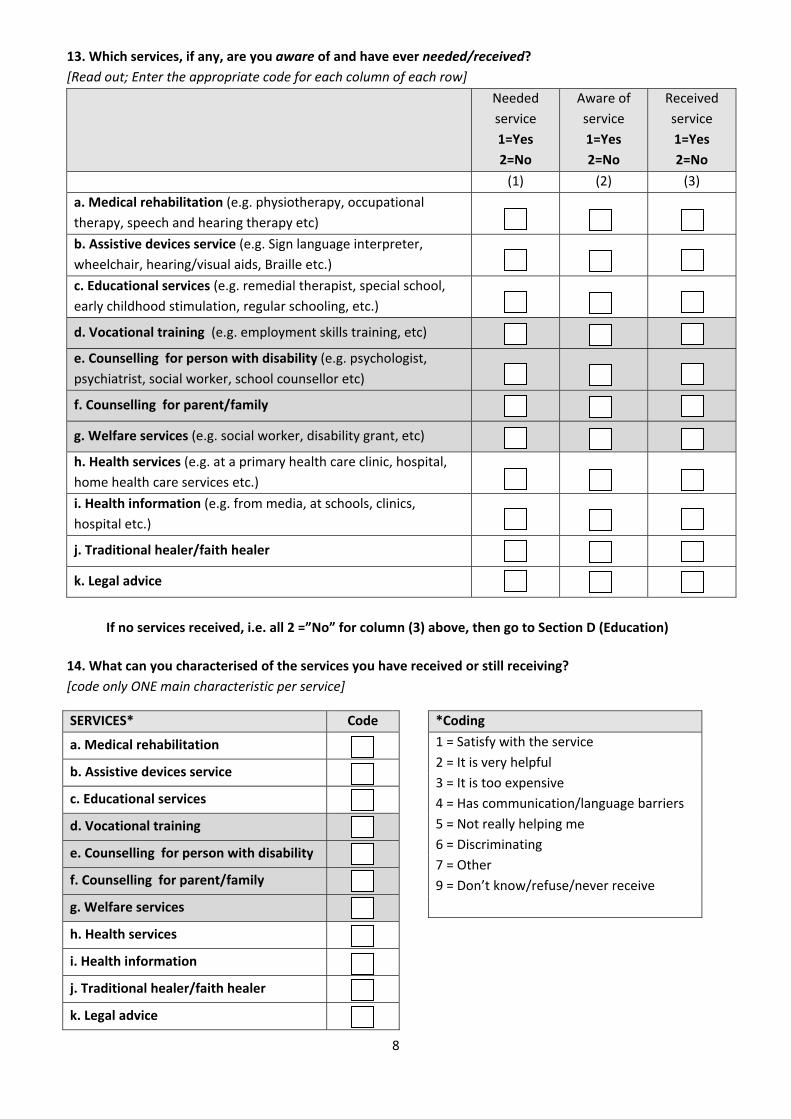
8
13. Which services, if any, are you aware of and have ever needed/received?
[Read out; Enter the appropriate code for each column of each row]
Needed
service
1=Yes
2=No
Aware of
service
1=Yes
2=No
Received
service
1=Yes
2=No
(1) (2) (3)
a. Medical rehabilitation (e.g. physiotherapy, occupational
therapy, speech and hearing therapy etc)
b. Assistive devices service (e.g. Sign language interpreter,
wheelchair, hearing/visual aids, Braille etc.)
c. Educational services (e.g. remedial therapist, special school,
early childhood stimulation, regular schooling, etc.)
d. Vocational training (e.g. employment skills training, etc)
e. Counselling for person with disability (e.g. psychologist,
psychiatrist, social worker, school counsellor etc)
f. Counselling for parent/family
g. Welfare services (e.g. social worker, disability grant, etc)
h. Health services (e.g. at a primary health care clinic, hospital,
home health care services etc.)
i. Health information (e.g. from media, at schools, clinics,
hospital etc.)
j. Traditional healer/faith healer
k. Legal advice
If no services received, i.e. all 2 =”No” for column (3) above, then go to Section D (Education)
14. What can you characterised of the services you have received or still receiving?
[code only ONE main characteristic per service]
SERVICES* Code
a. Medical rehabilitation
b. Assistive devices service
c. Educational services
d. Vocational training
e. Counselling for person with disability
f. Counselling for parent/family
g. Welfare services
h. Health services
i. Health information
j. Traditional healer/faith healer
k. Legal advice
*Coding
1 = Satisfy with the service
2 = It is very helpful
3 = It is too expensive
4 = Has communication/language barriers
5 = Not really helping me
6 = Discriminating
7 = Other
9 = Don’t know/refuse/never receive
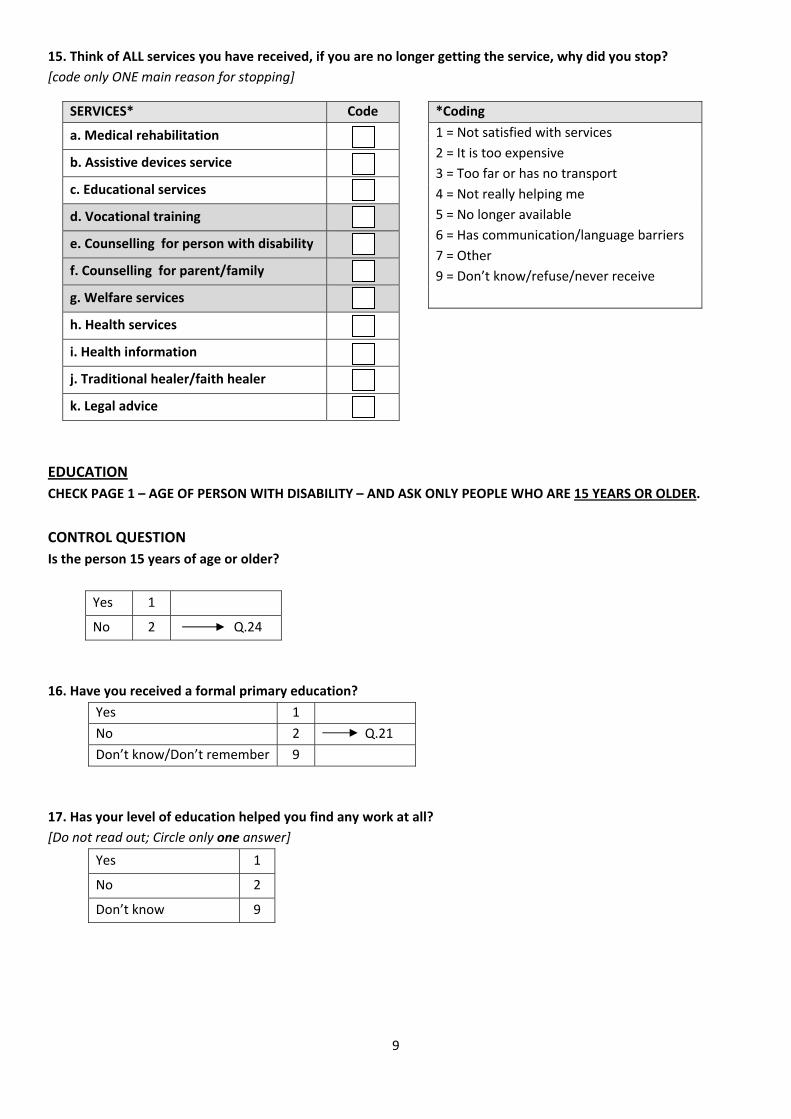
9
15. Think of ALL services you have received, if you are no longer getting the service, why did you stop?
[code only ONE main reason for stopping]
EDUCATION
CHECK PAGE 1 – AGE OF PERSON WITH DISABILITY – AND ASK ONLY PEOPLE WHO ARE 15 YEARS OR OLDER.
CONTROL QUESTION
Is the person 15 years of age or older?
Yes 1
No 2 Q.24
16. Have you received a formal primary education?
Yes 1
No 2 Q.21
Don’t know/Don’t remember 9
17. Has your level of education helped you find any work at all?
[Do not read out; Circle only one answer]
Yes 1
No 2
Don’t know 9
SERVICES* Code
a. Medical rehabilitation
b. Assistive devices service
c. Educational services
d. Vocational training
e. Counselling for person with disability
f. Counselling for parent/family
g. Welfare services
h. Health services
i. Health information
j. Traditional healer/faith healer
k. Legal advice
*Coding
1 = Not satisfied with services
2 = It is too expensive
3 = Too far or has no transport
4 = Not really helping me
5 = No longer available
6 = Has communication/language barriers
7 = Other
9 = Don’t know/refuse/never receive

10
18. What type of school do or did you mainly attend in pre‐school, primary, secondary or tertiary school?
[Do not read out; Circle only one answer for each line]
Mainstream/
Regular school
Special school
Special class in
mainstream/
regular school
Did not go to
school or N/A
Pre‐school/early childhood
development services 1 2 3 4
Primary school 1 2 3 4
Secondary school 1 2 3 4
Tertiary education 1 2 3 4
Vocational training 1 2 3 4
19. Have you ever been refused entry into a school, pre‐school or university because of your disability?
[Circle only one answer for each line]
Yes No
Not
applicable
Regular pre‐school 1 2 3
Regular primary school 1 2 3
Regular secondary school 1 2 3
Special school (any level) 1 2 3
Special class (remedial) 1 2 3
University 1 2 3
20. Did you study as far as you planned?
[Do not read out; Circle only one answer]
Yes 1
No 2
Still studying 3 Q.24
Don’t know 9
21. If you have NOT received a formal primary education, have you ever attended classes to learn to read and
write as an adult?
[This question is only asked if the respondent answer “NO” in Q.16]
Yes 1
No 2
Don’t know/Don’t remember 9

11
EMPLOYMENT AND INCOME
ASK ALL PERSONS WITH DISABILITIES 15 YEARS OF AGE OR OLDER.
22a. Are you currently working? (include casual labourers, part‐time work and those who are self‐employed).
Circle only one answer.
Yes, currently working 1
No, but have been employed previously 2
No, never been employed 3 Q.24
I am a housewife/homemaker 4 Q.24
22b. What is your income per. month from your job (if previously employed than from previous job)?
0 – 300 1
301 – 500 2
501 – 1 000 3
1 001 – 2 000 4
2 001 – 3 000 5
3 001 – 5 000 6
More than 5 000 7
23. If you are currently unemployed, why did you stop working?
To be answered ONLY if Q.22a is “have been employed previously”. Circle only one answer.
Illness 5
Because of disability 6
Other 7
Don’t know 9
24. Are you currently receiving social security, a disability grant or any other form of pension/grant?
Yes 1
No 2 Q.28
Don’t know 9 Q.28
25. What type of grant or pension do you receive?
[Do not read out; circle ALL that apply]
Type of grant or pension Code
a. Disability grant 1
b. Social Security 2
c. Workman’s Compensation 3
d. Private insurance/pension 4
e. Old age pension 5
f. Old age grant 6
g. Other (specify) 7
h. Don’t know 9
Retired 1
Retrenched (due to cut backs) 2
Fired 3
Injury/accident at work 4

12
26. What are the TWO MAIN THINGS that the money from your disability grant or pension is spent on?
[Do not read out; circle only ONE in Choice A and ONE in Choice B answers]
Item Choice A Choice B
a. Household necessities i.e. food, groceries etc. 01 01
b. Clothing 02 02
c. Rent/accommodation 03 03
d. Recreation/entertainment 04 04
e. Transport 05 05
f. Education 06 06
g. Water and electricity 07 07
h. Rehabilitation and health care services 08 08
i. Assistive devices 09 09
j. Personal assistant/carer (care for self) 10 10
k. Other (specify) 11 11
l. Don’t know 99 99
27. Are you the one who mainly decides how to spend your disability grant or pension?
Yes 1
No 2
Don’t know 9
YOUR SURROUNDINGS AND HOW EASY IT IS FOR YOU TO GET AROUND. IF YOU USE ONE OR MORE
ASSISTIVE DEVICES OR SOMEONE IS HELPING YOU, ANSWER AS IF YOU ARE USING THEM.
ASK BOTH DIRECT & PROXY REPORTERS. PLEASE REMEMBER THE INFORMATION MUST BE ABOUT THE PERSON
WITH DISABILITY.
28. Let’s look at your home first. Are the rooms and toilet accessible? By accessible we mean that you can get
there easily and use the facility most of the time.
[Read out; Circle only ONE answer for each line]
Home YES
(accessible)
NO
(not accessible) Have none
a. Kitchen 1 2 3
b. Bedroom 1 2 3
c. Living room 1 2 3
d. Dining room 1 2 3
e. Toilet 1 2 3

13
29. Now let’s look at various places you might go to. Think of getting in and out of the places, and tell me for
each place whether it is generally accessible to you or not. [Read out; Circle only one answer for each line]
Place YES
(Accessible)
NO
(Not accessible)
Not available/
Not applicable
a. The place where you work 1 2 3
b. The school you attend 1 2 3
c. The shops that you go to most often 1 2 3
d. Place of worship 1 2 3
e. Recreational facilities (e.g. cinema,
theatre, pubs, etc) – think of the last three
months
1 2 3
f. Sports facilities 1 2 3
g. Police station 1 2 3
h. Magistrates office/Traditional courts 1 2 3
i. Post office 1 2 3
j. Bank 1 2 3
k. Hospital 1 2 3
l. Primary Health Care Clinic 1 2 3
m. Public transportation (bus, taxi, train) 1 2 3
n. Hotels 1 2 3
ASSITIVE DEVICES:
ASK BOTH DIRECT & PROXY RESPONDENTS: PLEASE REMEMBER THE INFORMATION MUST BE ABOUT THE PERSON
WITH DISABILITY
30a. Do you use any medication or traditional medicine for pain that is caused by your disability?
Yes 1
No 2 Q.31
30b. If YES, what type of medication?
Modern 1
Traditional 2
Both 3
31. Do you use an assistive device? [For examples, see Q.32 below]
Yes 1
No 2 Q.37
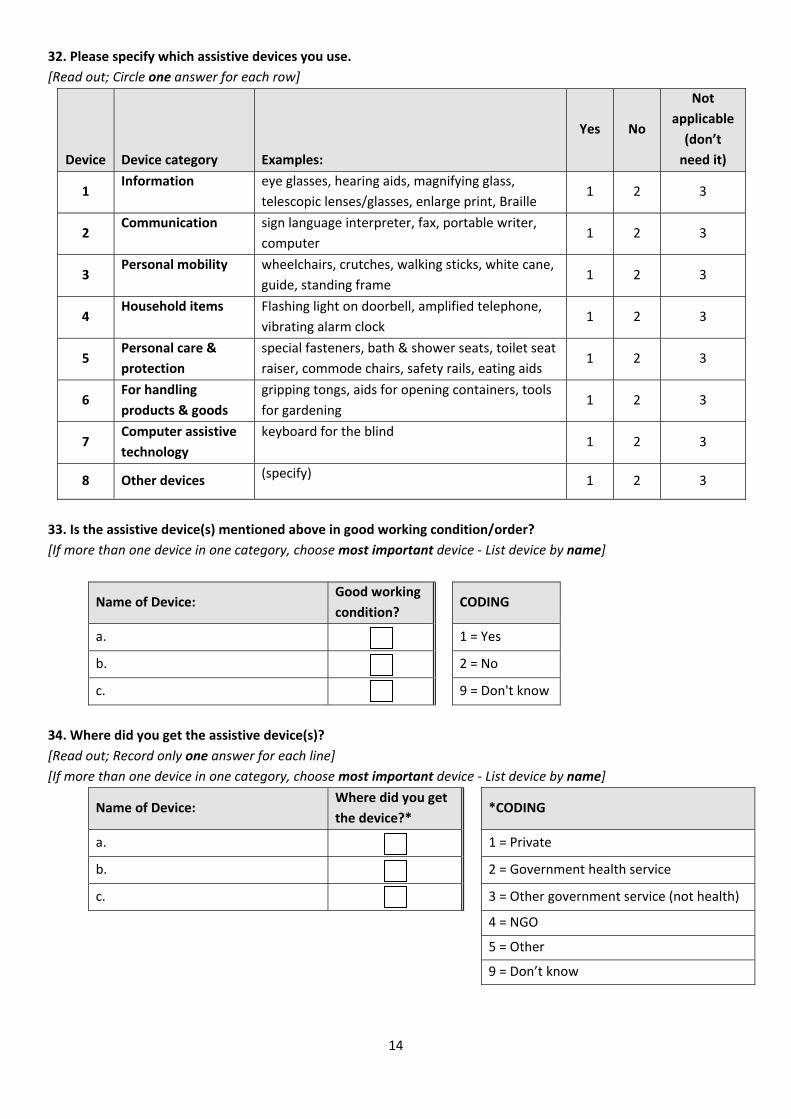
14
32. Please specify which assistive devices you use.
[Read out; Circle one answer for each row]
Device Device category Examples:
Yes No
Not
applicable
(don’t
need it)
1 Information eye glasses, hearing aids, magnifying glass,
telescopic lenses/glasses, enlarge print, Braille 1 2 3
2 Communication sign language interpreter, fax, portable writer,
computer 1 2 3
3 Personal mobility wheelchairs, crutches, walking sticks, white cane,
guide, standing frame 1 2 3
4 Household items Flashing light on doorbell, amplified telephone,
vibrating alarm clock 1 2 3
5 Personal care &
protection
special fasteners, bath & shower seats, toilet seat
raiser, commode chairs, safety rails, eating aids 1 2 3
6 For handling
products & goods
gripping tongs, aids for opening containers, tools
for gardening 1 2 3
7 Computer assistive
technology
keyboard for the blind 1 2 3
8 Other devices (specify)
1 2 3
33. Is the assistive device(s) mentioned above in good working condition/order?
[If more than one device in one category, choose most important device ‐ List device by name]
Name of Device: Good working
condition? CODING
a. 1 = Yes
b. 2 = No
c. 9 = Don't know
34. Where did you get the assistive device(s)?
[Read out; Record only one answer for each line]
[If more than one device in one category, choose most important device ‐ List device by name]
Name of Device: Where did you get
the device?* *CODING
a. 1 = Private
b. 2 = Government health service
c. 3 = Other government service (not health)
4 = NGO
5 = Other
9 = Don’t know
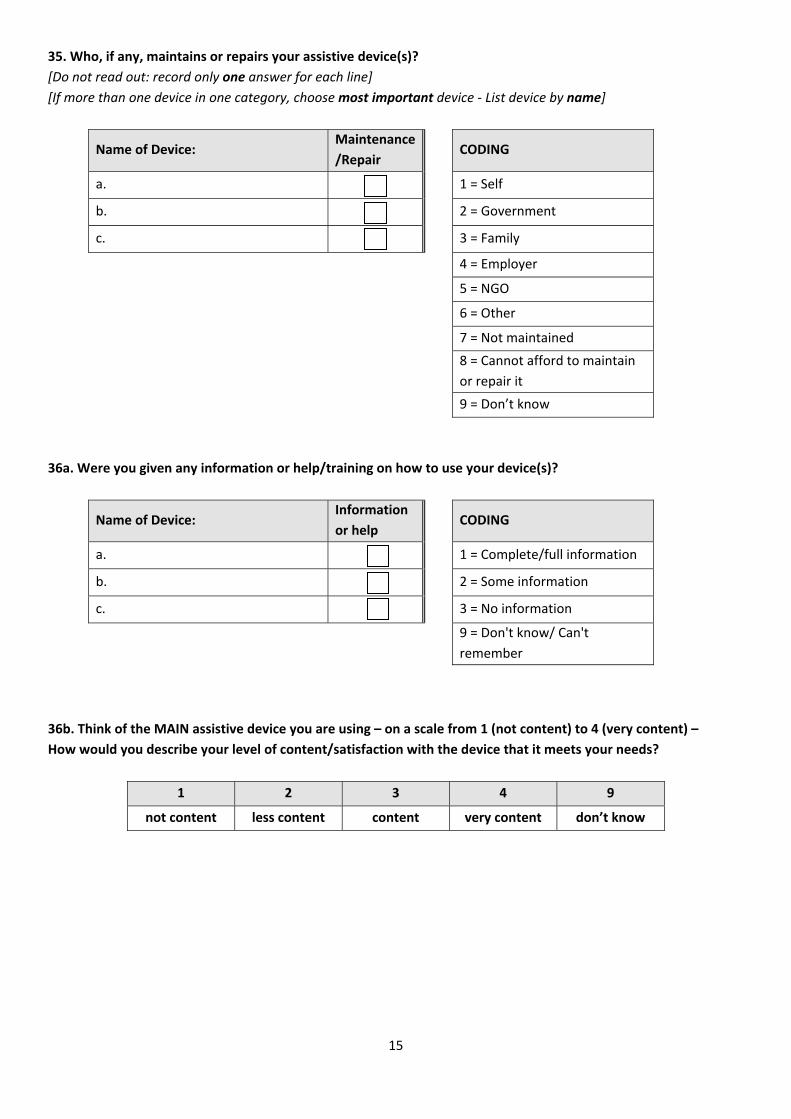
15
35. Who, if any, maintains or repairs your assistive device(s)?
[Do not read out: record only one answer for each line]
[If more than one device in one category, choose most important device ‐ List device by name]
Name of Device: Maintenance
/Repair CODING
a. 1 = Self
b. 2 = Government
c. 3 = Family
4 = Employer
5 = NGO
6 = Other
7 = Not maintained
8 = Cannot afford to maintain
or repair it
9 = Don’t know
36a. Were you given any information or help/training on how to use your device(s)?
Name of Device: Information
or help CODING
a. 1 = Complete/full information
b. 2 = Some information
c. 3 = No information
9 = Don't know/ Can't
remember
36b. Think of the MAIN assistive device you are using – on a scale from 1 (not content) to 4 (very content) –
How would you describe your level of content/satisfaction with the device that it meets your needs?
1 2 3 4 9
not content less content content very content don’t know
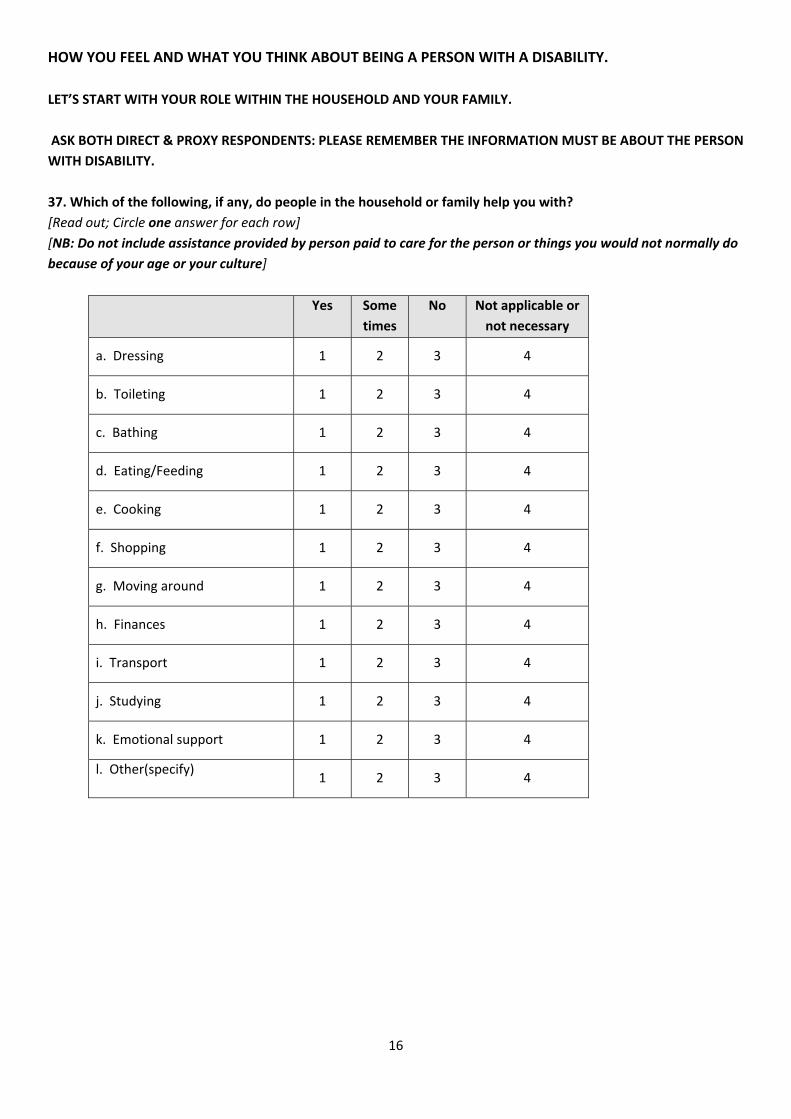
16
HOW YOU FEEL AND WHAT YOU THINK ABOUT BEING A PERSON WITH A DISABILITY.
LET’S START WITH YOUR ROLE WITHIN THE HOUSEHOLD AND YOUR FAMILY.
ASK BOTH DIRECT & PROXY RESPONDENTS: PLEASE REMEMBER THE INFORMATION MUST BE ABOUT THE PERSON
WITH DISABILITY.
37. Which of the following, if any, do people in the household or family help you with?
[Read out; Circle one answer for each row]
[NB: Do not include assistance provided by person paid to care for the person or things you would not normally do
because of your age or your culture]
Yes Some
times
No Not applicable or
not necessary
a. Dressing 1 2 3 4
b. Toileting 1 2 3 4
c. Bathing 1 2 3 4
d. Eating/Feeding 1 2 3 4
e. Cooking 1 2 3 4
f. Shopping 1 2 3 4
g. Moving around 1 2 3 4
h. Finances 1 2 3 4
i. Transport 1 2 3 4
j. Studying 1 2 3 4
k. Emotional support 1 2 3 4
l. Other(specify) 1 2 3 4
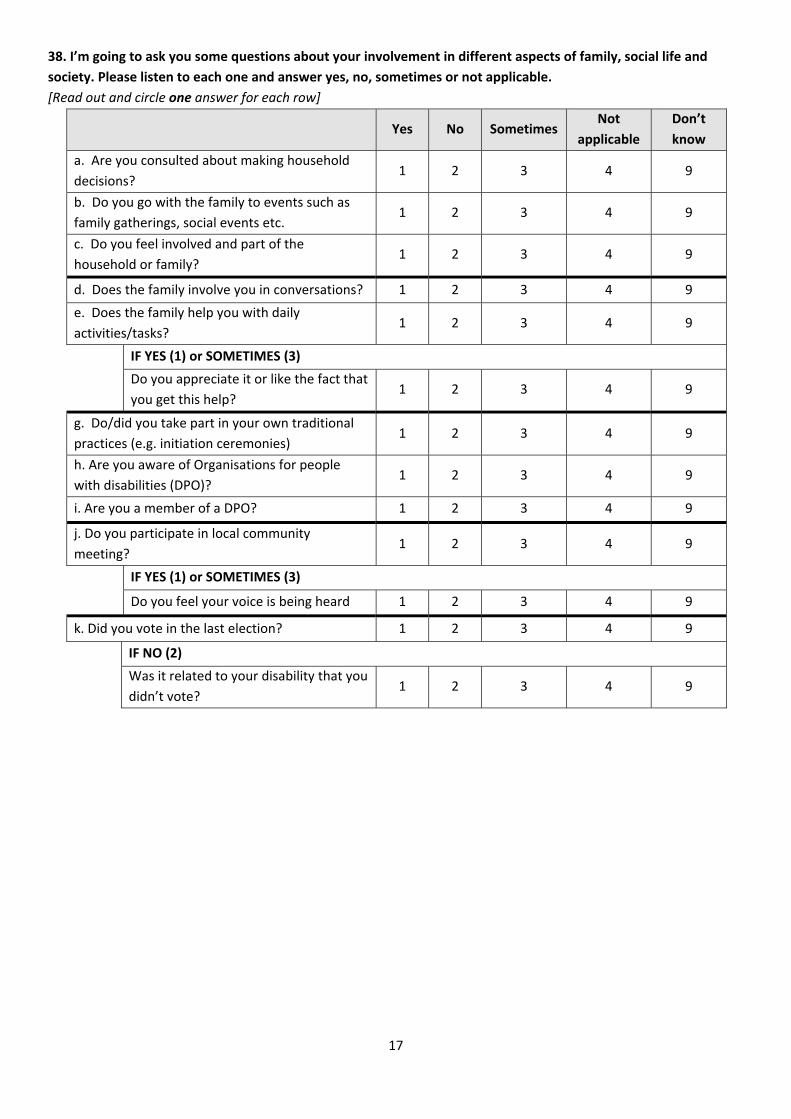
17
38. I’m going to ask you some questions about your involvement in different aspects of family, social life and
society. Please listen to each one and answer yes, no, sometimes or not applicable.
[Read out and circle one answer for each row]
Yes No Sometimes
Not
applicable
Don’t
know
a. Are you consulted about making household
decisions? 1 2 3 4 9
b. Do you go with the family to events such as
family gatherings, social events etc. 1 2 3 4 9
c. Do you feel involved and part of the
household or family? 1 2 3 4 9
d. Does the family involve you in conversations? 1 2 3 4 9
e. Does the family help you with daily
activities/tasks? 1 2 3 4 9
IF YES (1) or SOMETIMES (3)
Do you appreciate it or like the fact that
you get this help? 1 2 3 4 9
g. Do/did you take part in your own traditional
practices (e.g. initiation ceremonies) 1 2 3 4 9
h. Are you aware of Organisations for people
with disabilities (DPO)? 1 2 3 4 9
i. Are you a member of a DPO? 1 2 3 4 9
j. Do you participate in local community
meeting? 1 2 3 4 9
IF YES (1) or SOMETIMES (3)
Do you feel your voice is being heard 1 2 3 4 9
k. Did you vote in the last election? 1 2 3 4 9
IF NO (2)
Was it related to your disability that you
didn’t vote? 1 2 3 4 9
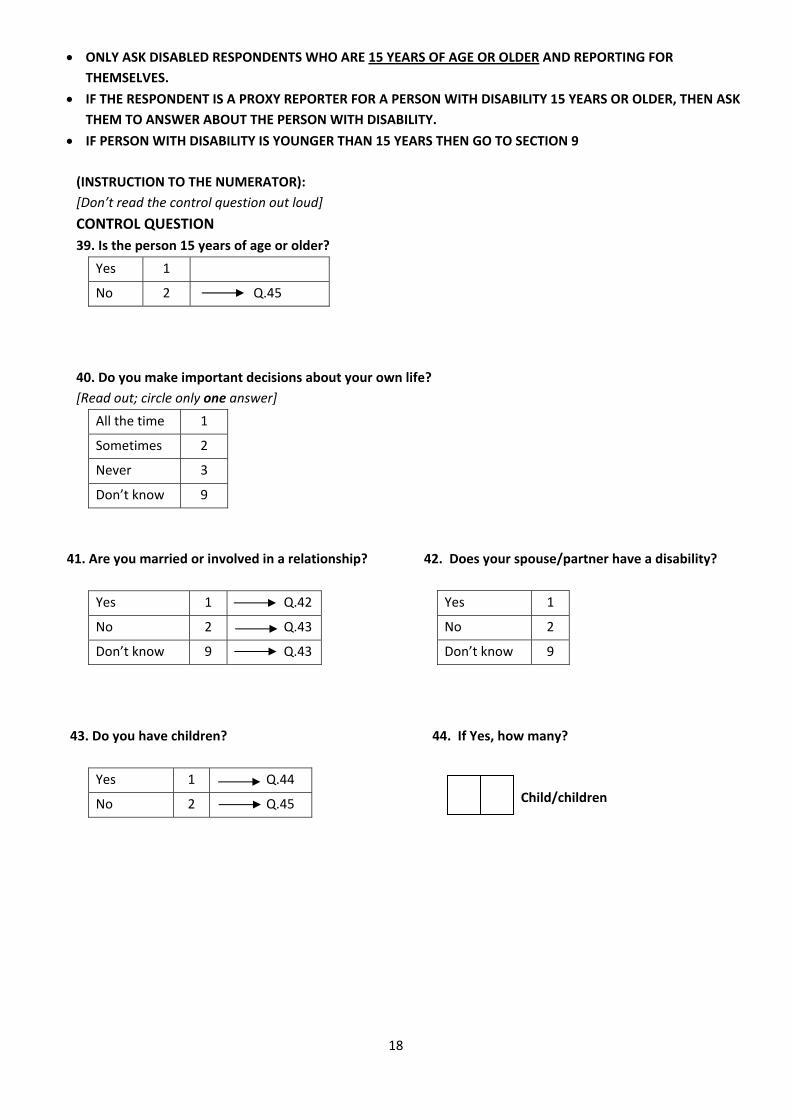
18
ONLY ASK DISABLED RESPONDENTS WHO ARE 15 YEARS OF AGE OR OLDER AND REPORTING FOR
THEMSELVES.
IF THE RESPONDENT IS A PROXY REPORTER FOR A PERSON WITH DISABILITY 15 YEARS OR OLDER, THEN ASK
THEM TO ANSWER ABOUT THE PERSON WITH DISABILITY.
IF PERSON WITH DISABILITY IS YOUNGER THAN 15 YEARS THEN GO TO SECTION 9
(INSTRUCTION TO THE NUMERATOR):
[Don’t read the control question out loud]
CONTROL QUESTION
39. Is the person 15 years of age or older?
Yes 1
No 2 Q.45
40. Do you make important decisions about your own life?
[Read out; circle only one answer]
All the time 1
Sometimes 2
Never 3
Don’t know 9
41. Are you married or involved in a relationship? 42. Does your spouse/partner have a disability?
Yes 1
No 2
Don’t know 9
43. Do you have children? 44. If Yes, how many?
Child/children
Yes 1 Q.42
No 2 Q.43
Don’t know 9 Q.43
Yes 1 Q.44
No 2 Q.45
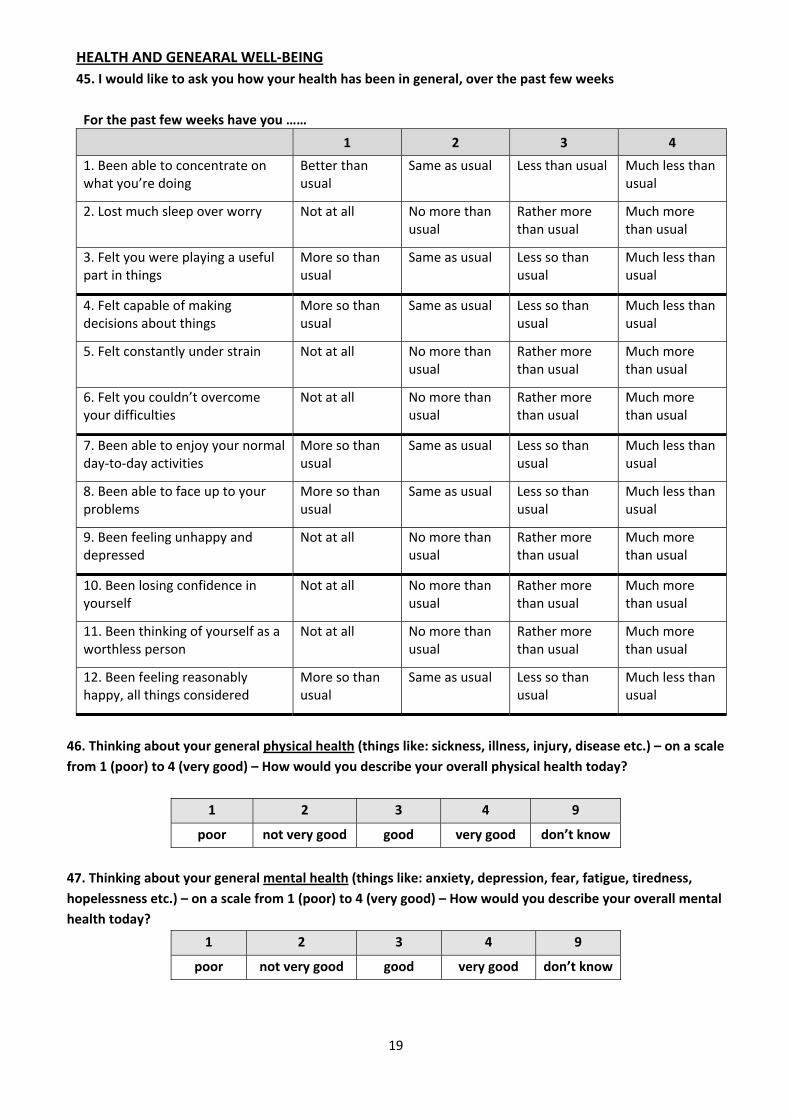
19
HEALTH AND GENEARAL WELL‐BEING
45. I would like to ask you how your health has been in general, over the past few weeks
For the past few weeks have you ……
1 2 3 4
1. Been able to concentrate on what you’re doing
Better than usual
Same as usual Less than usual Much less than usual
2. Lost much sleep over worry Not at all No more than usual
Rather more than usual
Much more than usual
3. Felt you were playing a useful part in things
More so than usual
Same as usual Less so than usual
Much less than usual
4. Felt capable of making decisions about things
More so than usual
Same as usual Less so than usual
Much less than usual
5. Felt constantly under strain Not at all No more than usual
Rather more than usual
Much more than usual
6. Felt you couldn’t overcome your difficulties
Not at all No more than usual
Rather more than usual
Much more than usual
7. Been able to enjoy your normal day‐to‐day activities
More so than usual
Same as usual Less so than usual
Much less than usual
8. Been able to face up to your problems
More so than usual
Same as usual Less so than usual
Much less than usual
9. Been feeling unhappy and depressed
Not at all No more than usual
Rather more than usual
Much more than usual
10. Been losing confidence in yourself
Not at all No more than usual
Rather more than usual
Much more than usual
11. Been thinking of yourself as a worthless person
Not at all No more than usual
Rather more than usual
Much more than usual
12. Been feeling reasonably happy, all things considered
More so than usual
Same as usual Less so than usual
Much less than usual
46. Thinking about your general physical health (things like: sickness, illness, injury, disease etc.) – on a scale
from 1 (poor) to 4 (very good) – How would you describe your overall physical health today?
1 2 3 4 9
poor not very good good very good don’t know
47. Thinking about your general mental health (things like: anxiety, depression, fear, fatigue, tiredness,
hopelessness etc.) – on a scale from 1 (poor) to 4 (very good) – How would you describe your overall mental
health today?
1 2 3 4 9
poor not very good good very good don’t know
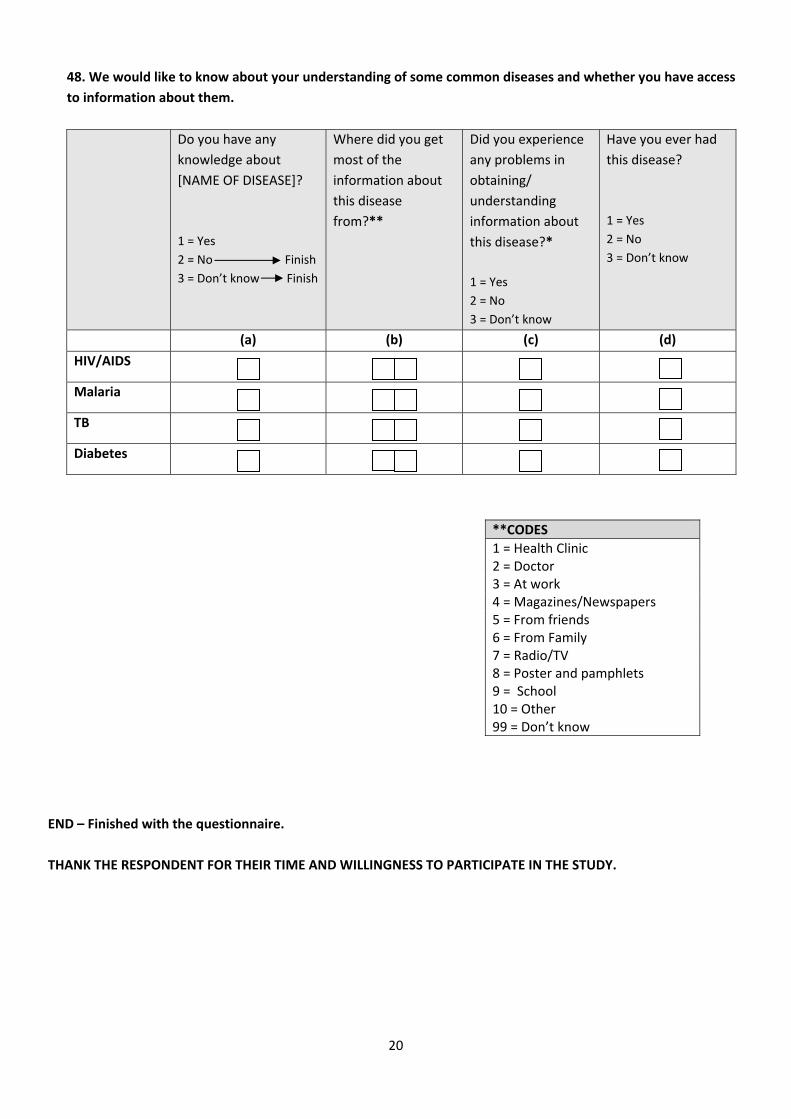
20
48. We would like to know about your understanding of some common diseases and whether you have access
to information about them.
Do you have any
knowledge about
[NAME OF DISEASE]?
1 = Yes
2 = No Finish
3 = Don’t know Finish
Where did you get
most of the
information about
this disease
from?**
Did you experience
any problems in
obtaining/
understanding
information about
this disease?*
1 = Yes
2 = No
3 = Don’t know
Have you ever had
this disease?
1 = Yes
2 = No
3 = Don’t know
(a) (b) (c) (d)
HIV/AIDS
Malaria
TB
Diabetes
END – Finished with the questionnaire.
THANK THE RESPONDENT FOR THEIR TIME AND WILLINGNESS TO PARTICIPATE IN THE STUDY.
**CODES
1 = Health Clinic 2 = Doctor 3 = At work 4 = Magazines/Newspapers 5 = From friends 6 = From Family 7 = Radio/TV 8 = Poster and pamphlets 9 = School 10 = Other 99 = Don’t know

1
CONTROL CONFIDENTIAL
QUESTIONNAIRE FOR PEOPLE WITHOUT DISABILITIES
Identification of person as control Code
NAME AND CODE OF REGION* _________________________________________
EA number ‐‐‐‐‐‐‐‐‐‐‐‐‐‐‐‐‐‐‐‐‐‐‐‐‐‐‐‐‐‐‐‐‐‐‐‐‐‐‐‐‐‐‐‐‐‐‐‐‐‐‐‐‐‐‐‐‐‐‐‐‐‐‐‐‐‐‐‐
NAME OF VILLAGE/LOCALITY _________________________________________
LOCATION 1 = urban 2 = rural
HOUSEHOLD NUMBER/ID ‐‐‐‐‐‐‐‐‐‐‐‐‐‐‐‐‐‐‐‐‐‐‐‐‐‐‐‐‐‐‐‐‐‐‐‐‐‐‐‐‐‐‐‐‐‐‐‐‐‐‐‐‐‐‐‐‐‐‐‐‐‐‐‐‐‐‐‐‐
NAME OF HOUSEHOLD HEAD _________________________________________
DETAIL OF PERSON AS CONTROL NAME ______________________________________________________________ AGE LINE NUMBER OF PERSON IN HOUSEHOLD LISTING
TO BE COMPLETED BY THE INTERVIEWER Time started Time completed Name of interviewer: ______________________________________________ Comments: Signature _____________________________________
Date of interview Day Month Year
SUPERVISOR Name : __________________________ Signature __________________________
INTERVIEW STATUS
Complete Incomplete
Enumerator has to return to the household
Yes No
CHECKED by the
Supervisor
*CODES FOR REGIONS
1 = Hhohho 2 = Mazini
3 = Shiselweni 4 = Lubombo
02 1 0

2
ACITVITY LIMITATION
1. How difficult it is for you to perform this activity WITHOUT any kind of assistance at all?
[Without the use of any assistive devices – either technical or personal]
Read out the options
ACTIVITY LIMITAION ITEMS* SCORE
a. watching/looking/seeing
b. listening/hearing
a. learning to read/write/count/calculate
b. acquiring skills (manipulating tools, painting, carving etc.)
c. thinking/concentrating
d. reading/writing/counting/calculating
e. solving problems
f. understanding others (spoken, written or sign language)
g. producing messages (spoken, written or sign language)
h. communicating directly with others
i. staying in one body position
j. changing a body position (sitting/standing/bending/lying)
k. transferring oneself (moving from one surface to another)
l. lifting/carrying/moving/handling objects
m. fine hand use (picking up/grasping/manipulating/releasing)
n. hand & arm use (pulling/pushing/reaching/throwing/catching)
o. walking
p. moving around (crawling/climbing/running/jumping)
Coding:
0 = No difficulty
1 = Mild difficulty
2 = Moderate difficulty
3 = Severe difficulty
4 = Unable to carry out the activity
9 = Not specified /Not applicable
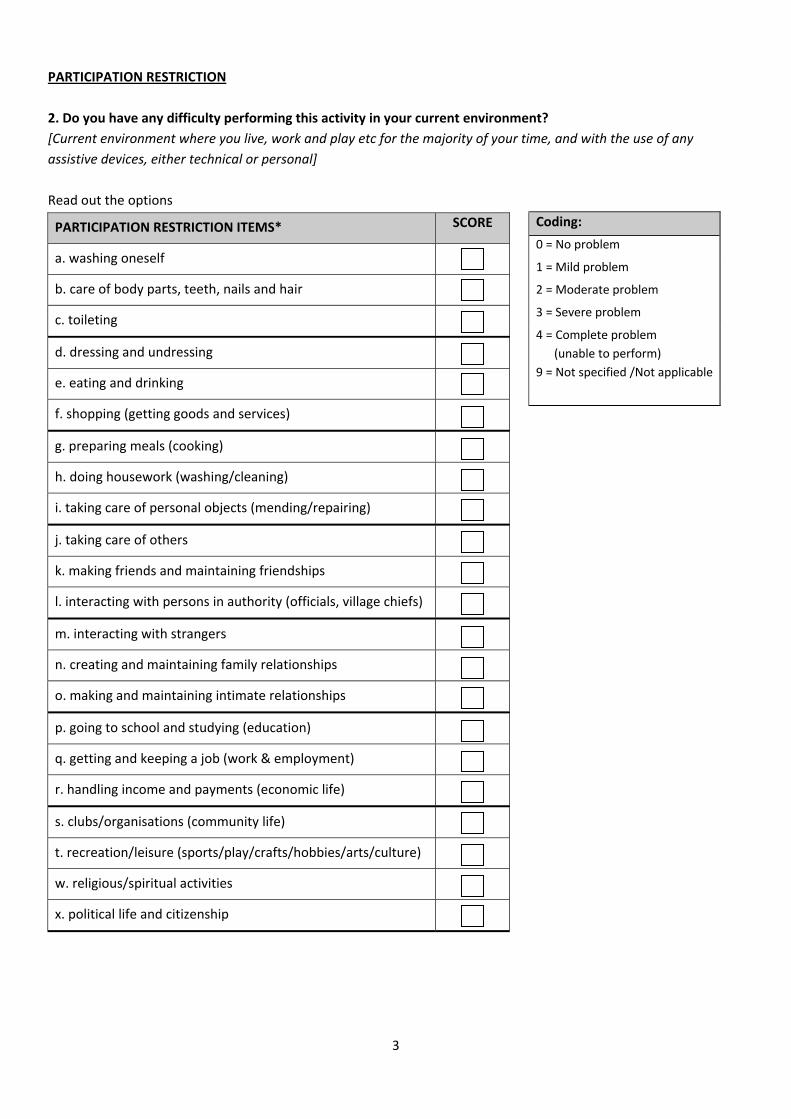
3
PARTICIPATION RESTRICTION
2. Do you have any difficulty performing this activity in your current environment?
[Current environment where you live, work and play etc for the majority of your time, and with the use of any
assistive devices, either technical or personal]
Read out the options
Coding:
0 = No problem
1 = Mild problem
2 = Moderate problem
3 = Severe problem
4 = Complete problem
(unable to perform)
9 = Not specified /Not applicable
PARTICIPATION RESTRICTION ITEMS* SCORE
a. washing oneself
b. care of body parts, teeth, nails and hair
c. toileting
d. dressing and undressing
e. eating and drinking
f. shopping (getting goods and services)
g. preparing meals (cooking)
h. doing housework (washing/cleaning)
i. taking care of personal objects (mending/repairing)
j. taking care of others
k. making friends and maintaining friendships
l. interacting with persons in authority (officials, village chiefs)
m. interacting with strangers
n. creating and maintaining family relationships
o. making and maintaining intimate relationships
p. going to school and studying (education)
q. getting and keeping a job (work & employment)
r. handling income and payments (economic life)
s. clubs/organisations (community life)
t. recreation/leisure (sports/play/crafts/hobbies/arts/culture)
w. religious/spiritual activities
x. political life and citizenship
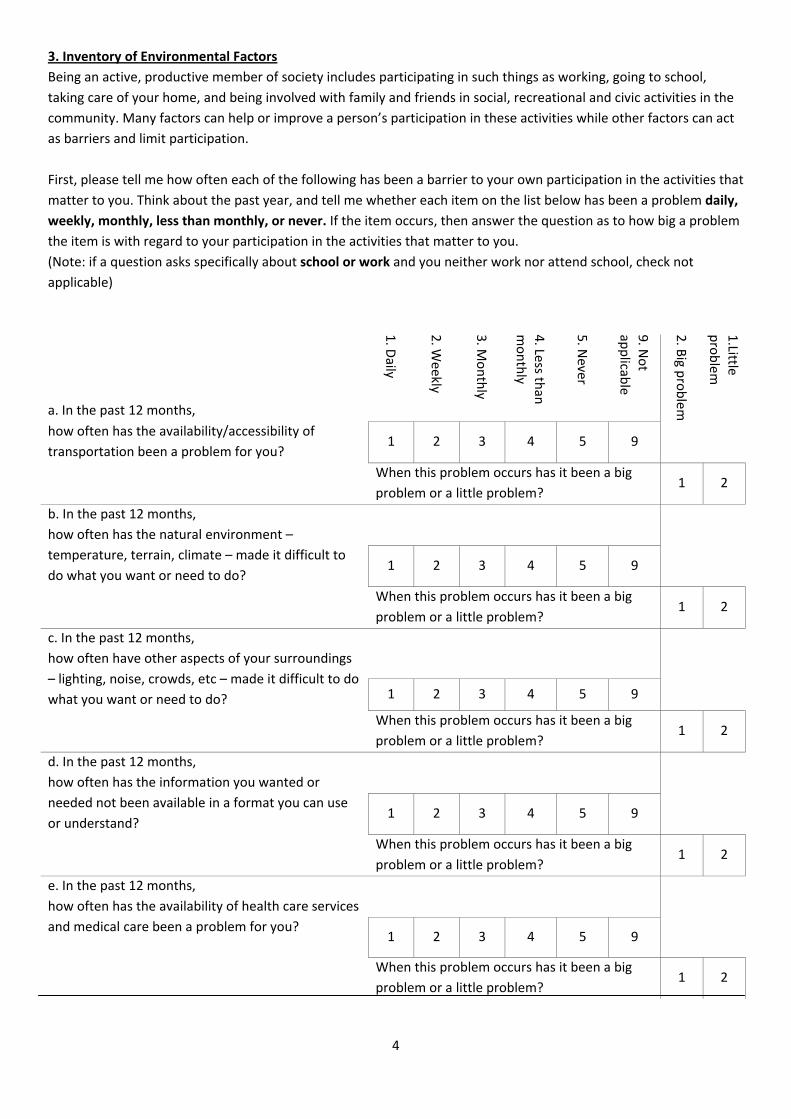
4
3. Inventory of Environmental Factors
Being an active, productive member of society includes participating in such things as working, going to school,
taking care of your home, and being involved with family and friends in social, recreational and civic activities in the
community. Many factors can help or improve a person’s participation in these activities while other factors can act
as barriers and limit participation.
First, please tell me how often each of the following has been a barrier to your own participation in the activities that
matter to you. Think about the past year, and tell me whether each item on the list below has been a problem daily,
weekly, monthly, less than monthly, or never. If the item occurs, then answer the question as to how big a problem
the item is with regard to your participation in the activities that matter to you.
(Note: if a question asks specifically about school or work and you neither work nor attend school, check not
applicable)
a. In the past 12 months, 1. D
aily
2. W
eekly
3. M
onthly
4. Less th
an
monthly
5. N
ever
9. N
ot
applicab
le
2. B
ig problem
1.Little
problem
how often has the availability/accessibility of
transportation been a problem for you? 1 2 3 4 5 9
When this problem occurs has it been a big
problem or a little problem? 1 2
b. In the past 12 months,
how often has the natural environment –
temperature, terrain, climate – made it difficult to
do what you want or need to do?
1 2 3 4 5 9
When this problem occurs has it been a big
problem or a little problem? 1 2
c. In the past 12 months,
how often have other aspects of your surroundings
– lighting, noise, crowds, etc – made it difficult to do
what you want or need to do?
1 2 3 4 5 9
When this problem occurs has it been a big
problem or a little problem? 1 2
d. In the past 12 months,
how often has the information you wanted or
needed not been available in a format you can use
or understand?
1 2 3 4 5 9
When this problem occurs has it been a big
problem or a little problem? 1 2
e. In the past 12 months,
how often has the availability of health care services
and medical care been a problem for you?
1 2 3 4 5 9
When this problem occurs has it been a big
problem or a little problem? 1 2

5
1. D
aily
2. W
eekly
3. M
onthly
4. Less th
an
monthly
5. N
ever
9. N
ot
applicab
le
2. B
ig problem
1.Little
problem
f. In the past 12 months,
how often did you need someone else’s help in your
home and could not get it easily?
1 2 3 4 5 9
When this problem occurs has it been a big
problem or a little problem? 1 2
g. In the past 12 months,
how often did you need someone else’s help at
school or work and could not get it easily?
1 2 3 4 5 9
When this problem occurs has it been a big
problem or a little problem? 1 2
h. In the past 12 months,
how often have other people’s attitudes toward you
been a problem at home? 1 2 3 4 5 9
When this problem occurs has it been a big
problem or a little problem? 1 2
i. In the past 12 months,
how often have other people’s attitudes toward you
been a problem at school or work? 1 2 3 4 5 9
When this problem occurs has it been a big
problem or a little problem? 1 2
j. In the past 12 months,
how often did you experience prejudice or
discrimination? 1 2 3 4 5 9
When this problem occurs has it been a big
problem or a little problem? 1 2
k. In the past 12 months,
how often did the policies and rules of businesses
and organizations make problems for you?
1 2 3 4 5 9
When this problem occurs has it been a big
problem or a little problem? 1 2
l. In the past 12 months,
how often did government programs and policies
make it difficult to do what you want or need to do?
1 2 3 4 5 9
When this problem occurs has it been a big
problem or a little problem? 1 2

6
4. The next questions ask about difficulties you may have doing certain activities because of a HEALTH
PROBLEM:
No Some A lot Unable
a Do you have difficulty seeing, even if wearing glasses? 1 2 3 4
b Do you have difficulty hearing, even if using a hearing aid? 1 2 3 4
c Do you have difficulty walking or climbing steps? 1 2 3 4
d Do you have difficulty remembering or concentrating? 1 2 3 4
e Do you have difficulty with self‐care such as washing all over or
dressing? 1 2 3 4
f Using your usual (customary) language, do you have difficulty
communicating for example understanding or being understood? 1 2 3 4
5. Do you have any of the following health conditions?
Yes No Yes No
a. Asthma/breathing problem 1 2 i. Diabetes 1 2
b. Arthritis/rheumatism 1 2 j. Cancer 1 2
c. Back or neck problem 1 2 k. Mental retardation 1 2
d. Fracture or bone/join injury 1 2 l. Developmental problem 1 2
e. Heart problem 1 2 m. Depression/anxiety/emotional problem
1 2
f. Stroke problem 1 2 n. Missing limbs, amputee 1 2
g. Hypertension/high blood pressure 1 2 o. Neurological disorder such as Multiple sclerosis (MS) or Muscular Dystrophy (MD)
1 2 h. Kidney, bladder or renal problem 1 2
EDUCATION
CHECK PAGE 1 –ASK ONLY PEOPLE WHO ARE 15 YEARS OR OLDER.
CONTROL QUESTION: [Don’t read the control question out loud]
6. Is the person 15 years of age or older?
Yes 1
No 2 Q.14
7. Have you received a formal primary education?
Yes 1 Q.9
No 2
Don’t know/Don’t remember 9 Q.11

7
8. If you have NOT received a formal primary education, have you ever attended classes to learn to read and write
as an adult?
Yes 1
No 2 Q.11
Don’t know/Don’t remember 9
9. Did you study as far as you planned?
[Do not read out; Circle only one answer]
Yes 1
No 2
Still studying 3 Q.14
Don’t know 9
10. Has your level of education helped you find any work at all?
[Do not read out; Circle only one answer]
Yes 1
No 2
Don’t know 9
EMPLOYMENT AND INCOME
ASK ALL PERSONS 15 YEARS OF AGE OR OLDER:
11. Are you currently working? (includes casual labourers, part‐time work and those who are self‐employed).
Circle only one answer.
Yes, currently working 1
No, but have been employed previously 2
No, never been employed 3 Q.14
I am a housewife/homemaker 4 Q.14
12. What is your income/month from your job (if previously employed than from previous job)?
0 – 300 1
301 – 500 2
501 – 1 000 3
1 001 – 2 000 4
2 001 – 3 000 5
3 001 – 5 000 6
More than 5 000 7
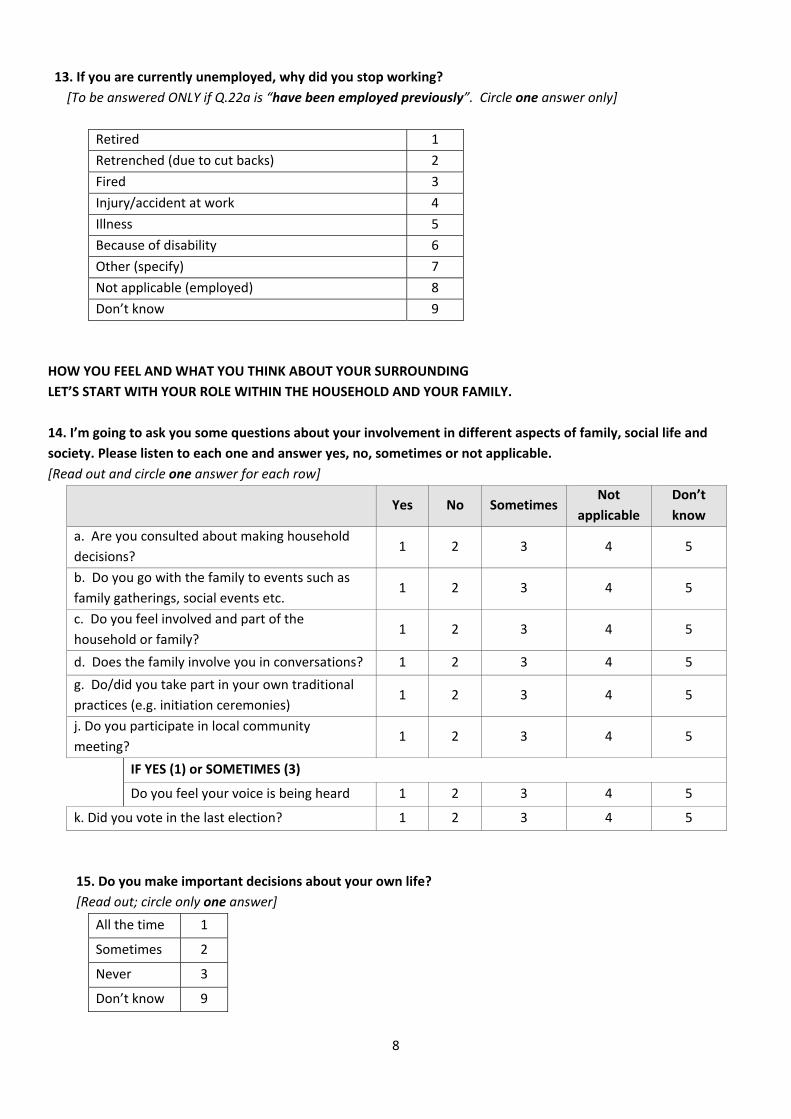
8
13. If you are currently unemployed, why did you stop working?
[To be answered ONLY if Q.22a is “have been employed previously”. Circle one answer only]
Retired 1
Retrenched (due to cut backs) 2
Fired 3
Injury/accident at work 4
Illness 5
Because of disability 6
Other (specify) 7
Not applicable (employed) 8
Don’t know 9
HOW YOU FEEL AND WHAT YOU THINK ABOUT YOUR SURROUNDING
LET’S START WITH YOUR ROLE WITHIN THE HOUSEHOLD AND YOUR FAMILY.
14. I’m going to ask you some questions about your involvement in different aspects of family, social life and
society. Please listen to each one and answer yes, no, sometimes or not applicable.
[Read out and circle one answer for each row]
Yes No Sometimes
Not
applicable
Don’t
know
a. Are you consulted about making household
decisions? 1 2 3 4 5
b. Do you go with the family to events such as
family gatherings, social events etc. 1 2 3 4 5
c. Do you feel involved and part of the
household or family? 1 2 3 4 5
d. Does the family involve you in conversations? 1 2 3 4 5
g. Do/did you take part in your own traditional
practices (e.g. initiation ceremonies) 1 2 3 4 5
j. Do you participate in local community
meeting? 1 2 3 4 5
IF YES (1) or SOMETIMES (3)
Do you feel your voice is being heard 1 2 3 4 5
k. Did you vote in the last election? 1 2 3 4 5
15. Do you make important decisions about your own life?
[Read out; circle only one answer]
All the time 1
Sometimes 2
Never 3
Don’t know 9
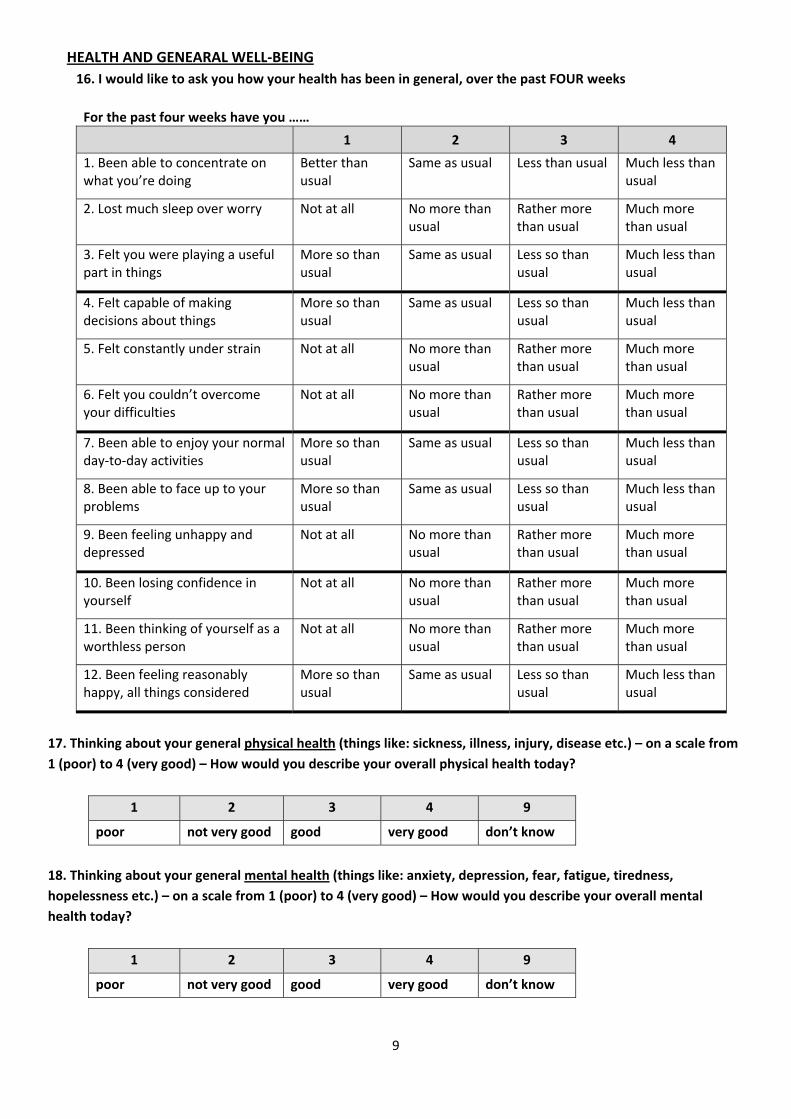
9
HEALTH AND GENEARAL WELL‐BEING
16. I would like to ask you how your health has been in general, over the past FOUR weeks
For the past four weeks have you ……
1 2 3 4
1. Been able to concentrate on what you’re doing
Better than usual
Same as usual Less than usual Much less than usual
2. Lost much sleep over worry Not at all No more than usual
Rather more than usual
Much more than usual
3. Felt you were playing a useful part in things
More so than usual
Same as usual Less so than usual
Much less than usual
4. Felt capable of making decisions about things
More so than usual
Same as usual Less so than usual
Much less than usual
5. Felt constantly under strain Not at all No more than usual
Rather more than usual
Much more than usual
6. Felt you couldn’t overcome your difficulties
Not at all No more than usual
Rather more than usual
Much more than usual
7. Been able to enjoy your normal day‐to‐day activities
More so than usual
Same as usual Less so than usual
Much less than usual
8. Been able to face up to your problems
More so than usual
Same as usual Less so than usual
Much less than usual
9. Been feeling unhappy and depressed
Not at all No more than usual
Rather more than usual
Much more than usual
10. Been losing confidence in yourself
Not at all No more than usual
Rather more than usual
Much more than usual
11. Been thinking of yourself as a worthless person
Not at all No more than usual
Rather more than usual
Much more than usual
12. Been feeling reasonably happy, all things considered
More so than usual
Same as usual Less so than usual
Much less than usual
17. Thinking about your general physical health (things like: sickness, illness, injury, disease etc.) – on a scale from
1 (poor) to 4 (very good) – How would you describe your overall physical health today?
1 2 3 4 9
poor not very good good very good don’t know
18. Thinking about your general mental health (things like: anxiety, depression, fear, fatigue, tiredness,
hopelessness etc.) – on a scale from 1 (poor) to 4 (very good) – How would you describe your overall mental
health today?
1 2 3 4 9
poor not very good good very good don’t know

10
19. We would like know about your understanding of some common diseases and whether you have access to
information about them.
Do you have any
knowledge about
[NAME OF DISEASE]?
1 = Yes
2 = No Finish
3 = Don’t know Finish
Where did you get
most of the
information about
[NAME OF DISEASE]
from?**
Did you experience
any problems in
obtaining/
understanding
information about
[NAME OF
DISEASE]?*
1 = Yes
2 = No
3 = Don’t know
Have you ever had
[NAME OF
DISEASE]?
1 = Yes
2 = No
3 = Don’t know
(a) (b) (c) (d)
HIV/AIDS
Malaria
TB
Diabetes
END – Finished with the questionnaire.
THANK THE RESPONDENT FOR THEIR TIME IN COMPLETEING THE QUESTIONNAIRE.
**CODES
1 = Health Clinic 2 = Doctor 3 = At work 4 = Magazines/Newspapers 5 = From friends 6 = From Family 7 = Radio/TV 8 = Poster and pamphlets 9 = School 10 = Other 99 = Don’t know


Technology for a better society
www.sintef.no
Recommended