Distribution of
Imagery to End Users
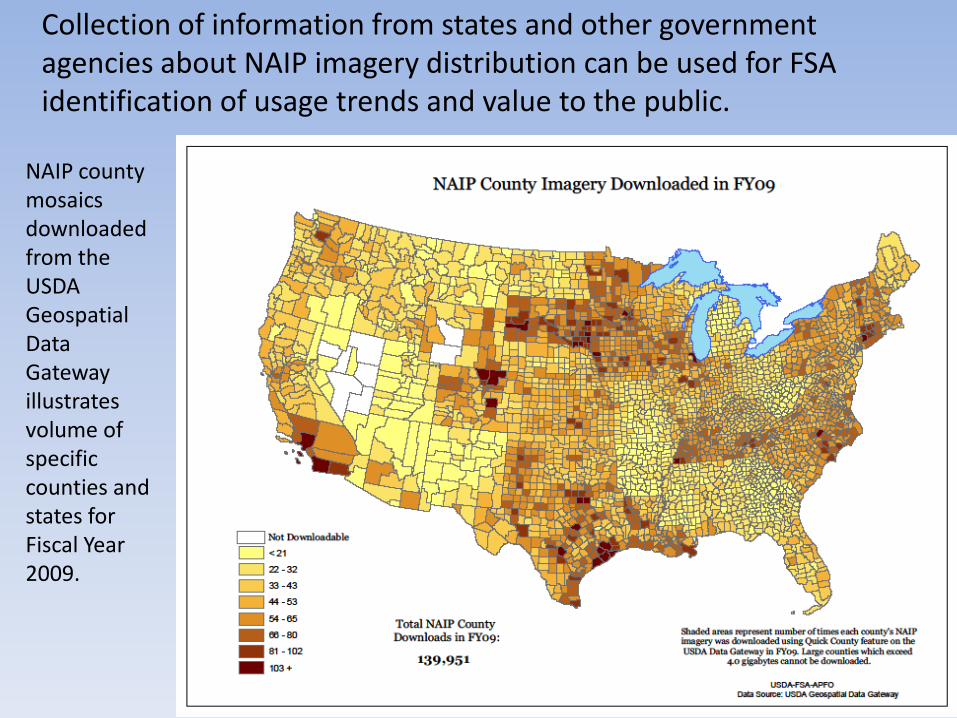
Collection of information from states and other government agencies about NAIP imagery distribution can be used for FSA identification of usage trends and value to the public.
NAIP county mosaics downloaded from the USDA Geospatial Data Gateway illustrates volume of specific counties and states for Fiscal Year 2009.
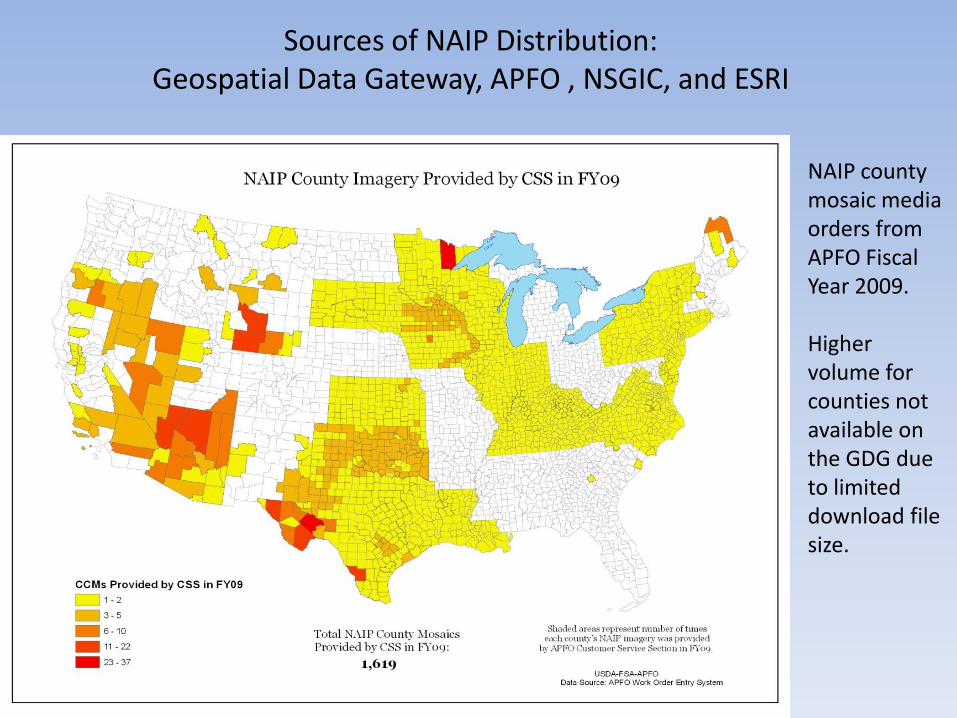
Sources of NAIP Distribution:Geospatial Data Gateway, APFO , NSGIC, and ESRI
NAIP county mosaic media orders from APFO Fiscal Year 2009.
Higher volume for counties not available on the GDG due to limited download file size.
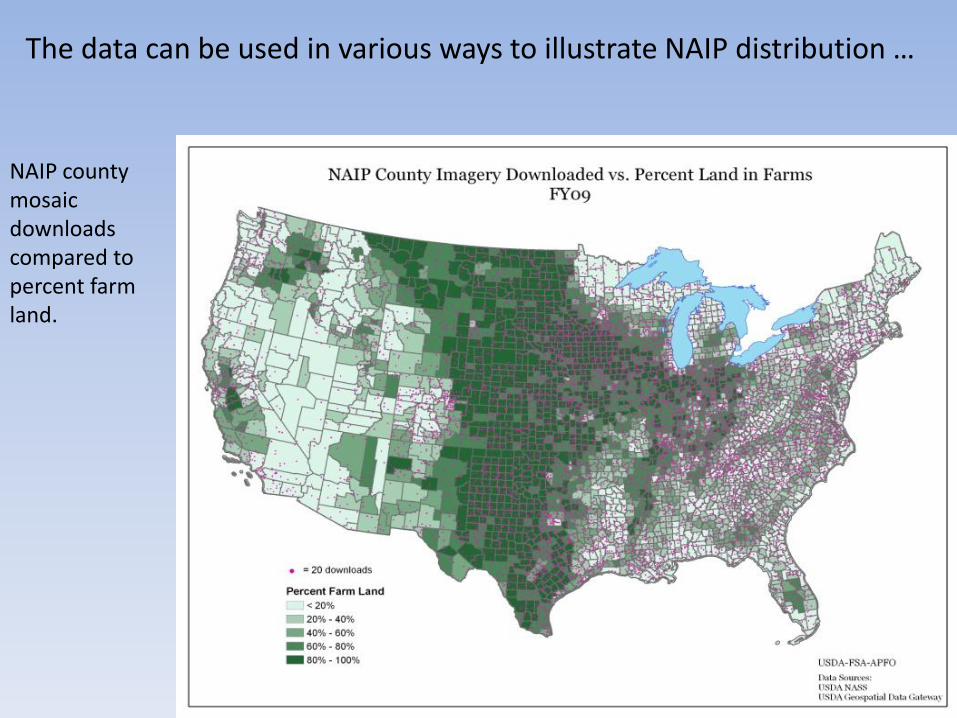
The data can be used in various ways to illustrate NAIP distribution …
NAIP county mosaic downloads compared to percent farm land.
NAIP03
NAIP04
NAIP05
NAIP06
NAIP07
NAIP08
NAIP09
NAIP10
-
10,000
20,000
30,000
40,000
50,000
60,000
70,000
80,000
90,000
100,000
FY2004FY2005
FY2006FY2007
FY2008FY2009
FY2010
NAIP03
NAIP04
NAIP05
NAIP06
NAIP07
NAIP08
NAIP09
NAIP10
GDG CCM DOWNLOADS
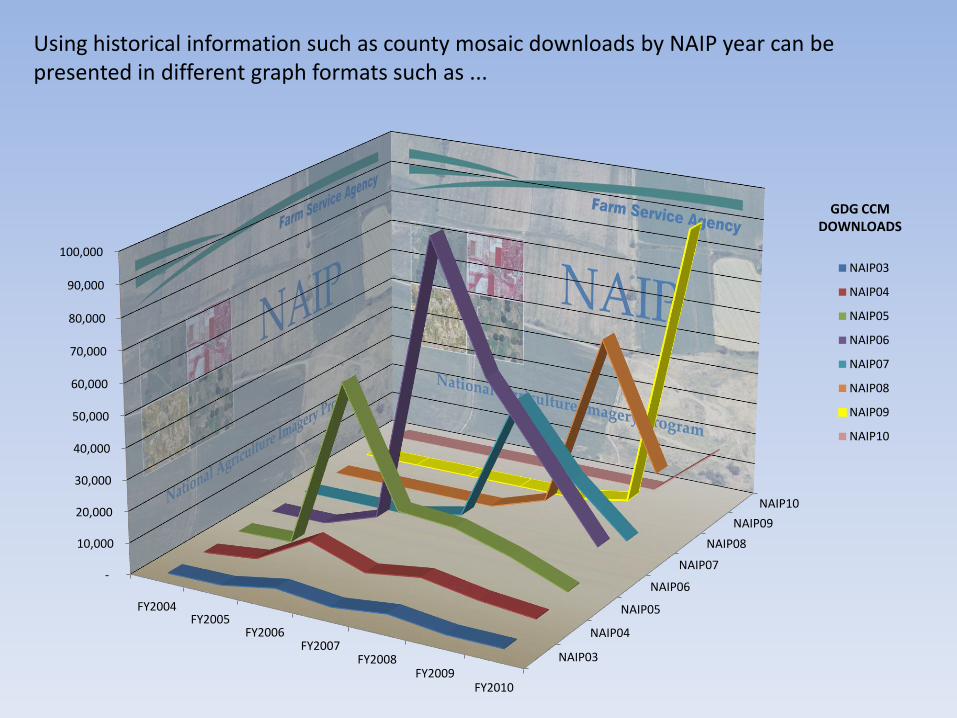
Using historical information such as county mosaic downloads by NAIP year can be presented in different graph formats such as ...
0%
10%
20%
30%
40%
50%
60%
70%
80%
90%
100%
FY2004FY2005
FY2006FY2007
FY2008FY2009
FY2010
222
451
3,549
1,772 3,792 1,689
1,595
-
1,946
11,541
5,512 8,062
5,073 3,398
-
564
55,155
18,269 16,869
11,594
4,599
- -
5,918
98,216
57,696
34,656
11,686
- - -3,749
44,730
22,655
6,808
- - - -5,796
61,327
22,028
- - - - -2,958
94,015
- - - - - -
14,914
NAIP10
NAIP09
NAIP08
NAIP07
NAIP06
NAIP05
NAIP04
NAIP03
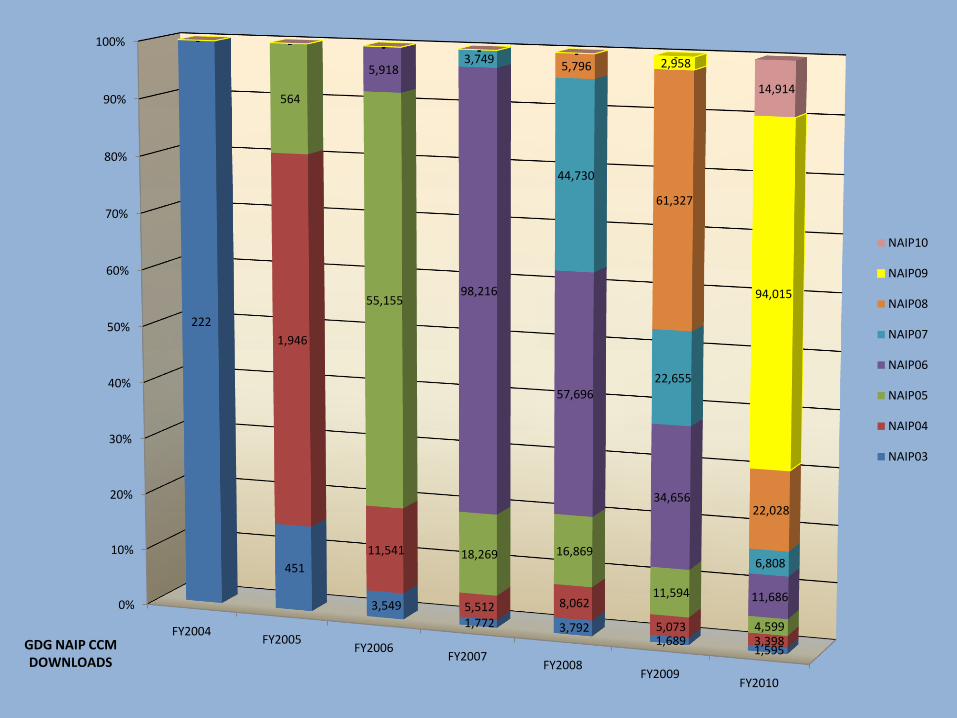
GDG NAIP CCM DOWNLOADS
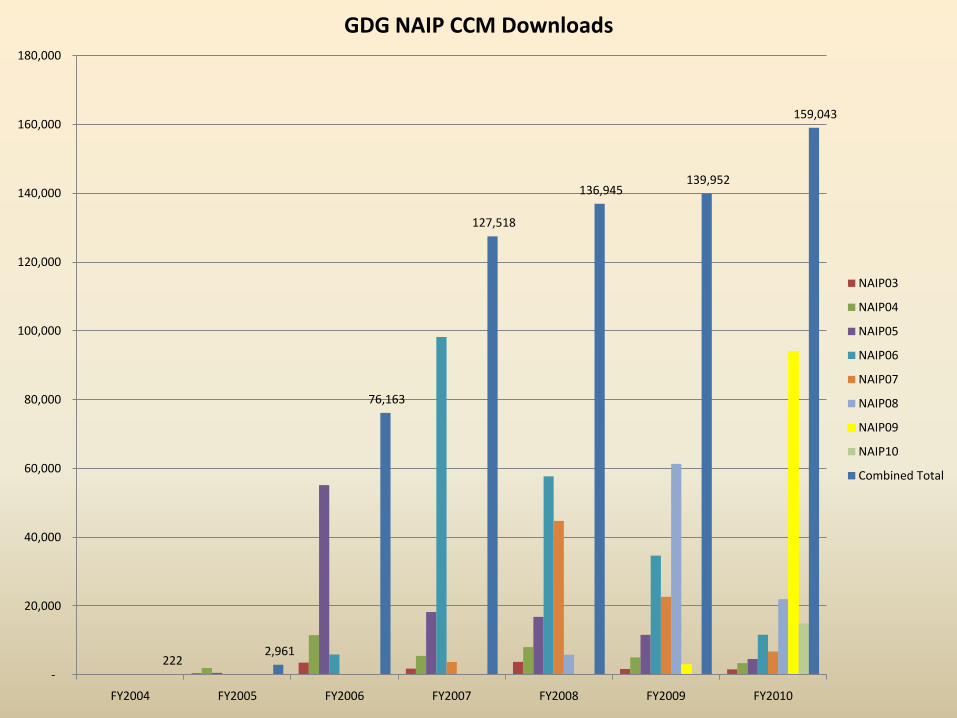
222 2,961
76,163
127,518
136,945 139,952
159,043
-
20,000
40,000
60,000
80,000
100,000
120,000
140,000
160,000
180,000
FY2004 FY2005 FY2006 FY2007 FY2008 FY2009 FY2010
GDG NAIP CCM Downloads
NAIP03
NAIP04
NAIP05
NAIP06
NAIP07
NAIP08
NAIP09
NAIP10
Combined Total
Stat
e
Product Available Gross Page
Hits
# of
CCMs
# of QQ Total
Downloads
Month
s
AR CCM 221 1
AZ CCM; DOQQ
(Chargable)
7 28 12
CA CCM; DOQQ
CO CCM
GA CCM; DOQQ
ID CCM; DOQQ 815,268 10,656 37,179 72
IL QQ in MrSid format
IN CCM; DOQQ 59,713 12
IA CCM
KS CCM
KY ?
MD CCM
MN CCM
MO CCM
MS CCM
MT CCM
NE CCM
NV CCM & QQ
NH CCM
ND CCM
OK CCM
OR CCM
PA CCM 15,035 8,976 12
RI CCM & QQ 354
TN CCM & QQ 74,372 12
TX CCM & QQ
UT DOQQ(Compressed)
VT CCM
VA CCM 32,500 2,679 8
WA CCM
WV CCM
WI ? 181,000 2,481 12
UT ?
Host Gross Page Hits
AZ 1,637,391
CA
CT
IN 24,300
IA 540,000
ME 600,000
MN 7,543,934
MT 389,000
NH
OR 37,000,000
USGS
UT 83,556
WI
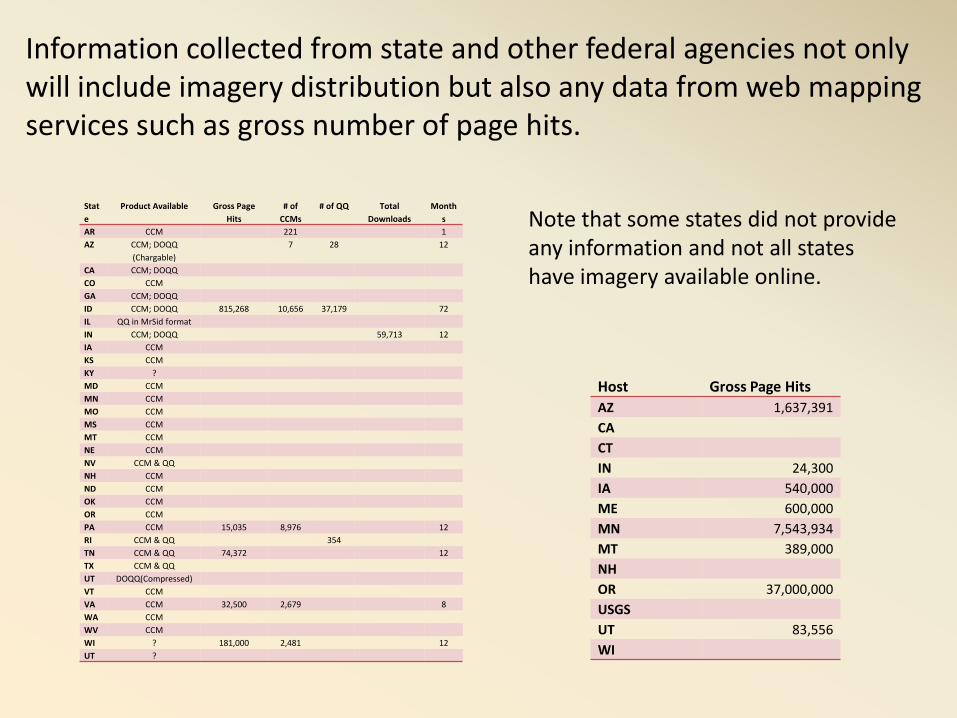
Information collected from state and other federal agencies not only will include imagery distribution but also any data from web mapping services such as gross number of page hits.
Note that some states did not provide any information and not all states have imagery available online.
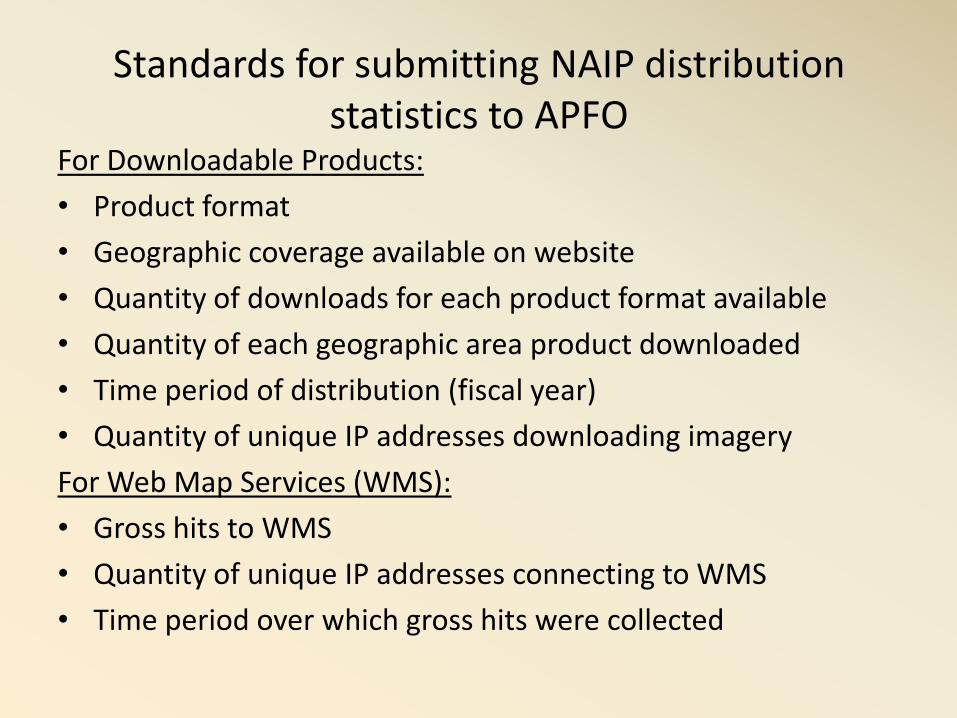
Standards for submitting NAIP distribution statistics to APFO
For Downloadable Products:
• Product format
• Geographic coverage available on website
• Quantity of downloads for each product format available
• Quantity of each geographic area product downloaded
• Time period of distribution (fiscal year)
• Quantity of unique IP addresses downloading imagery
For Web Map Services (WMS):
• Gross hits to WMS
• Quantity of unique IP addresses connecting to WMS
• Time period over which gross hits were collected
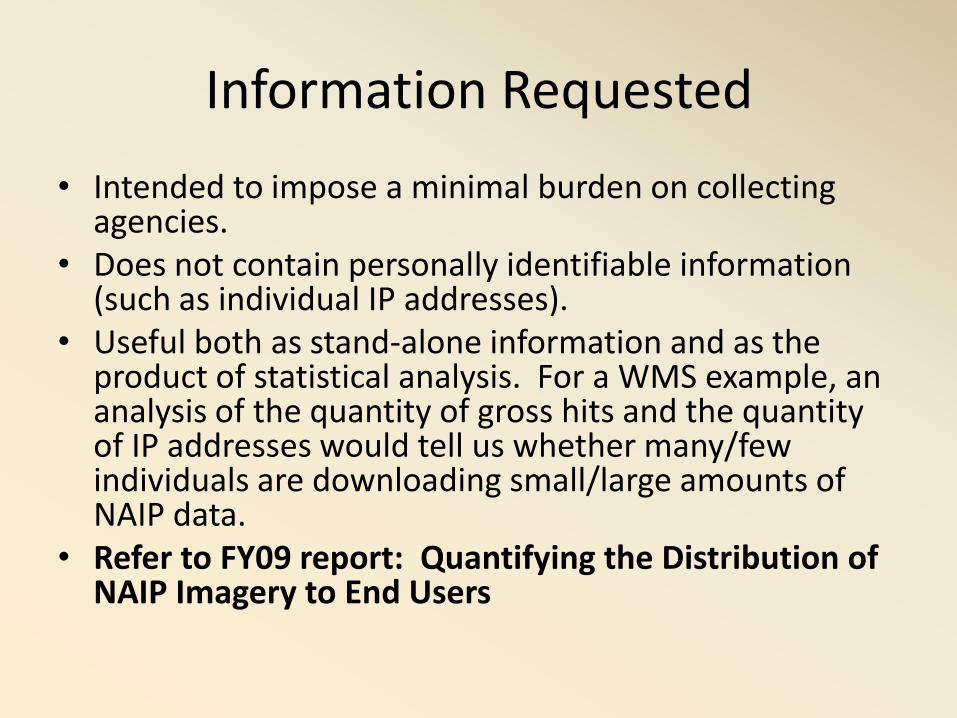
Information Requested
• Intended to impose a minimal burden on collecting agencies.
• Does not contain personally identifiable information (such as individual IP addresses).
• Useful both as stand-alone information and as the product of statistical analysis. For a WMS example, an analysis of the quantity of gross hits and the quantity of IP addresses would tell us whether many/few individuals are downloading small/large amounts of NAIP data.
• Refer to FY09 report: Quantifying the Distribution of NAIP Imagery to End Users
Recommended