# 2004 Kluwer Academic Publishers. Printed in the Netherlands.
Distribution and conservation significance ofendemic species of flowering plants in Peru
HENK VAN DER WERFF* and TRISHA CONSIGLIOCenter for Conservation and Sustainable Development, Missouri Botanical Garden, P.O. Box 299, St.
Louis, MO 63166, USA; *Author for correspondence (e-mail: [email protected])
Received 2 December 2002; accepted in revised form 17 June 2003
Key words: Elevational zones, Endemics, Flowering plants, Life forms, Peru
Abstract. Using the data published in the Catalogue of the Flowering Plants and Gymnosperms of Peru,
we analyzed the elevational distributions of 5323 species reported as endemics from that country as a
whole, for 10 families with the highest number of endemic taxa in Peru, and the distribution patterns of
these species according to life form. We calculated the density of endemism (number of endemic species
divided by area � 1000) and absolute number of endemic species among life forms and families, along
an elevational gradient. Overall densities of endemics were 10–15 times higher at mid-elevation (2000–
3500 m) than in the Amazonian lowlands (0–500 m). Absolute numbers of endemics peaked at 1500–
3000 m for herbs, shrubs, and epiphytes, while trees, vines, and lianas showed maxima in the lowlands
(0–500 m); yet densities of endemics for all life forms peaked at 1500–3000 m. Among the 10 families
with the highest number of endemics, densities of endemics peaked at mid- to high elevation (1500–
4500 m), but showed much disparity in the elevational distribution of absolute numbers of endemic
species. Finally, the percentage of endemic species to total species is highest for herbs, shrubs, and
epiphytes. Given that less than 10% of the land area for each of the montane zones (2000–4500 m) is
protected compared to 13.5–29.9% in the lower elevations (0–1000 m), we recommend that priority be
given to increasing the size of protected areas at mid- to high altitude in the Andean slopes to grant
further protection in zones with the highest density of endemics. We also recommend that more emphasis
be given to collecting and studying non-trees, since most endemic species belong to that class.
Introduction
The elevational patterns of endemism in the tropics generally show increasing
endemism with elevation, peaking at mid- to high elevations and declining above
the timberline (Gentry 1986; Balslev 1988; Major 1988; Ibisch et al. 1996; Sklenar
and Jørgensen 1999; Kessler 2000, 2001a, b, 2002a, b; Kessler et al. 2001).
However, much is still unknown about the elevational gradient of endemism among
different biogeographic regions, and about varying degrees of endemism within and
between taxonomic plant families in the same biogeographic zone. Factors thought
to influence endemism include fragmented habitats and variation in climatic and
edaphic conditions within short distances in montane areas, leading to isolation of
small species populations subject to differentiation (Kruckeberg and Rabinowitz
1985; Gentry 1986; Major 1988). Few generalizations can be made about en-
demism, and recent studies have highlighted the role of life form, pollination mode,
and ecophysiological type influencing endemism at the community and species
level (Kessler 2000, 2002b; Knapp 2002; Luteyn 2002). The degree of endemism
Biodiversity and Conservation 1699–1713, 2004.13:
for an area is often cited as a measure of the uniqueness of the flora and conse-
quently is important for prioritizing sites for conservation (Myers et al. 2000;
Brooks et al. 2002; Knapp 2002; Young et al. 2002). The Andes Mountains, in
particular, are known to harbor high levels of endemism and are experiencing rapid
habitat loss (Gentry 1986, 1995; Mittermeier et al. 1998), resulting in their con-
servation ‘hotspot’ status (Myers et al. 2000). We assign great importance to areas
of high endemism for conservation strategies; however, it has also been suggested
that human curiosity for rare objects may contribute to our preoccupation with
endemic organisms (Kruckeberg and Rabinowitz 1985), and endemic plants may
actually be competitively inferior to other more widespread taxa (Kessler 2001b).
Nonetheless, understanding the evolutionary processes contributing to endemism
will be critical in deciding how to direct our conservation energies (Young et al.
2002). Only by conserving areas of high endemism will we be able to further study
the ecological, life history, and physiological factors influencing endemics while
simultaneously protecting areas of variable habitat.
In this paper we used the Catalogue of the Flowering Plants and Gymnosperms
of Peru (Brako and Zarucchi 1993) to analyze the elevational distributions of 5323
species reported as endemics from Peru as a whole, for 10 families with the highest
number of endemic taxa in Peru, and the distribution patterns of these endemics
according to life form. Including analyses for selected plant families and different
life forms is essential for assessing the effect of elevational gradients on endemism
for plant taxa within the same biogeographic region and among different life forms.
Only one study to date has analyzed the elevational patterns of endemism for an
entire flora at both the country and family level (Kessler 2002b), suggesting a need
for more research into the role of topography for patterns of endemism for plant
taxa within biogeographical regions and for comparative studies of the same plant
families in different biogeographical areas. Especially unique to our study are the
analyses of the elevational distributions of endemic species across life forms for an
entire flora.
The Catalogue of the Flowering Plants and Gymnosperms of Peru (Brako and
Zarucchi 1993) listed 17 143 taxa from Peru with their geographical and elevational
distribution; of those, 5354 were endemic. The current study is based on the 5323
endemic species (intraspecific taxa excluded) that are included in the table made
during the writing of the Catalogue that lists all species. The Catalogue presented a
wealth of information, but has not been used much other than by taxonomists.
Ibisch et al. (1996) used data from the Catalogue in their analysis of the Peruvian
epiphytes, but this study is an exception. The amount of information in the Cata-
logue is so great that extracting a subset (for instance, all species reported from a
particular Department, all tree species, or all species occurring above 3000 m al-
titude) is a daunting job. However, such subsets can provide insight into the role of
elevational gradients and life form for endemics by addressing questions such as:
Are endemic species concentrated in particular elevational zones? Which major life
form (herbs, shrubs, trees, epiphytes, vines, lianas) includes the largest number of
endemics? Are elevational distributions of endemic species similar among different
life forms? Finally, are elevational distributions of endemic species similar within
1700
selected plant families? In this paper we attempt to answer these questions and
explore the consequences that our findings will have for conservation issues and
future research.
Materials and methods
The data from the Catalogue were imported into database spreadsheets and ana-
lyzed using the Excel and ArcView programs. Elevational zones for Peru were
derived from the GTOPO 30 Digital Elevation Model (U.S. Geological Survey
1996) using ArcView Spatial Analyst. The elevation grid was clipped for Peru and
reclassified into 10 zones of 500 m increments and one zone for all elevations
>5000 m. The Peru Catalogue lists endemics occurring up to 5000 m; the total area
above this elevation accounts for only 0.06% of the total area of Peru. The area in
square kilometers was then calculated for each elevational zone (Zhou 2001). A
Department data layer was added (ESRI 1999) and area was calculated in square
kilometers for each Department. Area data were used throughout the study to
analyze the density of endemics along elevational zones and between life forms.
Area calculations for protected areas were based on the Mapa de Areas Naturales
Protegidas Del Peru, which can be seen on the INRENA web site (http://www.
inrena.gob.pe/dganp.html). Using ArcView Spatial Analyst, we digitized the map
onto our DEM layer of Peru and calculated the area of each elevational zone within
the parks, as well as the total area for all parks; our figure (17,178,174 ha) differed
by only 0.6% from the total for the protected areas given by INRENA
(17,360,009 ha less 64,115 ha for the Cordillera de Colan, which is not on the map).
We thus accepted that our calculations were largely correct. Table 5 presents the
elevational distribution of the protected areas.
The data used in this contribution are taken from the Catalogue (Brako and
Zarucchi 1993); by implication, new species and new records for the flora of Peru
during the last 10 years are not included in our numbers. Despite these and other
limitations described below, we believe that the data are sufficient for the kind of
analysis presented in this paper. Data from the Catalogue of the Vascular Plants of
Ecuador (Jørgensen and Leon-Yanez 1999) provide a useful perspective on the
most species-rich families and the completeness of the data in the Peru Catalogue.
Although smaller than Peru, Ecuador is comparable to Peru in the variety of its
habitats, which range from semi-deserts, rainforest, and montane forest to paramo,
and it is reasonable to expect that the floras of the two countries are similar. In
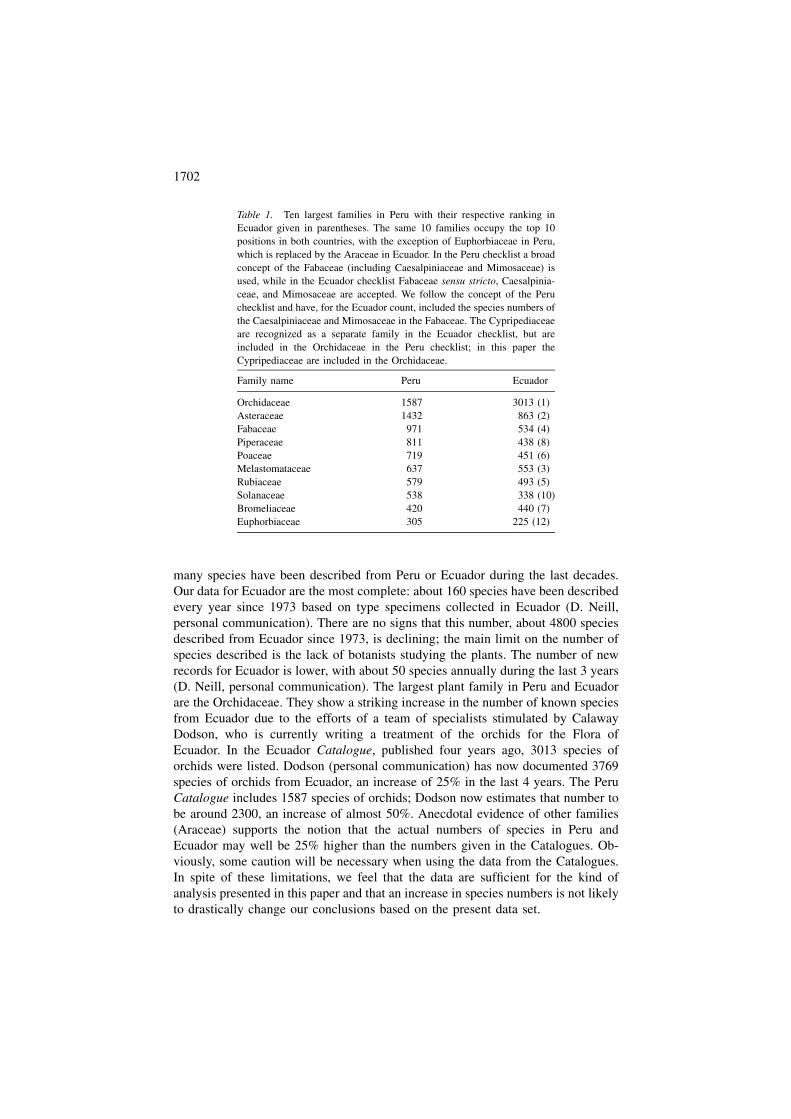
Table 1 we list the 10 families in Peru with the largest numbers of species in
descending order, their species numbers, and the corresponding species numbers
from the Catalogue of Ecuador. A quick glance shows that essentially the same 10
families occupy the top 10 positions in both countries, with some changes in the
rankings. The two largest families are the same in both countries.
It is difficult to answer the question of how complete the species numbers in-
cluded in the Catalogues of Peru and Ecuador really are. We cannot state how many
species in Peru and Ecuador remain undescribed. We can, however, determine how
1701
many species have been described from Peru or Ecuador during the last decades.
Our data for Ecuador are the most complete: about 160 species have been described
every year since 1973 based on type specimens collected in Ecuador (D. Neill,
personal communication). There are no signs that this number, about 4800 species
described from Ecuador since 1973, is declining; the main limit on the number of
species described is the lack of botanists studying the plants. The number of new
records for Ecuador is lower, with about 50 species annually during the last 3 years
(D. Neill, personal communication). The largest plant family in Peru and Ecuador
are the Orchidaceae. They show a striking increase in the number of known species
from Ecuador due to the efforts of a team of specialists stimulated by Calaway
Dodson, who is currently writing a treatment of the orchids for the Flora of
Ecuador. In the Ecuador Catalogue, published four years ago, 3013 species of
orchids were listed. Dodson (personal communication) has now documented 3769
species of orchids from Ecuador, an increase of 25% in the last 4 years. The Peru
Catalogue includes 1587 species of orchids; Dodson now estimates that number to
be around 2300, an increase of almost 50%. Anecdotal evidence of other families
(Araceae) supports the notion that the actual numbers of species in Peru and
Ecuador may well be 25% higher than the numbers given in the Catalogues. Ob-
viously, some caution will be necessary when using the data from the Catalogues.
In spite of these limitations, we feel that the data are sufficient for the kind of
analysis presented in this paper and that an increase in species numbers is not likely
to drastically change our conclusions based on the present data set.
Table 1. Ten largest families in Peru with their respective ranking in
Ecuador given in parentheses. The same 10 families occupy the top 10
positions in both countries, with the exception of Euphorbiaceae in Peru,
which is replaced by the Araceae in Ecuador. In the Peru checklist a broad
concept of the Fabaceae (including Caesalpiniaceae and Mimosaceae) is
used, while in the Ecuador checklist Fabaceae sensu stricto, Caesalpinia-
ceae, and Mimosaceae are accepted. We follow the concept of the Peru
checklist and have, for the Ecuador count, included the species numbers of
the Caesalpiniaceae and Mimosaceae in the Fabaceae. The Cypripediaceae
are recognized as a separate family in the Ecuador checklist, but are
included in the Orchidaceae in the Peru checklist; in this paper the
Cypripediaceae are included in the Orchidaceae.
Family name Peru Ecuador
Orchidaceae 1587 3013 (1)
Asteraceae 1432 863 (2)
Fabaceae 971 534 (4)
Piperaceae 811 438 (8)
Poaceae 719 451 (6)
Melastomataceae 637 553 (3)
Rubiaceae 579 493 (5)
Solanaceae 538 338 (10)
Bromeliaceae 420 440 (7)
Euphorbiaceae 305 225 (12)
1702
Results
For conservation strategies, species with a limited distribution are of greater im-
portance than species with a wide distribution. We have in this study focused on
endemic species and consider them representative for species with a limited dis-
tribution. Of course, some of the endemic species may have a relatively wide
distribution in Peru, but a sizeable number (3411 out of 5323) are known from only
one Department. The number of endemic species varies greatly among Depart-
ments (from 0 in Callao to 1011 in Huanuco), as does the area of Departments
(from 178 km2 in Callao to 374 429 km2 in Loreto), yet correlation of area to
number of endemics by Department was not significant (R¼ 0.31). We exclude
Callao, the smallest Department, which consists largely of the harbor of Callao, and
which has no reported endemics, from further consideration (Table 2). Our data
show that the density of endemism (number of endemic species per 1000 km2) is
10–15 times higher in the Andean Departments of Amazonas, Cajamarca, Hua-
nuco, and Junin than in the lowland, Amazonian Departments of Loreto, Madre de
Table 2. Number of endemic species in each Department, the area of each
Department, and the density of endemism (number of endemic species in a
Department divided by area� 1000).
Department name No. endemics Area (km2) Endemics/1000 km2
Huanuco 1011 36 559 27.7
Cajamarca 743 34 257 21.7
Junin 888 44 279 20.1
Amazonas 690 40 816 16.9
La Libertad 379 24 748 15.3
Lima 450 35 409 12.7
Pasco 304 23 943 12.7
Ancash 424 36 201 11.7
San Martin 553 52 912 10.5
Cusco 767 74 528 10.3
Huancavelica 202 22 208 9.1
Apurimac 166 20 888 7.9
Lambayeque 89 13 703 6.5
Ayacucho 284 44 333 6.4
Tumbes 26 4595 5.7
Piura 185 36 782 5.0
Moquegua 57 15 221 3.7
Arequipa 232 63 149 3.7
Puno 265 72 487 3.7
Tacna 52 16 108 3.2
Loreto 713 374 429 1.9
Ica 39 21 090 1.8
Madre de Dios 112 83 707 1.3
Ucayali 77 104 383 0.7
Callao 0 178 0.0
All of Peru 5323 1 296 912 4.1
1703
Dios, and Ucayali. Ucayali has a very low rate of endemism; but this Department
was created recently (in the 1980s), and endemics reported before that date from
the area are included in numbers for Loreto. A low density of endemism of tree
species in the Amazonian lowlands was earlier reported by Pitman et al. (1999), a
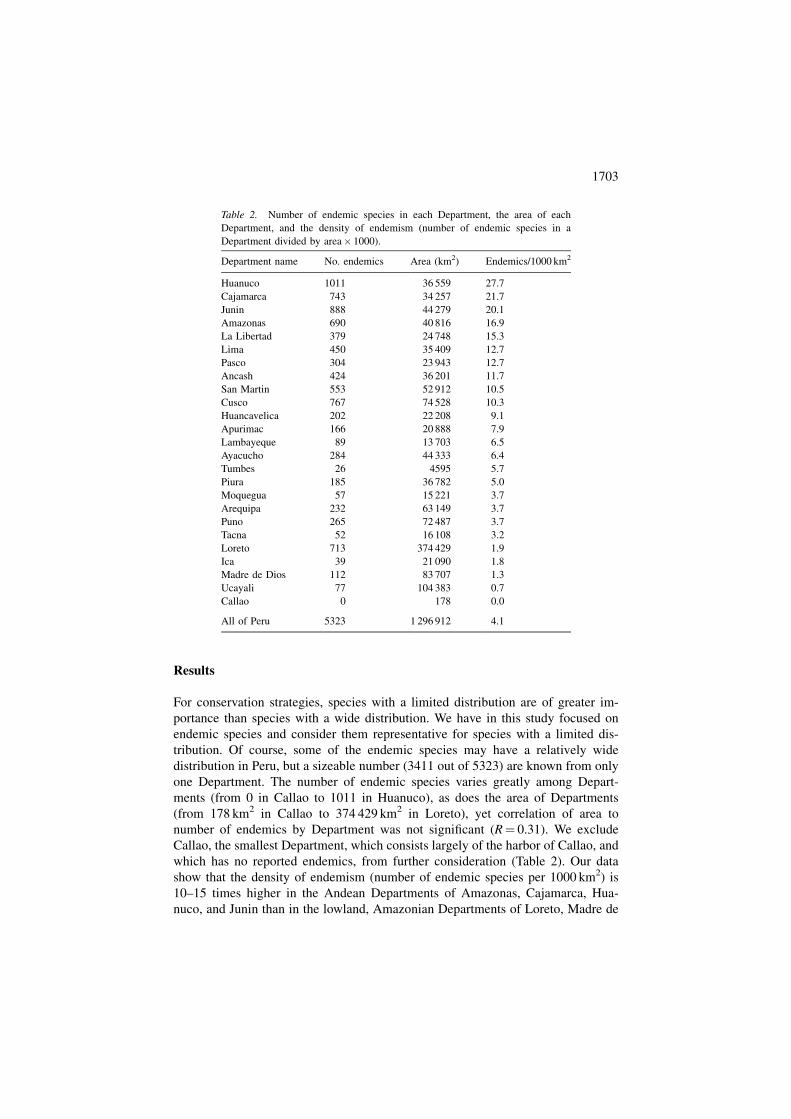
Figure 1. Elevational distribution of endemic species in Peru expressed as (A) absolute numbers of
endemic species in each elevational zone (500 m increments), and (B) density of endemics (number of
species per 1000 km2 land area for each elevational zone).
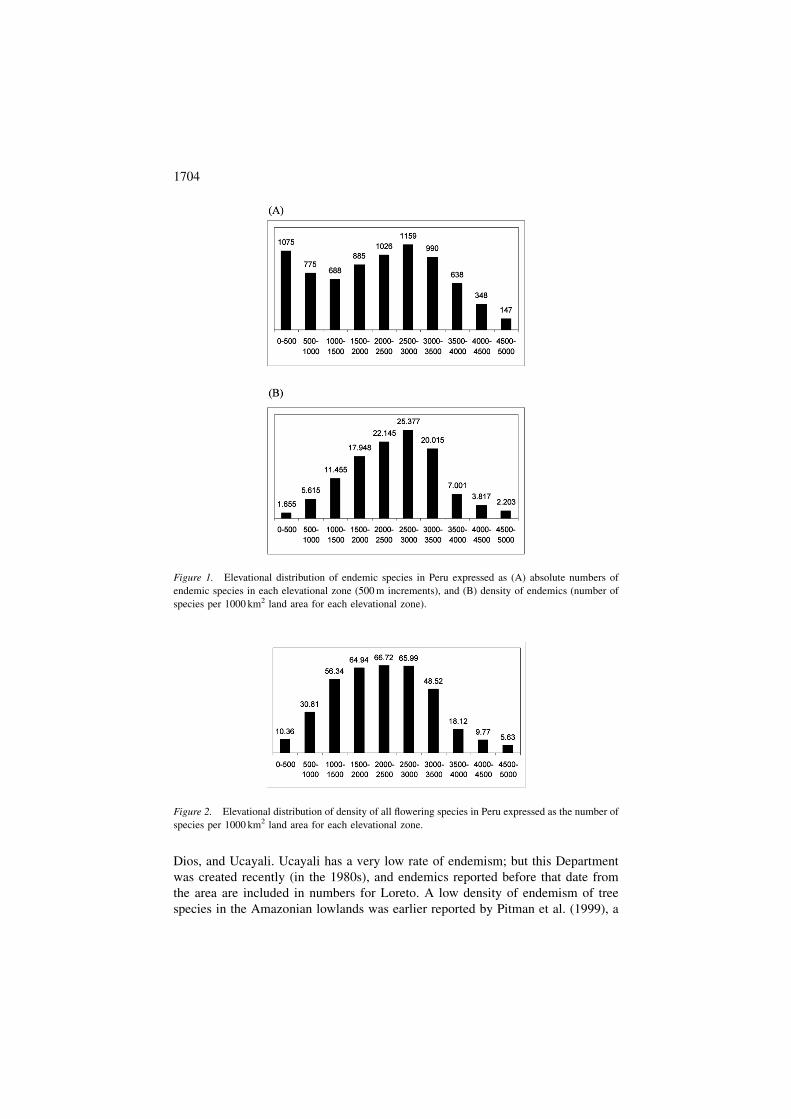
Figure 2. Elevational distribution of density of all flowering species in Peru expressed as the number of
species per 1000 km2 land area for each elevational zone.
1704
conclusion supported by our data on all species. Similarly, analyses of the endemics
from Ecuador showed high levels of endemism clearly associated with either the
Andes or the Galapagos, but much lower levels of endemism associated with the
lowlands of the Coastal and Amazonian regions (Jørgensen and Leon-Yanez 1999;
Valencia et al. 2000). Also included in Table 2 are data for the whole country of
Peru. Although the number of endemics in the country is much higher than that in
any of the Departments, the density of endemism for the country is relatively low at
4.1; for example, the density of endemics in Huanuco is almost seven times higher
than that in the country as a whole. The density of endemics in the Amazonian
Departments of Loreto, Madre de Dios, and Ucayali is clearly lower than the
national density (4.1 versus 1.9, 1.3, or 0.7).
Especially unique to our study are the analyses of the elevational distribution of
endemic species across life forms for Peru. This distribution of endemic species,
using absolute numbers, showed two peaks, one at 0–500 m and another at 2500–
3000 m (Figure 1). However, density of endemics (number of endemic species per
1000 km2 land area) increased with elevation, peaked at 2500–3000 m, and abruptly
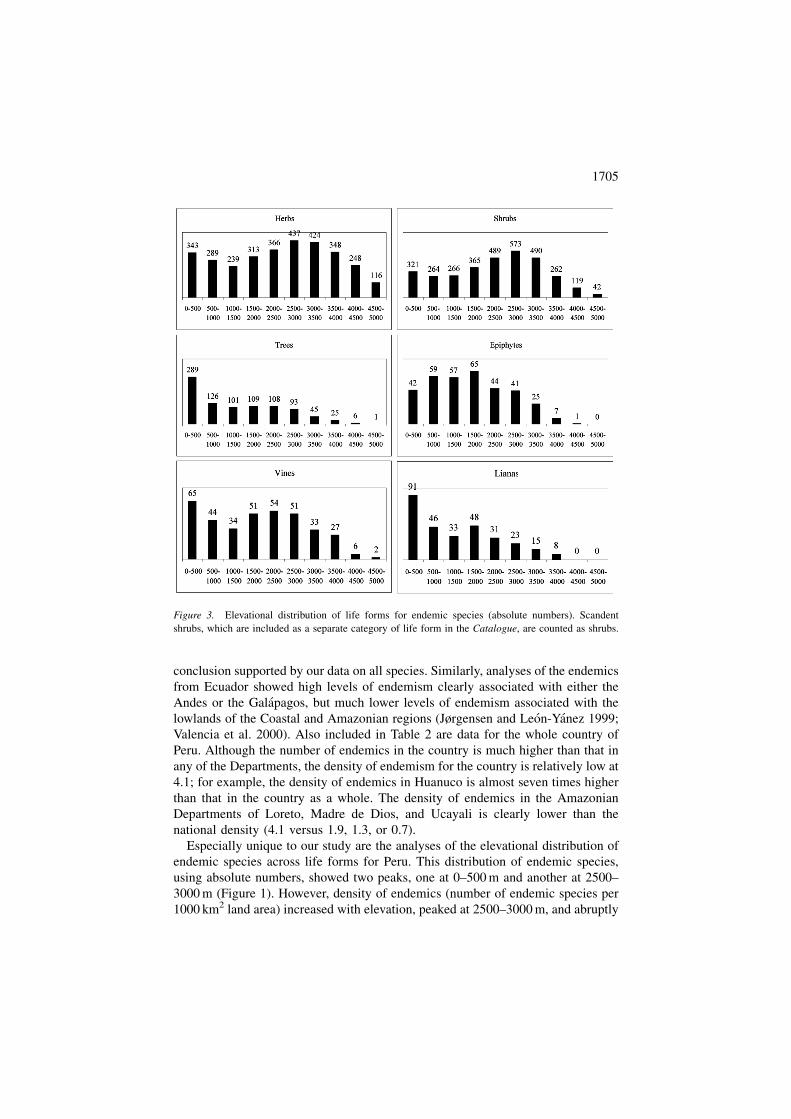
Figure 3. Elevational distribution of life forms for endemic species (absolute numbers). Scandent
shrubs, which are included as a separate category of life form in the Catalogue, are counted as shrubs.
1705
fell off at elevations over 3500 m (Figure 1). Density patterns of endemism with
elevation were highly correlated (R¼ 0.92) to the density pattern for all species,
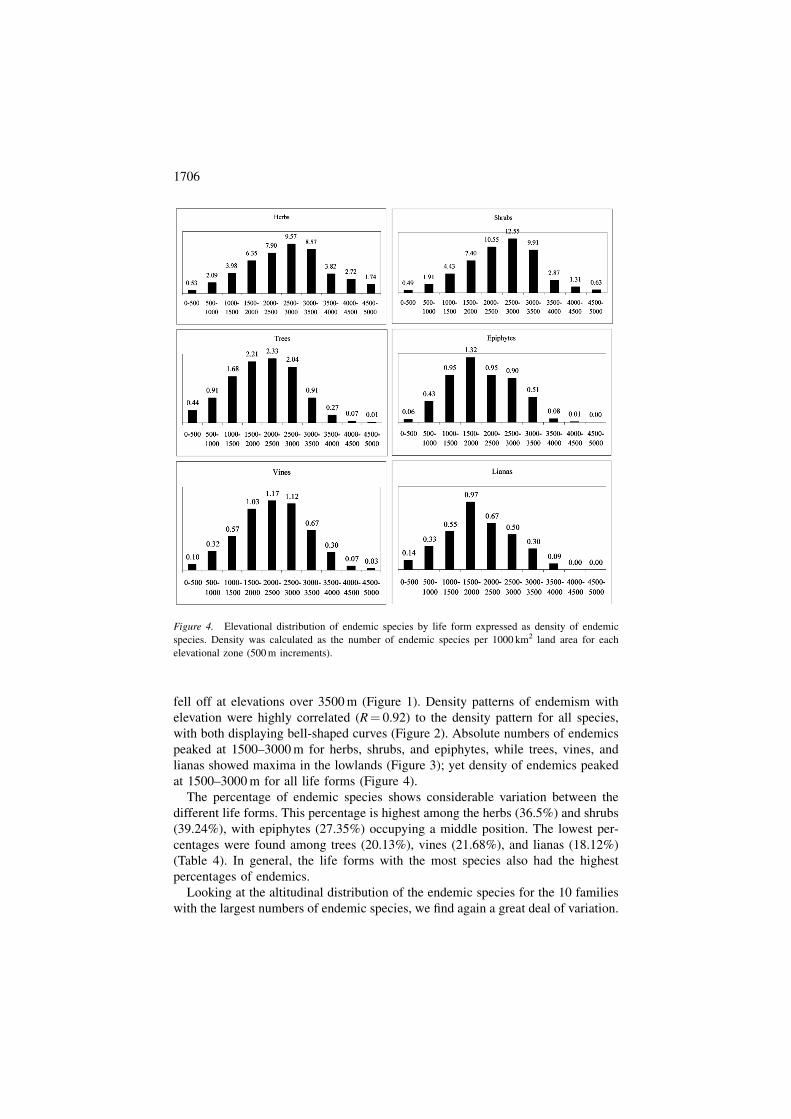
with both displaying bell-shaped curves (Figure 2). Absolute numbers of endemics
peaked at 1500–3000 m for herbs, shrubs, and epiphytes, while trees, vines, and
lianas showed maxima in the lowlands (Figure 3); yet density of endemics peaked
at 1500–3000 m for all life forms (Figure 4).
The percentage of endemic species shows considerable variation between the
different life forms. This percentage is highest among the herbs (36.5%) and shrubs
(39.24%), with epiphytes (27.35%) occupying a middle position. The lowest per-
centages were found among trees (20.13%), vines (21.68%), and lianas (18.12%)
(Table 4). In general, the life forms with the most species also had the highest
percentages of endemics.
Looking at the altitudinal distribution of the endemic species for the 10 families
with the largest numbers of endemic species, we find again a great deal of variation.
Figure 4. Elevational distribution of endemic species by life form expressed as density of endemic
species. Density was calculated as the number of endemic species per 1000 km2 land area for each
elevational zone (500 m increments).
1706
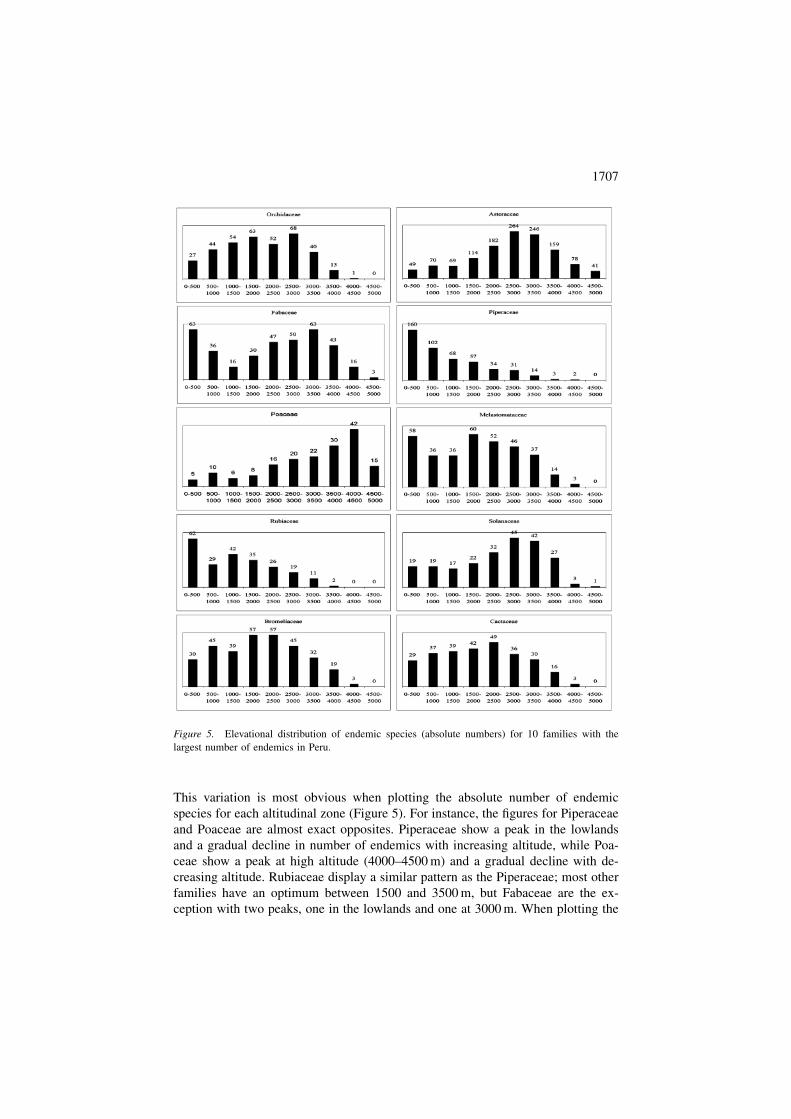
This variation is most obvious when plotting the absolute number of endemic
species for each altitudinal zone (Figure 5). For instance, the figures for Piperaceae
and Poaceae are almost exact opposites. Piperaceae show a peak in the lowlands
and a gradual decline in number of endemics with increasing altitude, while Poa-
ceae show a peak at high altitude (4000–4500 m) and a gradual decline with de-
creasing altitude. Rubiaceae display a similar pattern as the Piperaceae; most other
families have an optimum between 1500 and 3500 m, but Fabaceae are the ex-
ception with two peaks, one in the lowlands and one at 3000 m. When plotting the
Figure 5. Elevational distribution of endemic species (absolute numbers) for 10 families with the
largest number of endemics in Peru.
1707
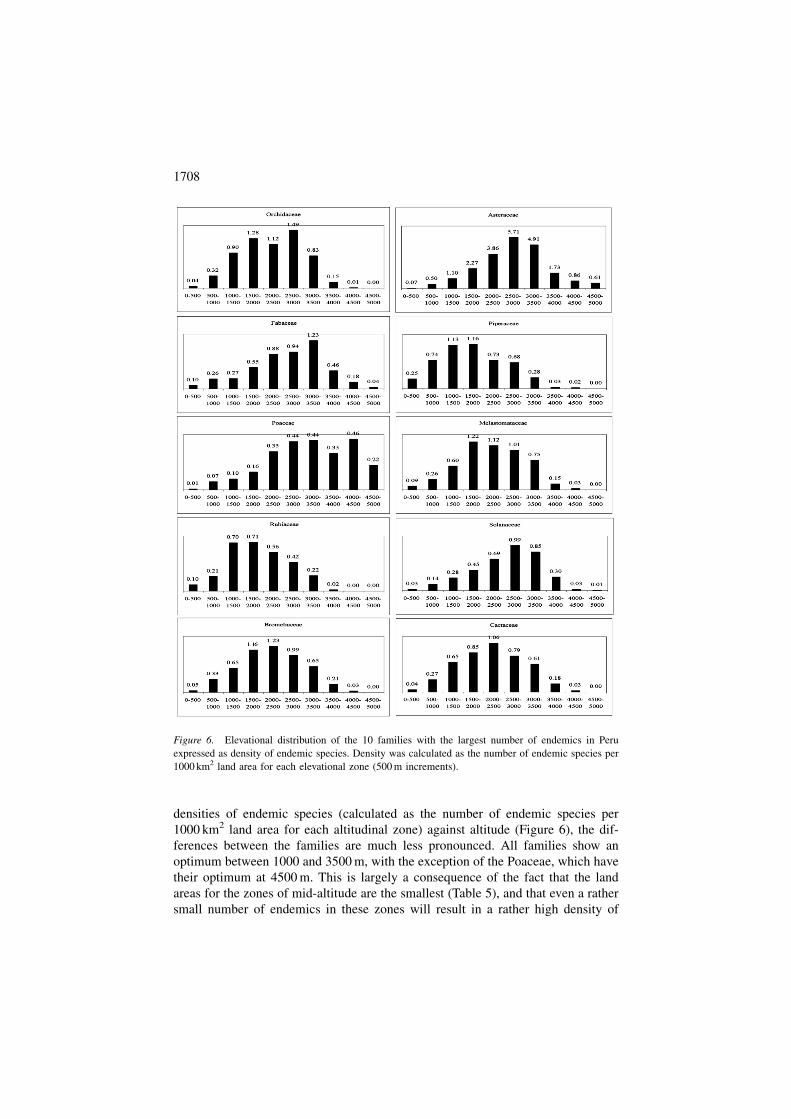
densities of endemic species (calculated as the number of endemic species per
1000 km2 land area for each altitudinal zone) against altitude (Figure 6), the dif-
ferences between the families are much less pronounced. All families show an
optimum between 1000 and 3500 m, with the exception of the Poaceae, which have
their optimum at 4500 m. This is largely a consequence of the fact that the land
areas for the zones of mid-altitude are the smallest (Table 5), and that even a rather
small number of endemics in these zones will result in a rather high density of
Figure 6. Elevational distribution of the 10 families with the largest number of endemics in Peru
expressed as density of endemic species. Density was calculated as the number of endemic species per
1000 km2 land area for each elevational zone (500 m increments).
1708
endemics. The altitudinal distribution of endemic species of the entire flora (Figure
1A) differs markedly from the altitudinal distribution of endemics of individual
families (Figure 5); only Fabaceae and Melastomataceae approach the pattern of
the entire flora reasonably close. The differences between the patterns of density of
endemics of individual families (Figure 6) and of the total flora (Figure 1B) are less
striking; with the exception of the Poaceae all have their greatest density of en-
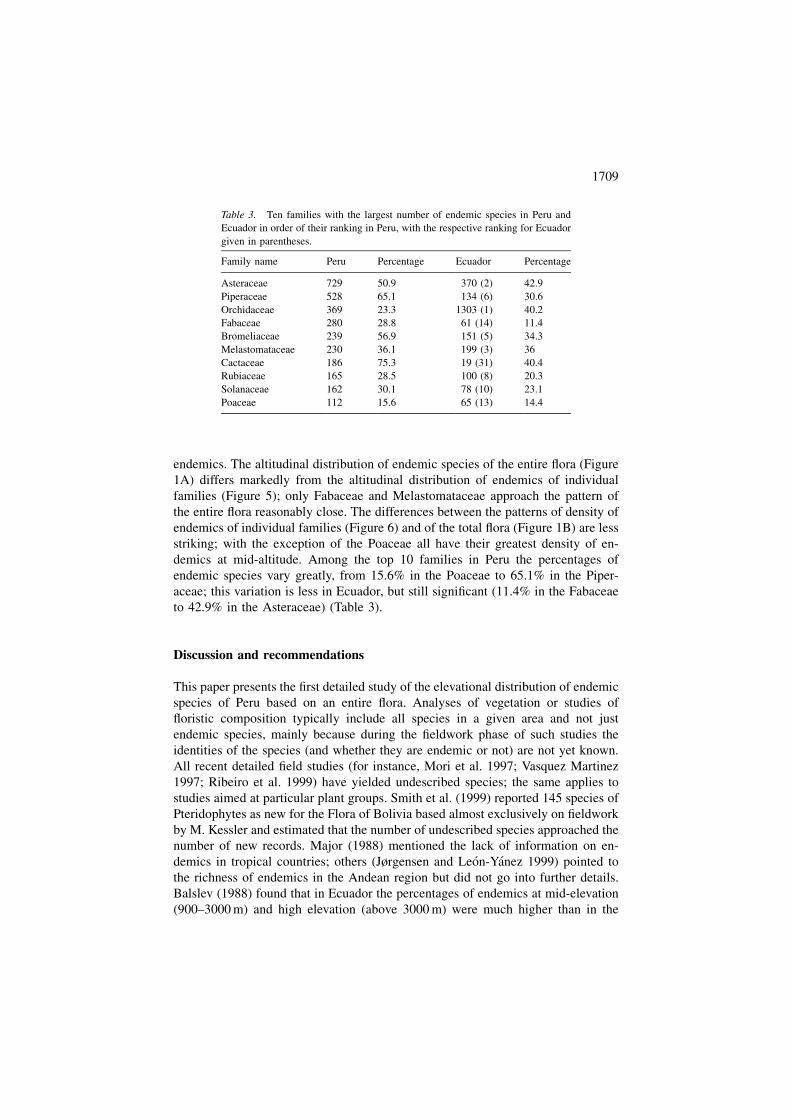
demics at mid-altitude. Among the top 10 families in Peru the percentages of
endemic species vary greatly, from 15.6% in the Poaceae to 65.1% in the Piper-
aceae; this variation is less in Ecuador, but still significant (11.4% in the Fabaceae
to 42.9% in the Asteraceae) (Table 3).
Discussion and recommendations
This paper presents the first detailed study of the elevational distribution of endemic
species of Peru based on an entire flora. Analyses of vegetation or studies of
floristic composition typically include all species in a given area and not just
endemic species, mainly because during the fieldwork phase of such studies the
identities of the species (and whether they are endemic or not) are not yet known.
All recent detailed field studies (for instance, Mori et al. 1997; Vasquez Martinez
1997; Ribeiro et al. 1999) have yielded undescribed species; the same applies to
studies aimed at particular plant groups. Smith et al. (1999) reported 145 species of
Pteridophytes as new for the Flora of Bolivia based almost exclusively on fieldwork
by M. Kessler and estimated that the number of undescribed species approached the
number of new records. Major (1988) mentioned the lack of information on en-
demics in tropical countries; others (Jørgensen and Leon-Yanez 1999) pointed to
the richness of endemics in the Andean region but did not go into further details.
Balslev (1988) found that in Ecuador the percentages of endemics at mid-elevation
(900–3000 m) and high elevation (above 3000 m) were much higher than in the
Table 3. Ten families with the largest number of endemic species in Peru and
Ecuador in order of their ranking in Peru, with the respective ranking for Ecuador
given in parentheses.
Family name Peru Percentage Ecuador Percentage
Asteraceae 729 50.9 370 (2) 42.9
Piperaceae 528 65.1 134 (6) 30.6
Orchidaceae 369 23.3 1303 (1) 40.2
Fabaceae 280 28.8 61 (14) 11.4
Bromeliaceae 239 56.9 151 (5) 34.3
Melastomataceae 230 36.1 199 (3) 36
Cactaceae 186 75.3 19 (31) 40.4
Rubiaceae 165 28.5 100 (8) 20.3
Solanaceae 162 30.1 78 (10) 23.1
Poaceae 112 15.6 65 (13) 14.4
1709
lowlands (below 900 m). However, his sample was small, 536 species of which 160
species were endemic, and was taken from revisions available to him. His findings
are difficult to compare with ours, partly because his elevational zones are so
different from the ones we use in our study. Also, the number of endemic species
included in his study was much smaller than the number of endemics in the present
study (160 versus 5323 species). Only one other study to date has analyzed the
elevational patterns of endemism for an entire flora at both the country and family
level (Kessler 2002b). However, because Kessler expressed endemism as the per-
centage of endemic species among a particular family or genus with the highest
value rescaled at 100%, and we look at the absolute number of endemic species in a
group, our conclusions are difficult to compare with Kessler’s. We did not use the
rescaling as accepted by Kessler because it gives no information about the numbers
of endemic species and suggests maxima in endemism at altitudes where very few
endemic species occur.
Our study shows that endemic species are not evenly distributed over Peru, and
that the greatest density and highest absolute number of endemic species are found
along the Andean slopes between 2500 and 3000 m (Figure 1). Looking at the
elevational distribution for the density of endemics grouped by life form, we
conclude that while peaks vary, all life forms show increasing density of endemism
with elevation, dropping off above the timberline (Figure 4). Even when analyzed
for absolute number of endemics, herbs, shrubs, and epiphytes still show maxima in
the numbers of endemic species between 1500–3000 m (Figure 3). For the six life
forms in this study the highest percentage of endemism occurs in herbs, shrubs, and
epiphytes (Table 4). Among the 10 families with the highest number of endemics,
density of endemics peaks at mid- to high elevations (1500–4500 m), yet there is
much disparity between families in their altitudinal distribution of endemism
(calculated with both absolute numbers and density) (Figures 5 and 6).
Much of the research on plant communities, species richness, and species con-
servation is based on studies that measure woody plants �2.5 cm diameter at breast
height (Pitman et al. 1999; Phillips and Miller 2002). Obviously, such research is
very useful, but the fact that most species of vascular plants are not included places
a limit on the conclusions one can draw from it. When we look only at endemic
trees, we may conclude that the highest number of endemics is found in the low-
lands, but when we consider all endemic species, we find that this conclusion is not
supported. Adding herbs, shrubs, and epiphytes to forest inventories, plot studies,
and such will require a great deal more effort in collecting and especially in
identification; but because most species in tropical forests are herbs, shrubs, and
epiphytes, the exclusion of these life forms from vegetation studies seems hardly
justified. Only one study dealing with species numbers of shrubs, herbs, epiphytes,
and lianas (non-trees) has been published (Gentry and Dodson 1987), and we
strongly support Gentry and Dodson’s recommendation to include non-trees in
inventory studies. Our results indicate that herbs, shrubs, and epiphytes not only
contain a higher percentage of endemics (number of endemic species to total
species within life form) than do trees, but also have their peaks of endemism (both
absolute number and density) in the mid-elevation (2000–3500 m) range of the
1710
Andes. These findings should be taken into consideration when planning reserves
aimed at the conservation and protection of plant species.
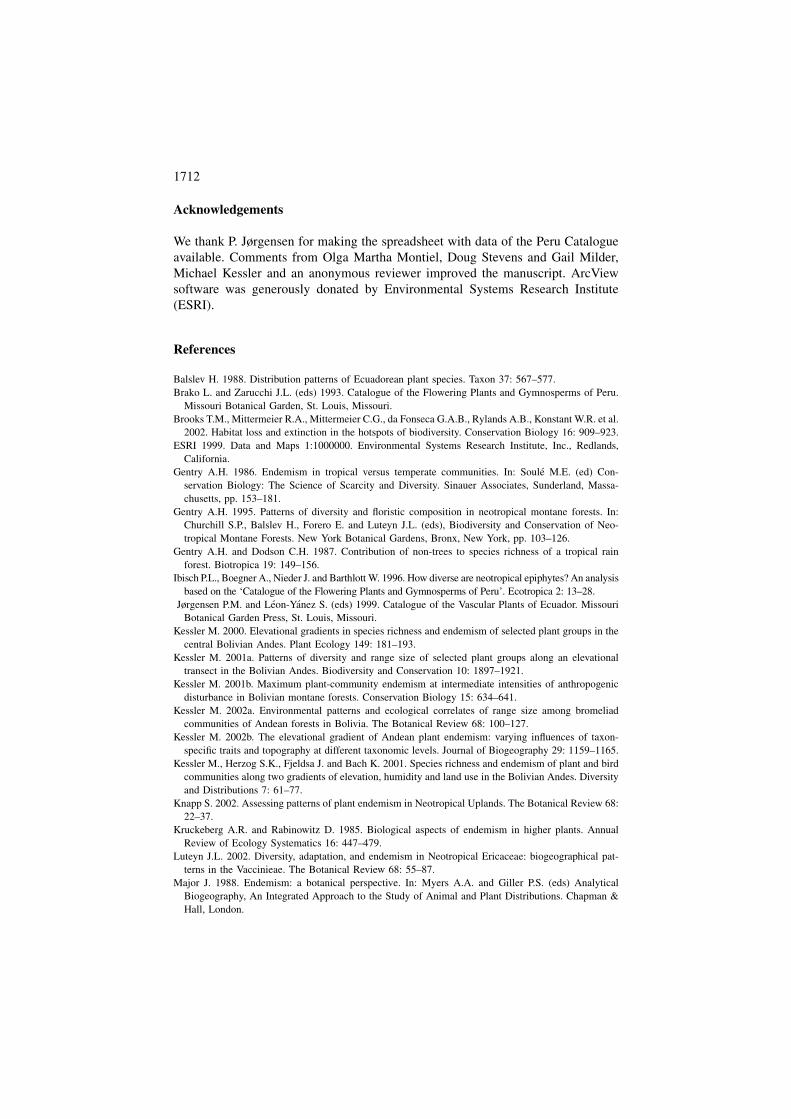
Less than 10% of the land area for each of the montane zones (2000–4500 m)
where the highest density of endemics occurs is protected, compared to 13.5–29.9%
in the lower elevations (0–1000 m) (Table 5; Figure 1). Clearly, the zones with the
highest density of endemic species are greatly underrepresented in the protected
areas. When considering the conservation of endemic plant species, decision ma-
kers should place a greater emphasis on establishing protected areas along the
Andean slopes than on enlarging protected areas in the Amazon lowlands. It is not
likely that large protected areas can be established on the Andean slopes, because
this region is relatively densely populated and because much of the primary ve-
getation has been destroyed. Still, we believe that a series of smaller protected areas
will offer protection for a large proportion of the endemic plant species of the
region. We also recommend that protection efforts be aimed at the conservation of
areas with undisturbed vegetation and not at the protection of individual species;
the large number of endemic species and our poor knowledge of the distribution of
plants in Peru makes this last approach not feasible. Finally, we recommend that a
greater effort be made towards fieldwork and collecting on the Andean slopes as
well as a greater effort to study collections from this area.
Table 5. Elevational distribution of protected areas within Peru. The percent of
protected areas within each altitudinal zone was calculated based on protected
areas data obtained from INRENA.
Elevation (m) Protected (km2) Area (km2) % Protected
0–500 87614 649 720 13.5
500–1000 41268 138 027 29.9
1000–1500 11034 60 059 18.4
1500–2000 4998 49 308 10.1
2000–2500 3806 46 331 8.2
2500–3000 2797 45 672 6.1
3000–3500 2451 49 463 5.0
3500–4000 4675 91 131 5.1
4000–4500 6424 91 163 7.0
4500–5000 4530 66 740 6.8
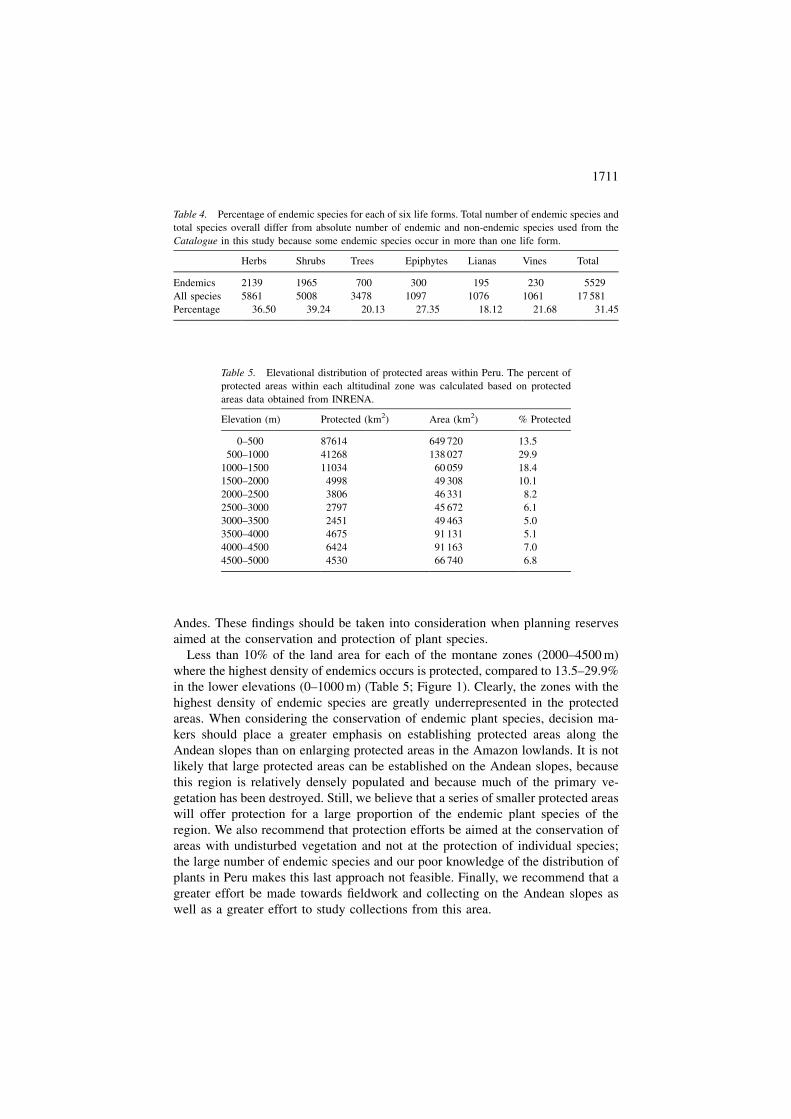
Table 4. Percentage of endemic species for each of six life forms. Total number of endemic species and
total species overall differ from absolute number of endemic and non-endemic species used from the
Catalogue in this study because some endemic species occur in more than one life form.
Herbs Shrubs Trees Epiphytes Lianas Vines Total
Endemics 2139 1965 700 300 195 230 5529
All species 5861 5008 3478 1097 1076 1061 17 581
Percentage 36.50 39.24 20.13 27.35 18.12 21.68 31.45
1711
Acknowledgements
We thank P. Jørgensen for making the spreadsheet with data of the Peru Catalogue
available. Comments from Olga Martha Montiel, Doug Stevens and Gail Milder,
Michael Kessler and an anonymous reviewer improved the manuscript. ArcView
software was generously donated by Environmental Systems Research Institute
(ESRI).
References
Balslev H. 1988. Distribution patterns of Ecuadorean plant species. Taxon 37: 567–577.
Brako L. and Zarucchi J.L. (eds) 1993. Catalogue of the Flowering Plants and Gymnosperms of Peru.
Missouri Botanical Garden, St. Louis, Missouri.
Brooks T.M., Mittermeier R.A., Mittermeier C.G., da Fonseca G.A.B., Rylands A.B., Konstant W.R. et al.
2002. Habitat loss and extinction in the hotspots of biodiversity. Conservation Biology 16: 909–923.
ESRI 1999. Data and Maps 1:1000000. Environmental Systems Research Institute, Inc., Redlands,
California.
Gentry A.H. 1986. Endemism in tropical versus temperate communities. In: Soule M.E. (ed) Con-
servation Biology: The Science of Scarcity and Diversity. Sinauer Associates, Sunderland, Massa-
chusetts, pp. 153–181.
Gentry A.H. 1995. Patterns of diversity and floristic composition in neotropical montane forests. In:
Churchill S.P., Balslev H., Forero E. and Luteyn J.L. (eds), Biodiversity and Conservation of Neo-
tropical Montane Forests. New York Botanical Gardens, Bronx, New York, pp. 103–126.
Gentry A.H. and Dodson C.H. 1987. Contribution of non-trees to species richness of a tropical rain
forest. Biotropica 19: 149–156.
Ibisch P.L., Boegner A., Nieder J. and Barthlott W. 1996. How diverse are neotropical epiphytes? An analysis
based on the ‘Catalogue of the Flowering Plants and Gymnosperms of Peru’. Ecotropica 2: 13–28.
Jørgensen P.M. and Leon-Yanez S. (eds) 1999. Catalogue of the Vascular Plants of Ecuador. Missouri
Botanical Garden Press, St. Louis, Missouri.
Kessler M. 2000. Elevational gradients in species richness and endemism of selected plant groups in the
central Bolivian Andes. Plant Ecology 149: 181–193.
Kessler M. 2001a. Patterns of diversity and range size of selected plant groups along an elevational
transect in the Bolivian Andes. Biodiversity and Conservation 10: 1897–1921.
Kessler M. 2001b. Maximum plant-community endemism at intermediate intensities of anthropogenic
disturbance in Bolivian montane forests. Conservation Biology 15: 634–641.
Kessler M. 2002a. Environmental patterns and ecological correlates of range size among bromeliad
communities of Andean forests in Bolivia. The Botanical Review 68: 100–127.
Kessler M. 2002b. The elevational gradient of Andean plant endemism: varying influences of taxon-
specific traits and topography at different taxonomic levels. Journal of Biogeography 29: 1159–1165.
Kessler M., Herzog S.K., Fjeldsa J. and Bach K. 2001. Species richness and endemism of plant and bird
communities along two gradients of elevation, humidity and land use in the Bolivian Andes. Diversity
and Distributions 7: 61–77.
Knapp S. 2002. Assessing patterns of plant endemism in Neotropical Uplands. The Botanical Review 68:
22–37.
Kruckeberg A.R. and Rabinowitz D. 1985. Biological aspects of endemism in higher plants. Annual
Review of Ecology Systematics 16: 447–479.
Luteyn J.L. 2002. Diversity, adaptation, and endemism in Neotropical Ericaceae: biogeographical pat-
terns in the Vaccinieae. The Botanical Review 68: 55–87.
Major J. 1988. Endemism: a botanical perspective. In: Myers A.A. and Giller P.S. (eds) Analytical
Biogeography, An Integrated Approach to the Study of Animal and Plant Distributions. Chapman &
Hall, London.
1712
Myers N., Mittermeier R.A., Mittermeier C.G., de Fonseca G.A.B. and Kent J. 2000. Biodiversity and
hotspots for conservation priorities. Nature 403: 853–858.
Mittermeier R.A., Myers N., Thomsen J.B., da Fonseca G.A.B. and Olivieri S. 1998. Biodiversity
hotspots and major tropical wilderness areas: approaches to setting conservation priorities. Con-
servation Biology 12: 516–520.
Mori S., Cremers G., Gracie C., de Granville J. and Mitchell J.D. 1997. Guide to the Vascular Plants of
Central French Guiana. Memoirs of the New York Botanical Gardens 76.
Phillips O. and Miller J.S. 2002. Global Patterns of Plant Diversity: Alwyn H. Gentry’s Forest Transect
Data Set. Missouri Botanical Garden Press, St. Louis, Missouri.
Pitman N.C., Terborgh J., Silman M.R. and P. Nunez V. 1999. Tree species distributions in an upper
Amazonian forest. Ecology 80: 2651–2661.
Ribeiro J.E., Hopkins M.J.G., Vicentini A., Sothers C.A., Costa M.A., Brito J.M. et al. 1999. Flora da
Reserva Ducke. INPA-DFID, Manaus, Brazil.
Sklenar P. and Jørgensen P.M. 1999. Distribution patterns of paramo plants in Ecuador. Journal of
Biogeography 26: 681–691.
Smith A.R., Kessler M. and Gonzales J. 1999. New records of Pteridophytes from Bolivia. American
Fern Journal 89: 244–266.
Valencia R., Pitman N., Leon-Yanez S. and Jørgensen P.M. 2000. Libro rojo de las plantas endemicas del
Ecuador. Herbario QCA, Pontificia Universidad Catolica del Ecuador, Quito, Ecuador.
Vasquez Martinez R. 1997. Florula de las Reservas Biologicas de Iquitos, Peru. Monographs in Sys-
tematic Botany Missouri Botanical Gardens 63.
U.S. Geological Survey 1996. Global 30-Arc-Second Elevation Data Set. U.S. Geological Survey, Sioux
Falls, South Dakota.
Young K.R., Ulloa Ulloa C., Luteyn J.L. and Knapp S. 2002. Plant evolution and endemism in Andean
South America: an introduction. The Botanical Review 68: 4–27.
Zhou G. 2001. Area Calculation for Polygons. http://gis.esri.com/arcscripts/scripts.cfm.
1713
Recommended