Dispatch from SwedenWinter 2011
Skeppsholmen, Stockholm

2
Dear Friends,
In Stockholm, the days are getting shorter, and that means it’s the season for the julbord, the Christmas table where Swedes celebrate the season with schnapps and pickled herring. As the holidays approach, the Swedish business community feels confident about the strength of the Swedish economy, and is proud that, in contrast to much of Europe, their nation is running a budget surplus.
I recently spent time visiting healthcare companies and private equity funds in Stockholm with my colleagues at Experia Corporate Finance Advisors.
The Swedish market has historically been a hotbed of innovation in healthcare. With a small domestic market, and a very open economy, there is a clear understanding that companies must compete in international markets in order to grow to any significant scale. Building a presence in the other Nordic markets is typically an important early step, but it is critical to note that market dynamics and the healthcare regulatory frameworks are often quite different from those in Sweden.
The provision of health care in Sweden is decentralized to the county councils, and to a certain extent to municipalities. In Sweden, county councils must provide their residents with health and medical care, and dental care for residents up to the age of 20. Municipalities are responsible for care of the elderly, either at home or in special housing. They also have responsibility for residents with physical disabilities or psychological disorders. Healthcare costs in Sweden represent 9% of GDP, which is about half that of the U.S., as a percentage of GDP.
-20%
-10%
0%
10%
20%
30%
40%
50%
60%
Dec-15-2009
Jan-20-2010
Feb-18
-2010
Mar-19-2010
Apr-21-2
010
May-21-2010
Jun-21-2010
Jul-21-2
010
Aug-19-2010
Sep-17-2010
Oct-18-2010
Nov-16-2010
Dec-15-2010
Jan-18-2011
Feb-16
-2011
Mar-17-2
011
Apr-15-2011
May-18-2011
Jun-20-2011
Jul-20-2011
Aug-18-2011
Sep-16-2011
Oct-17-2
011
Nov-15-2011
Dec-14-2011
Swedish Healthcare Market vs. Broader Index
OMX Stockholm 30 Index Swedish Healthcare Index*
3
The private delivery of healthcare services is a growing trend in Sweden and the share of private providers has been growing rapidly. Two years ago the pharmacy market was liberalized with the privatization of Apoteket AB, the government monopoly. This has led to a large investment of private equity in the pharmacy market.
Through our long affiliation with Experia, an independent, Stockholm-based investment bank founded in 2003 and focused on the mid-market sector in the Nordic markets, Brocair has deep expertise and transaction capabilities in Sweden and the other main Nordic countries (Denmark, Norway and Finland).
Collectively, the Nordic region represents the world’s eleventh largest healthcare market, and Nordic companies are present across a wide range of sub-sectors. We would love to discuss with you how we can help you with opportunities in the region.
Below are some metrics on the Swedish healthcare market, and recent transactions in the industry. If there is anything we at Brocair can do to assist you with your mergers and acquisitions efforts in Sweden or the other Nordics, please do not hesitate to call us.
Managing PartnerBrocair Partners, LLC212-500-5020
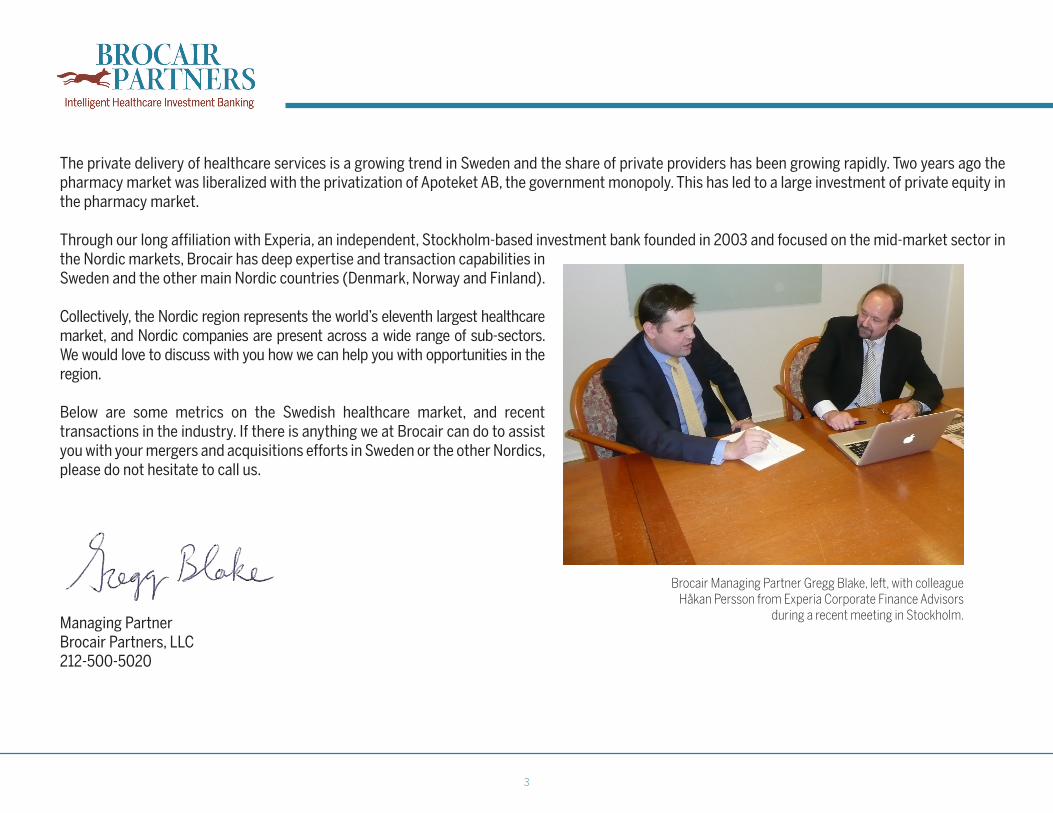
Brocair Managing Partner Gregg Blake, left, with colleague Håkan Persson from Experia Corporate Finance Advisors
during a recent meeting in Stockholm.

4
Active Biotech AB OM:ACTI Lund SEK 21.3 SEK 175.0 SEK 13.8 $ 180.0 $ (42.9) $ 223.0 NM NM 5.3x N/A N/A N/A 31-Dec
BioInvent International AB OM:BINV Lund SEK 15.7 SEK 32.0 SEK 13.7 $ 116.8 $ (31.7) $ 148.5 16.1x 20.2x 6.2x N/A N/A N/A 31-Dec
Eurocine Vaccines AB OM:EUCI Stockholm SEK 23.3 SEK 49.8 SEK 14.2 $ 31.5 $ (2.8) $ 34.3 NM NM NM N/A N/A N/A 30-Jun
Karo Bio AB OM:KARO Huddinge SEK 1.0 SEK 2.5 SEK 0.8 $ 27.8 $ (29.0) $ 56.8 NM N/A N/A N/A N/A N/A 31-Dec
Meda AB OM:MEDA A Solna SEK 65.8 SEK 79.8 SEK 48.0 $ 5,255.0 $ 2,416.2 $ 2,838.8 2.5x 2.2x 2.9x 7.5x 6.7x 9.3x 31-Dec
Medivir AB OM:MVIR B Huddinge SEK 62.5 SEK 151.5 SEK 57.8 $ 189.2 $ (80.3) $ 269.5 N/A N/A 2.3x N/A N/A 9.5x 31-Dec
Moberg Derma AB OM:MOB Solna SEK 23.1 SEK 31.0 SEK 15.0 $ 23.1 $ (8.4) $ 31.4 N/A N/A 3.9x N/A N/A N/A 31-Dec
NeuroVive Pharmaceutical AB OM:NVP Lund SEK 12.9 SEK 44.8 SEK 12.1 $ 24.3 $ (2.3) $ 26.6 32.9x NM 28.1x N/A N/A N/A 31-Dec
Oasmia Pharmaceutical AB OM:OASM Uppsala SEK 9.1 SEK 18.0 SEK 8.3 $ 65.8 $ (6.4) $ 72.2 8.4x 9.0x 5.2x N/A N/A N/A 30-Apr
Orexo AB OM:ORX Uppsala SEK 25.2 SEK 51.0 SEK 24.0 $ 82.8 $ (25.7) $ 108.5 3.2x 4.2x 2.2x N/A N/A N/A 31-Dec
Swedish Orphan Biovitrum AB OM:SOBI Solna SEK 13.6 SEK 43.2 SEK 11.4 $ 607.6 $ 91.7 $ 516.0 1.1x 5.2x 2.1x 9.2x 35.5x 22.0x 31-Dec
Company Ticker City Price High Low EV* Net Debt Market Cap FY2009 FY2010 LTM FY2009 FY2010 LTM FYE
Company Ticker City Price High Low EV* Net Debt Market Cap FY2009 FY2010 LTM FY2009 FY2010 LTM FYE
52-Week
52-Week
EV/Sales
EV/Sales
EV/EBITDA
EV/EBITDA
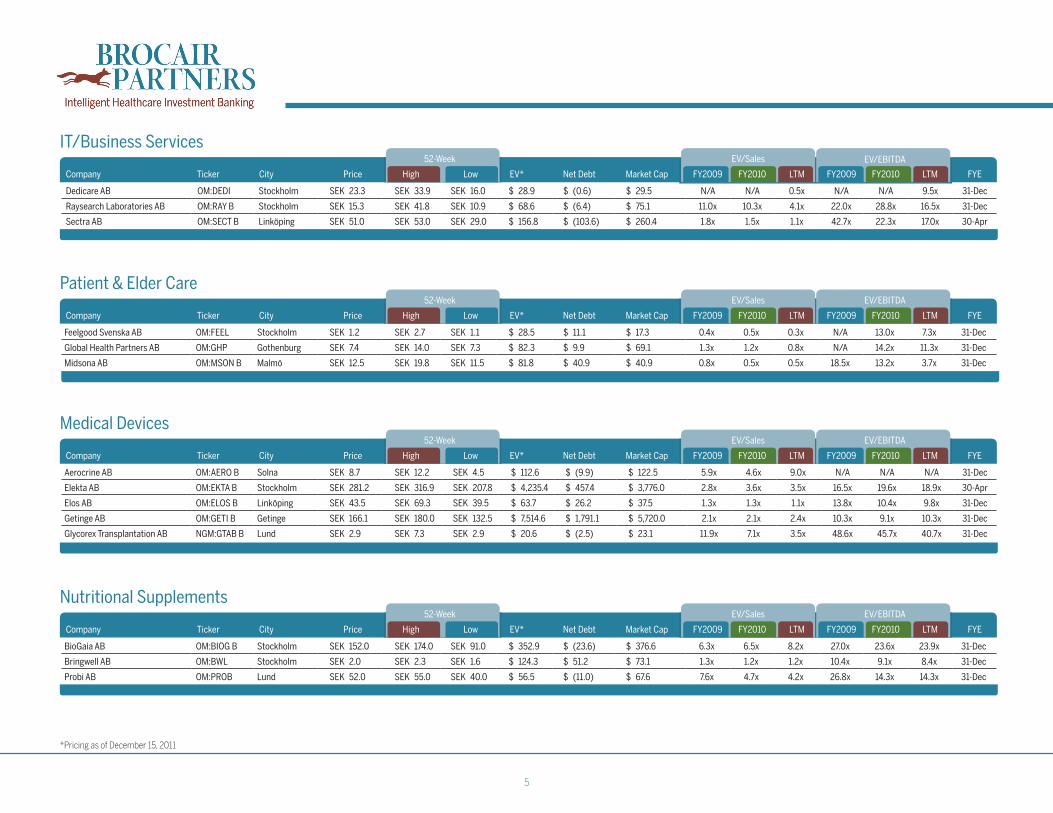
Publically Traded Swedish Healthcare Companies>$20M Enterprise Value
Pharmaceuticals
Diagnostics & Laboratory Tools
Biotage AB OM:BIOT Uppsala SEK 5.1 SEK 7.3 SEK 4.4 $ 27.7 $ (26.6) $ 54.2 0.7x 0.8x 0.4x 13.9x 8.3x 4.5x 31-Dec
CellaVision AB OM:CEVI Lund SEK 12.6 SEK 14.4 SEK 9.0 $ 38.9 $ (4.4) $ 43.3 2.2x 1.8x 1.8x 15.4x 15.9x 12.9x 31-Dec
Vitrolife OM:VITR Gothenburg SEK 42.8 SEK 52.0 SEK 32.7 $ 128.3 $ 8.3 $ 119.9 2.5x 2.5x 2.6x 15.2x 15.3x 14.7x 31-Dec
*Pricing as of December 15, 2011
5
Feelgood Svenska AB OM:FEEL Stockholm SEK 1.2 SEK 2.7 SEK 1.1 $ 28.5 $ 11.1 $ 17.3 0.4x 0.5x 0.3x N/A 13.0x 7.3x 31-Dec
Global Health Partners AB OM:GHP Gothenburg SEK 7.4 SEK 14.0 SEK 7.3 $ 82.3 $ 9.9 $ 69.1 1.3x 1.2x 0.8x N/A 14.2x 11.3x 31-Dec
Midsona AB OM:MSON B Malmö SEK 12.5 SEK 19.8 SEK 11.5 $ 81.8 $ 40.9 $ 40.9 0.8x 0.5x 0.5x 18.5x 13.2x 3.7x 31-Dec
Company Ticker City Price High Low EV* Net Debt Market Cap FY2009 FY2010 LTM FY2009 FY2010 LTM FYE
52-Week EV/Sales EV/EBITDA
Patient & Elder Care
Aerocrine AB OM:AERO B Solna SEK 8.7 SEK 12.2 SEK 4.5 $ 112.6 $ (9.9) $ 122.5 5.9x 4.6x 9.0x N/A N/A N/A 31-Dec
Elekta AB OM:EKTA B Stockholm SEK 281.2 SEK 316.9 SEK 207.8 $ 4,235.4 $ 457.4 $ 3,776.0 2.8x 3.6x 3.5x 16.5x 19.6x 18.9x 30-Apr
Elos AB OM:ELOS B Linköping SEK 43.5 SEK 69.3 SEK 39.5 $ 63.7 $ 26.2 $ 37.5 1.3x 1.3x 1.1x 13.8x 10.4x 9.8x 31-Dec
Getinge AB OM:GETI B Getinge SEK 166.1 SEK 180.0 SEK 132.5 $ 7,514.6 $ 1,791.1 $ 5,720.0 2.1x 2.1x 2.4x 10.3x 9.1x 10.3x 31-Dec
Glycorex Transplantation AB NGM:GTAB B Lund SEK 2.9 SEK 7.3 SEK 2.9 $ 20.6 $ (2.5) $ 23.1 11.9x 7.1x 3.5x 48.6x 45.7x 40.7x 31-Dec
Company Ticker City Price High Low EV* Net Debt Market Cap FY2009 FY2010 LTM FY2009 FY2010 LTM FYE
52-Week EV/Sales EV/EBITDA
Medical Devices
Dedicare AB OM:DEDI Stockholm SEK 23.3 SEK 33.9 SEK 16.0 $ 28.9 $ (0.6) $ 29.5 N/A N/A 0.5x N/A N/A 9.5x 31-Dec
Raysearch Laboratories AB OM:RAY B Stockholm SEK 15.3 SEK 41.8 SEK 10.9 $ 68.6 $ (6.4) $ 75.1 11.0x 10.3x 4.1x 22.0x 28.8x 16.5x 31-Dec
Sectra AB OM:SECT B Linköping SEK 51.0 SEK 53.0 SEK 29.0 $ 156.8 $ (103.6) $ 260.4 1.8x 1.5x 1.1x 42.7x 22.3x 17.0x 30-Apr
Company Ticker City Price High Low EV* Net Debt Market Cap FY2009 FY2010 LTM FY2009 FY2010 LTM FYE
52-Week EV/Sales EV/EBITDA
IT/Business Services
*Pricing as of December 15, 2011
BioGaia AB OM:BIOG B Stockholm SEK 152.0 SEK 174.0 SEK 91.0 $ 352.9 $ (23.6) $ 376.6 6.3x 6.5x 8.2x 27.0x 23.6x 23.9x 31-Dec
Bringwell AB OM:BWL Stockholm SEK 2.0 SEK 2.3 SEK 1.6 $ 124.3 $ 51.2 $ 73.1 1.3x 1.2x 1.2x 10.4x 9.1x 8.4x 31-Dec
Probi AB OM:PROB Lund SEK 52.0 SEK 55.0 SEK 40.0 $ 56.5 $ (11.0) $ 67.6 7.6x 4.7x 4.2x 26.8x 14.3x 14.3x 31-Dec
Company Ticker City Price High Low EV* Net Debt Market Cap FY2009 FY2010 LTM FY2009 FY2010 LTM FYE
52-Week EV/Sales EV/EBITDA
Nutritional Supplements

6
C-Rad AB OM:CRAD B Uppsala SEK 11.5 SEK 42.0 SEK 8.7 $ 26.0 $ 0.9 $ 25.0 14.7x 10.7x 7.9x N/A N/A N/A 31-Dec
Dignitana AB OM:DIGN Lund SEK 22.5 SEK 31.9 SEK 15.2 $ 25.0 $ (0.3) $ 25.3 16.3x 30.7x 10.1x N/A N/A N/A 31-Dec
Company Ticker City Price High Low EV* Net Debt Market Cap FY2009 FY2010 LTM FY2009 FY2010 LTM FYE
52-Week EV/Sales EV/EBITDA
Other
Mean 6.3x 5.7x 4.3x 19.1x 17.8x 14.0x
Median 2.5x 3.9x 2.9x 15.3x 14.8x 12.1x
Max 32.9x 30.7x 28.1x 48.6x 45.7x 40.7x
Min 0.4x 0.5x 0.3x 7.5x 6.7x 3.7x
EV/Sales EV/EBITDA
FY2010 FY2011 LTM FY2010 FY2011 LTM
*Pricing as of December 15, 2011
7
11/15/2011 DuoCort Pharma AB ViroPharma, Inc. $ 164.6 164.6 N/A N/A N/A N/A
11/4/2011 Cellartis AB Cellectis $ 37.8 37.8 4.1 N/A 9.2x N/A
9/30/2011 Elekta AB, Anatomic Pathology Information System Sunquest Information Systems, Inc. $ 32.9 32.9 11.7 N/A 2.8x N/A
9/15/2011 Nucletron B.V. Elekta AB $ 525.1 525.1 184.1 37.4 2.9x 14.0x
8/31/2011 Sectra Mamea AB Koninklijke Philips Electronics NV $ 99.9 99.9 20.1 N/A 5.0x N/A
8/31/2011 Astra Tech AB DENTSPLY International, Inc. $ 1,785.0 1,785.0 535.0 105.0 3.3x 17.0x
8/25/2011 BMM Pharma AB Bluefish Pharmaceuticals AB $ 4.1 4.1 N/A N/A N/A N/A
8/23/2011 Phadia AB Thermo Fisher Scientific, Inc. $ 3,512.8 3,512.8 523.4 212.5 6.7x 16.5x
7/14/2011 Wagner Analysen Technik GmbH Kibion AB $ 2.0 2.0 N/A N/A N/A N/A
6/21/2011 Proxima Intressenter AB Aleris AB $ 177.7 177.7 N/A N/A N/A N/A
6/16/2011 Biophausia AB Medivir AB $ 209.0 206.8 89.1 11.0 2.3x 18.7x
5/19/2011 Contur Software AB Accelrys Software, Inc. $ 13.7 13.1 N/A N/A N/A N/A
5/11/2011 Clean Chemical Sweden AB Segulah Advisor AB $ 35.9 35.9 N/A N/A N/A N/A
4/27/2011 Antula Holdings AB Ipex Medical AB $ 280.4 280.4 N/A N/A N/A N/A
3/11/2011 Q-Med AB Galderma Pharma S.A. $ 1,184.9 1,039.7 224.9 57.2 4.6x 18.2x
2/25/2011 Jolife AB Medtronic Emergency Response Systems, Inc. $ 53.0 53.0 N/A N/A N/A N/A
2/24/2011 Biolin Scientific AB Ratos AB $ 49.4 46.6 21.4 3.1 2.2x 15.2x
2/11/2011 Oy Bio-Vita AB Midsona AB $ 5.4 5.4 8.7 N/A 0.6x N/A
1/31/2011 Techtum Lab AB AlphaHelix Molecular Diagnostics AB $ 1.6 1.6 N/A N/A N/A N/A
10/4/2010 Alaven Pharmaceutical, LLC Meda AB $ 350.0 350.0 111.3 N/A 3.1x N/A
8/31/2010 Inmedic AB Hammarplast Medical AB $ 3.0 3.0 5.0 N/A 0.6x N/A
5/31/2010 Resonant Medical, Inc. Elekta AB $ 28.6 28.6 0.0 N/A N/A N/A
5/31/2010 Immuno Diagnostic Oy Addtech Life Science $ 6.5 6.5 5.4 N/A 1.2x N/A
4/30/2010 MIP Technologies AB Biotage AB $ 2.2 2.2 1.8 N/A 1.2x N/A
3/24/2010 Farfield Group Ltd. Biolin Scientific AB $ 3.5 3.5 2.4 0.3 1.5x 11.7x
1/31/2010 Wasserburger Arzneimittelwerk Gmbh Recip AB $ 69.3 69.3 34.4 N/A 2.0x N/A
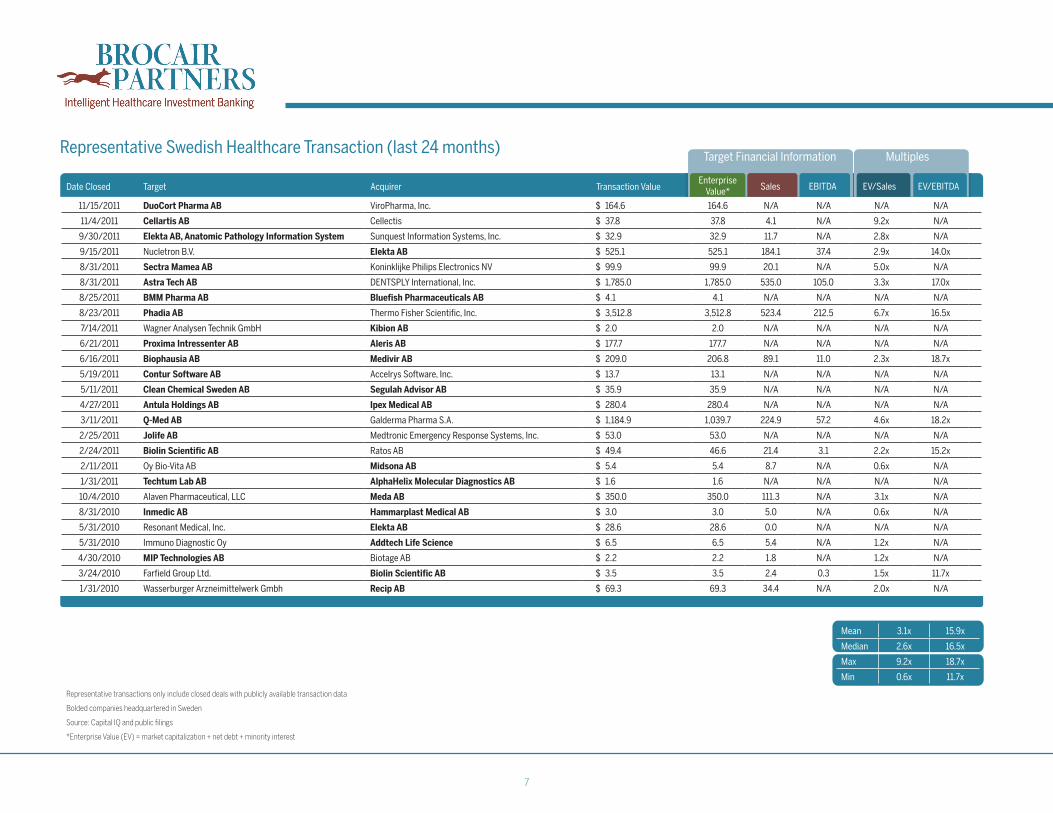
Representative Swedish Healthcare Transaction (last 24 months)Target Financial Information Multiples
Date Closed Target Acquirer Transaction ValueEnterprise
Value* Sales EBITDA EV/Sales EV/EBITDA
Representative transactions only include closed deals with publicly available transaction data
Bolded companies headquartered in Sweden
Source: Capital IQ and public filings
*Enterprise Value (EV) = market capitalization + net debt + minority interest
Mean 3.1x 15.9x
Median 2.6x 16.5x
Max 9.2x 18.7x
Min 0.6x 11.7x
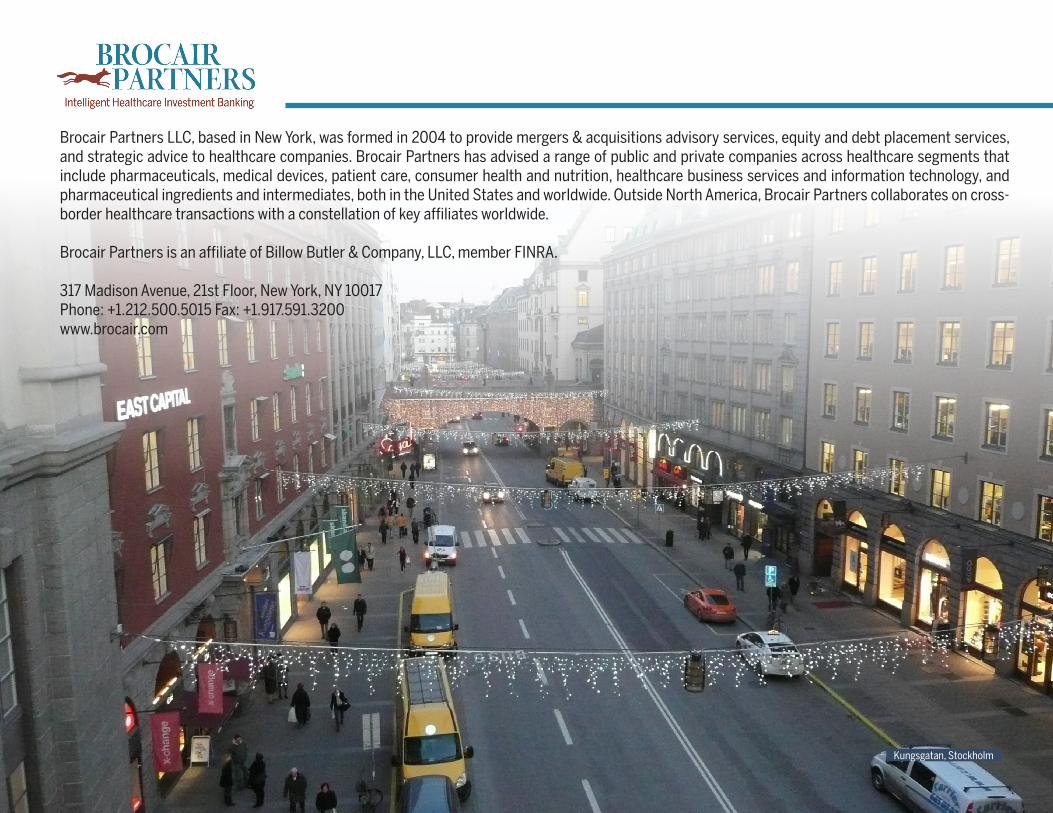
Brocair Partners LLC, based in New York, was formed in 2004 to provide mergers & acquisitions advisory services, equity and debt placement services, and strategic advice to healthcare companies. Brocair Partners has advised a range of public and private companies across healthcare segments that include pharmaceuticals, medical devices, patient care, consumer health and nutrition, healthcare business services and information technology, and pharmaceutical ingredients and intermediates, both in the United States and worldwide. Outside North America, Brocair Partners collaborates on cross-border healthcare transactions with a constellation of key affiliates worldwide.
Brocair Partners is an affiliate of Billow Butler & Company, LLC, member FINRA.
317 Madison Avenue, 21st Floor, New York, NY 10017Phone: +1.212.500.5015 Fax: +1.917.591.3200www.brocair.com
Kungsgatan, Stockholm
Recommended