2014 EUV symposium
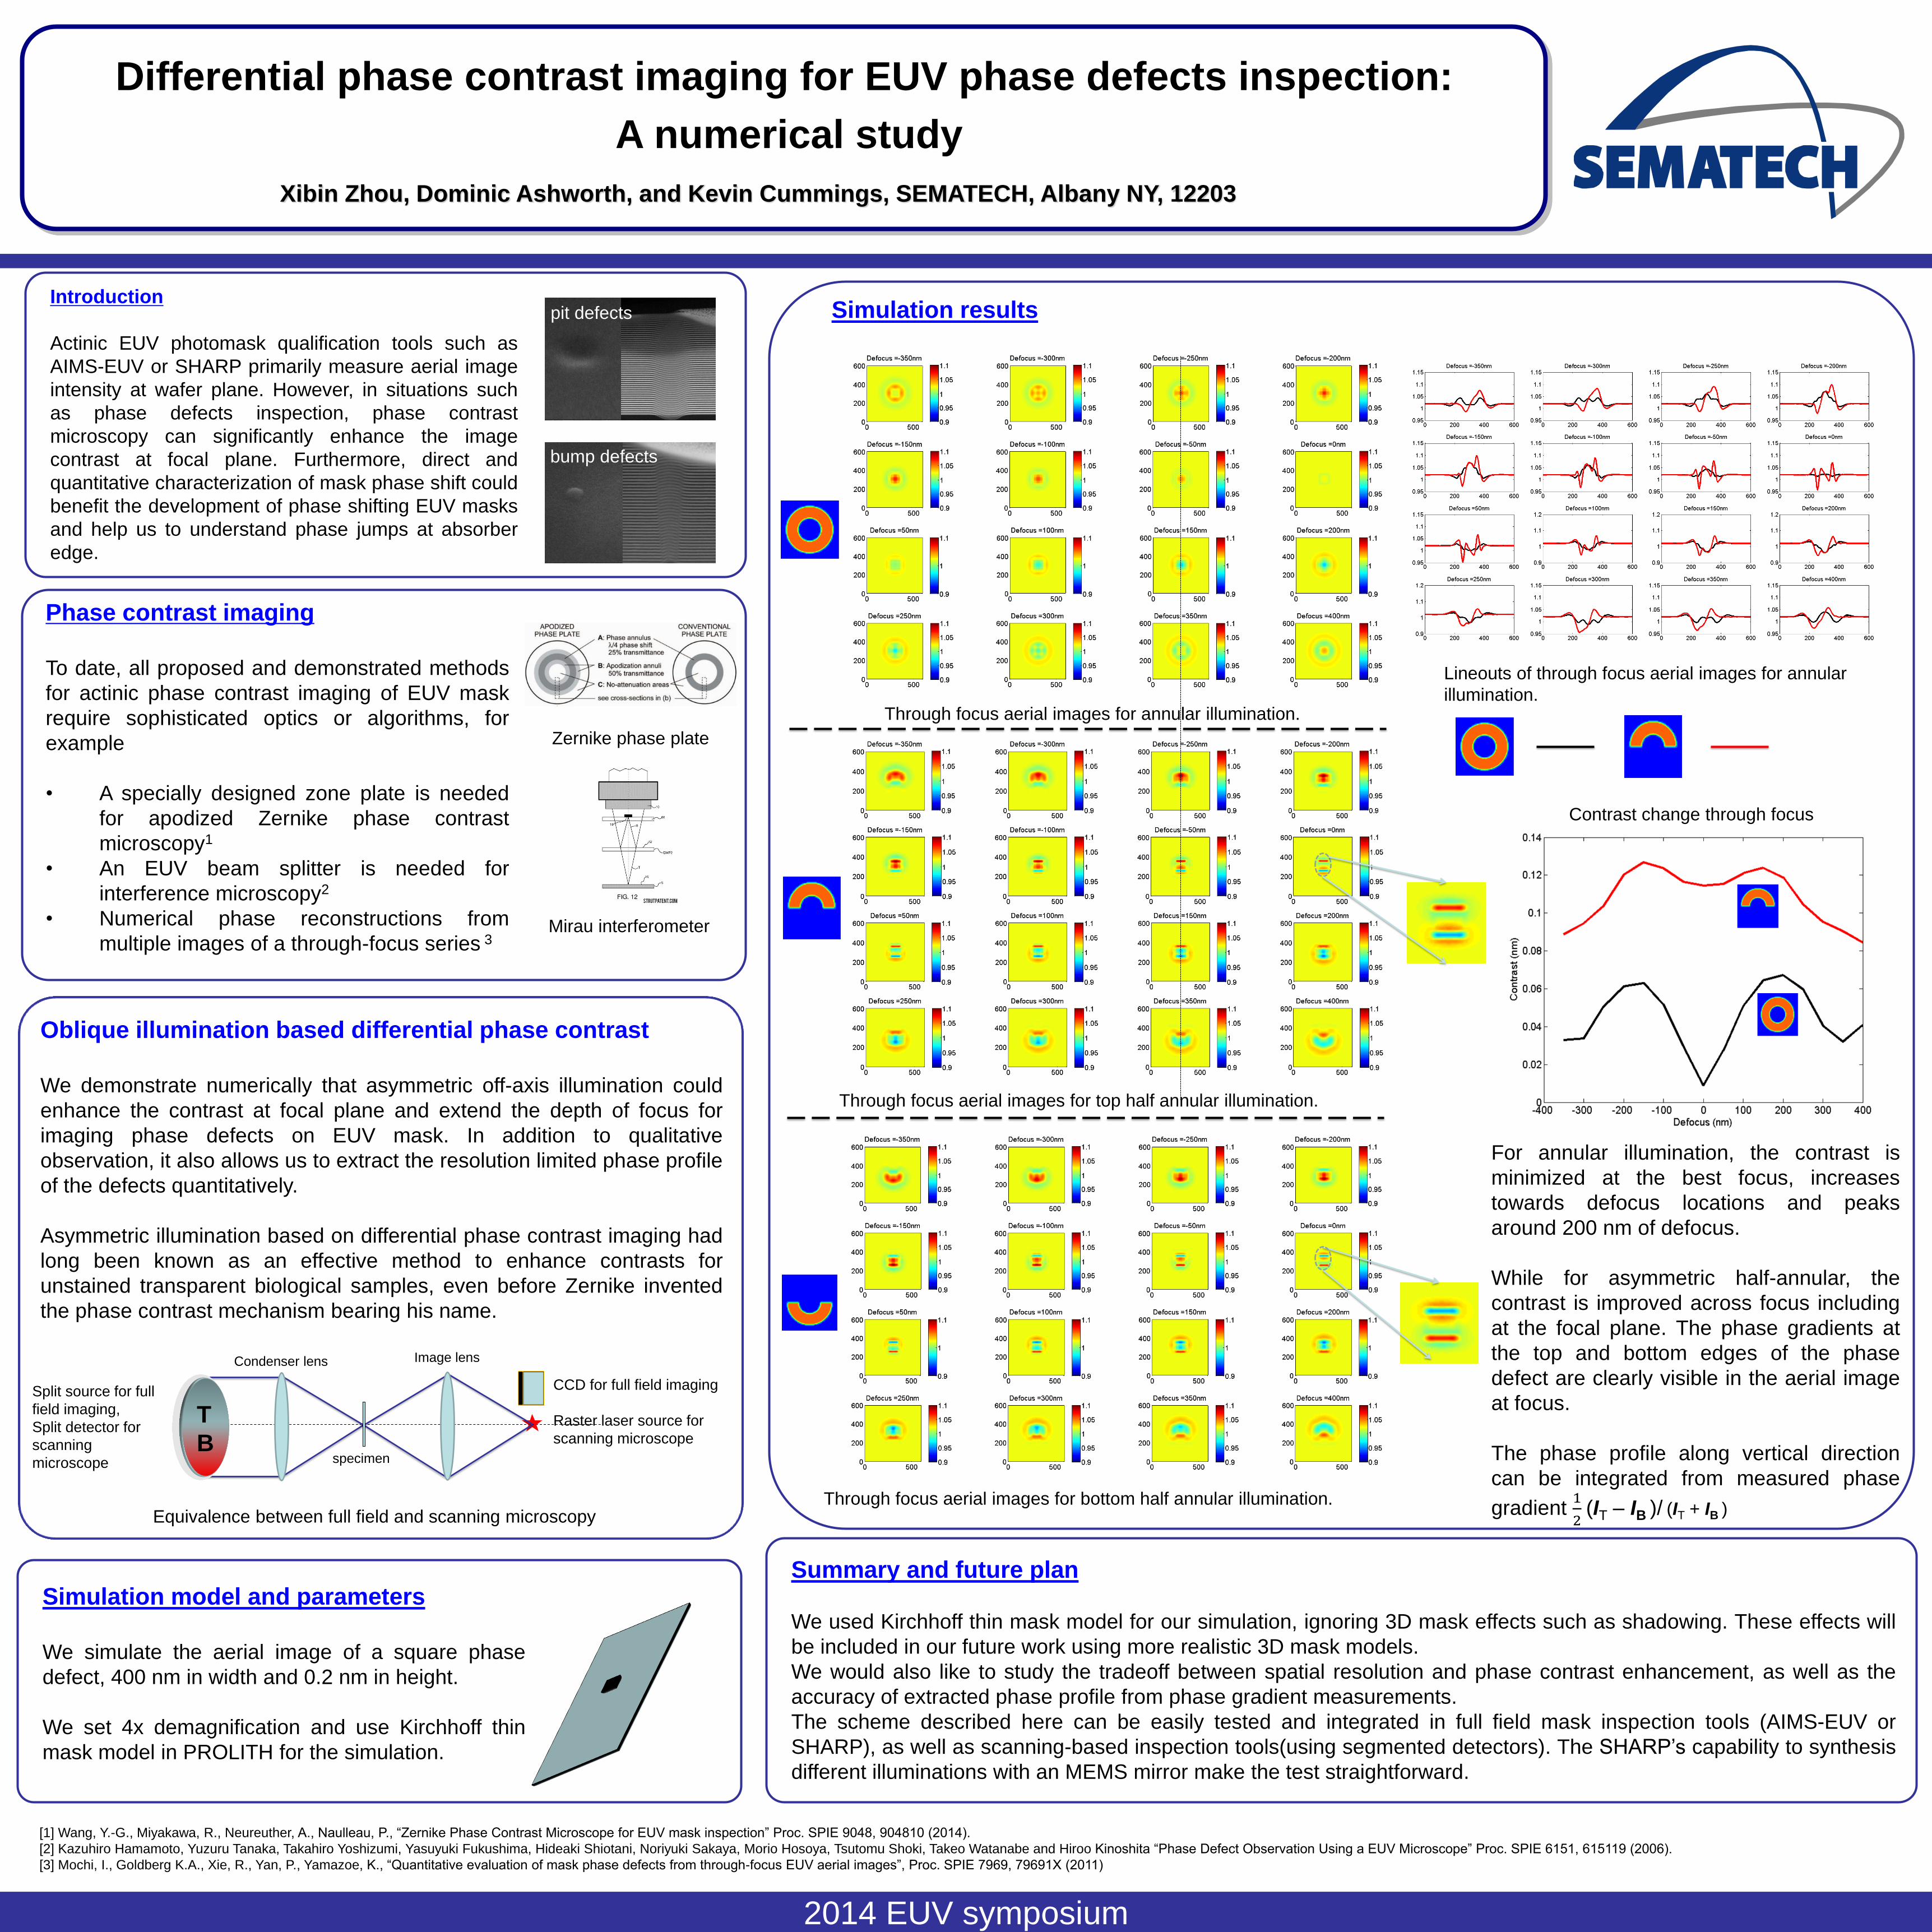
Differential phase contrast imaging for EUV phase defects inspection:
A numerical study
Xibin Zhou, Dominic Ashworth, and Kevin Cummings, SEMATECH, Albany NY, 12203
Introduction
Actinic EUV photomask qualification tools such as
AIMS-EUV or SHARP primarily measure aerial image
intensity at wafer plane. However, in situations such
as phase defects inspection, phase contrast
microscopy can significantly enhance the image
contrast at focal plane. Furthermore, direct and
quantitative characterization of mask phase shift could
benefit the development of phase shifting EUV masks
and help us to understand phase jumps at absorber
edge.
Oblique illumination based differential phase contrast
We demonstrate numerically that asymmetric off-axis illumination could
enhance the contrast at focal plane and extend the depth of focus for
imaging phase defects on EUV mask. In addition to qualitative
observation, it also allows us to extract the resolution limited phase profile
of the defects quantitatively.
Asymmetric illumination based on differential phase contrast imaging had
long been known as an effective method to enhance contrasts for
unstained transparent biological samples, even before Zernike invented
the phase contrast mechanism bearing his name.
Simulation results
Phase contrast imaging
To date, all proposed and demonstrated methods
for actinic phase contrast imaging of EUV mask
require sophisticated optics or algorithms, for
example
• A specially designed zone plate is needed
for apodized Zernike phase contrast
microscopy1
• An EUV beam splitter is needed for
interference microscopy2
• Numerical phase reconstructions from
multiple images of a through-focus series 3
Simulation model and parameters
We simulate the aerial image of a square phase
defect, 400 nm in width and 0.2 nm in height.
We set 4x demagnification and use Kirchhoff thin
mask model in PROLITH for the simulation.
Condenser lens Image lens
specimen
CCD for full field imaging
Raster laser source for
scanning microscope
Split source for full
field imaging,
Split detector for
scanning
microscope
bump defects
pit defects
Summary and future plan
We used Kirchhoff thin mask model for our simulation, ignoring 3D mask effects such as shadowing. These effects will
be included in our future work using more realistic 3D mask models.
We would also like to study the tradeoff between spatial resolution and phase contrast enhancement, as well as the
accuracy of extracted phase profile from phase gradient measurements.
The scheme described here can be easily tested and integrated in full field mask inspection tools (AIMS-EUV or
SHARP), as well as scanning-based inspection tools(using segmented detectors). The SHARP’s capability to synthesis
different illuminations with an MEMS mirror make the test straightforward.
[1] Wang, Y.-G., Miyakawa, R., Neureuther, A., Naulleau, P., “Zernike Phase Contrast Microscope for EUV mask inspection” Proc. SPIE 9048, 904810 (2014).
[2] Kazuhiro Hamamoto, Yuzuru Tanaka, Takahiro Yoshizumi, Yasuyuki Fukushima, Hideaki Shiotani, Noriyuki Sakaya, Morio Hosoya, Tsutomu Shoki, Takeo Watanabe and Hiroo Kinoshita “Phase Defect Observation Using a EUV Microscope” Proc. SPIE 6151, 615119 (2006).
[3] Mochi, I., Goldberg K.A., Xie, R., Yan, P., Yamazoe, K., “Quantitative evaluation of mask phase defects from through-focus EUV aerial images”, Proc. SPIE 7969, 79691X (2011)
Through focus aerial images for annular illumination.
Through focus aerial images for top half annular illumination.
Through focus aerial images for bottom half annular illumination.
Lineouts of through focus aerial images for annular
illumination.
Contrast change through focus
For annular illumination, the contrast is
minimized at the best focus, increases
towards defocus locations and peaks
around 200 nm of defocus.
While for asymmetric half-annular, the
contrast is improved across focus including
at the focal plane. The phase gradients at
the top and bottom edges of the phase
defect are clearly visible in the aerial image
at focus.
The phase profile along vertical direction
can be integrated from measured phase
gradient 1
2 (IT – IB )/ (IT + IB )
Zernike phase plate
Mirau interferometer
Equivalence between full field and scanning microscopy
T
B
Recommended