1
Developing Effective Financial Forecasts
ADDING VALUE TO YOUR BUSINESS.Moore Stephens IT Solutions
16 May 2018

2
Choo Kwong Chee (KC)
Background: 18 years of consulting experience helping clients
transform their business using technology
Current: Director, MS IT Solutions

3
Agus Tirtoredjo
Background: 20 years of consulting experience in ERP, IT Strategy,
Enterprise Architecture, Professional Services
Current: Director, MS IT Solutions

4
About MS IT Solutions (MSIT)
MSIT is an associate of Moore Stephens International
Limited, a leading accounting and consulting association
with member firms in principal cities throughout the world.

5
▪ Compare against plan
▪ Make course corrections
▪ Predictable performance
▪ All of the above
Poll: Why do you forecast?

6
Poll: How often do you forecast?
▪ Once a week
▪ Once a month
▪ Once a quarter
▪ Every 6 months to once a year

7
Companies with
forecasts that came
within 5% of actuals
saw a 46% increase in share
price over a 3-year
period
Source: KPMG
1 in 5 companies
currently produce a
forecast that is
reliabled
22%of forecasts
come in within
5% of actuals

8
A changing business landscape.A need for predictability demands better forecasts
Top-Line
Workforce
Expense
Cash Flow

9
Business Landscape
Marketing
Demand
Gen
MAS
Social
Events
Targets
Reporting
Capital
Financial
Statements
ERP
Finance
KPIs
Operations
Real Estate
Hosting
IT
Manufacturing
MRP
Quota
Pipeline
CRM
Comp
Plan
Partners
AgreementsRamped
Reps
SQL
Sales
Productivity
SQL
Coverage
ContractorsEmployees
HCM
Benefits
Hiring
TMS
HR
Executive
Dashboards
BI
Investor /
BOD Packs
Collaboration

10
Integrated Data
Comprehensive Models
Rolling Forecasts
Scenario Planning
4 Tips to Improve Forecasting
2
1
3
4

11
1. Integrated Data

12
A. ERP (NetSuite, Oracle, SAP, etc)
B. CRM (SFDC, Microsoft, NetSuite)
C. HCM (Workday, Oracle, Namely)
D. MAS (Eloqua, Marketo, HubSpot, etc)
E. Other (Proprietary database)
Poll: What systems do you access for your forecasts?

13
Just Not Enough Time
Data prep, waiting for data and assisting with
data reviews are other areas that slow
organizations down.
Accessing data is a top obstacle for accurate forecasts and predictive analytics in 35% of organizations.

14
A Centralized System to Deliver a Single Source of Truth
Eliminates confusion among competing data sets
Stops the debate over whose numbers are correct
Refocuses the leadership discussion towards insight and action
Enables a consistent view of data across the organization in real-time

15
2. Comprehensive Models

16
1. Income Statement
2. Balance Sheet
3. Cash Flow Statement
4. All of the above
Poll: How comprehensive is your forecast?

17
Integrated Model
Demand
Gen
Social
Events
Targets
Reporting
Capital
Financial
Statements
Real Estate
Hosting
IT
Manufacturing
Quota
Pipeline
Comp
Plan
Partners
Agreements
Ramped
Reps
Productivity
Coverage
Contractors
Employees
Benefits
Hiring
Dashboards
Investor /
BOD Packs
What-if
Growth
Competition
Currency
Investment
Reduction
KPIs

18
Collaborative Forecasting : Brainstorm with Business Partners
Continuous:
Use the right tools
Collaborative:
Get buy-in from
the top
Comprehensive:
Use Analytics to
identify metrics that
drive growth

19
3. Rolling Forecasts

20
Actual FcstActual Fcst Fcst Fcst Fcst Fcst Fcst Fcst Fcst Fcst
Actual Actual Fcst Fcst Fcst Fcst Fcst Fcst FcstActual Actual Actual
Actual Actual Fcst Fcst FcstActual Actual Actual Actual Actual Actual Actual
E
n
d
o
f
Y
e
a
r
“The Wall”
Actual Actual Actual Actual FcstActual Actual Actual Actual Actual Actual Actual
21
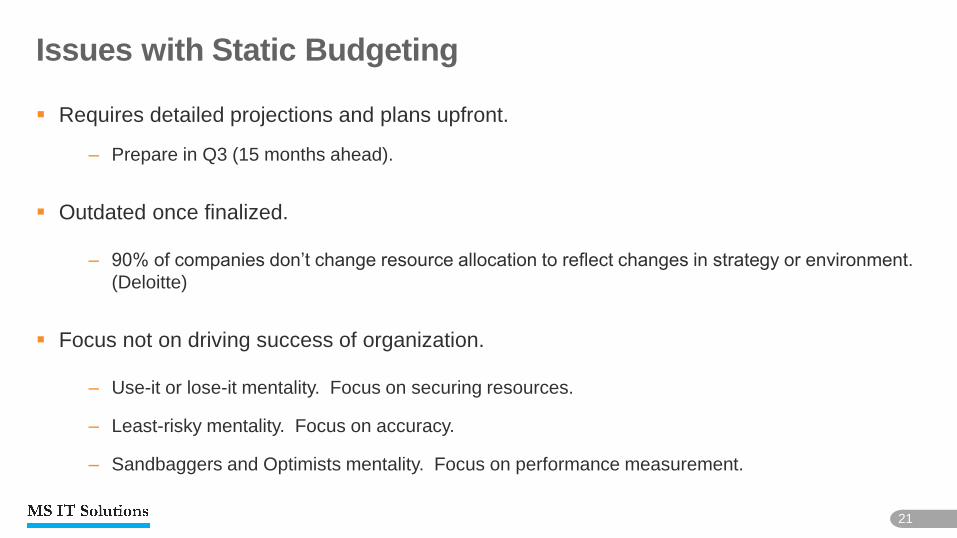
Issues with Static Budgeting
▪ Requires detailed projections and plans upfront.
– Prepare in Q3 (15 months ahead).
▪ Outdated once finalized.
– 90% of companies don’t change resource allocation to reflect changes in strategy or environment.
(Deloitte)
▪ Focus not on driving success of organization.
– Use-it or lose-it mentality. Focus on securing resources.
– Least-risky mentality. Focus on accuracy.
– Sandbaggers and Optimists mentality. Focus on performance measurement.

22
What is Rolling Forecast?

23
Benefits of Rolling Forecast
▪ IBM study:
– 12% more forecast accuracy
– 50% less budget preparation time
– 10% more profitable
▪ Maersk case study:
– Replaced budgeting process with rolling forecast.
– “Design criteria”
• Visibility: Forward looking
• Agility: Early identification and correction
• Control: Balance scorecard driven
• Simplicity: Removal of unnecessary details
Source: London FP&A Board

24
Defining the Forecasting Horizon
24
Horizon depends on industry.
▪ Align to business cycle.
▪ Look at least four to eight quarters past current quarter.
Guiding questions to determine horizon:
▪ What is the speed of change in my industry or business?
▪ How intensive are the capital requirements?
▪ How long does it take to bring facilities online? Months or Years?
▪ What are the lead times for our products?
▪ How long does it take to change supply contracts?
▪ What is involved in adjusting marketing programs (or other drivers of demand)?

25
•Part Driver based model
•Forecast as measurement
tool
•Two processes: Traditional
and Rolling
•Average level of detail
•Average collaboration
•Some predictive Analytics
•Partly automated processes
•Inflexible FP&A system
Rolling Forecast Maturity
▪ Enablers to adoption:
– Automated processes
– Driver-based model
– Analytics
– Collaboration
– Flexible FP&A system
“Attempting to do a rolling forecast
for a multimillion or multibillion-
dollar company in Excel is almost
impossible.”
Association of Financial Professionals
20% of companies abandon Rolling Forecast. Why?
Source: London FP&A Board
Basic
•Static model
•Two processes: Traditional
and Rolling
•High level of detail
•Basic collaboration
•Basic Analytics
•Manual processes
•Excel
Intermediate Advanced
•Driver based model
•Forecast as management
tool
•Rolling forecast replaces
Traditional Budget
•Simple and Agile process
•Good planning
collaboration
•Advanced Analytics
•Automated processes
•Flexible FP&A system
…because they are stuck at Basic level. Why?

26
Example in CPM tool

27
5 Steps to On Board Your Business with Rolling Forecasting
1. Model on Drivers, not details.
– Simplify for frequent forecasting.
– Select high-materiality, high-volatility items.
2. Use rolling forecasts to sound out multiple “what-if” scenarios.
– Best-case, worst-case, base-case
3. Delink from targets, measures or rewards.
– Objective forecasts based on real business demands and business environments.
4. Choose the right forecasting
horizon for your industry.
– Align to business cycles, not fiscal year.
– Look 4 to 8 quarters past current quarter.
5. Don’t attempt with Excel.
– Use a Corporate Performance
Management application.
– Provide management with clear, real-
time view of progress with Dashboards.

28
4. Scenario Planning

29
Planning for Multiple Futures
Source: Monitor Company Group

30
Why Scenario-Based Planning?
▪ To prepare organization for effects of multiple potential futures, so as to enable agile and timely
responses.
▪ To understand the impact of a key scenario (e.g. its impact on financials, targets, cash, funding, KPIs)
▪ Direct time toward more strategic activities, contingency planning
▪ Extent:
– Fundamental changes in strategy caused by global paradigm shifts
– Tactical contingency planning focused on possible near-term developments

31
1. Political
2. Economic
3. Social
4. Technological
5. Environmental
6. Legal
External Influences - PESTEL
Source: The Wall Street Journal

32
1. Supplier Power
2. Buyer Power
3. Competitive Rivalry
4. Threat of Substitution
5. Threat of New Entrant
External Influences – Porter’s Five Forces
Source: The Wall Street Journal

33
Identifying Patterns (Sets of Outcomes)

34
Deriving Scenarios
Source: Kees van der Heijden
Impact/Uncertainty Grid Scenario Matrix

35
▪ Manufacturing: Product cost increase, new factory opening
▪ Non-Profit: New program or service, increased funding
▪ SaaS: Bookings growth, collections, payables (to forecast cash)
▪ Services: New clients, new service lines
▪ Healthcare: Census (patient) level adjustments, capacity planning
▪ Holding Companies: Proposed acquisition
Scenario-Based Planning Examples

3636
• Outperformed peers by
10% on Revenue Growth
• Outperformed peers by
8% on Operating Margins
• Had more streamlined
decision making
Organizations using scenarios:
When Done Right, Benefits are Real
Financial Planning, Budgeting, and Forecasting: Removing the Hurdles, March 2013
Rolling Forecasts Enable Accuracy and Agile Business Planning, May 2013
Higher
Revenue
Growth
Higher
Operating
Margins
+8%+10 %

3737
• Lack of Process
• Systems and Technology
• Collaboration Challenges
Typical FP&A attempts at Scenario Analysis do not result in actionable to-do’s because of:
Despite the Benefits, Still a Minority Practice
Scenario Planning
64%
14
%
20%
Explore
relevant
scenarios
Don’t
explore
more than
1 scenario
36%2%
Explore
scenarios,
but not all
optionsDon’t Use
Do Use

38
▪ Typical steps:
Scenario Planning in CPM: 1) Corridor Planning
▪ Alternative outcomes of a “base case” scenario.
▪ What if key assumptions are slightly exceeded or missed?

39
▪ Look at scenarios on “and/or” basis.
Scenario Planning in CPM: 2) Combined Scenarios

40
▪ Create alternative scenarios that are interlinked where the only difference is the timing of
the event. Eg. Major acquisitions.
Scenario Planning in CPM:3) Delayed Scenarios

41
Example in CPM

42
Integrated Data
Comprehensive Models
Rolling Forecasts
Scenario Planning
4 Tips to Improve Forecasting
2
1
3
4

43
We Can Support Your Evolution
EnhancePlanning
OptimizeFinance
TransformPerformance
Automatic rollups
Fewer errors
Faster cycle times
Integrated actuals
Driver-based models
Full financial statements
Collaborative processes
KPIs & metrics
Companywide planning
Culture of analytics
Strategic scenarios
Business model evolution
Increase
Efficiency &
Accuracy
Improve
Processes &
Decisions
Create
Profound
Strategic Value

44
2
1
4
CONTACT US:
Agus Tirtoredjo Kwong Chee (KC)
[email protected] [email protected]
M: 91059374 M: 96924272

MS IT Solutions Pte. Ltd. is an associate of Moore Stephens International Limited, a leading
accounting and consulting association with member firms in principal cities throughout the
world.
About Moore Stephens globally
Since Moore Stephens London was founded a century ago, Moore Stephens International
Limited has grown to be one of the largest international accounting and consulting groups
worldwide. Today the network comprises 657 offices in 106 countries throughout the world,
incorporating 27,613 people and with fees of more than US$2.660 billion. You can be
confident that we have the resources and capabilities to meet your needs.
© 2018 MS IT Solutions Pte. Ltd.
Recommended