Embed Size (px)
Citation preview
Chapter 8
Inventory Management

Introduction
Chapter 8 - Inventory Management 3
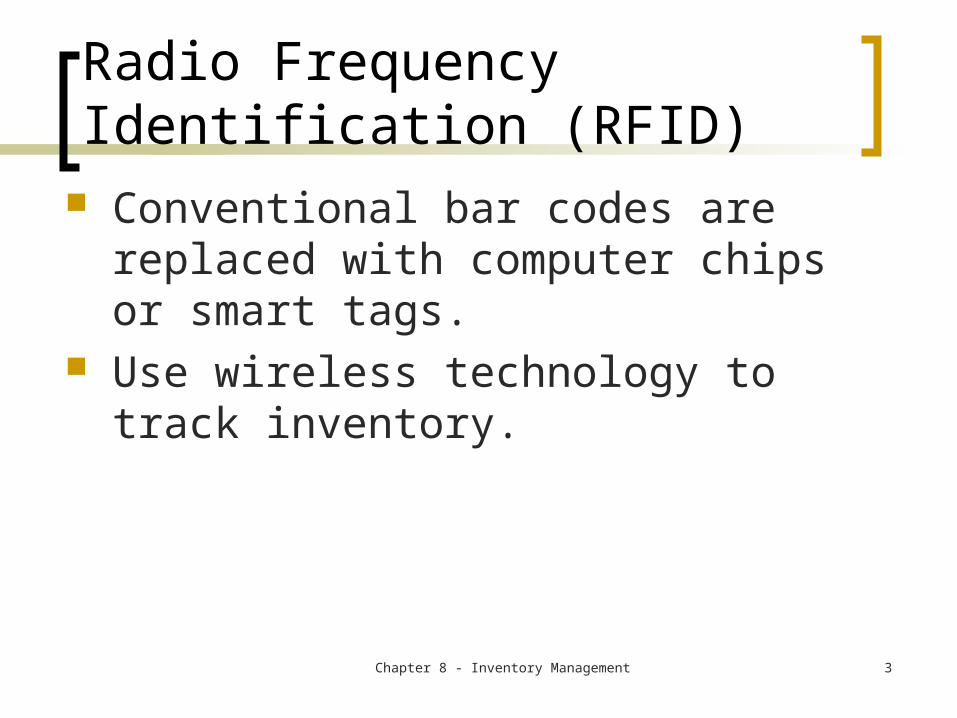
Radio Frequency Identification (RFID)
Conventional bar codes are replaced with computer chips or smart tags.
Use wireless technology to track inventory.
Chapter 8 - Inventory Management 4
Wal-Mart RFID Early adopter of RFID is Wal-Mart. By January 2005, 53 of its top 100
suppliers were sending RFID-tagged goods to its three distribution centers in the Dallas, Texas area.
Wal-Mart’s goal is to have all top 100 suppliers shipping RFID-tagged goods by the end of February 2005 in addition to 37 other suppliers.
Chapter 8 - Inventory Management 5
Wal-Mart RFID continued The impetus for Wal-Mart’s investment in
RFID was the lack of visibility it had into its backroom storage areas.
The major drawback to RFID is its cost. In 2005, the cost of smart tags was
$0.25 each if purchased in volume, and $0.75 if purchased in smaller quantities.
The stated goal in the industry is to get the price of smart tags down to $.05
Chapter 8 - Inventory Management 6
Vendor-Managed Inventory (VMI) With VMI, suppliers are given
responsibility for managing the inventory carried by their retail or wholesale customers.
Rich Products, a $2 billion family-owned food company headquartered in Buffalo, NY, has a partnership with IBM to provide VMI services to the grocery industry for its frozen food items.
General Considerations
Chapter 8 - Inventory Management 8
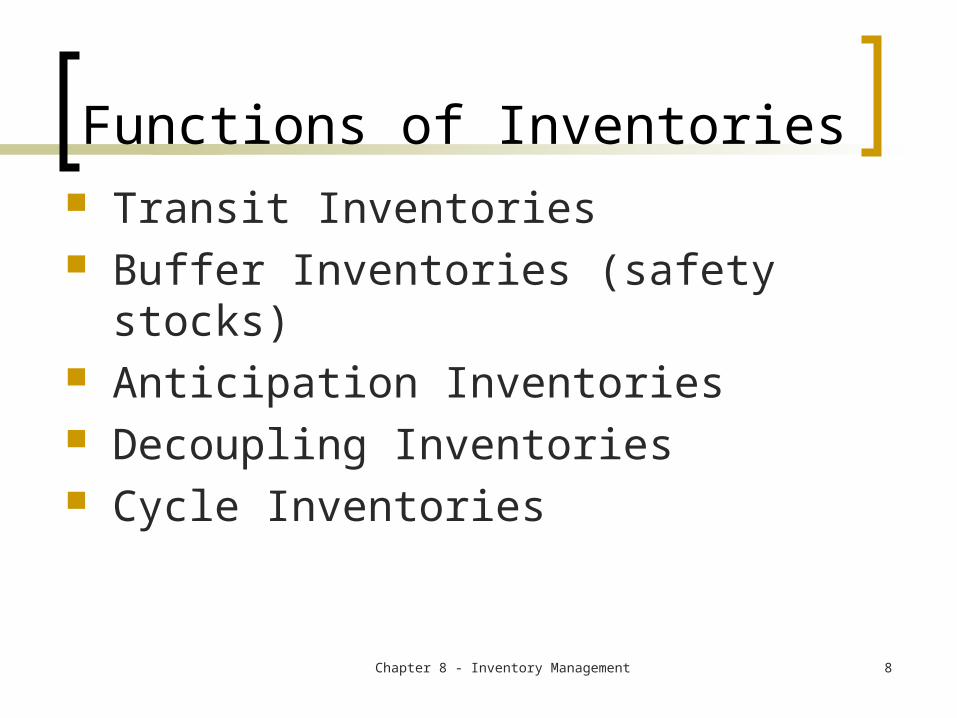
Functions of Inventories Transit Inventories Buffer Inventories (safety stocks) Anticipation Inventories Decoupling Inventories Cycle Inventories
Chapter 8 - Inventory Management 9
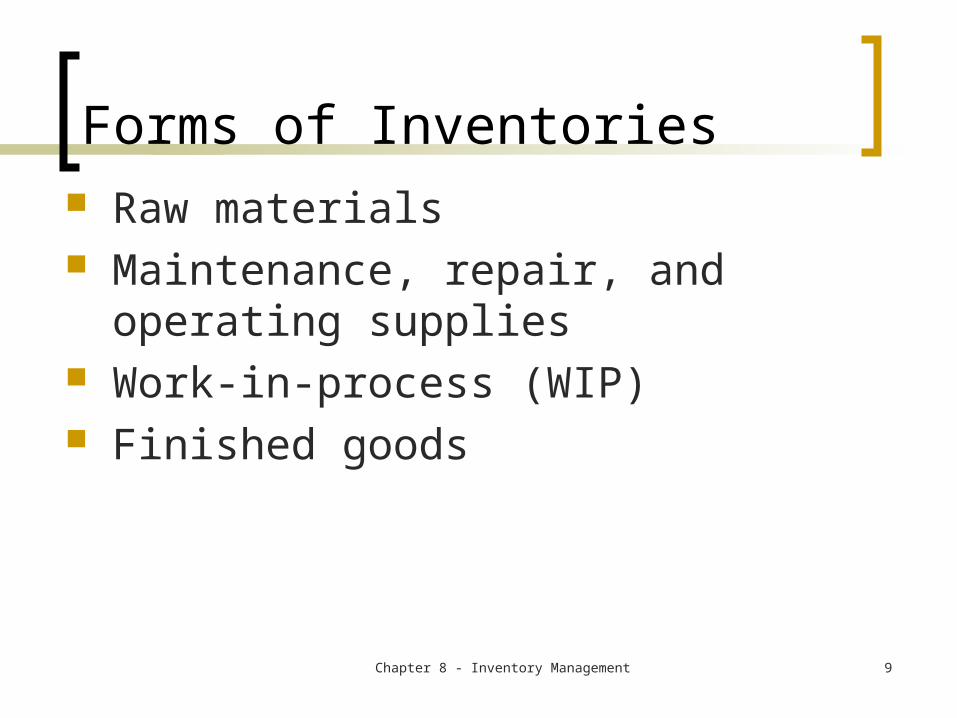
Forms of Inventories Raw materials Maintenance, repair, and operating
supplies Work-in-process (WIP) Finished goods
Chapter 8 - Inventory Management 10
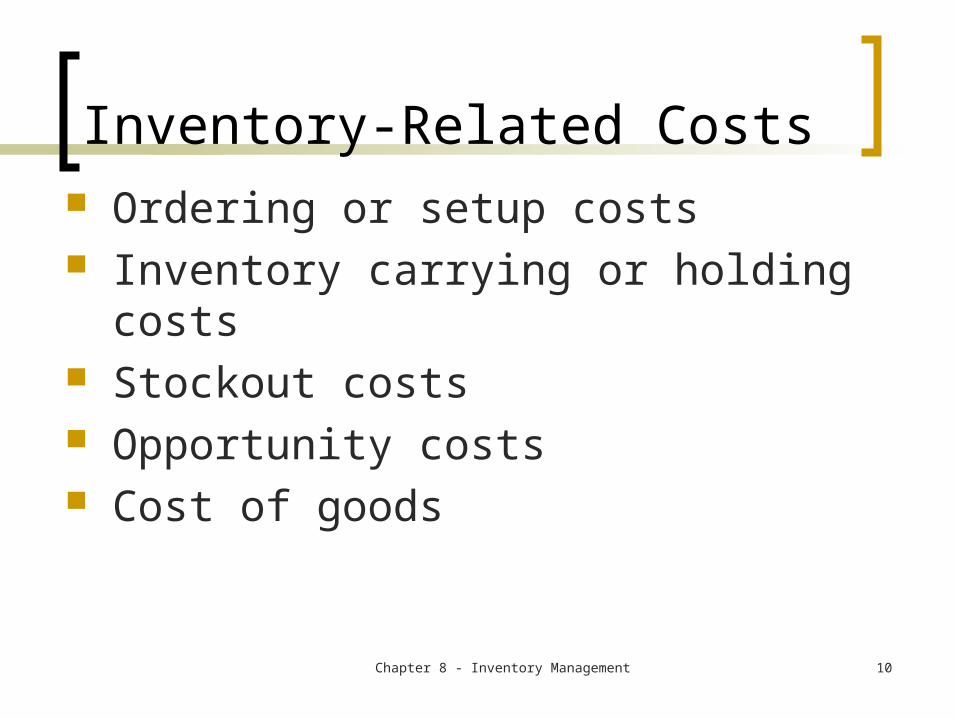
Inventory-Related Costs Ordering or setup costs Inventory carrying or holding costs Stockout costs Opportunity costs Cost of goods
Chapter 8 - Inventory Management 11
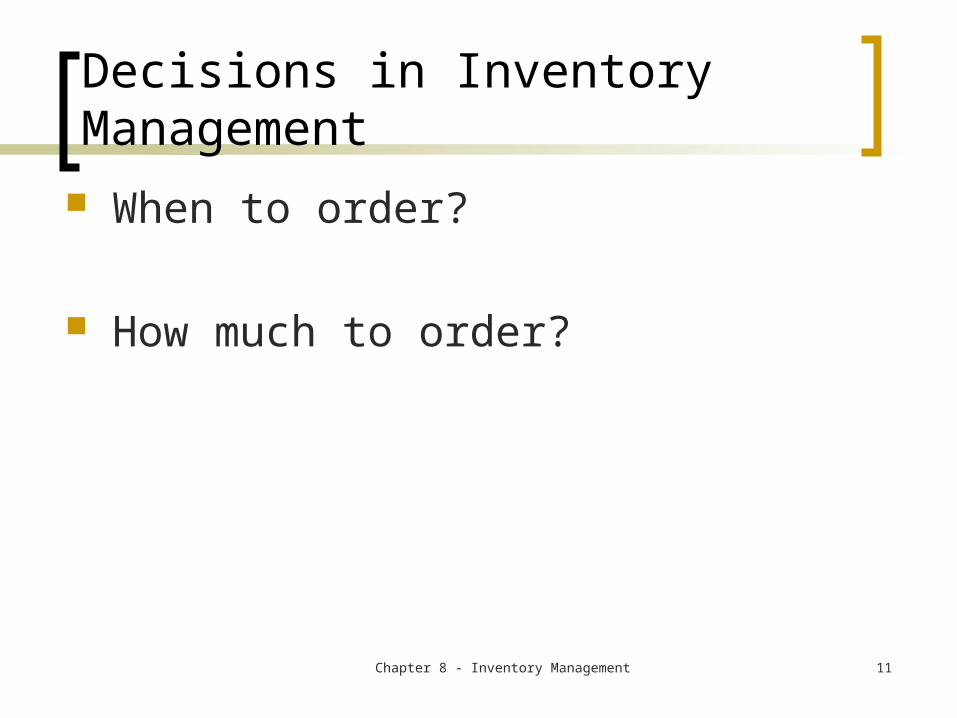
Decisions in Inventory Management
When to order?
How much to order?
Chapter 8 - Inventory Management 12
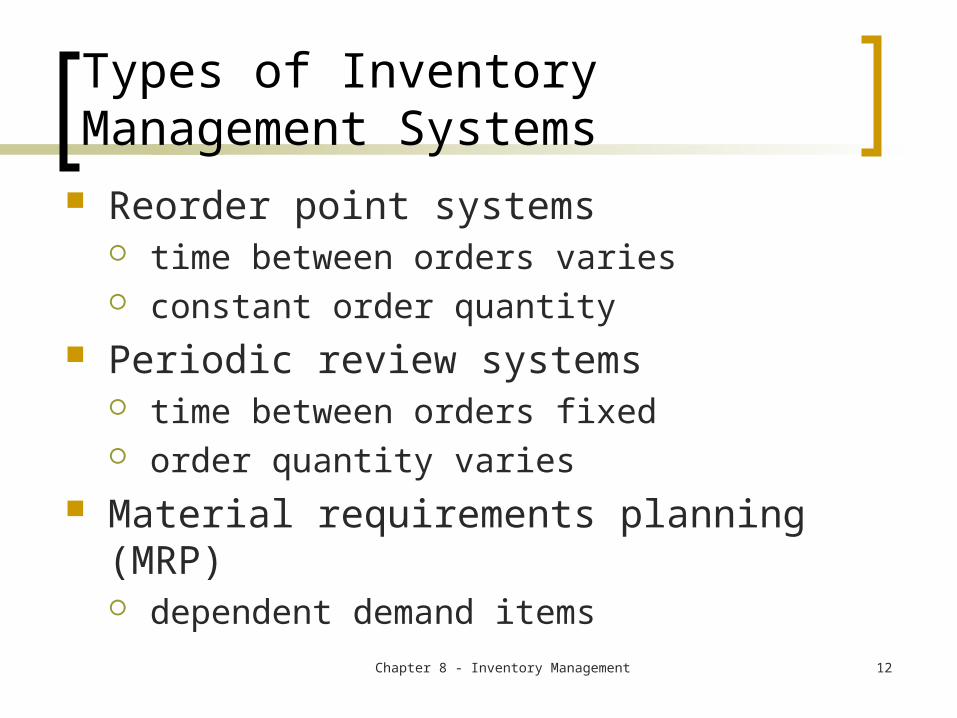
Types of Inventory Management Systems
Reorder point systems time between orders varies constant order quantity
Periodic review systems time between orders fixed order quantity varies
Material requirements planning (MRP) dependent demand items
Chapter 8 - Inventory Management 13
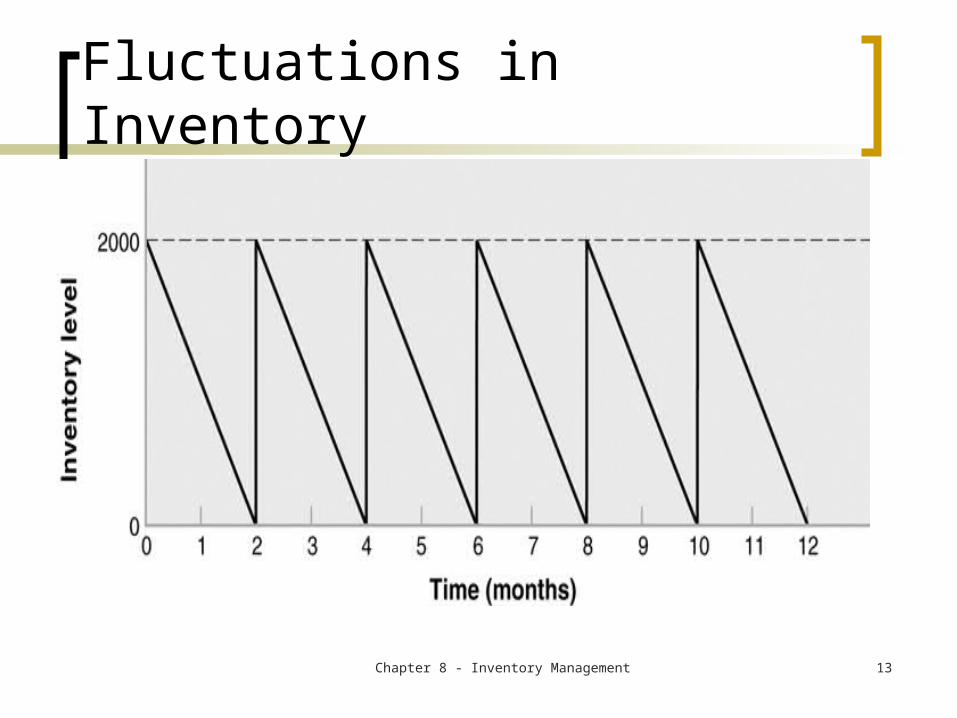
Fluctuations in Inventory
Chapter 8 - Inventory Management 14
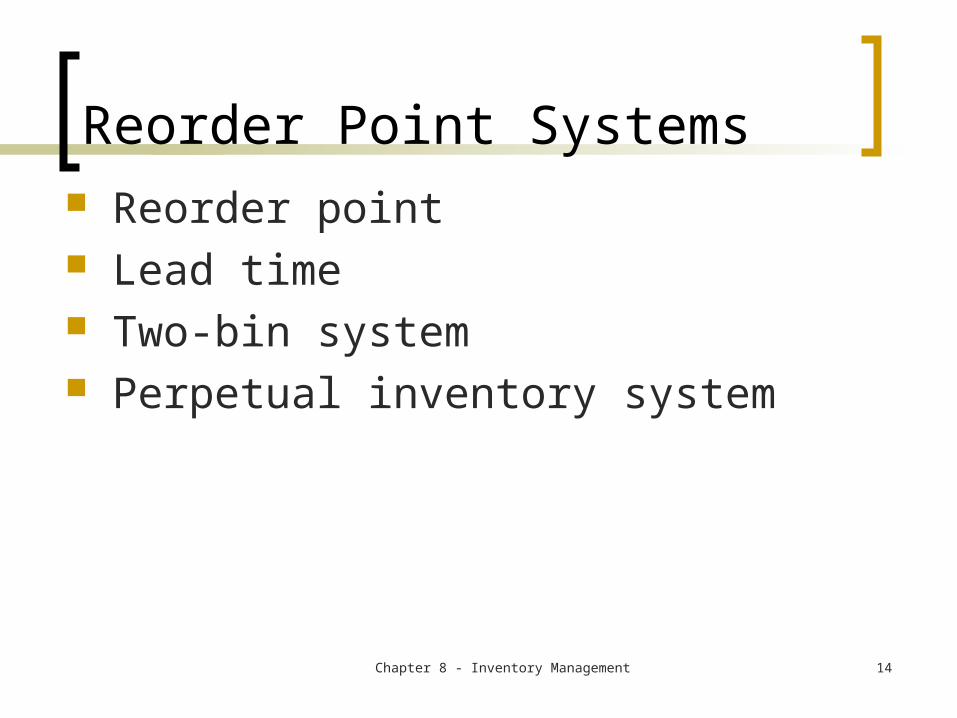
Reorder Point Systems Reorder point Lead time Two-bin system Perpetual inventory system
Chapter 8 - Inventory Management 15
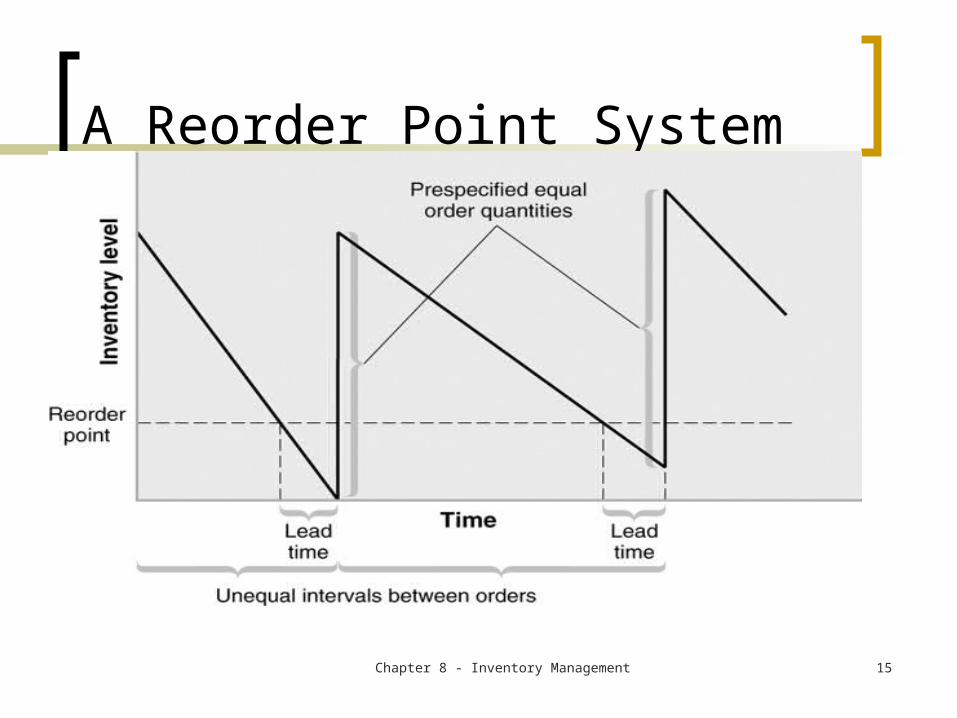
A Reorder Point System
Chapter 8 - Inventory Management 16
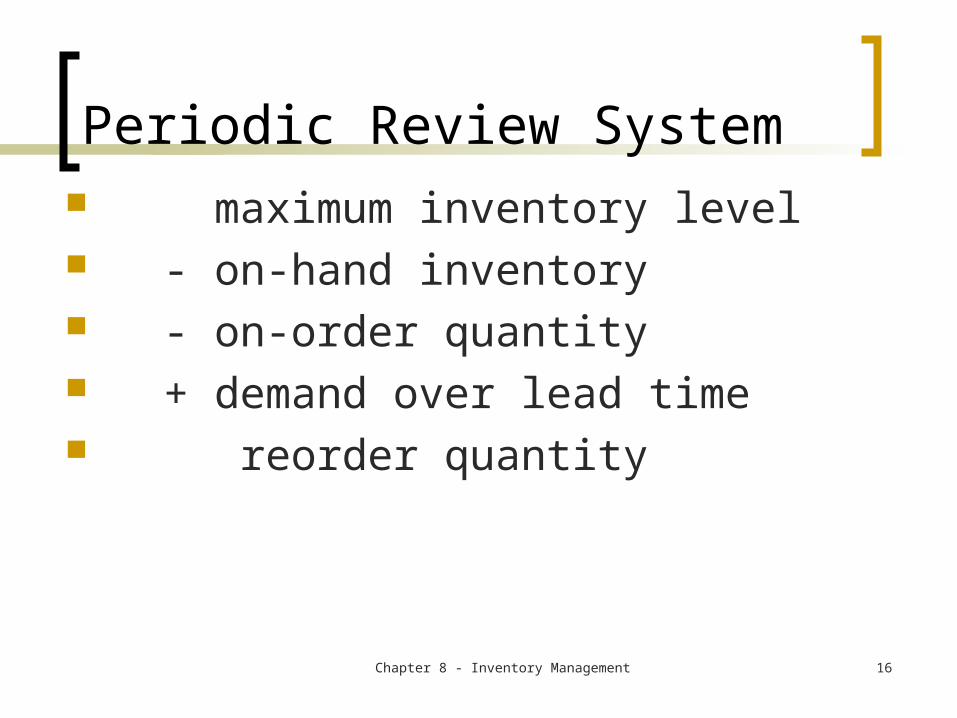
Periodic Review System maximum inventory level - on-hand inventory - on-order quantity + demand over lead time reorder quantity
Chapter 8 - Inventory Management 17
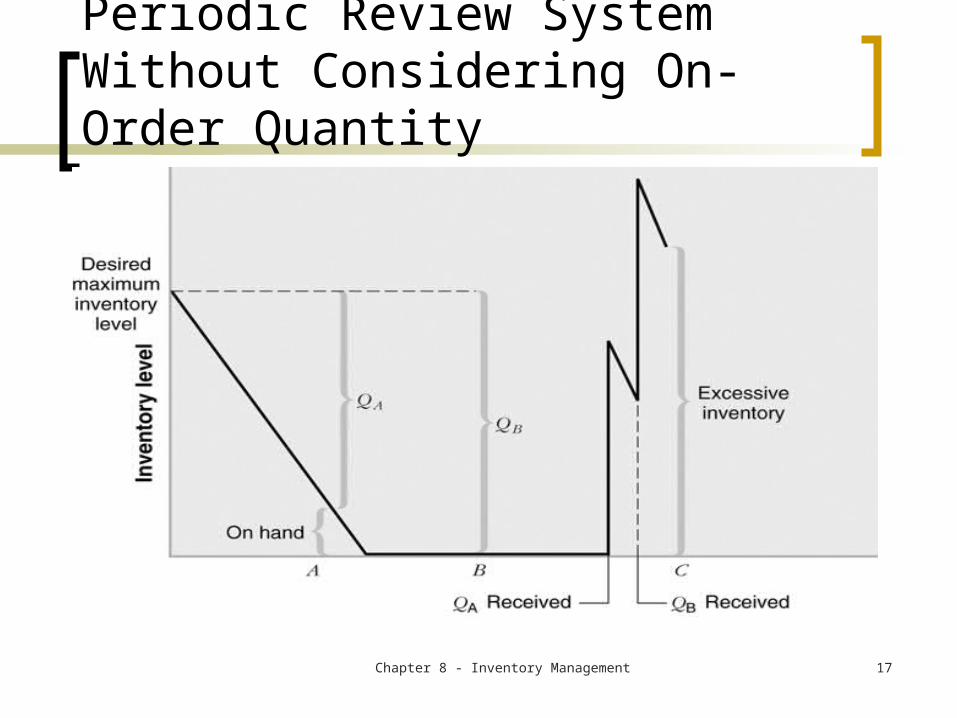
Periodic Review System Without Considering On-Order Quantity
Chapter 8 - Inventory Management 18
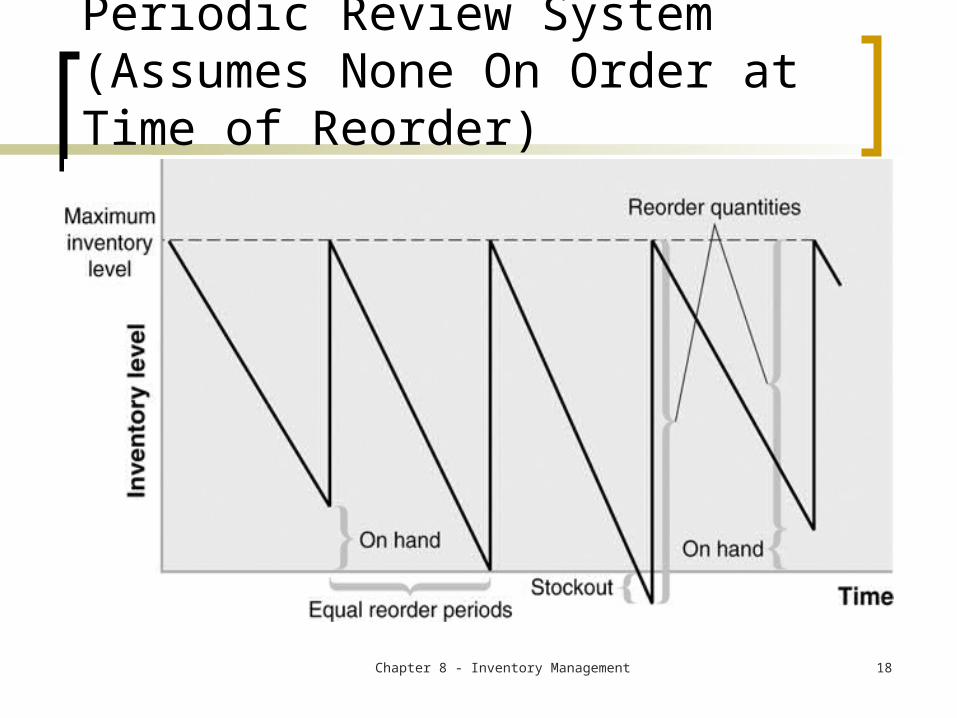
Periodic Review System (Assumes None On Order at Time of Reorder)
Chapter 8 - Inventory Management 19
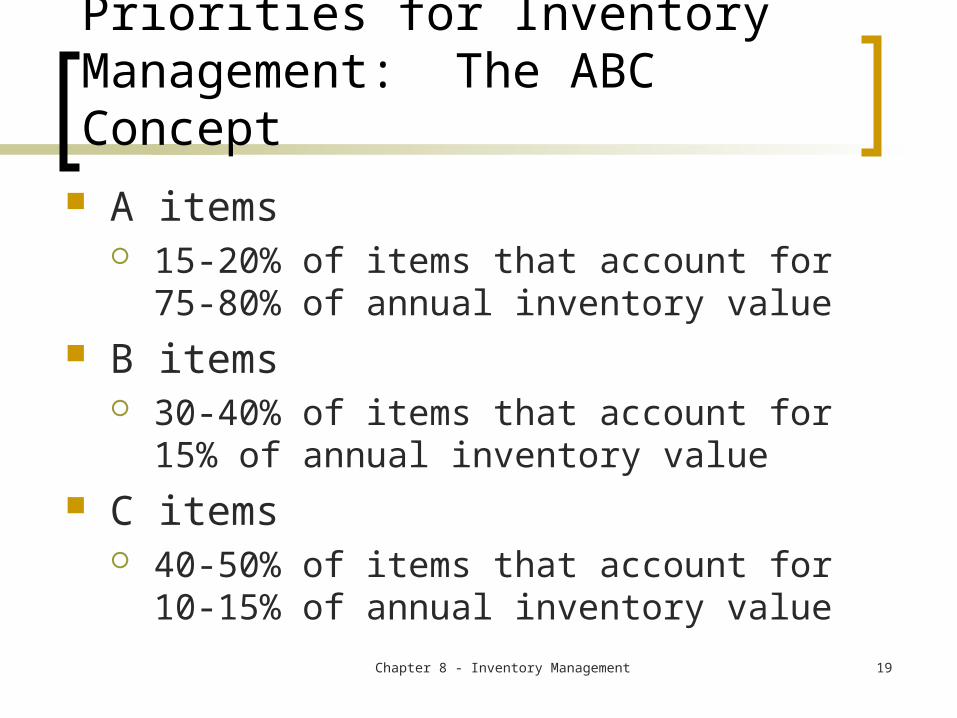
Priorities for Inventory Management: The ABC Concept
A items 15-20% of items that account for 75-80% of
annual inventory value B items
30-40% of items that account for 15% of annual inventory value
C items 40-50% of items that account for 10-15% of
annual inventory value
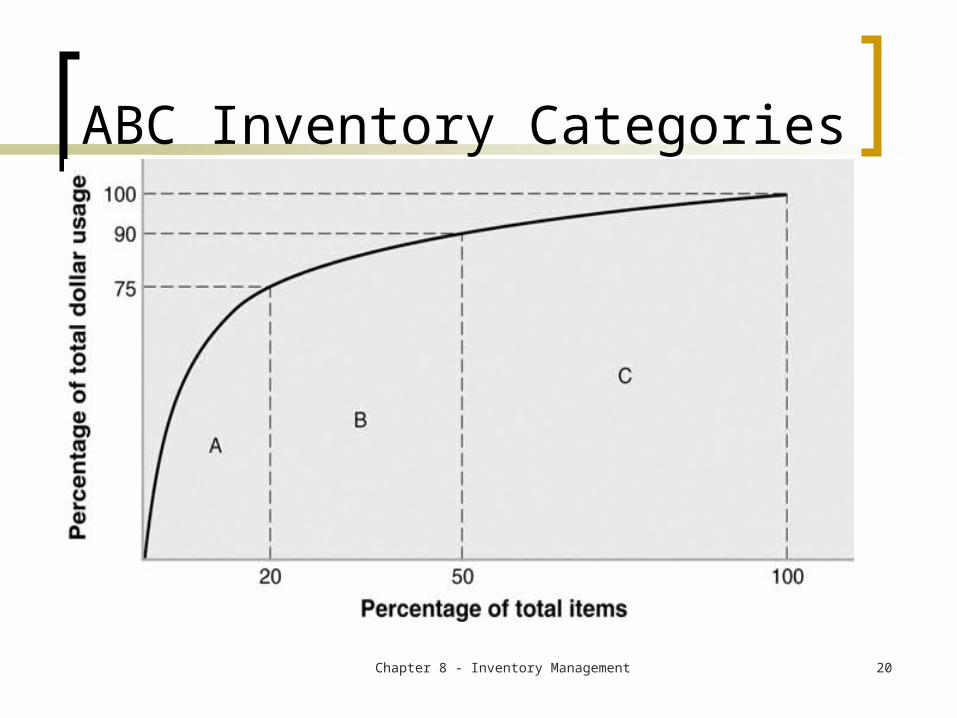
Chapter 8 - Inventory Management 20
ABC Inventory Categories
The Economic Order Quantity (EOQ)
Chapter 8 - Inventory Management 22
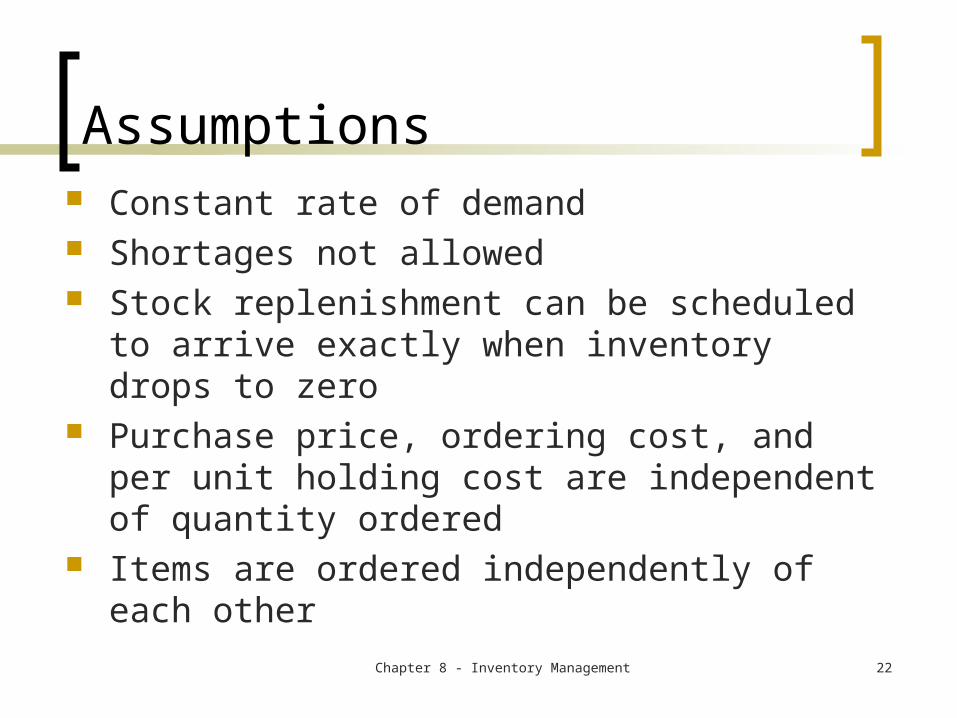
Assumptions Constant rate of demand Shortages not allowed Stock replenishment can be scheduled to
arrive exactly when inventory drops to zero Purchase price, ordering cost, and per unit
holding cost are independent of quantity ordered
Items are ordered independently of each other
Chapter 8 - Inventory Management 23
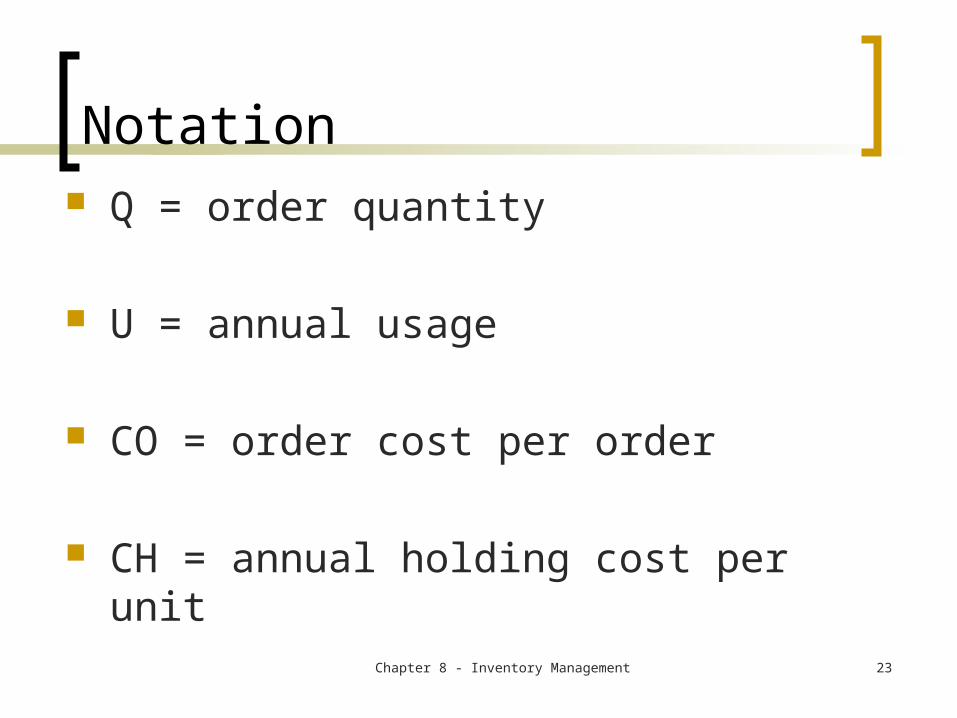
Notation Q = order quantity
U = annual usage
CO = order cost per order
CH = annual holding cost per unit

Chapter 8 - Inventory Management 24
Water Distributor’s Inventory Pattern
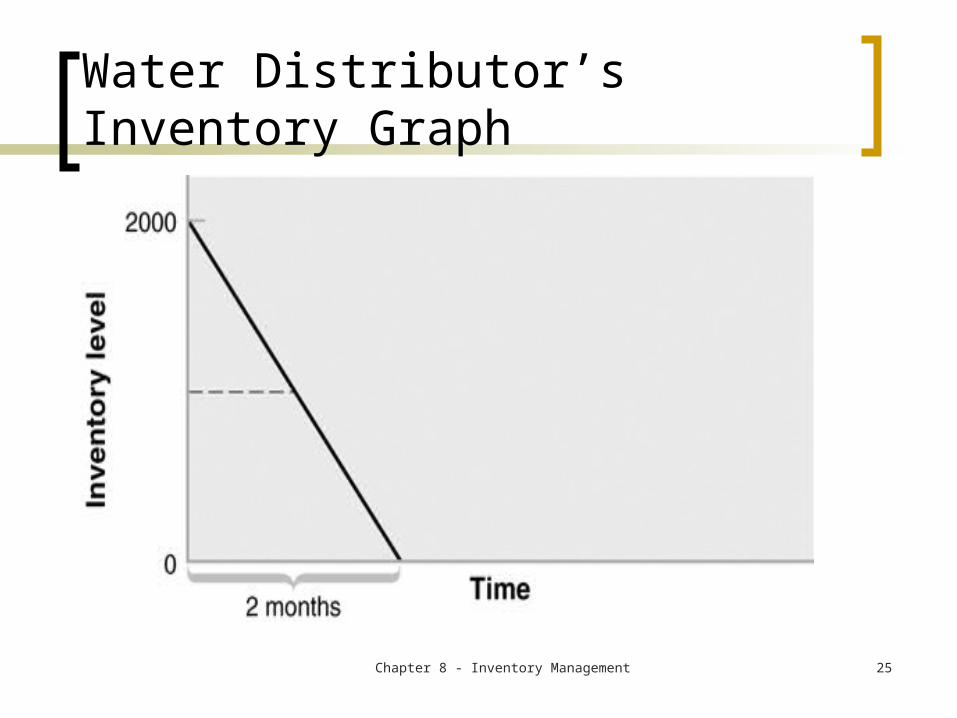
Chapter 8 - Inventory Management 25
Water Distributor’s Inventory Graph
Chapter 8 - Inventory Management 26
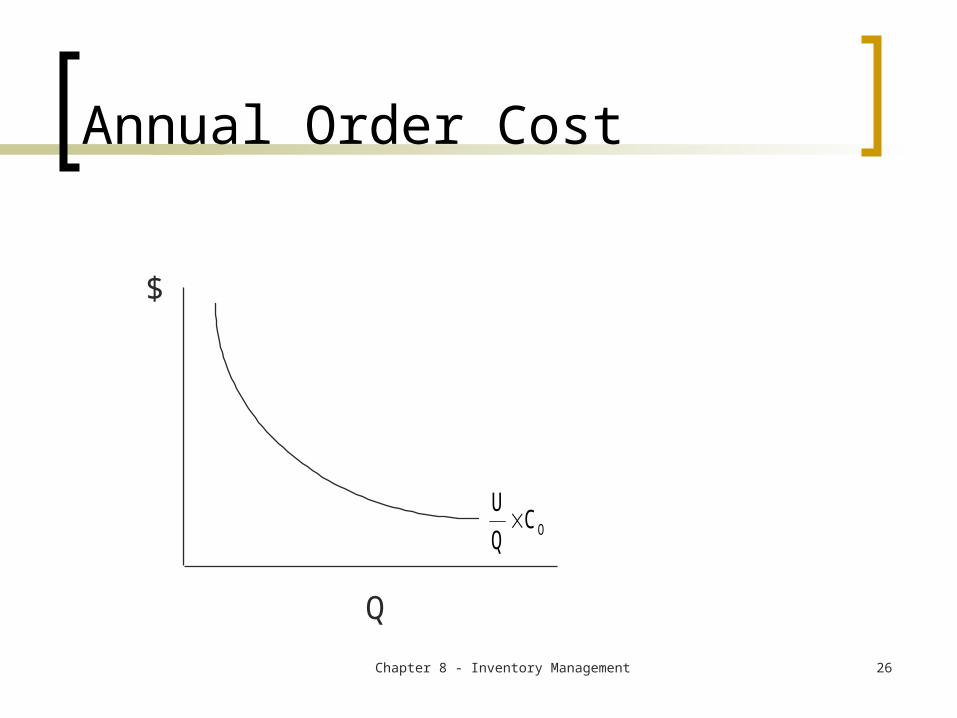
Annual Order Cost
$
Q
U
QCO
Chapter 8 - Inventory Management 27
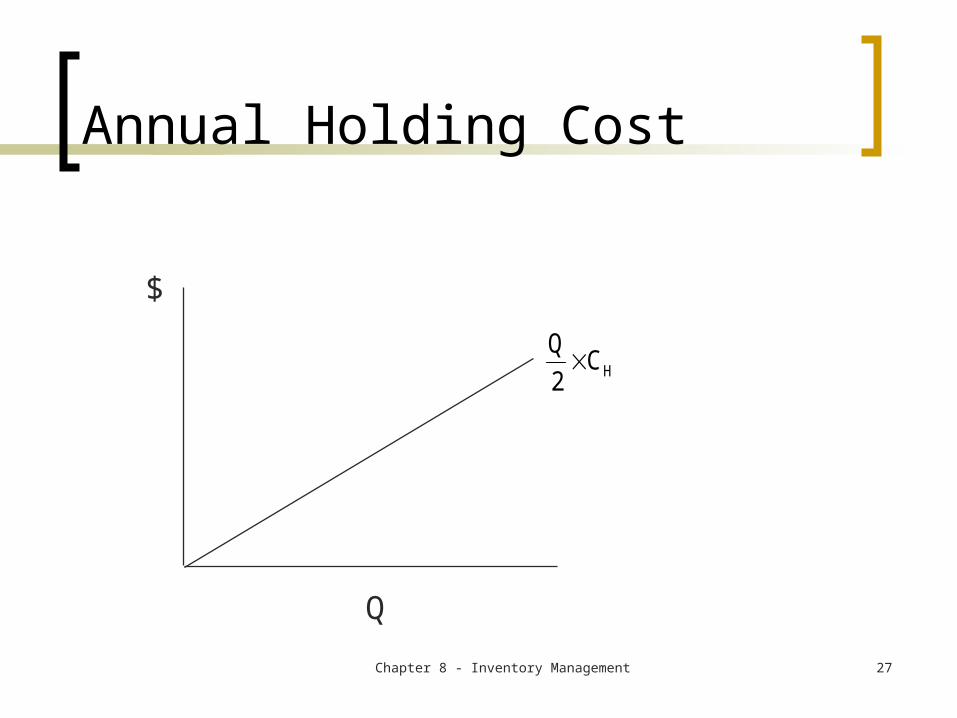
Annual Holding Cost
$
Q
HC 2
Q
Chapter 8 - Inventory Management 28
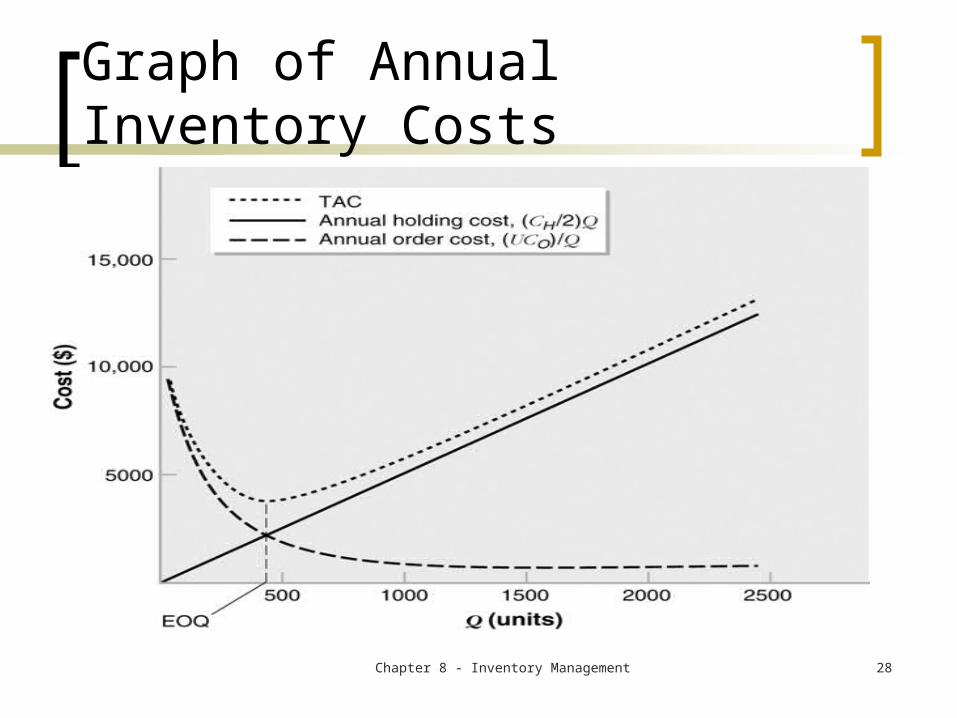
Graph of Annual Inventory Costs
Chapter 8 - Inventory Management 29
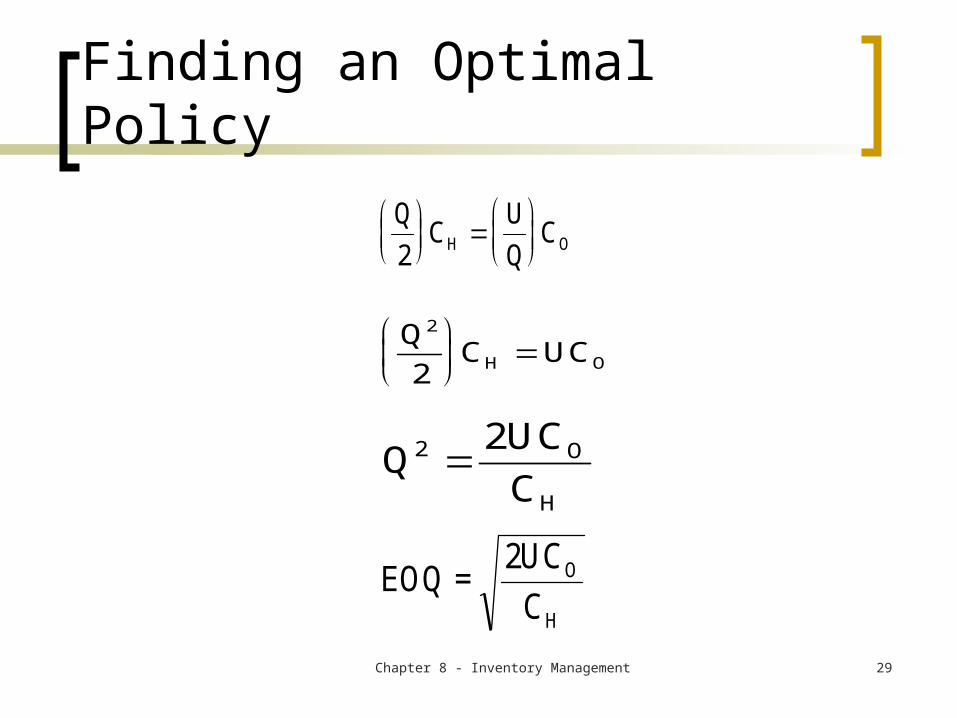
Finding an Optimal Policy
Q
2C
U
QCH O
Q
2C UC
2
H O
QUC
C2 O
H
2
EOQ =2UC
CO
H
Chapter 8 - Inventory Management 30
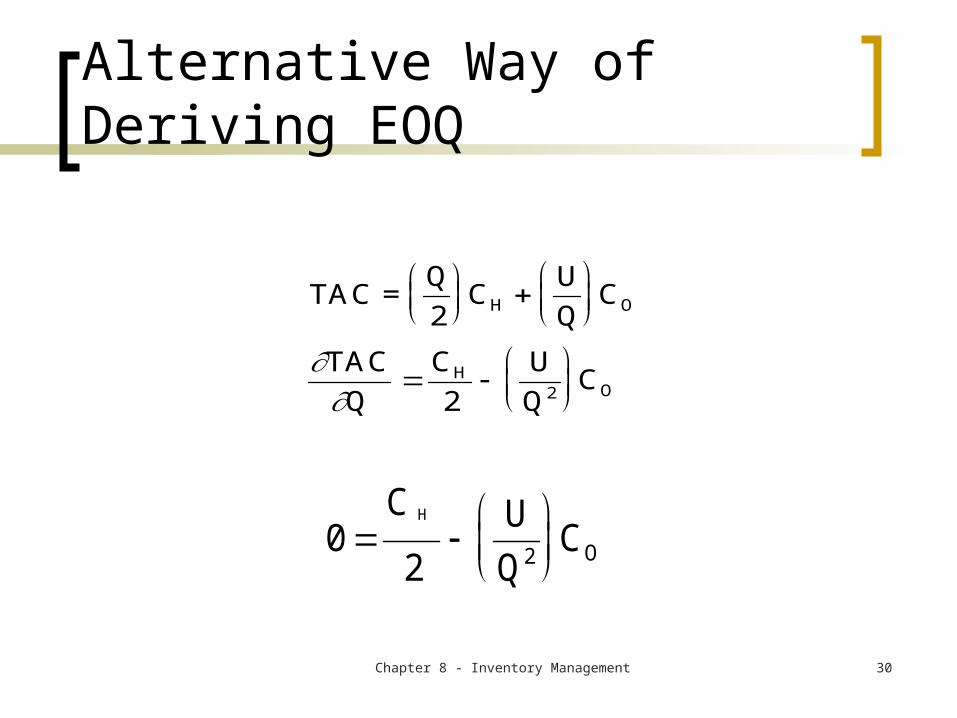
Alternative Way of Deriving EOQ
TAC =Q
2C
U
QC
TAC
Q
C
2
U
QC
H O
H2 O
0
C
2
U
QC
H
2 O
Chapter 8 - Inventory Management 31
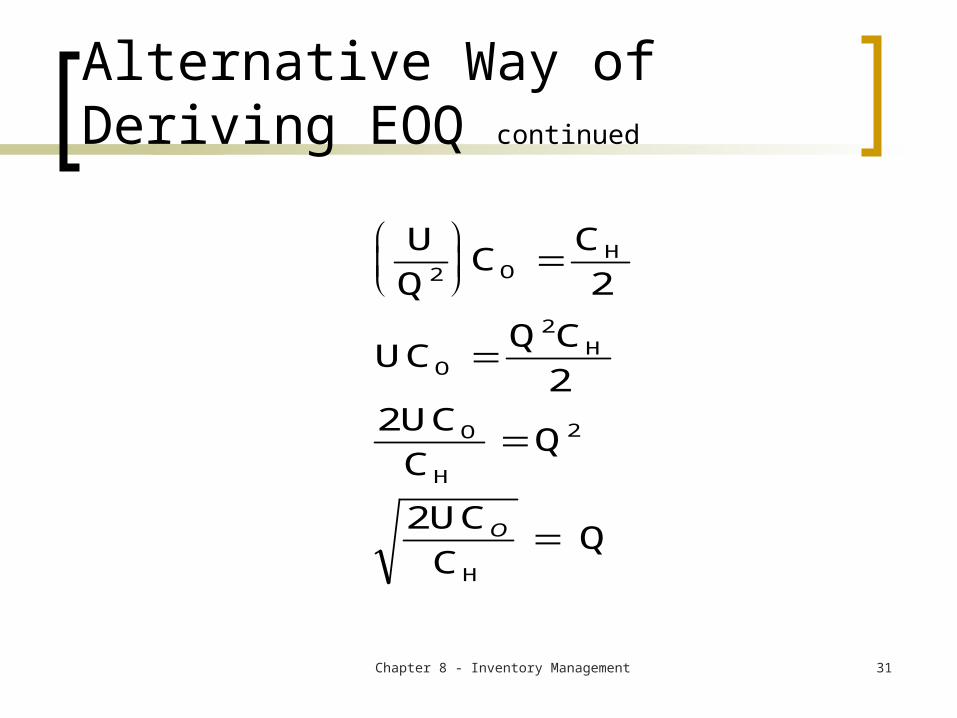
Alternative Way of Deriving EOQ continued
U
QC
C
2
UCQ C
2UC
CQ
UC
C Q
2 OH
O
2H
O
H
2
H
2
2 O
Chapter 8 - Inventory Management 32
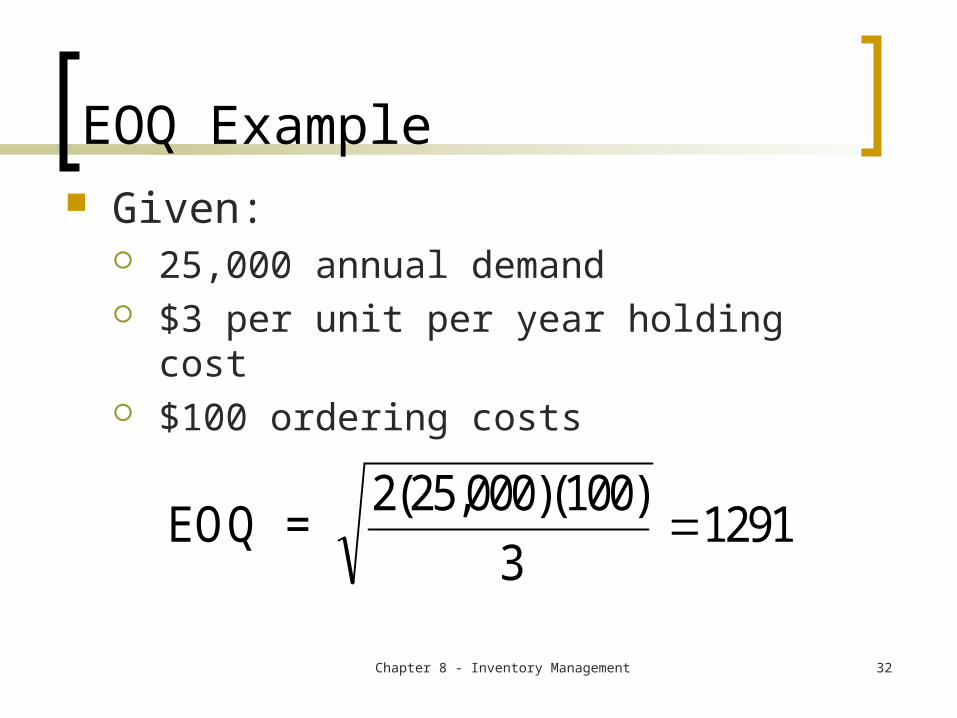
EOQ Example Given:
25,000 annual demand $3 per unit per year holding cost $100 ordering costs
EOQ = 2(25,000)(100)
31291

Chapter 8 - Inventory Management 33
Cautions Regarding EOQ GIGO Exclude “sunk” costs Very small EOQ values my not be valid
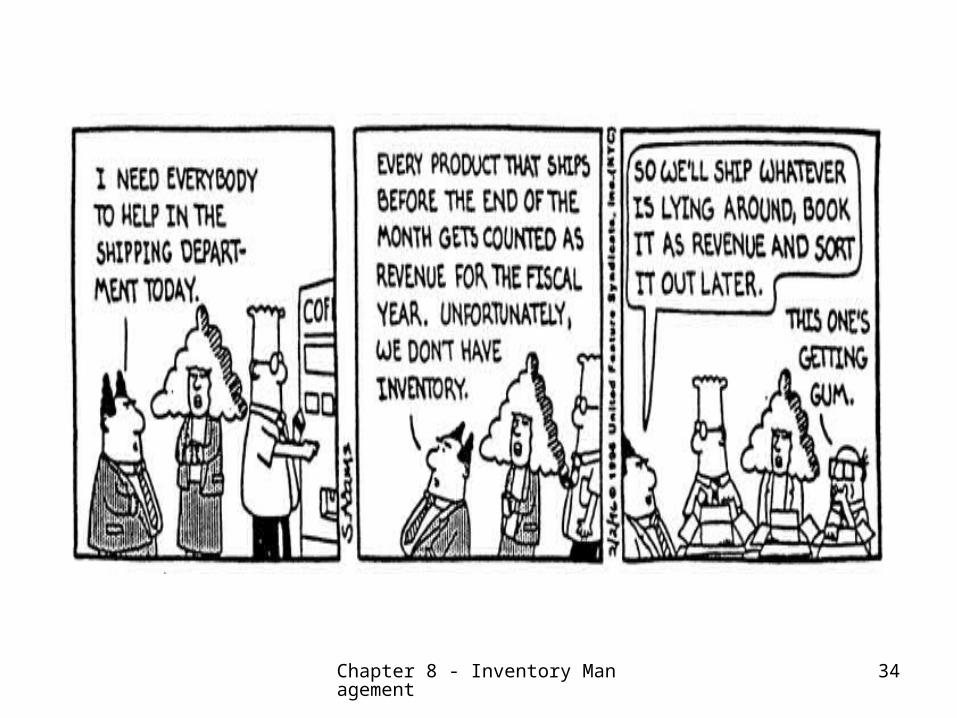
Chapter 8 - Inventory Management
34